Embed Size (px)
Citation preview

Annual Report 2015 | 16
Annual Report 2015 | 16 dtf.vic.gov.au
An
nu
al R
epo
rt 2015
| 16
9375 DTF 2014_2015_annual_report_cover_FA2.indd 1-3 28/10/2015 3:58 pm
Department of Treasury and Finance
De
pa
rtme
nt o
f Tre
asu
ry a
nd
Fin
an
ce

The Secretary Department of Treasury and Finance 1 Treasury Place Melbourne Victoria 3002 Australia
Telephone: +61 3 9651 5111 Facsimile: +61 3 9651 2062 Website: dtf.vic.gov.au
Authorised by the Victorian Government 1 Treasury Place, Melbourne, 3002
Printed by On Demand, Port Melbourne
Printed on recycled paper
© State of Victoria 2016
This work, Department of Treasury and Finance 2015 | 16 Annual Report, is licensed under a Creative Commons Attribution 4.0 licence. You are free to re-use the work under that licence, on the condition that you credit the State of Victoria as author. The licence does not apply to any images, photographs or branding, including the Victorian Coat of Arms, the Victorian Government logo and the Department of Treasury and Finance logo.
Copyright queries may be directed to [email protected]
ISSN 1325 1775
Published October 2016
If you would like to receive this publication in an accessible format, please telephone 03 9651 0909 or email [email protected]
This document is also available in PDF and Word format at dtf.vic.gov.au
9375 DTF 2014_2015_annual_report_cover_FA2.indd 4-6 28/10/2015 3:58 pm

Department of Treasury and Finance Annual Report 2015 | 16 i
Contents
About DTF ............................................................................................................................. 1
Report of operations ............................................................................................................. 9
Financial statements .......................................................................................................... 43
Appendices ....................................................................................................................... 114
Appendix 1 Disclosure index ............................................................................................. 115 Appendix 2 Workforce data ............................................................................................... 117 Appendix 3 DTF occupational health and safety report 30 June 2016 ............................... 126 Appendix 4 Environmental reporting ................................................................................. 131 Appendix 5 Community Support Fund ............................................................................... 139 Appendix 6 Consultancies and major contracts ................................................................. 140 Appendix 7 Disclosure of government advertising expenditure ......................................... 141 Appendix 8 Disclosure of Information and Communication Technology expenditure ......... 142 Appendix 9 Freedom of Information .................................................................................. 143 Appendix 10 Application of Protected Disclosure Act .......................................................... 144 Appendix 11 Compliance with the Building Act 1993 ........................................................... 146 Appendix 12 National Competition Policy ............................................................................ 148 Appendix 13 Implementation of the Victorian Industry Participation Policy .......................... 149 Appendix 14 Legislation administered by DTF portfolios ..................................................... 150 Appendix 15 Information available on request ..................................................................... 155
Accountable Officer’s declaration In accordance with the Financial Management Act 1994, I am pleased to present the report of operations for the Department of Treasury and Finance for the year ended 30 June 2016.
David Martine Secretary


Department of Treasury and Finance Annual Report 2015 | 16 1
About DTF Our purpose We strive for excellence in financial and economic management to improve the lives of all Victorians. We value our people and motivate them to lead, influence, collaborate and innovate.
DTF’s role and objectives The Department provides economic, financial and resource management advice to help the Victorian Government deliver its policies, and supports the Treasurer and the Minister for Finance.
This includes:
• supporting the Government in responsible budget and financial management;
• delivering innovative and timely policy advice, and influencing government decisions on a range of economic, social and environmental issues;
• providing strategic leadership across the public sector on economic and financial sector reform;
• assisting the Government with implementing major infrastructure projects and frameworks; and
• contributing to decisions made by the Government on major contractual arrangements across the State.
DTF’s objectives are to:
• support sound financial management of Victoria’s fiscal objectives;
• guide Government actions to increase Victoria’s productivity and competitiveness;
• drive improvement in public sector asset management and the delivery of infrastructure;
• deliver efficient whole of government common services to the Victorian public sector; and
• ensure DTF and its people have the capability to serve Government.
We proactively look to improve our services, and the way in which they are delivered to ensure that we are:
• fiscally responsible;
• market focused; and
• reform oriented.

2 Department of Treasury and Finance Annual Report 2015 | 16
Our Ministers Treasurer – Tim Pallas MP Tim Pallas MP commenced as Treasurer of Victoria in December 2014.
The Treasurer is the minister in charge of government revenue and expenditure. His primary responsibilities are:
• preparing and delivering the annual state budget;
• promoting economic growth across the State of Victoria;
• promoting and encouraging investment opportunities in Victoria from interstate and abroad;
• developing the fiscal objectives and strategy for the State of Victoria;
• developing the economic policy of the Government;
• driving wages policy, which operates in conjunction with the industrial relations policies as developed and administered by the Industrial Relations Minister;
• overseeing the planning and delivery of major infrastructure projects undertaken across government;
• administering the Market-led Proposals Guideline, which provides the State with the means to access new and innovative ideas from the private sector;
• revenue policy and collection for the State of Victoria, including stamp duty, payroll tax and land tax;
• borrowing, investment and financial arrangements to hedge, protect and manage the State’s financial interests; and
• providing investment and fund management services to the State and its statutory authorities.
Minister for Finance – Robin Scott MP Robin Scott MP commenced as Minister for Finance in December 2014.
The Minister’s primary responsibilities are:
• WorkSafe Victoria, the statutory body that manages the insurance scheme for workplace accident compensation and rehabilitation, and occupational health and safety;
• the Accident Compensation Conciliation Service;
• the insurance operations of the Transport Accident Commission, the statutory body that manages the no fault insurance scheme for transport accident compensation and rehabilitation;
• the State’s financial reporting and accountability framework;
• whole of Victorian Government financial management and risk management frameworks;
• whole of Victorian Government purchasing and procurement arrangements including oversight of the Victorian Government Purchasing Board;
• overseeing the insurance policy for the State (the Victorian Managed Insurance Authority);
• the Victorian Government’s data access and intellectual property policies;
• overseeing superannuation policy for the State and oversight of the Emergency Services Superannuation Scheme;
• the Victorian Government’s motor vehicle fleet;
• whole of Victorian Government land management reform and coordination of government land sales;
• whole of Victorian Government accommodation planning and policies through the Shared Service Provider;
• economic regulation of the State’s essential services; and
• regulating Victoria’s registered community housing agencies.
Minister Scott is also Minister for Multicultural Affairs.
Department of Treasury and Finance Annual Report 2015 | 16 3
Senior Executive Group DTF is managed by the Senior Executive Group (SEG), which comprises the Secretary and Deputy Secretaries. Collectively, SEG has significant public and private sector management experience in the areas of economics, finance, people management and technology.
David Martine
Secretary, Department of Treasury and Finance
David leads the Department in its role of providing economic, financial and resource management policy advice to the Government.
David joined DTF as Secretary in February 2014. Prior to this, David held a number of senior roles in the Commonwealth public sector, particularly in the Commonwealth Treasury and Department of Finance and Deregulation.
David has extensive budget, finance, policy and organisational leadership experience, and has briefed governments on wide-ranging and complex policy issues.
Mark Rodrigues
Acting Deputy Secretary, Budget and Finance
Mark has acted as Deputy Secretary since May 2016, following the appointment of Melissa Skilbeck to a senior role in the Department of Health and Human Services. In this capacity, he is responsible for providing advice on the State’s fiscal resources, financial management and consolidated reporting, and wages policy.
Mark joined DTF in 2011, heading up the revenue forecasting team. In 2014, he was appointed Director of Budget Strategy, where he provides advice on the State's short to medium term budget outlook and fiscal strategy, financial and resource management frameworks and public sector industrial relations.
Mark has previously held senior economic positions in the private sector and the Commonwealth Treasury.
Simon Hollingsworth has been appointed as Deputy Secretary, Budget and Finance, commencing October 2016.
Gayle Porthouse
Deputy Secretary, Corporate and Government Services Division
Gayle is responsible for the efficient delivery of financial, people, information, legal, planning, procurement and technology services to DTF, which supports the Department to achieve its objectives and capacity to serve government.
She is also responsible for the management of whole of Victorian Government services provided to departments and agencies, including the development of policies and initiatives to achieve continuous improvement in facilities and real estate management, procurement and strategic sourcing. Gayle joined the Department in July 2014.
Gayle has more than 30 years’ experience in the public service across several government departments, including the Department of Premier and Cabinet.
David Webster
Deputy Secretary, Commercial
David is responsible for providing high-level commercial, financial and risk management advice to the Government, including a focus on major commercial transactions, infrastructure and the State’s balance sheet.
David commenced as Deputy Secretary in November 2011 and has more than 20 years’ extensive international corporate and commercial senior management experience as a fund manager, equity investor, financial adviser and lender.
Prior to joining DTF, David worked for RBS Funds Management in Sydney as Executive Director and Chairman. Previously, David was Investment Director at EISER Global Infrastructure Fund in London and Head of Infrastructure Advisory at RBS London.
Mark Johnstone
Acting Deputy Secretary, Economic
Mark is responsible for the provision of high level policy advice and economic analysis to the Government on taxation, economic, social, environmental and regulatory issues. Mark joined DTF in 2006 as Adviser to the Secretary and then as Assistant Director for competition and regulation reform and Director of the Economic group.
Prior to joining DTF, Mark worked in a variety of senior roles in the Department of Education and Early Childhood Development and the Commonwealth Department of Education, Training and Youth Affairs.
Mark has acted as Deputy Secretary since October 2015.
Amy Auster has been appointed as Deputy Secretary, Economic, commencing September 2016.

4 Department of Treasury and Finance Annual Report 2015 | 16
Organisational chart, 30 June 2016
Office of the SecretaryDavid Martine
Secretary
Economic DivisionMark Johnstone
Deputy Secretary (Acting)
Corporate and Government Services DivisionGayle PorthouseDeputy Secretary
Budget and Finance Division
Mark RodriguesDeputy Secretary (Acting)
Commercial DivisionDavid Webster
Deputy Secretary
EconomicDon Parker (Acting)
Social PolicyJeremy Nott
RevenueTrudy Hart
Housing Affordability Taskforce
Penelope McKay
Corporate FinanceJoe Bonnici
Legal ServicesMarian Chapman
Corporate Delivery ServicesLeanne Ansell-McBride
Shared Service ProviderJane Olsen
Strategic SourcingTim Barta
Communications and Public Affairs
Bill Kyriakopoulos
Financial ReportingSteve Mitsas
Budget StrategyKevin Lee (Acting)
Financial Assets and Liabilities
Bernard Gastin
Infrastructure Policy and Investment Approvals and Infrastructure Assurance
Joe Monforte
Infrastructure Contracting(Partnerships Victoria)
Jason Loos
Shareholder Advisory Services
Chris Clausen
Portfolio AnalysisVicky Hudson (Acting)
Port Transaction UnitNick Rizos (Acting)
Included within the DTF portfolio are:
- Accident Compensation Conciliation Service- CenITex- Commissioner for Better Regulation- Emergency Services and State Super- Essential Services Commission- Office of Projects Victoria- Old Treasury Building Committee of Management- Red Tape Commissioner- Rural Finance Corporation of Victoria - State Electricity Commission of Victoria - State Revenue Office- State Trustees Limited- Transport Accident Commission- Treasury Corporation of Victoria- Victorian Funds Management Corporation- Victorian Government Purchasing Board- Victorian Managed Insurance Authority- Victorian WorkCover Authority

Department of Treasury and Finance Annual Report 2015 | 16 5
Functions and services In 2015, DTF undertook a Capability Review to consider how to better align our capabilities and resources to effectively meet the Government’s expectations and priorities. This saw the functional groups realigned under four divisions.
As at 30 June 2016, the Office of the Secretary and four divisions, as outlined below, carried out the functions and services of DTF.
Office of the Secretary The Office of the Secretary supports the Secretary.
Economic Division Economic
Advises on economic strategy, market design, competition, regulation reform and resources and environment policies to improve Victoria’s economic prosperity and competitiveness.
Revenue
Provides analysis and advice to government on tax policy, intergovernmental financial relations, revenue forecasting and gambling policy.
Social Policy
Provides analysis and policy advice on education and training, health, housing, community services, transport, insurance, whole of government OH&S matters and risk; and responsible for leading the Government’s pilot program for Social Impact Bonds in cooperation with other departments.
Housing Affordability Taskforce
The introduction of a dedicated taskforce drawing together staff from across the Department to meet critical work priorities and projects. This taskforce is working on housing affordability.
Corporate and Government Services Division Corporate Finance
Provides corporate financial services to DTF and DPC and their agencies, including statutory and external reporting, management reporting, budgeting, asset management and management of various trusts.
Legal Services
The role of the Legal Services group is to provide legal and advisory services for DTF and its ministers, guiding DTF’s involvement in the legislative process, and contributing to the management of all externally sourced legal services.
Corporate Delivery Services
Provides corporate services to the Department, including planning and executive services, human resources, information and technology services, and operational services.
Shared Service Provider
Provides shared services in the areas of facilities, accommodation, car pool and library services to seven Victorian Government departments and 23 portfolio and other agencies, in line with the Government’s commitment to efficiencies through shared corporate services.
Strategic Sourcing
Provides whole of government procurement and strategic sourcing solutions to achieve best value for the Victorian Government, procurement policy leadership through the secretariat of the Victorian Government Purchasing Board, and management of the Standard Motor Vehicle Policy and VicFleet operations and finance for government departments and agencies.
Communications and Public Affairs
Provides issues management and strategic communications advice and services to effectively plan and implement projects and programs.
Budget and Finance Division Financial Reporting
Responsible for delivering sound financial advice to senior departmental management and relevant ministers, and robust, transparent whole of government financial publications to positively influence the management of the State’s financial resources.
Budget Strategy
Supports sound financial management in Victoria and provides advice on the State’s short to medium-term budget outlook and fiscal strategy, its financial and resource management frameworks and public sector industrial relations.

6 Department of Treasury and Finance Annual Report 2015 | 16
Portfolio Analysis
Provides advice on resource allocation to the Treasurer. Acts as first point of contact for line departments in relation to budget and spending submissions, finance issues, output performance reporting and the application and interpretation of the Financial Management Act 1994.
Commercial Division Financial Assets and Liabilities
Advises and reports on the State’s financial assets and liabilities and associated financial risks, including the State’s investments, debts, superannuation and insurance claims liabilities. The group also includes the Housing Registrar unit, which regulates the not-for-profit, non-government housing sector.
Infrastructure Policy and Investment Approvals and Infrastructure Assurance
Develops infrastructure policy frameworks and advises the Government on investment decisions and project assurance issues to improve how the public sector manages assets and develops and procures infrastructure.
Infrastructure Contracting (Partnerships Victoria)
Provides commercial, financial and risk management advice on infrastructure projects, manages commercial activities on behalf of the Government, particularly public private partnerships (PPPs), and implements the Government’s Market-led Proposals Guideline.
Shareholder Advisory Services
Oversees a range of commercial and transactional activities on behalf of government, including providing governance oversight of government business enterprises, and advice to government, departments and agencies relating to future uses or disposal of surplus government land, property and office accommodation services.
Port Transaction Unit
The Victorian Government has committed to lease the commercial operations of the Port of Melbourne. Legislation for the transaction was passed by the Parliament in March 2016. A dedicated Port Transaction Unit within the Commercial Division is overseeing the lease transaction.
DTF also supports the following portfolio agencies:
• Accident Compensation Conciliation Service
• CenITex
• Commissioner for Better Regulation
• Emergency Services and State Super
• Essential Services Commission
• Office of Projects Victoria
• Old Treasury Building Committee of Management
• Red Tape Commissioner
• Rural Finance Corporation of Victoria
• State Electricity Commission of Victoria
• State Revenue Office
• State Trustees Limited
• Transport Accident Commission
• Treasury Corporation of Victoria
• Victorian Funds Management Corporation
• Victorian Government Purchasing Board
• Victorian Managed Insurance Authority
• Victorian WorkCover Authority
Two new Governor-in-Council appointments were made in the Treasurer’s portfolio in 2015, supported by a Secretariat within DTF – the new office of the Red Tape Commissioner and the office of the Commissioner for Better Regulation.

Department of Treasury and Finance Annual Report 2015 | 16 7
Governance of DTF The overarching governance body for the Department is the Treasury and Finance Board. The Board consists of the Department’s Senior Executive Group (SEG – which comprises the Secretary and the Deputy Secretaries).
The Board’s primary function is to set and monitor the overall strategic direction, provide effective guidance and leadership, and to ensure the sound financial management and general compliance of the Department. The Board also provides high level monitoring and oversight of the Department’s people management and organisational strategies.
The Board met six times in 2015-16. SEG also meets weekly to discuss current and emerging operational issues.
The functions of the Board are supported by sub-committees. The current structure and role of each sub-committee is:
• Knowledge Management: advises and makes recommendations to the Board on appropriate knowledge management strategies designed to enhance access to and sharing of business critical information and knowledge.
• Remuneration: manages executive remuneration practice and procedures.
DTF Audit and Risk Committee The Audit and Risk Committee assists the Secretary in fulfilling his responsibility by reviewing the systems of established internal controls, the audit process, risk management and the financial information that will be provided to Parliament and others. The Audit and Risk Committee has external and independent members, including the Chair.
The Audit and Risk Committee comprised the following members as at 30 June 2016.
• Kathy Grigg – Chair (external)
• Jan West (external)
• Andrew Dix (external)
• Bernard Gastin
• Steve Mitsas
• Gayle Porthouse
The Department’s internal audit services were provided by KPMG.

8 Department of Treasury and Finance Annual Report 2015 | 16
Risk management attestation statement I, David Martine, certify that the Department of Treasury and Finance has complied with the Ministerial Standing Direction 4.5.5 – Risk Management Framework and Processes. The Department of Treasury and Finance Audit and Risk Committee has verified this.
David Martine Secretary
Compliance with DataVic Access Policy The Victorian Government DataVic Access Policy enables the sharing of government data at no, or minimal, cost to users. The policy’s intent is to support research and education, promote innovation, support improvements in productivity and stimulate growth in the Victorian economy as well as enhance sharing of, and access to, information-rich resources to support evidence-based decision making in the public sector.
Government data is progressively published in a machine-readable format on www.data.vic.gov.au, to minimise access costs and maximise use and reuse.
DTF’s release of government data in accordance with the policy is proceeding at a steady rate, with 481 of DTF’s datasets and data tools now available on the Victorian Government Data Directory. During 2015-16, the focus has been on updating existing datasets and releasing high-value datasets. As at the end of June 2016, 73 datasets have been published.
The release of these datasets has made a valuable contribution to the policy. In addition, DTF has made the complete budget paper series available online in machine-readable format.
Consistent with the DataVic Access Policy issued by the Victorian Government in 2012, the financial statements, performance statements and tables included in this annual report will be available at www.data.vic.gov.au/ in machine-readable format.

Department of Treasury and Finance Annual Report 2015 | 16 9
Report of operations Secretary’s foreword I am pleased to present the Department of Treasury and Finance (DTF) Annual Report for 2015-16.
DTF delivered a comprehensive agenda of projects and initiatives in 2015-16, demonstrating its leadership in economic and financial policy development and reform. The department also provided high quality advice to the Government to progress major infrastructure projects. DTF’s responsibility for whole of government services enabled significant procurement reforms, and delivered efficient and effective services to all Victorian Government departments and agencies.
DTF’s major achievements for 2015-16 included:
• producing key financial and economic publications for the State, including the 2016-17 Budget, the 2015-16 Financial Report and 2015-16 Budget Update;
• commencing the formal transaction process to lease the Port of Melbourne, following passage of the Delivering Victorian Infrastructure (Port of Melbourne Lease Transaction) Act 2016;
• implementing the Government’s Back to Work Scheme, in conjunction with the State Revenue Office;
• implementing a regulatory reform program across government;
• releasing the Market-led Proposals Guideline;
• developing and releasing a revised Performance Management Framework to departments;
• preparing the Parliamentary Budget Officer Bill 2016 for introduction into Parliament;
• releasing the Land Transaction Policy and Guidelines, and the Strategic Crown Land and Land Transaction Policy and Guidelines; and
• revising the Standing Directions of the Minister for Finance to strengthen financial management accountabilities and improve the effectiveness of public sector financial management.
Future challenges In 2016-17, DTF will progress a number of initiatives to influence and deliver positive outcomes for Victoria. We will do this by providing high-quality advice and services to Government and the Victorian public sector. Significant projects for 2016-17 include:
• the 2017-18 Budget;
• finalising the lease of the Port of Melbourne;
• implementing recommendations from the Royal Commission into Family Violence and advising on the Government’s family violence investment plan;
• a whole of government housing strategy, incorporating opportunities to improve housing affordability;
• working with departments to trial programs that assess the effectiveness of social impact bonds;
• supporting the roll out of the National Disability Insurance Scheme across the State by 2019-20;
• establishing the Office of Projects Victoria;
• updating the Financial Management Act 1994 to reinforce changes to financial management accountabilities in the Standing Directions and support more effective resource management and stronger service performance;
• reviewing and updating the Ministerial Directions under the Project Development and Construction Management Act 1994 and the associated supporting Guides;
• implementing the Asset Management Accountability Framework; and
• leading a program of whole of government service reforms, including expansion of the Victorian Government Purchasing Board’s scope, and developing a social procurement framework and fit-for-purpose government accommodation strategies.
10 Department of Treasury and Finance Annual Report 2015 | 16
Our people In 2015-16, DTF committed to increasing our internal capability and focusing on increased collaboration and innovation. The priorities identified will inform a workforce strategy to develop the capabilities we require now and in the future. Changes implemented this year have seen an increase in mobility of staff and transfer of skills to business areas across the department, ensuring DTF is more flexible to respond quickly to changing priorities. This includes establishing taskforces to meet critical work priorities and projects, drawing on expertise from across divisions.
We continue to focus on developing our inclusive workforce, welcoming several graduates who reflect our commitment to a gender and culturally diverse workforce, including a number through the Aboriginal Pathway program. This was complemented by the release of DTF’s Diversity and Inclusion Action Plan. The Plan recognises the importance of attracting, retaining and advancing individuals who reflect the Victorian population, and promoting inclusion at all levels of the organisation.
I thank all DTF staff for their hard work and commitment throughout a year of significant achievement and service to the Victorian public sector and community.
David Martine Secretary

Department of Treasury and Finance Annual Report 2015 | 16 11
2015-16 performance The Department of Treasury and Finance has achieved progress against its objectives in the State’s 2015-16 Budget. The Department’s objectives, indicators, progress on the indicators and key departmental initiatives are included in the report of operations.
The Department of Treasury and Finance has met or exceeded targets for the majority of its output performance measures. Of the 56 quantity, quality and timeliness performance measures in the report of operations, 88 per cent of targets were met or were exceeded. An explanation is provided for significant variations between the 2015-16 targets and actuals where performance was five per cent more or less than the target.
Changes to the Department during 2015-16 Components of the Business Environment Policy Advice output transferred from the Department of Premier and Cabinet due to machinery of government changes effective 22 September 2015.
Changes to outputs are reflected in the table below.
2015-16 departmental objective 2015-16 output Reason for change Guide government actions to increase Victoria’s productivity and competitiveness
Business Environment Policy Advice This output was transferred from the Department of Premier and Cabinet as a result of machinery of government changes.
Departmental objectives, indicators and outputs The Department’s objectives, associated indicators, and linked outputs as set out in the 2015-16 Budget Paper No. 3 Service Delivery are shown below.
Departmental objective Indicators Outputs Sound financial management of Victoria’s fiscal resources The Department of Treasury and Finance has a central role in shaping Victoria’s economic, social and fiscal policy to ensure that Government financial policies are fiscally sound.
A net operating surplus consistent with maintaining general government net debt at a sustainable level over the medium term. General government net debt as a percentage of GSP to be maintained at a sustainable level over the medium term. Effective financial risk management and prudential supervision of public financial corporations and public non-financial corporations. Provide high quality, timely and relevant advice on the State’s finances and budget, borrowings, investments, insurance, superannuation issues and prudential supervision, as assessed by feedback from our key clients.
Budget and Financial Policy Advice Financial Reporting Financial and Resource Management Frameworks GBE Performance Monitoring and Financial Risk Management Revenue Management Services to Government

12 Department of Treasury and Finance Annual Report 2015 | 16
Departmental objective Indicators Outputs Guide government actions to increase Victoria’s productivity and competitiveness The Department of Treasury and Finance provides Government with advice on key economic and financial issues, including longer term economic development, regulation, financial strategy and taxation policy.
Reduce the costs and barriers to doing business in Victoria, including reducing the regulatory burden. Provide high quality, timely and relevant advice on economic policy, forecasts, legislation and frameworks as assessed by feedback from our key clients.
Economic and Financial Policy Economic Regulatory Services Business Environment Policy Advice
Drive improvement in public sector asset management and the delivery of infrastructure
The Department of Treasury and Finance develops and applies prudent commercial principles and practices to influence and deliver Government policies. This promotes transparent and accountable commercial principles and practices throughout the public sector, and ensures that government-owned property assets are managed and used efficiently.
Ensure high-value high-risk Government projects are completed within agreed timeframes and scope through ensuring adherence to standards.
Provide high quality, timely and relevant advice on asset management, the delivery of infrastructure and management of government land as assessed by feedback from our key clients.
Land and Infrastructure Investment Management
Deliver efficient whole of government common services to the Victorian public sector
The Department of Treasury and Finance assists government agencies in providing a more integrated approach to the management of common services.
Drive productivity and efficiency by increasing the benefits delivered from government procurement contracts. Drive efficiency by maintaining low vacancy rates for government office accommodation.
Provide high quality, timely and relevant advice on services to Government as assessed by feedback from our key clients.
Resource Management Services to Government

Department of Treasury and Finance Annual Report 2015 | 16 13
Reporting progress towards achieving Departmental objectives and indicators The Department of Treasury and Finance’s objectives, indicators, and progress on those indicators are outlined below.
Objective 1: Sound financial management of Victoria’s fiscal resources
Objective indicators
1. A net operating surplus consistent with maintaining general government net debt at a sustainable level over the medium term.
2. General government net debt as a percentage of GSP to be maintained at a sustainable level over the medium term.
3. Effective financial risk management and prudential supervision of public financial corporations and public non-financial corporations.
4. Provide high quality, timely and relevant advice on the State’s finances and budget, borrowings, investments, insurance, superannuation issues and prudential supervision, as assessed by feedback from our key clients.
Throughout 2015-16, DTF supported the Government in maintaining a strong focus on disciplined financial management to support the State’s triple-A credit rating.
DTF has also developed a whole of State liquidity management strategy to ensure that the State has sufficient funds to meet its obligations as they fall due, and the projected future funding requirements of the State as a whole can be met. In order to meet these objectives, a target liquidity coverage ratio of 80 per cent has been set. The liquidity ratio averaged 106 per cent for the 2015-16 financial year.
As Standard & Poor’s notes, ‘Victoria’s financial management is very strong’, there is a ‘prudent approach to debt and liquidity management’ and it has an economy that ‘is very strong compared with its peers’.
Strong operating surpluses for the general government sector are forecast over the budget and forward estimates period. The operating surplus in 2015-16 was $2.664 billion. The operating surplus is forecast to be $2.9 billion in 2016-17, averaging $2.1 billion a year over the forward estimates to 2019-20.
Operating surplus
0
0.5
1
1.5
2
2.5
3
3.5
2014-15actual
2015-16actual
2016-17estimate
2017-18estimate
2018-19estimate
2019-20estimate
$ bi
llion
General government net debt as a percentage of gross state product (GSP) and the ratio of net debt to revenue are forecast to fall over the budget and forward estimates period. In 2015-16 net debt for the general government sector was $22.3 billion. Net debt is projected to fall to 4.8 per cent of GSP (or $22.2 billion) by the end of June 2020 and down to around 3.2 per cent over the next 10 years.
Net debt to GSP
0
1
2
3
4
5
6
7
2014-15actual
2015-16actual
2016-17estimate
2017-18estimate
2018-19estimate
2019-20estimate
per c
ent
DTF continued to oversee the strong commercial performance and effective financial risk management of key public financial and non-financial corporations (the corporations) via regular performance monitoring; corporate plan reviews and issues management.
As part of this review process, DTF focuses on ensuring that strategies being adopted by the corporations were consistent with the Government’s overall objectives. In 2015-16, there was a strong focus on identifying options and strategies which enabled the corporations to contribute to the Government's policy agenda (for example in relation to social and affordable housing), while also operating in a commercially sustainable manner.

14 Department of Treasury and Finance Annual Report 2015 | 16
DTF policy advice over the past 12 months has guided Government actions across a range of priority areas. Advice from the Department informed the Government’s sustainability objectives, and provided regular, timely advice on the State’s budget position.
Financial advice assisted the Government in the publishing of key products including the 2016-17 Budget, 2014-15 Financial Report, 2014-15 Budget Update, and the 2014-15 September Quarterly Financial Report.
During the 2016-17 Budget, DTF supported Government decision making by providing detailed analysis and advice on more than 400 budget proposals. This advice related to output and asset budget submissions and helped inform Government decision making on resource allocation. The 2016-17 Budget funded $6.8 billion in output initiatives, and up to $12.4 billion in new capital investment.
DTF advised Government on Victoria’s economic and fiscal position and policies via timely and regular financial updates.
DTF continued to work with departments to improve their performance statements and review corporate plans. DTF also supported the Treasurer and Minister for Finance through providing high quality, accurate advice relating to all departmental portfolios.
DTF reviewed the Standing Directions for the Minister for Finance. DTF’s review, undertaken with significant consultation across Victorian public sector agencies, resulted in the Minister for Finance issuing revised Standing Directions (the ‘Directions’) in February 2016. The Directions came into effect on 1 July 2016 and will improve financial management across the Victorian Public Sector. New requirements include stronger accountability for agency boards, chief executive officers and chief financial officers. They also work to enhance controls against fraud and corruption, achieve better planning, and require public attestation in agencies’ reports.
Existing requirements have been streamlined, clarified and tailored to a range of different agencies. The 2016 Directions significantly modernise the State’s financial management regime and operations.
The department has also issued three frameworks under the revised Standing Directions:
• Budget Operations;
• Performance Management; and
• Financial Reporting Operations Frameworks.
These frameworks set down mandatory rules and guidance for government and public sector planning, budgeting, service delivery, performance, monitoring, reporting and accountability.
Based on departmental advice, the Government introduced legislation to Parliament to establish a Parliamentary Budget Office (PBO) in February 2016. The PBO will be a separate office within Parliament, led by a Parliamentary Budget Officer as an independent officer of Parliament. The PBO’s main role is to prepare election policy costings at the request of parliamentary leaders, and general costings and advice at the request of Members of Parliament.
Financial reporting is changing rapidly, with significant momentum in the private sector to de-clutter annual financial reports into a more understandable, easily digestible format. Options to streamline the 2015-16 Financial Report for the State of Victoria (AFR) will be progressed to improve the transparency and utility of the AFR for users. DTF expects to extend streamlining to other departments for the subsequent reporting period.
DTF also worked with departments on a common definition of the chart of accounts for a more consistent and aligned reporting framework.
In response to Government restructures and changes across the Victorian public service, DTF collaborated with departments and is developing a machinery of government manual. The manual will provide a comprehensive source of guidance and standardised process to assist departments in implementing future machinery of government changes consistently across the VPS.
Analysis and advice was also provided to Government on applying wages policy for more than 40 enterprise agreements.

Department of Treasury and Finance Annual Report 2015 | 16 15
Table 1 – Progress towards objective – Sound financial management of Victoria’s fiscal resources
Indicator Unit of
measure 2013-14
actual 2014-15
actual 2015-16
actual
A net operating surplus consistent with maintaining general government net debt at a sustainable level over the medium-term.
$ million 1 976.2 1 214.0 2 664
General government net debt as a percentage of GSP to be maintained at a sustainable level over the medium term.
per cent 6.0 6.1 5.9
A net operating surplus consistent with maintaining general government net debt at a sustainable level over the medium term
General government net debt as a percentage of GSP to be maintained at a sustainable level over the medium term

16 Department of Treasury and Finance Annual Report 2015 | 16
Objective 2: Guide government actions to increase Victoria’s productivity and competitiveness
Objective indicators
1. Reduce the costs and barriers to doing business in Victoria, including reducing the regulatory burden.
2. Provide high quality, timely and relevant advice on economic policy, forecasts, legislation and frameworks as assessed by feedback from our key clients.
In 2015-16, the Government implemented strategies for an efficient and effective suite of regulations. Departments and regulators reviewed their existing legislation and regulation and were asked to identify areas for further improvement to reduce the regulatory burden on Victorian businesses. The aim was to reduce the red tape component of the regulatory burden by 25 per cent.
Departments have already identified significant savings, as well as further areas to investigate. In particular, the Government has initiated two specific reviews: the first will examine the cost and implications of legislation and regulations on small retail businesses, and the second will explore in more detail opportunities for greater consistency in the ways that regulators interact with Victorian businesses.
In September 2015, the Victorian Government appointed the Red Tape Commissioner, Dr Matthew Butlin. The role of the Commissioner is to work with Victorian consumers and businesses to identify systemic red tape issues and work with regulators to introduce improved practices. The Commissioner also set about investigating specific areas of public concern where there was significant and consistent negative impact from regulation.
DTF commissioned a survey of businesses to understand the external perception of the impact of government regulatory burden. The results showed that Victoria is believed to have the lowest regulatory burden on business of all of the mainland states. The survey also identified the industries where Victorian regulation has thre greatest impact. This information informed thinking about further target reforms and regulatory burden reductions.
The Commissioner for Better Regulation, Anna Cronin, was appointed in September 2015. The role of the Commissioner is to review regulatory impact statements for new or sunsetting regulations, and legislative impact assessments for new legislation. The aim is to assure the Government that the costs and benefits have been adequately assessed, and that sufficient and appropriate alternative approaches have been considered.
The Commissioner also supported departments and regulators to improve regulatory design and identify opportunities to modernise regulations.
DTF supported the Government in its aim to reduce the regulatory burden for businesses in Victoria by investigating options for state-based taxation reform over the short and long term during budget deliberations and for the Government’s longer term considerations. A number of tax reform measures were approved as part of the 2016-17 Budget and passed as part of the State Taxation and Other Acts Amendment Act 2016 in June 2016. Payroll tax measures, including rebates for displaced apprentices and increases to the payroll tax free threshold will further support Victorian businesses.
DTF and the State Revenue Office supported the implementation of the Back to Work Scheme. The Scheme provided incentives for the employment of disadvantaged cohorts of workers into jobs. The broader Scheme has been fully subscribed and as such, closed on 18 July 2016.
DTF conducted a review into housing affordability in Victoria, The scope of the review included:
• examining the current state of housing affordability;
• the range of policy levers available to government;
• the effectiveness of existing Victorian taxation, concession and home owner grant arrangements in supporting affordable housing outcomes; and
• examining a range of other policy settings that impact on housing affordability in Victoria.
The outcomes of this review will contribute to the development of the Victorian Government’s housing strategy, which is scheduled for release in late 2016.

Department of Treasury and Finance Annual Report 2015 | 16 17
DTF advice underpinned the Government’s commitment to explore the use of Social Impact Bonds (SIBs). SIBs trial innovative interventions designed to help improve outcomes for some of the most disadvantaged groups within Victoria. The 2016-17 Budget announced $700 000 for the market testing and procurement phases of Victoria’s first SIBs. These SIBs are intended to assist young people leaving out-of-home care and people experiencing problems associated with harmful alcohol and other drug use.
In 2015-16, DTF advice also supported enhancing the legislative framework for domestic building insurance from July 2015. A first tranche of broader domestic building consumer protection reforms were passed by Parliament in April 2016. This advice has also been used to develop a second tranche of reforms to be introduced before the end of 2016.
The introduction of the Transport Accident Amendment Act 2016 was supported by DTF advice. The Act removes specific barriers for Victorians’ ability to claim common law compensation following a transport accident.
DTF supported ongoing work for the Government’s commitment to legislate to give presumptive rights to compensation for career and volunteer firefighters with certain cancers.
DTF continued to support the Centre for Market Design (CMD), which was set up in collaboration with the Commonwealth Treasury and the University of Melbourne to undertake research and build capability in market design and innovative microeconomic policy solutions.
The CMD worked with RMIT University, the Children’s Court of Victoria and the Department of Justice and Regulation to evaluate how court-based diversion activities could influence young people’s future contact with the criminal justice system. This involved collecting data from young people at seven Children’s Court venues across Melbourne and regional Victoria and linking this information with administrative data held by the Victorian Government and diversion services providers. The project continues to assist the State Government develop a robust evidence base to design and deliver services to vulnerable youth.
The CMD worked with the Commonwealth Government Department of Agriculture and Water Resources, the Centre of Excellence for Biosecurity Risk Analysis and the Monash Experimental Research Insights Team to test and implement new biosecurity inspection protocols at the Australian border.
In June 2016, the Department of Agriculture and Water Resources announced a trial of new protocols on peat and selected vegetable seeds to commence in August 2016. This project could demonstrate the potential benefits and broader application of incentive-based regulation across Australia.
In May and June 2016, the Centre for Market Design developed and taught a new postgraduate-level course in market design to 60 Victorian and Australian Government public servants in Melbourne and Canberra. The course brings policymakers up to date with the latest developments in microeconomics, with an emphasis on resource and information constraints and practical applications.
DTF’s Economic Policy and Strategic Sourcing groups collaborated to redesign procurement processes for fuel cards for government vehicles. The new approach secured an increase in the fuel discount offered, which could save Victoria $2 million over the three years of the contract.
The Economic Regulatory Services output is delivered by the Essential Services Commission (ESC). This output provides economic regulation of utilities and other specified markets in Victoria to protect the long-term interests of Victorian consumers with regard to price, quality and reliability of essential services. By providing these services, this output contributes to the departmental objective of guiding government actions to increase Victoria’s productivity and competitiveness.
During 2015-16, the ESC undertook a number of inquiries, provided advice to Government and completed several reviews.
One of the inquiries completed related to hardship policies, practices and procedures of energy retailers and recommended changes to the regulatory framework governing retailers’ obligations. Another two-part inquiry into the true value of distributed generation was undertaken, which examined the economic, social and environmental benefits of the energy and network value of distributed generation.
Reviews undertaken during 2015-16 included water price reviews for Melbourne Water and Goulburn Murray Water, and a taxi fare review to determine the maximum charges for taxi services in the Melbourne metropolitan taxi zone and the urban and large regional taxi zone. Reports were also released detailing the annual performance of the water, retail electricity and gas and domestic building insurance sectors, and a position paper outlining a new model for the pricing of services in Victoria’s water sector was released.

18 Department of Treasury and Finance Annual Report 2015 | 16
Advice was provided to Government on the administration and implementation of a rate capping framework for Victorian councils and nine rate variation applications from Victorian councils under the Fair Go Rates System framework were determined.
In relation to the legislative reforms introduced as part of the Energy Legislation Amendment (Consumer Protection) Act 2015, an Interim Approach to Compliance and Enforcement was released for energy businesses to facilitate implementation of these reforms.
More than seven million certificates were registered under the Victorian Energy Efficiency Target scheme.

Department of Treasury and Finance Annual Report 2015 | 16 19
Objective 3: Drive improvement in public sector asset management and the delivery of infrastructure
Objective indicators
1. Ensure high-value high-risk Government projects are completed within agreed timeframes and scope through ensuring adherence to standards.
2. Provide high quality, timely and relevant advice on asset management, the delivery of infrastructure and management of government land as assessed by feedback from our key clients.
In providing the Government with reliable advice relating to implementing its asset programs, DTF critically evaluates high-value high-risk projects. In order to fulfil high-value high-risk measures and requirements, the Department scrutinises and provides advice to the Treasurer on the robustness of business cases, procurement documents and contracts.
Throughout 2015-16, DTF continued its engagement in relevant project steering boards and committees, providing advocacy to better position projects to meet high standards and tight timelines, support Government decision making, and encourage improved commercial and risk management practices of major projects. High-value high-risk assurance committee meetings were held regularly throughout the year, supplemented by forums to discuss specific project issues as required.
On a quarterly basis, the Department reported to Government on progress, issues and risks to major projects, advising on appropriate risk mitigation actions for projects facing budget, scope or timing risks.
The number of project reviews under the high-risk high-value framework was higher than forecast, reflecting the increase of the State Government's infrastructure program.
Revised guidelines for market-led proposals were released in November 2015. More than 45 pre-submission meetings were held, resulting in significant interest from the private sector in submitting formal proposals for consideration.
A number of proposals including the Western Distributor road project, a new Victoria Police Centre and an upgrade to metropolitan rail telecommunications are progressing through the later assessment stages of the framework.
During 2015-16, DTF finalised and implemented a new Asset Management Accountability Framework (AMAF). The new framework builds upon and strengthens the previous asset management policy. The AMAF clearly articulates the expectations of all responsible agencies in planning for and managing their assets. The AMAF also improves accountability through the introduction of an attestation requirement.
The Delivering Victorian Infrastructure (Port of Melbourne Lease Transaction) Act 2016 was passed by the Victorian Parliament on 10 March 2016. The legislation enables a 50-year lease of the Port of Melbourne's commercial operations and established the Victorian Transport Fund, providing a dedicated investment fund for new transport related capital projects.
21
39 42
40 42
05
1015202530354045
June 11-12 June 12-13 June 13-14 June 14-15 June 15-16
Number of major capital projects monitored by DTF

20 Department of Treasury and Finance Annual Report 2015 | 16
DTF manages a compliance framework in which public sector entities attest that they are complying with the State’s prudential supervision policies. During 2015-16, all public financial corporations subject to prudential supervision policies attested that they fully complied with these policies.
In 2015-16, the Housing Registrar ensured its 41 registered agencies recorded high levels of compliance in accordance with its risk-based regulatory approach. Regulatory plans were put in place to further improve agency performance. A new computer system was introduced to streamline regulatory processes and reduce regulatory burden.
DTF continues to work collaboratively with the Department of Environment, Land, Water and Planning (DELWP), the Victorian Water Industry Association (‘VicWater’), and individual water corporations, to identify further efficiency opportunities. The focus on driving efficiencies within the water sector is ongoing, and includes review and monitoring of:
• operating and capital expenditure;
• examining opportunities for water corporations to share services and infrastructure, strategic procurement and contract optimisation;
• identifying areas of best practice within the sector for particular activities; and
• sale of assets that are surplus to operational requirements.
The target level of activity was exceeded in 2015-16, generated by additional work on intergovernmental matters, updating the National Public Private Partnership Guidelines and releasing revised market-led proposal guidance. Additional training/presentations provided by Partnerships Victoria, the Gateway Unit and for State Budget processes also contributed to the higher than expected outcome.
The Government has used advice from DTF in establishing the Office of Projects Victoria to improve how major projects are developed, contracted for and implemented. The Office will build capability and skills in the public sector for infrastructure projects.
DTF led an update to the National Public Private Partnership policy and guidelines in consultation with other jurisdictions. The guideline changes addressed recommendations from the Productivity Commission’s Public Infrastructure inquiry and were published in December 2015.
A substantive review of Ministerial Directions and supporting guidance for construction procurement commenced. The aim of the review is to update and enhance the requirements for tendering and contracting for public construction procurement in Victoria, to reflect current best practice following the abolition of the Victorian Code.
As part of the streamlining of infrastructure procurement and tendering, DTF undertook targeted consultations with key stakeholders to develop policy reform options.
A stocktake of government-owned telecommunications infrastructure was designed and piloted in conjunction with the Department of Economic Development, Jobs, Transport and Roads. The pilot identified features that need to be incorporated into the rollout of the stocktake across all government agencies.
Total land sales of more than $133 million were transacted by DTF in 2015-16. In August 2015 the Government approved the further centralisation of land sales to DTF. The Department reviewed land sales targets, and new targets for each department were approved by Government during 2015-16.
DTF drafted the Landholding Policy and Guidelines, and worked with DELWP to develop the Strategic Crown Land Assessment Policy and Guidelines, and the Land Transaction Policy and Guidelines.
Policy advice to Government has seen Victoria become the first Government in Australia to issue Green Bonds, raising $300 million to finance a range of new and existing infrastructure projects that achieve climate change and environmental benefits. Projects fall into several categories, including:
• low carbon transport;
• renewable energy;
• water treatment; and
• low carbon buildings.
Victorian Green Bonds are the world’s first state or federal government-issued bonds to receive international Climate Bond Certification.

Department of Treasury and Finance Annual Report 2015 | 16 21
Advice to Government informed the decision to restart the Greener Government Buildings (GGB) program. To be funded through Victorian Green Bonds, the program will reduce greenhouse gas emissions by 25 000 tonnes a year and save up to $100 million over 15 years by reducing the energy use of government buildings. The $33 million program will be implemented over the next two years to upgrade existing government buildings and infrastructure.
The GGB program further supports the growth of clean energy and technology industries, creating jobs and strengthening Victoria’s position as the centre of excellence for energy efficiency.

22 Department of Treasury and Finance Annual Report 2015 | 16
Objective 4: Deliver efficient whole of government common services to the Victorian public sector
Objective indicators
1. Drive productivity and efficiency by increasing the benefits delivered from government procurement contracts.
2. Drive efficiency by maintaining low vacancy rates for government office accommodation.
3. Provide high quality, timely and relevant advice on services to Government as assessed by feedback from our key clients.
State Purchase Contracts (SPCs) are established and managed by DTF and cover an estimated annual Government spend of $950 million.
The Victorian Government Purchasing Board (VGPB) reviewed its supply policies to ensure that they reflect the Government’s objectives. The revised supply policies were gazetted and became effective 1 July 2016.
The VGPB continues to broaden its influence across the public sector to meet the Government’s objectives. VicRoads was successfully accredited to the VGPB supply policies on 1 July 2015 and work is under way to accredit Public Transport Victoria.
A new Professional Advisory Services SPC was established following an open tender process. It combines commercial and financial advisory services, tax advisory services, financial assessment services and probity services under a single SPC. This gives the Victorian Government access to consistent, high quality professional advisory services from more than 140 suppliers, including small to medium sized enterprises. Suppliers benefit from access to Victorian Government procurement, and streamlined administrative arrangements.
Other SPCs introduced during the year include Print Management and Associated Services, Staffing Services and Stationery and Workplace Consumables.
The introduction of a purchasing card initiative reduces the number of payment channels, increasing efficiency and modernising Government’s business, resulting in an expected saving to Government of $48 million over four years.
DTF has also supported a Government election commitment to save on government fleet operations of $38 million over four years. It is being implemented through mandatory purchase of four cylinder vehicles, and variable lease terms. To assist departments with savings, DTF has also implemented a new Fuel SPC.
DTF provided leadership for policy development on procurement aspects of free trade agreements, including the Trans-Pacific Partnership and the World Trade Organisation (WTO) General Agreement on Tariffs and Trade.
The Shared Service Provider (SSP) delivers facilities, accommodation management, library and car pool services to all Victorian Government departments and 23 portfolio and other agencies.
Government office accommodation continued to be a key feature for SSP in 2015-16, with 86 accommodation projects completed across the CBD, metropolitan and regional Victoria.
Over the past year, SSP has achieved significant accommodation savings. Through effective management and planning, SSP has reduced vacant space to 0.37 per cent. Accommodation costs have also reduced to $380 per square metre, more than 6 per cent lower than the previous year.
SSP has also worked with clients to reframe security management, shifting from a traditional facilities management view to an accommodation management focus. As at 30 June 2016, 521 rapid risk assessments of Government buildings had been conducted to enhance the security of government buildings.
Significant progress has been made in the past year to improve customer satisfaction, resulting in a customer satisfaction rating of more than 78 per cent. This has been achieved by engaging with clients on significant programs of work, including the Community Correctional Services Accommodation Expansion program, and the Education Regionalisation program.

Department of Treasury and Finance Annual Report 2015 | 16 23
Table 2 – Progress towards objective – Deliver efficient whole of government common services to the Victorian public sector Indicator Unit of
measure 2013-14
actual 2014-15
actual 2015-16
actual
Drive efficiency by maintaining low vacancy rates for government office accommodation
per cent 2.20 1.48 0.37
Drive productivity and efficiency by increasing the benefits delivered from government procurement contracts
$ million 59.23 50.0 77.72
Drive efficiency by maintaining low vacancy rates for government office accommodation
Drive productivity and efficiency by increasing the benefits delivered from government procurement contracts
Performance against output performance measures The following sections outline details of the outputs provided by the Department to the Government, including performance measures and costs for each output, and the actual performance results against budgeted targets by output for the Department over the full year ending 30 June 2016.
Legend of symbols
The following symbols are used to indicate the type of variance in performance against output performance measures:
performance target achieved – (both within 5 per cent variance and exceeds 5 per cent variance)
performance target not achieved – within 5 per cent variance
performance target not achieved – exceeds 5 per cent variance

24 Department of Treasury and Finance Annual Report 2015 | 16
Sound financial management of Victoria’s fiscal resources The Department of Treasury and Finance has a central role in shaping Victoria’s economic, social and fiscal policy to ensure that Government financial policies are fiscally sound.
Budget and Financial Policy Advice This output contributes to the Department’s objective of providing sound financial management of Victoria’s fiscal resources through the provision of strategic, timely and comprehensive analysis and advice to Ministers, Cabinet and Cabinet Sub Committees on:
• resource allocation; and
• departmental financial, output and asset delivery performance to support government in making decisions on the allocation of the State’s fiscal resources.
This output assists government to deliver responsible budgets and operating surpluses which contributes to sound financial management.
The output also provides management of Cost Control and Efficiency Reviews.
Performance measures Unit of measure
2015-16 actual
2015-16 target
Performance variation (%)
Result
Quantity
Cost Control and Efficiency Reviews (Funding Reviews) delivered
The 2015-16 outcome is lower than the 2015-16 target due to the larger scale of reviews commenced.
number 1 3 -66.7
Quality
Accuracy of the revised estimate of State budget expenditure
per cent 0.5 ≤5.0 0
Maintain ISO 9001 (Quality Management Systems) Certification
per cent 100 100 0
Timeliness
Delivery of Cost Control and Efficiency Review reports within agreed timeframes
per cent 100 100 0
Delivery of advice to Government on portfolio performance within agreed timeframes
per cent 100 100 0
Cost
Total output cost The 2015-16 outcome is lower than the 2015-16 target due to an internal restructure and the transfer of functions and employee expenses from this output.
$ million 8.7 11.7 25.6

Department of Treasury and Finance Annual Report 2015 | 16 25
Financial Reporting This output contributes to the Department’s objective of providing sound financial management of Victoria’s fiscal resources by maintaining the integrity of systems and information for financial planning, management, monitoring and reporting of the State of Victoria through:
• publication of the State budget and budget related documents;
• reporting, monitoring and publication of financial and non-financial performance in the Victorian public sector;
• management of the Public Account operations; and
• best practice financial reporting framework, and whole of state management information systems, supporting financial reporting across the Victorian public sector.
Performance measures Unit of measure
2015-16 actual
2015-16 target
Performance variation (%)
Result
Quality
Auditor-General qualification relating to material weaknesses in financial reporting systems and processes for the State of Victoria Financial Report or Estimated Financial Statements
While the 2014-15 Annual Financial Report received two qualifications from the Acting Auditor-General (and the Estimated Financial Statements were similarly qualified for the Education Asset balances) these did not relate to material weaknesses in DTF’s financial reporting systems and processes.
number 0 0 0
Maintain ISO 9001 (Quality Management Systems) Certification
per cent 100 100 0
Supporting the financial reporting framework across the VPS (survey data)
per cent 81 80 1.3
Timeliness
Annual Budget published by date agreed by Treasurer
date 27 Apr 2016
May-16 0
Budget Update, Financial Report for the State of Victoria, Mid-Year Financial Report, and Quarterly Financial Reports are transmitted by legislated timeline
The 2015-16 outcome is lower than the 2015-16 target as the audited 2014-15 Financial Report (incorporating Quarterly Financial Report No. 4) could not be transmitted to Parliament by the legislated date of 15 October 2015.
per cent 71 100 -29
Cost
Total output cost The 2015-16 outcome is higher than the 2015-16 target due to costs associated with improvements to the State’s financial reporting system SRIMS.
$ million 10.3 9.5 8.4

26 Department of Treasury and Finance Annual Report 2015 | 16
Financial and Resource Management Frameworks Maintenance and Support This output develops and maintains cohesive financial and resource management frameworks that drive sound financial and resource management practices in the Victorian public sector (VPS). This includes enhancing key frameworks to drive performance, monitoring VPS entities’ compliance, and advising government and key stakeholders on financial and resource management and compliance issues.
The output contributes to the Department’s objective of ensuring sound financial management of the State’s fiscal resources by:
• ensuring that financial and resource management frameworks are established and complied with;
• promoting continuous improvement in resource allocation and management through regular reviews and updates to ensure the frameworks represent good practice; and
• promoting awareness of financial management accountabilities and roles.
Performance measures Unit of measure
2015-16 actual
2015-16 target
Performance variation (%)
Result
Quality
Maintain ISO 9001 (Quality Management Systems) Certification
per cent 100 100 0
Recommendations on financial management framework matters made by the Public Accounts and Estimates Committee and Victorian Auditor-General’s Office and supported by Government are actioned
per cent 100 100 0
VPS stakeholder feedback indicates delivery of advice and information sessions supported the VPS to understand the financial management framework
The 2015-16 outcome is higher than the 2015-16 target due to increased engagement with key stakeholder groups.
per cent 87 80 8.8
Timeliness
Annual financial management compliance report for the previous financial year is submitted to the Minister for Finance
date 7 Dec 2015 By end Feb 2016
0
Cost
Total output cost The 2015-16 outcome is higher than the 2015-16 target due to an internal restructure and the transfer of functions and employee expenses to this output.
$ million 5.6 4.5 24.4

Department of Treasury and Finance Annual Report 2015 | 16 27
GBE Performance Monitoring and Financial Risk Management This output monitors the performance of Government Business Enterprises (GBEs) and Registered Housing Agencies, and manages the State’s financial risk. It contributes to the Department’s objective of ensuring sound financial management of Victoria’s fiscal resources by:
• monitoring and providing advice on the financial and operational performance of GBEs and Registered Housing Agencies;
• developing and implementing prudential risk management and reporting frameworks in respect of public financial corporations (PFCs) and strategies to manage the State’s financial risks;
• overseeing policy and strategies to manage the State’s investment, borrowing, unfunded superannuation and insurance claims obligations and the management of the associated risks; and
• producing budget and financial reporting data for the public non-financial corporation (PNFC) and PFC sectors.
Performance measures Unit of measure
2015-16 actual
2015-16 target
Performance variation (%)
Result
Quantity
Coordinate and produce presentations for the annual review meetings with credit rating agencies
number 2 2 0
Provision of budget sector debt, public authority income and superannuation estimates and analysis and commentary on the PNFC and PFC sectors for whole of government published financial reports
number 6 6 0
Quality
Maintain ISO 9001 (Quality Management Systems) Certification
per cent 100 100 0
Registered housing agencies that are annually reviewed
per cent 100 100 0
Timeliness
Analysis and review of corporate plans within two months of receipt
The 2015-16 outcome is higher than the 2015-16 target as a result of an increased focus on the timely review of corporate plans.
per cent 95 90 5.6
Advice provided to government on board appointments at least three months prior to an upcoming vacancy
per cent 100 100 0
Dividend payments made within agreed timeframes
per cent 100 100 0
Cost
Total output cost $ million 19.9 19.1 4.2

28 Department of Treasury and Finance Annual Report 2015 | 16
Revenue Management Services to Government This output provides revenue management services across the various state-based taxes in a fair and efficient manner for the benefit of all Victorians. By administering Victoria’s taxation legislation and collecting a range of taxes, duties and levies, this output contributes to the Department’s objective of sound financial management of the State’s fiscal resources.
Performance measures Unit of measure
2015-16 actual
2015-16 target
Performance variation (%)
Result
Quantity
Revenue assessed from compliance projects meets estimates
Business Intelligence analytics and automation have delivered efficiencies allowing resources to focus on areas most likely to be non-compliant. This coupled with increased landholder activity bolstered compliance revenue above target.
per cent 107 ≥90 0
Revenue collected as a percentage of budget target
per cent 99 ≥99 0
Quality
Customer satisfaction level per cent 96 ≥80 0
Maintain ISO 9001 (Quality management Systems) and ISO/IEC 20000–1:2005 (IT Service management) Certification
The 2015-16 outcome is lower than the 2015-16 target as the ISO Surveillance Audit was completed later than expected in the financial year. As audits are conducted every nine months, only two ISO Surveillance audits were conducted in 2015-16.
number 2 3 -33.3
Ratio of outstanding debt to total revenue per cent 1.19 <2 0
Timeliness
Meet Cabinet and Parliamentary timelines per cent 100 100 0
Revenue banked on day of receipt per cent 100 ≥99 0
Timely handling of objections (within 90 days) The 2015-16 outcome is higher than the 2015-16 target as a strong focus on process improvements has led to efficiency gains.
per cent 87 ≥80 0
Timely handling of private rulings (within 90 days)
The 2015-16 outcome is higher than the 2015-16 target as a strong focus on process improvements has led to efficiency gains.
per cent 87 ≥80 0
Cost
Total output cost $ million 92.2 93.8 -1.7
Department of Treasury and Finance Annual Report 2015 | 16 29
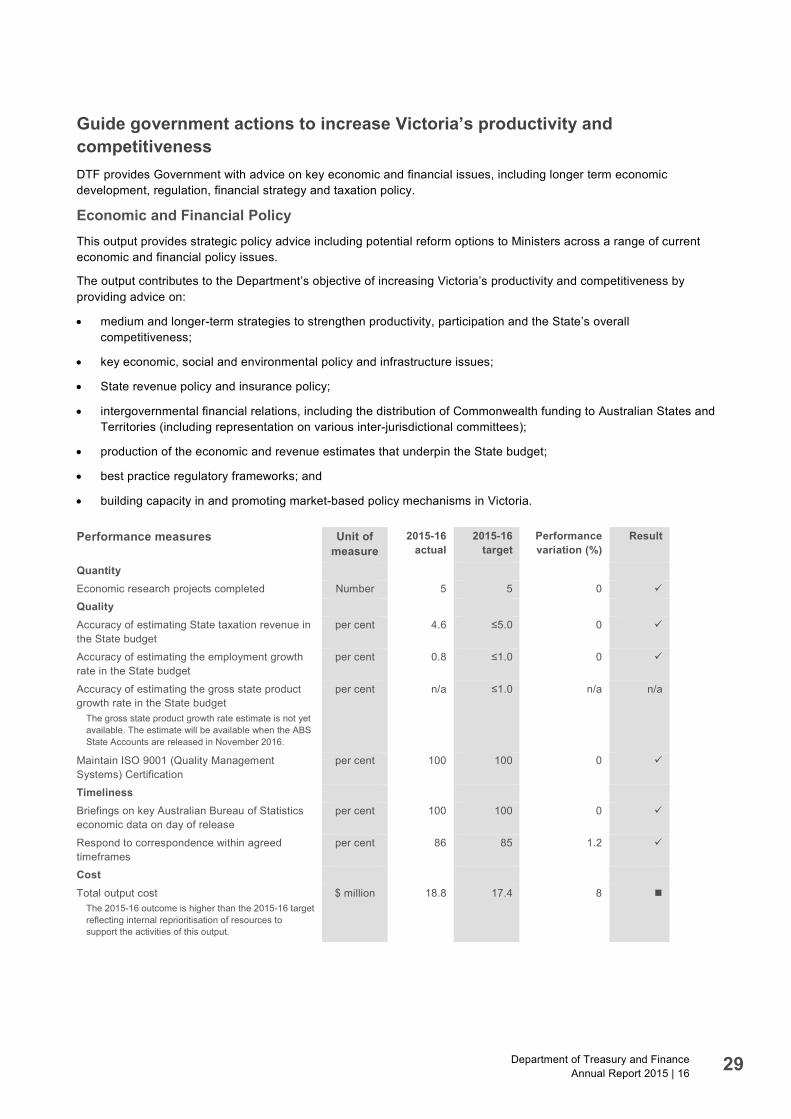
Guide government actions to increase Victoria’s productivity and competitiveness DTF provides Government with advice on key economic and financial issues, including longer term economic development, regulation, financial strategy and taxation policy.
Economic and Financial Policy This output provides strategic policy advice including potential reform options to Ministers across a range of current economic and financial policy issues.
The output contributes to the Department’s objective of increasing Victoria’s productivity and competitiveness by providing advice on:
• medium and longer-term strategies to strengthen productivity, participation and the State’s overall competitiveness;
• key economic, social and environmental policy and infrastructure issues;
• State revenue policy and insurance policy;
• intergovernmental financial relations, including the distribution of Commonwealth funding to Australian States and Territories (including representation on various inter-jurisdictional committees);
• production of the economic and revenue estimates that underpin the State budget;
• best practice regulatory frameworks; and
• building capacity in and promoting market-based policy mechanisms in Victoria.
Performance measures Unit of measure
2015-16 actual
2015-16 target
Performance variation (%)
Result
Quantity
Economic research projects completed Number 5 5 0
Quality
Accuracy of estimating State taxation revenue in the State budget
per cent 4.6 ≤5.0 0
Accuracy of estimating the employment growth rate in the State budget
per cent 0.8 ≤1.0 0
Accuracy of estimating the gross state product growth rate in the State budget
The gross state product growth rate estimate is not yet available. The estimate will be available when the ABS State Accounts are released in November 2016.
per cent n/a ≤1.0 n/a n/a
Maintain ISO 9001 (Quality Management Systems) Certification
per cent 100 100 0
Timeliness
Briefings on key Australian Bureau of Statistics economic data on day of release
per cent 100 100 0
Respond to correspondence within agreed timeframes
per cent 86 85 1.2
Cost
Total output cost The 2015-16 outcome is higher than the 2015-16 target reflecting internal reprioritisation of resources to support the activities of this output.
$ million 18.8 17.4 8

30 Department of Treasury and Finance Annual Report 2015 | 16
Economic Regulatory Services This output provides economic regulation of utilities and other specified markets in Victoria to protect the long-term interests of Victorian consumers with regard to price, quality and reliability of essential services. By providing these services, this output contributes to the departmental objective of guiding government actions to increase Victoria’s productivity and competitiveness.
Performance measures Unit of measure
2015-16 actual
2015-16 target
Performance variation (%)
Result
Quantity
New or revised regulatory instruments issued The 2015-16 outcome is lower than the 2015-16 target due to a reduced need to issue new or revised regulatory instruments than originally anticipated. This reduction impacted the Energy and Water Divisions.
number 5 8 -37.5
Performance reports for regulated businesses or industries
The 2015-16 outcome is higher than the 2015-16 target due to the publication of an additional report on the use of hardship funds granted to the metropolitan water retailers in the 2013 water price review.
number 7 6 16.7
Performance reviews and compliance audits of regulated businesses
number 108 106 1.9
Price approvals of regulated businesses The 2015-16 outcome is higher than the 2015-16 target as there were nine local government approvals for higher caps under the Fair Go Rates System which were not anticipated when the target was established.
number 29 20 45
Registration and accreditation decisions/approvals in relation to the Victorian Energy Efficiency Target (VEET) Scheme
The 2015-16 outcome is higher than the 2015-16 target due to more businesses participating and offering VEET services requiring additional approvals.
number 6 951 5 000 39
Reviews, investigations or advisory projects number 4 4 0
Quality
Decisions upheld where subject to review, appeal or disallowance
per cent 100 100 0
Timeliness
Delivery of major milestones within agreed timelines
per cent 100 100 0
Cost
Total output cost The 2015-16 outcome is higher than the 2015-16 target due to additional funding provided to implement the Fair Go Rates System.
$ million 18.9 17.6 7.4

Department of Treasury and Finance Annual Report 2015 | 16 31
Business Environment Policy Advice This output provides advice on ways the Government can improve the business environment. The output contributes to the departmental objective of guiding Government actions to increase Victoria’s productivity and competitiveness. This is achieved by the Commissioner for Better Regulation by:
• reviewing Regulatory Impact Statements, Legislative Impact Assessments, and providing advice for Regulatory Change Measurements;
• assisting agencies to improve the quality of regulation in Victoria and undertaking research into matters referred to it by the Government; and
• operating Victoria’s competitive neutrality unit.
Performance measures Unit of measure
2015-16 actual
2015-16 target
Performance variation (%)
Result
Quantity
Advice on adequacy of final Regulatory Impact Statements and Legislative Impact Assessments prepared by departments
The 2015-16 outcome is lower than the 2015-16 target as fewer impact assessments were submitted by departments.
number 33 35 -5.7
Timeliness
Completion of initial assessment of Regulatory Impact Statements and Legislative Impact Assessments within 10 working days of receipt
per cent 97 100 -3
Cost
Total output cost Components of the ‘Business Environment Policy Advice’ output transferred from the Department of Premier and Cabinet in September 2015. The 2015-16 target reflects the figure reported by the Department of Premier and Cabinet in the 2015-16 Budget and represents the functions of the former Victorian Competition and Efficiency Commission at that time. The 2015-16 outcome is lower than the 2015-16 target as it reflects the functions of the Office of the Commissioner for Better Regulation following its establishment within the Treasurer portfolio in September 2015.
$ million 1.8 4.2 -57.1

32 Department of Treasury and Finance Annual Report 2015 | 16
Drive improvements in public sector asset management and the delivery of infrastructure The Department of Treasury and Finance develops and applies prudent commercial principles and practices to influence and deliver Government policies. This promotes transparent and accountable commercial principles and practices throughout the public sector, and ensures that government-owned property assets are managed and used efficiently.
Land and Infrastructure Investment Management This output covers the provision of land and infrastructure advice and assistance to departments, Ministers and senior DTF management. It contributes to the Department’s objective of driving improvement in public sector asset management and the delivery of infrastructure by providing advice and assistance on:
• land purchases, sales, facilitation, leasing and management of contaminated sites;
• feasibility studies, business cases, procurement processes and contractual management of major projects and commercial transactions;
• policy to support project generation, development and delivery;
• development and implementation of services including policy, procedures and training in practices which govern new infrastructure investment; and
• medium to long-term asset investment planning and processes for investment decision making.
Performance measures Unit of measure
2015-16 actual
2015-16 target
Performance variation (%)
Result
Quantity
Develop and implement policies, procedures and training to govern and build capability to deliver infrastructure investment
The 2015-16 outcome is higher than the 2015-16 target due to additional work in the development of National Public Private Partnership Guidelines and market-led proposal guidance, training and presentations provided by Partnerships Victoria, Gateway Unit and for State Budget processes.
number 72 45 60
Gateway reviews undertaken to minimise Government’s exposure to project risks
The 2015-16 outcome is higher than the 2015-16 target as a result of a higher number of project reviews generated by the State’s infrastructure program.
number 70 50 40
Revenue from sale of surplus Government land including Crown land
The 2015-16 outcome is higher than the 2015-16 target as a result of property valuations from the Valuer-General being higher than expected.
$ million 133.4 124 7.6
Quality
Maintain ISO 9001 (Quality Management Systems) Certification
per cent 100 100 0
Cost
Total output cost The 2015-16 outcome is higher than the 2015-16 target due to additional funding provided for the Western Distributor project.
$ million 36.5 23.6 54.7

Department of Treasury and Finance Annual Report 2015 | 16 33
Deliver efficient whole of government common services to the Victorian public sector The Department of Treasury and Finance assists Government agencies in providing a more integrated approach to the management of common services.
Resource Management Services to Government This output delivers whole of government services, policies and initiatives in areas including procurement, fleet and accommodation.
The output contributes to the Department’s objective of delivering efficient whole of government common services to the Victorian public sector by:
• developing and maintaining a framework of whole of government policies, standards and guidelines, which promote the efficient and effective use of common services including procurement, fleet and accommodation;
• implementing a program of whole of government procurement and contract management to ensure optimum benefit to government;
• supporting the operations of the Victorian Government Purchasing Board, facilitating the approval of major government procurements and developing procurement capability across government; and
• providing whole of government fleet and accommodation.
Performance measures Unit of measure
2015-16 actual
2015-16 target
Performance variation (%)
Result
Quantity
Total accommodation cost The 2015-16 outcome is better than the 2015-16 target. The reduction in total accommodation cost has been achieved through effectively re-negotiating leases and consolidating existing accommodation occupancies across the Shared Service Provider managed portfolio.
$ per square
metre per year
380 405 -6.2
Workspace ratio The 2015-16 outcome is better than the 2015-16 target. The reduction in the workspace ratio has been achieved through a combination of consolidation and reconfiguring workspace across a range of properties within the Shared Service Provider managed portfolio.
square metre per
FTE
13.4 15 -10.7
Quality
Benefits delivered as a percentage of expenditure by mandated agencies under DTF-managed state purchasing contracts, including reduced and avoided costs
The 2015-16 outcome is better than the target due to increased benefits derived from new contracts and cost saving initiatives in existing contracts.
per cent 8.1 5 62
Client agencies’ satisfaction with the service provided by the Shared Service Provider
The 2015-16 outcome is higher than the 2015-16 target as a result of the Shared Service Provider increasing its focus on customer and stakeholder engagement.
per cent 78.4 70 12
Maintain ISO 9001 (Quality Management Systems) Certification
per cent 100 100 0
Cost
Total output cost The 2015-16 outcome is lower than the 2015-16 target due to lower depreciation costs on government-owned buildings.
$ million 39.6 44.7 -11.4

34 Department of Treasury and Finance Annual Report 2015 | 16
Budget portfolio outcomes The budget portfolio outcomes statements provide a comparison between the actual financial information of all general government entities within the portfolio and the forecasted financial information published in the budget papers. The budget portfolio outcomes comprise the comprehensive operating statement, balance sheet, statement of changes in equity, cash flow statement, and administered items statement.
The budget portfolio outcomes have been prepared on a consolidated basis and include all general government entities within the portfolio. Financial transactions and balances are classified into either controlled or administered, consistent with the published statements in the budget papers.
The following budget portfolio outcomes statements are not subject to audit by the Victorian Auditor-General’s Office. They are not prepared on the same basis as the Department’s financial statements as they include the consolidated financial information of Essential Services Commission and CenITex in addition to that of the Department. Essential Services Commission and CenITex are not consolidated in the Department’s audited financial statements enclosed within this annual report, as they prepare separate annual reports for tabling in Parliament. Further, the Department’s audited financial statements include certain whole of government transactions, as referred to in Note 22. Otherwise, albeit in different format, the following statements are reflective of the audited financial statements.

Department of Treasury and Finance Annual Report 2015 | 16 35
Budget portfolio outcomes Comprehensive operating statement for the year ended 30 June 2016
Controlled 2015-16
actual 2015-16 budget Variation
$m $m %
Income from transactions
Output appropriations 255.4 242.7 5.2
Interest 1.8 0.4 350.0
Sale of goods and services 166.6 154.8 7.6
Grants 0.2 – n/a
Fair value of assets and services received free of charge or for nominal consideration
0.4 5.0 (92.0)
Other income 23.1 29.3 (21.2)
Total income from transactions 447.5 432.2 3.5
Expenses from transactions
Employee benefits 182.7 183.5 (0.4)
Depreciation 53.1 62.7 (15.3)
Interest expense 0.1 0.2 (50.0)
Grants and other transfers 5.7 5.5 3.6
Capital asset charge 21.2 21.2 –
Other operating expenses 172.7 159.4 8.3
Total expenses from transactions 435.5 432.5 0.7 Net result from transactions 12.0 (0.3) (4 100.0)
Other economic flows included in net result
Net loss/(gain) on non-financial assets (0.3) – n/a
Net gain/(loss) on financial instruments and statutory receivables/payables
0.5 (1.0) (150.0)
Other gains/(losses) from other economic flows (2.2) – n/a
Total other economic flows included in net result (2.0) (1.0) 100.0 Net result 10.0 (1.3) (869.2)
Other economic flows – other comprehensive income (a) 67.8 29.7 128.3 Comprehensive result 77.8 28.4 173.9
Note:
(a) The variance is due to higher than expected valuation increments resulting from the managerial revaluation of land assets during the year in accordance with FRD 103F.

36 Department of Treasury and Finance Annual Report 2015 | 16
Budget portfolio outcomes Balance sheet as at 30 June 2016
Controlled 2016
actual 2016
budget Variation
$m $m %
Financial assets
Cash and deposits 86.9 105.0 (17.2)
Receivables 239.9 222.6 7.8
Other financial assets 33.0 – n/a
Total financial assets 359.8 327.6 9.8
Non-financial assets
Inventories (a) 9.0 – n/a
Property, plant and equipment (b) 588.8 540.6 8.9
Intangible assets 18.8 35.3 (46.7)
Other assets 16.4 16.8 (2.4)
Total non-financial assets 633.0 592.7 6.8 Total assets 992.8 920.3 7.9
Liabilities
Payables (c) 125.0 99.6 25.5
Borrowings 4.1 4.5 (8.9)
Provisions 54.4 52.5 3.6
Total liabilities 183.5 156.6 17.2 Net assets 809.3 763.7 6.0
Equity
Contributed capital 366.1 369.8 (1.0)
Reserves (b) 309.2 266.8 15.9
Accumulated surplus 134.0 127.1 5.4
Total equity 809.3 763.7 6.0
Notes:
(a) The variance is due to the reclassification of various property assets as held for sale.
(b) Variance reflects the managerial revaluation of land assets during the year in accordance with FRD 103F.
(c) The variance reflects an increase in advances held for capital works on behalf of other departments.

Department of Treasury and Finance Annual Report 2015 | 16 37
Budget portfolio outcomes Cash flow statement for the year ended 30 June 2016
Controlled 2015-16
actual 2015-16 budget Variation
$m $m %
Cash flows from operating activities
Receipts from government 206.5 206.7 (0.1)
Receipts from other entities – (1.0) (100.0)
Goods and Services Tax recovered from the ATO 0.7 – n/a
Interest received 1.8 0.4 350.0
Other receipts 227.9 193.5 17.8
436.9 399.6 9.3
Payments of grants and other transfers (17.0) (14.9) (14.1)
Payments to suppliers and employees (353.6) (328.5) (7.6)
Goods and Services Tax paid to the ATO – – n/a
Capital asset charge (21.2) (21.2) –
Interest and other finance costs (0.1) (0.2) 50.0
(391.9) (364.8) (7.4) Net cash flows from operating activities 45.0 34.8 29.3
Cash flows from investing activities
Net investment (33.0) – n/a
Net payments for non-financial assets (28.1) (37.6) 25.3
Proceeds from sale of non-financial assets 1.1 – n/a
Net loans to other parties – – n/a
Net cash flows used in investing activities (60.0) (37.6) (59.6) Cash flows from financing activities
Owner contributions by State government – 4.2 (100.0)
Cash received from administrative restructure 0.1 – n/a
Net borrowings (2.7) (0.9) 200.0 Net cash flows from financing activities (2.6) 3.3 (178.8)
Net increase in cash held (17.6) 0.5 (3 620.0)
Cash at the beginning of the financial year 104.5 104.5 –
Cash at the end of the financial year 86.9 105.0 (17.2)

38 Department of Treasury and Finance Annual Report 2015 | 16
Budget portfolio outcomes Statement of changes in equity for the year ended 30 June 2016
Controlled 2015-16
actual 2015-16 budget Variation
$m $m %
Contributed capital
Opening balance 368.0 368.0 –
Transactions with owners in their capacity as owners (1.9) 1.8 (205.6) Closing balance 366.1 369.8 (1.0) Reserves
Opening balance 237.1 237.1 –
Comprehensive result (a) 72.1 29.7 142.8 Closing balance 309.2 266.8 15.9 Accumulated surplus
Opening balance 128.3 128.3 –
Comprehensive result 10.0 (1.3) (869.2)
Transactions with owners in their capacity as owners (4.3) 0.1 (4 400.0) Closing balance 134.0 127.1 5.4 Total equity 809.3 763.7 6.0
Note:
(a) The variance reflects the managerial revaluation of land assets during the year in accordance with FRD 103F.

Department of Treasury and Finance Annual Report 2015 | 16 39
Budget portfolio outcomes Administered items statement for the year ended 30 June 2016
2015-16 actual
2015-16 budget Variation
$m $m %
Administered income from transactions
Appropriations – payments made on behalf of the State (a) 1 758.7 2 773.2 (36.6)
Special appropriations (b) 2 191.6 2 415.4 (9.3)
Interest 24.8 68.3 (63.7)
Sales of goods and services 13.3 39.5 (66.3)
Grants 19 714.7 20 122.1 (2.0)
Other income 21 493.3 20 910.7 2.8
Total administered income from transactions 45 196.4 46 329.2 (2.4)
Administered expenses from transactions
Expenses on behalf of the State (c) 516.9 298.5 73.2
Employee benefits 1 213.0 1 610.1 (24.7)
Grants and other transfers 3 246.9 3 550.5 (8.6)
Interest expense 1 267.8 1 275.1 (0.6)
Payments into Consolidated Fund 38 371.9 39 158.6 (2.0)
Total administered expenses from transactions 44 616.5 45 892.8 (2.8) Net result from transactions 579.9 436.4 32.9
Other economic flows included in net result
Net gain/(loss) on non-financial assets (0.1) – n/a
Net gain/(loss) on financial instruments and statutory receivables/payables (d)
105.5 16.9 1 110.0
Other gains/(losses) from other economic flows (56.2) – n/a
Total other economic flows included in net result 49.2 16.9 191.1 Net result 629.1 453.3 38.8
Other economic flows – other non-owner changes in equity
Remeasurement of superannuation defined benefit plans (e) (3 220.3) 962.4 (434.6) Total other economic flows – other non-owner changes in equity
(3 220.3) 962.4 (434.6)
Comprehensive result (2 591.2) 1 415.7 (283.0)
Administered assets
Cash and deposits (f) 1 637.3 1 816.0 (9.8)
Receivables (f) 1 253.4 1 735.0 (27.8)
Other financial assets (f) – 876.0 (100.0)
Property, plant and equipment – 41.0 (100.0)
Other non-financial assets – 1.0 (100.0)
Total administered assets 2 890.7 4 469.0 (35.3)

40 Department of Treasury and Finance Annual Report 2015 | 16
2015-16 actual
2015-16 budget Variation
$m $m %
Administered liabilities
Payables (f) 531.7 461.0 15.3
Borrowings 25 470.3 27 688.0 (8.0)
Provisions 48.5 68.0 (28.7)
Superannuation (e) 29 289.0 25 003.0 17.1
Total administered liabilities 55 339.5 53 220.0 4.0
Notes:
(a) The budget for the Department includes the estimate for Treasurer’s Advances which may be provided during the year to all departments. This includes both the appropriation revenue and the underlying expenditure.
(b) Appropriation for refinancing of borrowings was not required to the extent budgeted.
(c) The variation against budget in expenses on behalf of the State mainly relates to the forgiveness of debt granted by the Treasurer to the Director of Housing.
(d) The variation in net gain/(loss) on financial instruments mainly reflects realised gains in the investment in government business enterprises as part of a return of capital to the State.
(e) The variations in the remeasurement of superannuation defined benefit plans and the associated superannuation liability were largely driven by the impact of movements in the bond yields used to measure the superannuation liability.
(f) The variations in cash assets, receivables, other financial assets and payables reflect variations in operational funding requirements.

Department of Treasury and Finance Annual Report 2015 | 16 41
Financial performance Overview The Department recorded a surplus of $1.5 million in 2015-16 compared to $6.4 million in 2014-15.
Total assets of the Department increased from $771 million to $863 million during the year largely due to a $72 million upward revaluation of the Department’s land assets. The major assets of the Department at 30 June 2016 are land and buildings ($544 million), funds held in trust ($76 million) and the Department’s receivable from the State Administration Unit ($187 million).
Total liabilities increased from $112 million to $138 million. The Department’s major liabilities are accounts payable, employee provisions and advances received from other departments for capital works managed by the Department on their behalf.
Core operations The best indicator of the scale and efficiency of core Departmental operations is the revenue paid by Government for DTF outputs. This has increased this year to $255.4 million, from $250.7 million in 2014-15. The increase in the ‘sound financial management of Victoria's fiscal resources’ output below is mainly attributable to additional funding for SRO’s compliance activities.
The following table details operational revenue by output group.
Revenue from the provision of outputs(a)
Output group 2015-16
$m 2014-15
$m Change
$m
Sound financial management of Victoria's fiscal resources
118 111 7
Drive improvement in public sector asset management and the delivery of infrastructure
56 58 -2
Deliver efficient whole of government common services to the Victorian public sector
40 45 -5
Guide government actions to increase Victoria’s productivity and competitiveness
41 37 4
Total 255 251 4
Note:
(a) Includes only Parliamentary appropriations.
Five year financial summary: Departmental (controlled) activities 2015-16(a)(b)
$m 2014-15(b)
$m 2013-14
$m 2012-13
$m 2011-12(a)
$m
Government output appropriations income 255 251 255 246 239
Government other appropriations income – – – 2 –
Other income 52 51 52 52 54
Total income from transactions 307 302 307 300 293
Total expenses from transactions (305) (295) (290) (295) (283)
Net result from transactions 2 7 17 5 10
Total other economic flows included in net result (1) (1) 1 – –
Net result 1 6 18 5 10
Net cash flow from operations 23 25 11 16 30
Total assets 863 771 770 749 766 Total liabilities 138 112 116 113 133
Note:
(a) 2011-12 and 2015-16 asset balances were impacted by asset valuations during the year.
(b) In 2015-16, certain assets and liabilities were reclassified to more appropriately reflect their nature. The corresponding comparatives in 2014-15 have been adjusted accordingly.

42 Department of Treasury and Finance Annual Report 2015 | 16
Capital projects/asset investment programs The Department and its related portfolio entities manage a range of capital projects to deliver services for government.
Information on the new and existing capital projects for Departments and the broader Victorian public sector is contained in Budget Paper No. 4 State Capital Program, which is available on DTF’s website.
No major projects with a total estimated investment of $10 million or greater were completed during the year.
Style conventions Figures in the tables and in the text have been rounded. Discrepancies in tables between totals and sums of components reflect rounding. Percentage variations in all tables are based on the underlying unrounded amounts.
The notation used in the tables is as follows:
.. or – zero, or rounded to zero
1 billion 1 000 million
200x year period
200x-0x year period
n/a not available or not applicable
(xxx.x) negative numbers

Department of Treasury and Finance Annual Report 2015 | 16 43
Financial statements Contents Comprehensive operating statement ................................................................................ 44
Balance sheet ...................................................................................................................... 45
Statement of changes in equity ......................................................................................... 46
Cash flow statement ........................................................................................................... 47
Notes to financial statements ............................................................................................ 48 Note 1. Summary of significant accounting policies ................................................................. 48 Note 2. Departmental outputs ................................................................................................. 64 Note 3. Income from transactions............................................................................................ 68 Note 4. Summary of compliance with annual Parliamentary and special appropriations .......... 68 Note 5. Expenses from transactions ........................................................................................ 72 Note 6. Receivables ................................................................................................................ 73 Note 7. Non-financial assets classified as held for sale ........................................................... 73 Note 8. Property, plant and equipment .................................................................................... 75 Note 9. Intangible assets ........................................................................................................ 81 Note 10. Payables .................................................................................................................... 82 Note 11. Provisions ................................................................................................................... 82 Note 12. Borrowings ................................................................................................................. 83 Note 13. Leases ....................................................................................................................... 84 Note 14. Financial instruments .................................................................................................. 85 Note 15. Commitments for expenditure ..................................................................................... 90 Note 16. Contingent liabilities and contingent assets ................................................................. 90 Note 17. Responsible persons .................................................................................................. 92 Note 18. Remuneration of executives ....................................................................................... 93 Note 19. Remuneration of auditors............................................................................................ 94 Note 20. Superannuation .......................................................................................................... 94 Note 21. Cash flow information ................................................................................................. 95 Note 22. Administered items ..................................................................................................... 97 Note 23. Trust account balances ............................................................................................. 104 Note 24. Machinery of government changes ........................................................................... 107 Note 25. Glossary of terms ..................................................................................................... 108
Accountable Officer’s and Chief Financial Officer’s declaration .................................. 111

44 Department of Treasury and Finance Annual Report 2015 | 16
Comprehensive operating statement for the year ended 30 June 2016 2016 2015
Notes $’000 $’000
Income from transactions
Output appropriations 4(a) 255 392 250 713
Other income 3 52 270 51 009 Total income from transactions 307 662 301 722 Expenses from transactions
Employee expenses 5 113 766 114 465
Depreciation 5 35 422 32 205
Interest expense 100 55
Grants expense 5 25 326 22 736
Capital asset charge 21 149 21 120
Supplies and services 5 96 456 92 252
Payments to Consolidated Fund 5 12 923 12 330 Total expenses from transactions 305 142 295 163
Net result from transactions 2 520 6 559
Other economic flows included in net result Net loss on financial instruments (2) –
Net gain on non-financial assets 126 34
Net loss from revaluation of leave liabilities (1 180) (135) Total other economic flows included in net result (1 056) (101) Net result 1 464 6 458
Other economic flows – other comprehensive income Changes in physical asset revaluation surplus 72 126 –
Comprehensive result 73 590 6 458
The above comprehensive operating statement should be read in conjunction with the accompanying notes.

Department of Treasury and Finance Annual Report 2015 | 16 45
Balance sheet as at 30 June 2016 2016 2015
Notes $’000 $’000
Assets Financial assets
Cash and deposits 21(a) 75 608 66 418
Receivables 6 212 468 171 921 Total financial assets 288 076 238 339 Non-financial assets
Prepayments 2 833 3 261
Non-financial assets classified as held for sale 7 8 986 31
Property, plant and equipment 8 549 063 500 104
Intangible assets 9 14 234 29 513 Total non-financial assets 575 116 532 909 Total assets 863 192 771 248 Liabilities
Payables 10 44 554 29 708
Provisions 11 35 944 32 754
Unearned income 3 106 3 255
Advances for capital works 49 703 41 513
Borrowings 12 4 915 4 650 Total liabilities 138 222 111 880 Net assets 724 970 659 368 Equity
Contributed capital 236 237 244 225
Asset revaluation surplus 309 226 237 100
Accumulated surplus 179 507 178 043 Total equity 724 970 659 368
The above balance sheet should be read in conjunction with the accompanying notes.

46 Department of Treasury and Finance Annual Report 2015 | 16
Statement of changes in equity for the year ended 30 June 2016
Contributed capital
Asset revaluation
surplus Accumulated
surplus Total
Notes $’000 $’000 $’000 $’000
Balance at 1 July 2014 245 411 237 100 171 585 654 096
Capital appropriations 4(a) 5 000 5 000
Machinery of government changes (192) (192)
Return of capital (5 994) (5 994)
Revaluation increment (net) – –
Net result for the year 6 458 6 458
Balance at 30 June 2015 244 225 237 100 178 043 659 368 Capital appropriations Machinery of government changes 538 538 Return of capital (8 526) (8 526) Revaluation increment (net) 72 126 72 126 Net result for the year 1 464 1 464 Balance at 30 June 2016 236 237 309 226 179 507 724 970
The above statement of changes in equity should be read in conjunction with the accompanying notes.

Department of Treasury and Finance Annual Report 2015 | 16 47
Cash flow statement for the year ended 30 June 2016 2016 2015
Notes $’000 $’000
Cash flows from operating activities
Receipts from government 277 287 261 920
Receipts from other entities 13 793 37 525
Goods and services tax recovered from the ATO 10 123 12 555
301 203 312 000
Payments to suppliers and employees (233 013) (243 332)
Grants paid (23 673) (22 116)
Capital asset charge paid (21 149) (21 120)
Interest and other finance costs paid (100) (55)
(277 935) (286 623)
Net cash flows from operating activities 21(b) 23 268 25 377
Cash flows from investing activities
Payments for property, plant and equipment (8 807) (2 692)
Proceeds from sale of property, plant and equipment 994 1 390
Payments for intangible assets (5 065) (21 488)
Net cash flows used in investing activities (12 878) (22 790) Cash flows from financing activities
Cash received from activity transferred in – machinery of government changes
366
Owner contributions by State Government – 5 000
Repayment of finance lease liabilities (2 098) (2 366)
Net cash flows from/(used in) financing activities (1 732) 2 634 Net increase in cash and cash equivalents 8 658 5 221
Cash and cash equivalents at the start of the year 66 017 60 796
Cash and cash equivalents at the end of the year 21(a) 74 675 66 017 Non-cash financing and investing activities 21(c)
The above cash flow statement should be read in conjunction with the accompanying notes.

48 Department of Treasury and Finance Annual Report 2015 | 16
Notes to financial statements Note 1. Summary of significant accounting policies (a) Statement of compliance These general purpose financial statements have been prepared in accordance with the Financial Management Act 1994 and applicable Australian Accounting Standards (AASs) including Interpretations, issued by the Australian Accounting Standards Board (AASB). In particular, they are presented in a manner consistent with the requirements of AASB 1049 Whole of Government and General Government Sector Financial Reporting. Where relevant, those paragraphs of the AASs applicable to not-for-profit entities have been applied.
Accounting policies are selected and applied in a manner which ensures that the resulting financial information satisfies the concepts of relevance and reliability, thereby ensuring that the substance of the underlying transactions or other events is reported.
(b) Basis of preparation The accrual basis of accounting has been applied in the preparation of these financial statements, whereby assets, liabilities, equity, income and expenses are recognised in the reporting period to which they relate, regardless of when cash is received or paid.
Judgements, estimates and assumptions are required to be made about carrying values of assets and liabilities that are not readily apparent from other sources. The estimates and associated assumptions are based on professional judgements derived from historical experience and various other factors that are believed to be reasonable under the circumstances. Actual results may differ from these estimates.
Revisions to accounting estimates are recognised in the period in which the estimate is revised and also in future periods that are affected by the revision. Judgements and assumptions made by management in the application of AASs that have significant effects on the financial statements relate to:
• the estimated useful lives and fair value of land, buildings, plant and equipment (Note 1(i));
• actuarial assumptions for superannuation expense and liability (Note 22);
• employee benefit provisions based on likely tenure of existing staff, patterns of leave claims, future salary movements and future discount rates (Note 1(j)). During the year the department reassessed the assumptions used in discounting future payments of long service leave liabilities to their present value and realigned the methodology applied across the department. The net financial effect of this reassessment in the current financial year was an increase in the net loss from revaluation of leave liabilities of $1.0 million; and
• the Department’s assessment of the requirement to consolidate entities into the financial statements in accordance with AASB 10.
The financial statements are presented in Australian dollars, and prepared in accordance with the historical cost convention. Historical cost is based on the fair values of the consideration given in exchange for assets. Exceptions to the historical cost convention include:
• non-financial physical assets, which subsequent to acquisition, are measured at a revalued amount being their fair value at the date of revaluation less any subsequent depreciation and impairment losses. Revaluations are made with sufficient regularity such that the carrying amounts do not materially differ from their fair value; and
• certain liabilities that are calculated with regard to actuarial assessments.
Consistent with AASB 13 Fair Value Measurement, the Department of Treasury and Finance (the Department) determines the policies and procedures for both recurring fair value measurements such as property, plant and equipment and financial instruments and for non-recurring fair value measurements such as non-financial physical assets held for sale, in accordance with the requirements of AASB 13 and the relevant Financial Reporting Directions.

Department of Treasury and Finance Annual Report 2015 | 16 49
All assets and liabilities for which fair value is measured or disclosed in the financial statements are categorised within the fair value hierarchy, described as follows, based on the lowest level input that is significant to the fair value measurement as a whole:
• Level 1 – Quoted (unadjusted) market prices in active markets for identical assets or liabilities;
• Level 2 – Valuation techniques for which the lowest level input that is significant to the fair value measurement is directly or indirectly observable; and
• Level 3 – Valuation techniques for which the lowest level input that is significant to the fair value measurement is unobservable.
For the purpose of fair value disclosures, the Department has determined classes of assets and liabilities on the basis of the nature, characteristics and risks of the asset or liability and the level of the fair value hierarchy as explained above.
In addition, the Department determines whether transfers have occurred between levels in the hierarchy by re-assessing categorisation (based on the lowest level input that is significant to the fair value measurement as a whole) at the end of each reporting period.
The Valuer-General Victoria (VGV) is the Department’s independent valuation agency. The Department, in conjunction with the VGV, monitors changes in the fair value of its assets through relevant data sources to determine whether revaluation is required.
The accounting policies set out below have been applied in preparing the financial statements.
(c) Reporting entity The financial statements cover the Department as an individual reporting entity. The Department is a government department of the State of Victoria.
Its principal address is:
1 Treasury Place Melbourne, Victoria, 3002
The Department is an administrative agency acting on behalf of the Crown.
The financial statements include all the controlled activities of the Department. This includes the transactions and balances of the following controlled trust accounts:
Trust account Purpose Finance Agency Trust – Financial Management Act 1994
To record the receipt of funds from client departments and agencies pending disbursement for fitout works, minor and major capital works, construction and construction related works and general projects undertaken on their behalf.
Government Accommodation Trust – Financial Management Act 1994
To receive all rents and pay all outgoings associated with the management of properties administered by the Department and to fund minor capital works.
Industry Supervision Fund – Financial Sector Reform (Victoria) Act 1999
To facilitate the registration of financial institutions made under the Financial Sector Reform Act.
Shared Corporate Services Trust Account – Financial Management Act 1994
To record receipts and payments for shared corporate services, including, but not limited to, the operations of the Shared Service Provider.
Treasury Trust – Financial Management Act 1994
To record the Department’s receipt and disbursement of unclaimed and unidentified monies and other funds held in trust.
Vehicle Lease Trust – Financial Management Act 1994
To record transactions relating to the Department’s vehicle pool.
Master Agency Media Services Trusts (MAMS) – Financial Management Act 1994 (a)
To record the receipt of service fees and disbursement of media related expenses under the MAMS contract.
Note:
(a) The MAMS trust was transferred from the Department of Premier and Cabinet effective 1 July 2015 following the approval of the Special Minister of State.
The Essential Services Commission and CenITex, which are part of the Department’s portfolio, prepare separate annual financial statements and are not included in the Department’s financial statements.
Pursuant to section 53(1)(b) of the Financial Management Act 1994, the results of the Registrar of Housing Agencies and the Victorian Government Purchasing Board are reported in aggregate as part of the Department’s financial statements. These entities are not controlled by the Department.

50 Department of Treasury and Finance Annual Report 2015 | 16
Administered resources
The Department administers, but does not control, certain resources on behalf of the Crown, for example taxes raised by the State Revenue Office. It is accountable for the transactions involving those administered resources, but does not have the discretion to deploy the resources for its own benefit or for the achievement of its objectives.
Accordingly, transactions and balances relating to these administered resources are not recognised as departmental income, expenses, assets or liabilities within the body of the financial statements, but are disclosed separately in Note 22. Except as otherwise disclosed, administered transactions are accounted for on an accrual basis using the same accounting policies adopted for recognition of departmental items in the financial statements.
The administered activities of the Department include the following administered trust accounts:
Trust account Purpose
Asset Sales Deposit Trust Account – Financial Management Act 1994
To record the receipt of deposits lodged in connection with asset sales and their disbursement in accordance with the terms of settlement.
Cattle Compensation Fund – Livestock Disease Control Act 1994
To receive stamp duties paid by agents relating to sale of cattle, and fines and monies received from the Commonwealth; and make payments including compensation claims from graziers, and costs of transportation and destruction of condemned cattle.
Community Support Fund Trust – Gaming Machine Control Act 1991
To record the receipt (under special appropriations) of certain gambling revenues and the disbursement of these funds in accordance with the requirements of the Act, including the funding of gambling research and various community programs.
Debt Portfolio Trust – Financial Management Act 1994
To facilitate the recording of the cash transactions associated with Public Account borrowings and their management, aimed at enhancing administrative and operational efficiency.
Land Acquisition and Compensation Trust – Land Acquisition and Compensation Act 1986
To hold land compensation monies where claimant not found.
Trust account Purpose
Public Service Commuter Club Trust – Financial Management Act 1994
To record the receipt and payment of amounts relating to the purchase of rail tickets and associated reimbursement from Club members.
Security Trust – Financial Management Act 1994
To hold securities lodged by contractors to various departments as a guarantee of satisfactorily fulfilling contractual obligations.
Sheep And Goat Compensation Fund – Livestock Disease Control Act 1994
To receive stamp duties paid by agents relating to sale of sheep and goats, and fines and monies received from the Commonwealth; and make payments including compensation claims from graziers, and costs of transportation and destruction of condemned sheep and goats.
Swine Compensation Trust – Livestock Disease Control Act 1994
To receive stamp duties, penalties and other monies relating to the sale of pigs and to make payments including compensation claims and costs of transportation and destruction of condemned pigs.
Treasury Trust – Financial Management Act 1994
To record, on behalf of the State, the receipt and disbursement of unclaimed and unidentified monies and other funds held in trust.
Vehicle Lease Trust – Financial Management Act 1994
To record transactions relating to the Government’s vehicle pool and fleet management operations.
Victorian Natural Disasters Relief Account – Financial Management Act 1994
To record the receipt and disbursement of funds in connection with natural disasters in Victoria.
Victorian Transport Fund – Delivering Victorian Infrastructure (Port of Melbourne Lease Transaction) Act 2016
To fund infrastructure projects for or in relation to public transport, roads, rail, the movement of freight, ports or other infrastructure (including regional infrastructure).

Department of Treasury and Finance Annual Report 2015 | 16 51
Objectives and funding
In 2015-16, the Department continued to pursue its mission of providing leadership in economic, financial and resource management. This leadership focus is reflected in the Department’s long-term operational objectives, which guide its policy directions:
• sound financial management of Victoria’s fiscal resources;
• guide government actions to increase Victoria’s productivity and competitiveness;
• drive improvement in public sector asset management and the delivery of infrastructure; and
• deliver efficient whole of government common services to the Victorian public sector.
The Department is predominantly funded by accrual-based Parliamentary appropriations for the provision of outputs.
Outputs of the Department
Information about the Department’s output activities, and the expenses, income, assets and liabilities which are reliably attributable to those activities, is set out in the departmental outputs schedules (Note 2). Information about expenses, income, assets and liabilities administered by the Department are given in the schedule of administered income and expenses and the schedule of administered assets and liabilities (Note 22).
As a result of machinery of government changes effective 22 September 2015, the secretariat supporting the former Victorian Competition and Efficiency Commission (VCEC) was transferred to the Department of Treasury and Finance from the Department of Premier and Cabinet to support the new Commissioner for Better Regulation.
(d) Scope and presentation of financial statements
Comprehensive operating statement
The comprehensive operating statement comprises three components, being ‘net result from transactions’, ‘other economic flows included in net result’, and ‘other economic flows – other comprehensive income’. The sum of the first two represents the net result, which is equivalent to profit and loss derived in accordance with AASs.
This classification is consistent with the whole of government reporting format and is allowed under AASB 101 Presentation of Financial Statements.
Balance sheet
Assets and liabilities are presented in liquidity order with assets aggregated into financial assets and non-financial assets. Current and non-current assets and liabilities are disclosed in the notes, where relevant. Non-current assets or liabilities are those expected to be recovered or settled more than 12 months after the reporting period, except for the provisions of employee benefits, which are classified as current liabilities if the Department does not have the unconditional right to defer the settlement of the liabilities.
Statement of changes in equity
The statement of changes in equity presents reconciliations of non-owner and owner changes in equity from opening balance at the beginning of the year to the closing balance at the end of the year. It also shows separately changes due to amounts recognised in the comprehensive result and amounts recognised in ‘other economic flows – other movements in equity’ related to transactions with the owner in its capacity as owner.
Cash flow statement
Cash flows are classified according to whether they arise from operating, investing, or financing activities. This classification is consistent with requirements under AASB 107 Statement of Cash Flows. For purposes of the cash flow statement, cash and cash equivalents include bank overdrafts, which are included as borrowings on the balance sheet (Note 21a).
(e) Income from transactions
Income is recognised to the extent that it is probable that the economic benefits will flow to the Department and the income can be reliably measured. Amounts disclosed as income are, where applicable, net of duties and taxes. Income is recognised for each of the Department’s major activities as follows:

52 Department of Treasury and Finance Annual Report 2015 | 16
Appropriation income
Appropriated income becomes controlled and is recognised by the Department when it is appropriated from the Consolidated Fund by the Victorian Parliament and applied to the purposes defined under the relevant Appropriation Act. Additionally, the Department is permitted under section 29 of the Financial Management Act 1994 to have certain revenues annotated to the annual appropriation. The revenues which form part of a section 29 agreement are recognised and paid into the Consolidated Fund by the Department as administered income (Note 22). When the revenue is recognised, section 29 provides for an equivalent amount to be added to the annual appropriation authority, which is then available for application by the Treasurer. Examples of revenues which can form part of a section 29 agreement are revenues from sales of products and services, Commonwealth specific purpose grants and the proceeds from the sale of assets.
Output appropriations
Revenue from the outputs the Department provides to Government is recognised when those outputs have been delivered and the relevant Minister has certified delivery of those outputs in accordance with specified performance criteria.
Special appropriations
Special appropriations income is recognised when the amount appropriated for the purpose specified under the relevant legislation is due and payable by the Department.
Other income
Provision of services
Income from the provision of services where they can be deployed for the achievement of departmental objectives, is recognised when the services are provided.
Rental accommodation income
Income from the provision of rental accommodation to government departments and agencies is accounted for on a straight line basis over the lease term.
Resources received free of charge
Contributions of resources received free of charge or for nominal consideration are recognised at fair value when control is obtained over them, irrespective of whether these contributions are subject to restrictions or conditions over their use. Contributions in the form of services are only recognised when a fair value can be reliably determined and the services would have been purchased if not received as a donation.
Grants income
Income from grants (other than contributions by owners) is recognised when the Department obtains control over the contribution. Where such grants are payable into the Consolidated Fund, they are reported as administered income (Note 22). Where grants are reciprocal (i.e. equal value is given by the Department to the provider), the Department is deemed to have assumed control when it has satisfied its performance obligations under the terms of the grant. Non-reciprocal grants are recognised as income when the grant is received or receivable. Conditional grants may be reciprocal or non-reciprocal depending on the terms of the grant.
The Department’s administered grants mainly comprise funds provided by the Commonwealth to assist the State in meeting general or specific service delivery obligations, primarily for the purpose of aiding in the financing of operations, capital purposes and/or for on passing to other recipients.
(f) Expenses from transactions
Employee expenses
Employee expenses comprise all costs related to employment including wages and salaries, superannuation, fringe benefits tax, leave entitlements, redundancy payments and WorkCover premiums.
Superannuation expenses represent the employer contributions for members of both defined benefit and defined contribution superannuation plans that are paid or payable during the reporting period.
The Department discloses, on behalf of the State as the sponsoring employer, the net defined benefit cost and the defined benefit liability or surplus related to the members of these plans as administered items (Note 22).
Depreciation
All buildings, plant and equipment and other non-financial physical assets, excluding assets held for sale, that have finite useful lives are depreciated. Depreciation is calculated on a straight line basis at rates that allocate the asset’s value, less any estimated residual value, over its expected useful life. Leasehold improvements are depreciated over the period of the lease or estimated useful life, whichever is the shorter, using the straight line method. Intangible produced assets with finite useful lives are depreciated as an expense from transactions on a straight line basis over the asset’s useful life.
Depreciation begins when the asset is available for use, that is, when it is in the location and condition necessary for it to be capable of operating in the manner intended by management.

Department of Treasury and Finance Annual Report 2015 | 16 53
Estimated useful lives applicable for the years ended 30 June 2016 and 30 June 2015 are as follows:
Buildings – structures (including heritage buildings) and ground development (a)
12–257 years
Buildings (including heritage buildings) – other building components
5–186 years
Leasehold improvements 4–10 years
Office and computer equipment 2–10 years
Motor vehicles under finance lease 1–5 years
Municipal valuation database 2 years
Capitalised software development 3–7 years
Note:
(a) Certain heritage buildings owned by the Department have been determined to have useful lives of up to 257 years. The majority of the buildings have useful lives of below 60 years. There are two buildings with a useful life in the range of 94 to 98 years and another five buildings with a useful life in the range of 207 to 257 years. Ground development has a useful life of 12 years and includes landscaping improvements, fencing, gates, external storm water and sewer drainage, outbuildings and covered ways.
Land assets, which are considered to have an indefinite life, are not depreciated. Depreciation is not recognised in respect of these assets as their service potential has not, in any material sense, been consumed during the reporting period.
The estimated useful lives, residual values and depreciation method are reviewed at least annually.
Interest expense
Interest expense is recognised in the period in which it is incurred.
Grants expense
Grants to third parties (other than contributions to owners) are recognised as an expense in the reporting period in which they are paid or payable.
Capital asset charge
A charge levied on the written-down value of controlled non-current physical assets in a department’s balance sheet which aims to: attribute to agency outputs the opportunity cost of capital used in service delivery; and provide incentives to departments to identify and dispose of underutilised or surplus assets in a timely manner. The capital asset charge is calculated on the budgeted carrying amount of applicable non-financial physical assets.
Supplies and services
Supplies and services are recognised as an expense in the period in which they are incurred.
Payments to Consolidated Fund
This represents the balance of funds deemed no longer required for the purposes of specific Controlled trusts which is transferred to Consolidated Fund during the reporting period.
Resources provided free of charge
Resources provided free of charge or for nominal consideration are recognised at their fair value when the transferee obtains control over them, irrespective of any restrictions or conditions imposed over their use, except for transfers to another government department or agency as a consequence of a restructuring of administrative arrangements, and are recognised at carrying value.
(g) Other economic flows included in net result Other economic flows measure the change in volume or value of assets or liabilities that do not result from transactions.
Net gain/(loss) on non-financial assets
Net gain/(loss) on non-financial assets includes realised and unrealised gains and losses from impairments, and disposals of all physical and intangible assets.
Disposal of non-financial assets
Any gain or loss on the disposal of non-financial assets is recognised at the date of disposal and is determined after deducting from the proceeds the carrying value of the asset at that time.
Impairment of non-financial assets
All non-financial physical assets and intangible assets, except non-financial physical assets held for sale, are assessed annually for indications of impairment. If there is an indication of impairment, the assets concerned are tested as to whether their carrying value exceeds their recoverable amount. Where an asset’s carrying value exceeds its recoverable amount, the difference is written off to other economic flows except to the extent that the write-down can be debited to an asset revaluation surplus amount applicable to that class of asset.

54 Department of Treasury and Finance Annual Report 2015 | 16
If there is an indication that there has been a reversal in the estimate of an asset’s recoverable amount since the last impairment loss was recognised, the carrying amount shall be increased to its recoverable amount. The impairment loss is reversed only to the extent that the asset’s carrying amount does not exceed the carrying amount that would have been determined, net of depreciation or amortisation, if no impairment loss had been recognised in prior years.
It is deemed that, in the event of the loss of an asset, the future economic benefits arising from the use of the asset will be replaced unless a specific decision to the contrary has been made. The recoverable amount for most assets is measured at the higher of depreciated replacement cost and fair value less costs to sell. Recoverable amount for assets held primarily to generate net cash inflows is measured at the higher of the present value of future cash flows expected to be obtained from the asset and fair value less costs to sell.
Net gain/(loss) on financial instruments
Net gain/(loss) on financial instruments includes realised and unrealised gains and losses from revaluations of financial instruments that are designated at fair value through profit or loss or held for trading, impairment and reversal of impairment for financial instruments at amortised cost, and disposals of financial assets.
Revaluations of financial instruments at fair value
The revaluation gain/(loss) on financial instruments at fair value excludes dividends or interest earned on financial assets, which is reported as part of income from transactions.
Impairment of financial assets
The Department assesses at the end of each reporting period whether there is objective evidence that a financial asset or group of financial assets is impaired. All financial assets, except those measured at fair value through profit or loss, are subject to annual review for impairment.
Bad and doubtful debts are assessed on a regular basis. Those bad debts considered as written off by mutual consent are classified as expense. The allowance for doubtful receivables and bad debts not written off by mutual consent are adjusted as other economic flows.
Other gains/(losses) from other economic flows
Other gains/(losses) from other economic flows include the transfer of amounts from reserves and/or accumulated surplus to net result due to disposal or derecognition or reclassification, the revaluation of the present value of leave liabilities due to changes in bond interest rates and the revaluation of restoration costs provision.
(h) Financial instruments Financial instruments arise out of contractual agreements that give rise to a financial asset of one entity and a financial liability or equity instrument of another entity. Due to the nature of the Department’s activities, certain financial assets and financial liabilities arise under statute rather than a contract. Such financial assets and financial liabilities do not meet the definition of financial instruments in AASB 132 Financial Instruments: Presentation. For example, statutory receivables arising from taxes, fines and penalties do not meet the definition of financial instruments as they do not arise under contract. However, guarantees issued by the Treasurer on behalf of the Department are financial instruments because, although authorised under statute, the terms and conditions for each financial guarantee may vary and are subject to an agreement.
For note disclosure purposes, a distinction is made between those financial assets and liabilities that meet the definition of financial instruments in accordance with AASB 132 and those that do not. The following refers to financial instruments unless otherwise stated.
Categories of non-derivative financial instruments
Loans and receivables
Loans and receivables are financial instrument assets with fixed and determinable payments that are not quoted on an active market. These assets are initially recognised at fair value plus any directly attributable transaction costs. Subsequent to initial measurement, loans and receivables are measured at amortised cost using the effective interest method, less any impairment. The loans and receivables category includes cash and deposits, term deposits with maturity greater than three months, trade receivables, loans and other receivables, but not statutory receivables.

Department of Treasury and Finance Annual Report 2015 | 16 55
Available-for-sale financial assets
Available-for-sale financial instrument assets are those designated as available-for-sale or not classified in any other category of financial instrument asset. Such assets are initially recognised at fair value. Subsequent to initial recognition, they are measured at fair value with gains and losses arising from changes in fair value, recognised in ‘Other economic flows – other comprehensive income’ until the investments are disposed.
Movements resulting from impairment and foreign currency changes are recognised in the net result as other economic flows. On disposal, the cumulative gain or loss previously recognised in ‘other economic flows – other comprehensive income’ is transferred to other economic flows in the net result.
Held-to-maturity financial assets
If the Department has the positive intent and ability to hold nominated investments to maturity, then such financial assets may be classified as held-to-maturity. Held-to-maturity financial assets are recognised initially at fair value plus any directly attributable transaction costs. Subsequent to initial recognition, held-to-maturity financial assets are measured at amortised cost using the effective interest method, less any impairment losses.
The Department makes limited use of this classification because any sale or reclassification of more than an insignificant amount of held-to-maturity investments not close to their maturity, would result in the whole category being reclassified as available-for-sale. The Department would also be prevented from classifying investment securities as held-to-maturity for the current and the following two financial years. The held-to-maturity category includes certain term deposits and debt securities for which the entity concerned intends to hold to maturity.
Financial assets and liabilities at fair value through profit and loss
Financial assets are categorised as fair value through profit or loss at trade date if they are classified as held for trading or designated as such upon initial recognition. Financial instrument assets are designated at fair value through profit or loss on the basis that the financial assets form part of a group of financial assets that are managed by the entity based on their fair values, and have their performance evaluated in accordance with documented risk management and investment strategies.
Financial instruments at fair value through profit or loss are initially measured at fair value and attributable transaction costs are expensed as incurred. Subsequently, any changes in fair value are recognised in the net result as other economic flows.
Any dividend or interest on a financial asset is recognised in the net result from transactions. Financial assets and liabilities at fair value through profit or loss include the majority of the Department’s equity investments, debt securities, and borrowings.
Financial liabilities at amortised cost
Financial instrument liabilities are initially recognised on the date they are originated. They are initially measured at fair value plus any directly attributable transaction costs. Subsequent to initial recognition, these financial instruments are measured at amortised cost with any difference between the initial recognised amount and the redemption value being recognised in income and expenses over the period of the interest-bearing liability, using the effective interest rate method. Financial instrument liabilities measured at amortised cost include all of the Department’s contractual payables, deposits held and advances received, and interest-bearing arrangements other than those designated at fair value through profit or loss.
Offsetting financial instruments
Financial instrument assets and liabilities are offset and the net amount presented in the consolidated balance sheet when, the Department has a legal right to offset the amounts and intends to either to settle on a net basis or to realise the asset and settle the liability simultaneously. Some master netting arrangements do not result in an offset of balance sheet assets and liabilities. Where the Department does not have a legally enforceable right to offset recognised amounts, because the right to offset is enforceable only on the occurrence of future events such as default, insolvency or bankruptcy, they are reported on a gross basis.
The Department classifies its financial assets in the following categories:
Cash and deposits
Cash and deposits comprise cash on hand and cash at bank, deposits at call and short-term deposits, with original maturities of three months or less, that are held for the purpose of meeting short-term cash commitments rather than for investment purposes, and which are readily convertible to known amounts of cash and are subject to an insignificant risk of change in value. Cash and deposits with original maturities of three months or less, that are held for the purpose of meeting long-term funding management are classified as other financial assets.

56 Department of Treasury and Finance Annual Report 2015 | 16
Receivables
Receivables consist of:
• statutory receivables, which include predominantly amounts owing from the Victorian Government and goods and services tax input tax credits recoverable; and
• contractual receivables, which include mainly debtors in relation to goods and services, loans to third parties, accrued investment income, and finance lease receivables.
Receivables that are contractual are classified as financial instruments. Statutory receivables are not classified as financial instruments.
Receivables are recognised initially at fair value and subsequently measured at amortised cost, using the effective interest method, less any allowance for impairment.
Debtors are generally due for settlement no more than 30 days from the date of recognition. Collectability of debtors is reviewed on an ongoing basis. A provision for doubtful debts is raised when there is objective evidence that the debts may not be collected. Bad debts are written off when identified.
The Department assesses at the end of each reporting period whether a financial asset or group of financial assets is impaired.
(i) Non-financial assets
Prepayments
Prepayments represent payments in advance of receipt of goods or services or that part of expenditure made in one accounting period covering a term extending beyond that period.
Non-financial assets classified as held for sale
Non-financial physical assets are classified as held for sale and treated as current assets if their carrying amount will be recovered through a sale transaction rather than continuing use. This condition is regarded as met only when the asset is available for immediate use in the current condition and the sale is highly probable and is expected to be completed within one year from the date of classification. Non-financial assets classified as held for sale are measured at the lower of carrying amount and fair value less costs to sell, and are not subject to depreciation.
Surplus land and buildings that fall within the Government’s asset sales program, and which are not controlled by the Department, are reported by the relevant agency and not by this Department. Reporting responsibility for these assets remains with the relevant agency until the total sale price is fully discharged.
Property, plant and equipment
Property, plant and equipment are recognised initially at cost and subsequently measured at fair value less accumulated depreciation and impairment ( Note 1(g)). The initial cost for non-financial physical assets under a finance lease (Note 1(k)) is measured at amounts equal to the fair value of the leased assets or, if lower, the present value of the minimum lease payments, each determined at the inception of the lease.
The fair value of land and buildings (including heritage buildings) is determined using the market approach. For computer and office equipment, existing depreciated historical cost is generally a reasonable proxy for depreciated replacement cost because of the short lives of the assets concerned. Details about the valuation techniques and inputs used in determining the fair value of non-financial physical assets are discussed in Note 8.
Assets such as specialised land and heritage assets are measured at fair value with regard to the asset’s highest and best use after due consideration is made for any legal or physical restrictions imposed on the asset, public announcements or commitments made in relation to the intended use of the asset. Theoretical opportunities that may be available in relation to the asset are not taken into account until it is virtually certain that the restrictions will no longer apply. Therefore, unless otherwise disclosed, the current use of these non-financial physical assets will be their highest and best use.
The fair value of heritage assets that the State intends to preserve because of their unique historical, cultural or environmental attributes may be impacted by policies and any legislative limitations and restrictions imposed on their use and/or disposal.
Restricted nature of heritage assets and specialised land
During, and at the end of, the reporting period, the Department held heritage assets and specialised land (Note 8), which are deemed worthy of preservation for the social rather than financial benefits they provide to the community. Consequently there are certain limitations and restrictions imposed on their use and/or disposal.

Department of Treasury and Finance Annual Report 2015 | 16 57
Leasehold improvements
The cost of leasehold improvements is capitalised as an asset and depreciated over the remaining term of the lease or the estimated useful life of the improvements, whichever is the shorter.
Non-financial physical assets constructed by the Department
The cost of non-financial physical assets constructed by the Department includes the cost of all materials used in construction, direct labour on the project, and an appropriate proportion of variable and fixed overheads.
Revaluation of non-financial physical assets
Non-financial physical assets are measured at fair value in accordance with the Financial Reporting Directions issued by the Minister for Finance. A full revaluation normally occurs every five years, based on the asset’s government purpose classification, but may occur more frequently if fair value assessments indicate material changes in values. Scheduled revaluations and any interim revaluations are conducted by independent valuers as determined in accordance with the requirements of the Financial Reporting Directions. Revaluation increases or decreases arise from differences between an asset’s carrying value and fair value.
Net revaluation increases (where the carrying amount of a class of assets is increased as a result of a revaluation) are recognised in ‘other economic flows – other comprehensive income’, and accumulated in the asset revaluation surplus. However, the net revaluation increase is recognised in the net result to the extent that it reverses a net revaluation decrease in respect of the same class of property, plant and equipment previously recognised as an expense (other economic flows) in the net result.
Net revaluation decreases are recognised in ‘other economic flows – other comprehensive income’ to the extent that a credit balance exists in the asset revaluation surplus in respect of the same class of property, plant and equipment. Otherwise, the net revaluation decreases are recognised immediately as other economic flows in the net result. The net revaluation decrease recognised in ‘other economic flows – other comprehensive income’ reduces the amount accumulated in the asset revaluation surplus.
Revaluation increases and decreases relating to individual assets in a class of property, plant and equipment, are offset against one another in that class but are not offset in respect of assets in different classes. The asset revaluation surplus is not transferred to accumulated funds on derecognition of the relevant asset.
Intangible assets
Intangible assets represent identifiable non-monetary assets without physical substance. Intangible produced assets are initially recognised at cost. Subsequently, intangible produced assets with finite useful lives are carried at cost less accumulated depreciation and impairment. Costs incurred subsequent to initial acquisition are capitalised when it is expected that additional future economic benefits will flow to the Department. Purchased intangible assets include costs incurred in acquiring databases, software and licences that will contribute to future economic benefits.
The Department’s internally generated produced assets comprise capitalised software development
When the recognition criteria in AASB 138 Intangible Assets are met, internally generated intangible assets are recognised and measured at cost less accumulated depreciation/amortisation and impairment. An internally-generated intangible asset arising from development (or from the development phase of an internal project) is recognised if, and only if, all of the following are demonstrated:
(a) the technical feasibility of completing the intangible asset so that it will be available for use or sale;
(b) an intention to complete the intangible asset and use or sell it;
(c) the ability to use or sell the intangible asset;
(d) the intangible asset will generate probable future economic benefits;
(e) the availability of adequate technical, financial and other resources to complete the development and to use or sell the intangible asset; and
(f) the ability to measure reliably the expenditure attributable to the intangible asset during its development.

58 Department of Treasury and Finance Annual Report 2015 | 16
(j) Liabilities
Payables
Payables consist of:
• contractual payables, such as accounts payable, and unearned income. Accounts payable represent liabilities for goods and services provided to the Department prior to the end of the financial year that are unpaid, and arise when the Department becomes obliged to make future payments in respect of the purchase of those goods and services; and
• statutory payables, such as goods and services tax and fringe benefits tax payables.
Contractual payables are classified as financial instruments and categorised as financial liabilities at amortised cost. Statutory payables are recognised and measured similarly to contractual payables, but are not classified as financial instruments and not included in the category of financial liabilities at amortised cost. The amounts are unsecured and are usually paid within 30 days of recognition.
Provisions
Provisions are recognised when the Department has a present obligation where the future sacrifice of economic benefits is probable and the amount of the provision can be measured reliably. The amount recognised as a provision is the best estimate of the consideration required to settle the present obligation at reporting date, taking into account the risks and uncertainties surrounding the obligation. Where a provision is measured using the cash flows estimated to settle the present obligation, its carrying amount is the present value of those cash flows, using discount rates that reflect the time value of money and risks specific to the provision.
Provision for restoration costs
The Department records a provision for restoration costs for some of its leased properties. The estimated future costs of restoration are reviewed annually and adjusted as appropriate. Changes in the estimated future costs or in the discount rate applied are added to or deducted from the cost of the asset.
Employee benefits
Provision is made for benefits accruing to employees in respect of wages and salaries, annual leave and long service leave for services rendered to the reporting date.
Provisions made in respect of employee benefits expected to be wholly settled within 12 months are measured at their nominal values, using the remuneration rate expected to apply at the time of settlement. Provisions made in respect of employee benefits which are not expected to be wholly settled within 12 months are measured as the present value of the estimated future cash outflows to be made by the Department in respect of services provided by employees up to reporting date. The liability is classified as a current liability where the Department does not have an unconditional right to defer settlement for at least 12 months after the reporting date. The long service leave liability is classified as non-current where the Department has an unconditional right to defer the settlement of the entitlement until the employee has completed the requisite years of service.
Any gain or loss following revaluation of the present value of the non-current long service leave liability is recognised in the ‘net result from transactions’, except to the extent that a gain or loss arises due to changes in bond interest rates for which it is then recognised in the net result as an other economic flow.
Termination benefits are payable when employment is terminated before the normal retirement date, or when an employee decides to accept an offer of benefits in exchange for the termination of employment. The Department recognises termination benefits when it is demonstrably committed to either terminating the employment of current employees according to a detailed formal plan without possibility of withdrawal or providing termination benefits as a result of an offer made to encourage voluntary redundancy. Benefits falling due more than 12 months after the end of the reporting period are discounted to present value.
Unearned income
Unearned income relates mainly to accommodation rentals on government owned buildings invoiced in advance to tenants.

Department of Treasury and Finance Annual Report 2015 | 16 59
Advances for capital works
Funds received in advance for capital works managed on behalf of other departments and agencies are recognised as current liabilities until the associated capital expenditure is incurred. Advances for capital works are managed through the Finance Agency Trust.
Borrowings
Borrowings are recorded initially at fair value, being the cost of the borrowings, net of transaction costs (Note 1(k) Leases). The measurement basis subsequent to initial recognition is at amortised cost. Any difference between the initial recognised amount and the redemption value is recognised in net result over the period of the borrowings using the effective interest rate method.
Financial guarantees
Payments that are contingent under financial guarantee contracts are recognised as a liability at the time the guarantee is issued. The liability is initially measured at fair value, and if there is a material increase in the likelihood that the guarantee may be exercised, then it is measured at the higher of the amount and the amount initially recognised less cumulative amortisation, where appropriate
In the determination of fair value, consideration is given to factors including the overall capital management/prudential supervision framework in operation, the protection provided by the State Government by way of funding should the probability of default increase, probability of default by the guaranteed party and the likely loss to the Department in the event of default.
The Department has reviewed its financial guarantees and determined that there is no material liability to be recognised for financial guarantee contracts at 30 June 2016 and at 30 June 2015.
The value of loans and other amounts guaranteed by the Treasurer is disclosed in Note 16 (contingent liabilities and contingent assets).
Derecognition of financial liabilities
A financial liability is derecognised when the obligation under the liability is discharged, cancelled or expires.
When an existing financial liability is replaced by another from the same lender on substantially different terms, or the terms of an existing liability are substantially modified, such an exchange or modification is treated as a derecognition of the original liability and the recognition of a new liability. The difference in the respective carrying amounts is recognised as an other economic flow in the comprehensive operating statement.
(k) Leases Leases are classified as finance leases whenever the terms of the lease transfer substantially all the risks and rewards of ownership to the lessee. All other leases are classified as operating leases.
Department as lessor
Amounts due from lessees under finance leases are recorded as administered receivables (Note 22). Finance lease receivables are initially recorded at amounts equal to the present value of the minimum lease payments receivable plus the present value of any unguaranteed residual value expected to accrue at the end of the lease term. Finance lease payments are allocated between interest revenue and reduction of the lease receivable over the term of the lease in order to reflect a constant periodic rate of return on the net investment outstanding in respect of the lease.
Rental income from operating leases is recognised as controlled income on a straight-line basis over the term of the relevant lease. All incentives for the agreement of a new or renewed operating lease are recognised as an integral part of the net consideration agreed for the use of the leased asset, irrespective of the incentive’s nature or form or the timing of payments. In the event that lease incentives are given to the lessee, the aggregate cost of incentives are recognised as a reduction of rental income over the lease term, on a straight-line basis unless another systematic basis is more representative of the time pattern over which the economic benefit of the leased asset is diminished.
Department as lessee
Finance leases are recognised as assets and liabilities of the Department at amounts equal to the fair value of the lease property or, if lower, at the present value of the minimum lease payments, each determined at the inception of the lease. The leased asset is depreciated over the shorter of the estimated useful life of the asset or the term of the lease. Lease assets held at the reporting date, being motor vehicles, are depreciated over one to five years.

60 Department of Treasury and Finance Annual Report 2015 | 16
Minimum finance lease payments are apportioned between finance charges and reduction of the lease liability. Finance charges are calculated using the interest rate implicit in the lease and charged directly to the comprehensive operating statement.
Operating lease payments are recognised as an expense in the comprehensive operating statement on a straight-line basis over the lease term, except where another systematic basis is more representative of the time pattern of the benefits derived from the use of the leased asset. The leased asset is not recognised in the balance sheet.
(l) Goods and services tax
Income, expenses and assets are recognised net of goods and services tax (GST), unless the GST incurred is not recoverable from the Australian Taxation Office (ATO). In this case it is recognised as part of the cost of acquisition of the asset or as part of the expense.
Receivables and payables are stated inclusive of the amount of GST receivable or payable. The net amount of GST recoverable from, or payable to, the ATO is included as part of receivables or payables.
Cash flows are presented on a gross basis. The GST component of cash flows arising from investing and financing activities which is recoverable from, or payable to, the ATO is classified as an operating cash flow.
Commitments and contingent assets and liabilities are stated inclusive of GST.
(m) Events after reporting date Assets, liabilities, income or expenses arise from past transactions or other past events. Where the transactions result from an agreement between the Department and other parties, the transactions are only recognised when the agreement is irrevocable at or before balance date. Adjustments are made to amounts recognised in the financial statements for events which occur after the reporting date and before the date the financial statements are authorised for issue, where those events provide information about conditions which existed at the reporting date. Note disclosure is made about events between the reporting date and the date the financial statements are authorised for issue where the events relate to conditions which arose after the reporting date and which may have a material interest.
In September 2016, significant rain caused flooding across parts of Victoria. As at the date of this report, the full financial impact of this event on the State of Victoria is yet to be determined, as the flood event is still unfolding.
(n) Administered items All amounts of income, expenses , assets and liabilities over which the Department does not have control are disclosed in the schedule of administered income and expenses and schedule of administered assets and liabilities (Note 22).
Administered income and expenses
Payments on behalf of the State (POBOS)
An appropriation which provides for payments to be made on behalf of the State. These payments are not related to the direct provision of outputs of the Department.
Taxation (includes taxes, fines, regulatory fees and other state revenue)
State taxation revenue is recognised by the State on receipt of a taxpayer’s self-assessment, or the time the taxpayer’s obligation to pay arises pursuant to the issue of an assessment, whichever is earlier. Revenue in relation to the Growth Area Infrastructure Contribution (GAIC) is recognised on the occurrence of the first GAIC taxable event. Revenue in relation to the Fire Services Property Levy is recognised on receipt from a municipal council of an annual estimate of liability, a payment, or an annual reconciliation. Fines and regulatory fees revenue is recognised at the time the fine or regulatory fee is issued.
Public authority dividends
Income tax equivalent and rate equivalent revenue are recognised when the right to receive the payment is established.
Dividends are recognised when the right to receive the payment is established.
Capital asset charge
This revenue represents the amount levied by the State on departments and relevant agencies for the opportunity cost of capital used in service delivery.
Interest income
Interest income includes interest received on bank term deposits and other investments, and the unwinding over time of discounts on financial assets including interest on finance leases. Interest income is recognised on a time proportionate basis that takes into account the effective yield on the financial asset.

Department of Treasury and Finance Annual Report 2015 | 16 61
Other income
Other income includes non-property rental, assets received free of charge and other miscellaneous non-operating revenue.
Net realised and unrealised gains and losses on the revaluation of investments which do not form part of income from transactions are reported as part of income from other economic flows in the net result or as unrealised gains and losses taken direct to equity, forming part of the total change in net worth in the comprehensive result.
Contribution to GST administration costs
Payments to the Commonwealth for the State’s share of the cost of administering GST.
Payments to the Consolidated Fund
This represents payments to the State for State revenues received by the Department that is not otherwise required or authorised to be paid to the Trust Fund.
Administered assets and liabilities
Investment in controlled entities
This relates to the State’s equity investment in entities controlled by the State, in its capacity as owner and is carried at cost.
Other financial assets
Other financial assets are primarily invested in short-term deposits, consistent with the objective of ensuring that the short-term funding needs of the Public Account can be met at all times and that any borrowings in the short-term portfolio are managed to minimise the net interest cost.
Payables
Included in payables is an amount owing to the State Electricity Commission of Victoria (SECV) in relation to the deed of indemnity from the Treasurer. The Department, on behalf of the State, is obliged to fund the shortfall relating to the SECV’s obligations under electricity supply agreements with the aluminium smelters at Portland. The liability amount is included as payables in the administered balance sheet and represents the present value of future payments to be made to the SECV to fund the shortfall.
The value of the indemnity is assessed at least annually and any revaluation gain/(loss) is recognised as an ‘other economic flow’ in determining the administered net result. Any revaluation gain/(loss) recognises the adjustment required to the outstanding indemnity balance and represents a reduction/(increase) in losses under the indemnity resulting from favourable/unfavourable movements in factors affecting those losses, principally aluminium prices.
Public Account SAU liability
These are the outstanding liabilities to other Departments in respect of (a) amounts appropriated from the Consolidated Fund but remaining undrawn at the end of the year, net of Public Account advances to other departments, and (b) Trust Account funds held on their behalf within the Public Account.
Unearned income
This mainly represents the upfront payment of a 30-year lease obligation resulting from the sale of the State’s hydro electricity scheme – Southern Hydro Limited as part of the State’s privatisation policy. Revenue is recognised on a straight line method over the lease period.
Borrowings
Budget Sector Debt Portfolio
Management of the Budget Sector Debt Portfolio (BSDP) is based on the key objectives of achieving relative certainty of interest cost over the budgeting period while minimising net borrowing costs, and conservatively managing the financial and operational risks of the budget sector treasury operations.
The BSDP is primarily composed of fixed rate borrowing facilities that have an even maturity profile. This ensures that a relatively small proportion of the BSDP is subject to re-pricing in any one period, with the effect that BSDP interest costs are not subject to large fluctuations as a result of movements in market interest rates. Since borrowings in the BSDP are held to maturity, the BSDP is accounted for on an historical cost basis. This is categorised as financial liabilities carried at amortised cost.

62 Department of Treasury and Finance Annual Report 2015 | 16
Superannuation liability
A liability or asset in respect of defined benefit superannuation plans is recognised in the statement of administered assets and liabilities, and is determined in accordance with AASB 119 Employee Benefits, with actuarial valuations being carried out at each reporting date. Accrued benefits are measured as the net present value of estimated future benefit payments to members arising from their membership of the scheme up to the end of the reporting period. Remeasurements of the liability are recognised in full in the statement of administered income and expenses in the period in which they occur. Past service cost is recognised immediately to the extent that the benefits are already vested, and otherwise is amortised on a straight-line basis over the average period until the benefits become vested.
The superannuation liability recognised in the administered balance sheet represents the present value of the defined benefit obligation, adjusted for unrecognised past service cost, net of the fair value of the plan assets. This liability mainly represents the State’s superannuation liability with respect to superannuation funds operated principally for general government sector employees, being the State’s share of the shortfall between the total net assets of the State’s general government sector superannuation funds at 30 June 2016 and the present value of total benefits that members have accrued up to that date, as determined by an actuarial assessment. The balance of the superannuation liability with respect to these funds is to be met by Commonwealth funded agencies. In addition, the State also recognises a liability for accrued benefits arising from constitutionally protected pension entitlements principally in respect of judges and other judicial office holders. No assets are held in respect of these liabilities and pensions are paid from the Consolidated Fund.
Government policy is that the superannuation liability for the entire general government sector should be recognised and disclosed in the administered balance sheet of the Department.
Receivables
Included in receivables is lease receivables. The Department is the lessor for the State’s motor vehicle fleet. Leases effected under this arrangement are recognised as finance leases by this Department as the lessor in the administered balance sheet, and by other Departments and public bodies as lessees.
Amounts due from lessees under finance leases are recorded as administered receivables. Finance lease receivables are initially recorded at amounts equal to the present value of the minimum lease payments receivable plus the present value of any unguaranteed residual value expected to accrue at the end of the lease term. Finance lease payments are allocated between interest revenue and reduction of the lease receivable over the term of the lease in order to reflect a constant periodic rate of return on the net investment outstanding in respect of the lease.
(o) Contributions by owners Consistent with the requirements of AASB 1004 Contributions, contributions by owners (that is, contributed capital and its repayment) are treated as equity transactions and, therefore, do not form part of the income and expenses of the Department.
Additions to net assets which have been designated as contributions by owners are recognised as contributed capital. Other transfers that are contributions or distributions in nature have also been designated as contributions by owners.
Transfers of net assets or liabilities arising from administrative restructurings are treated as distributions to or contributions by owners.
(p) Commitments Commitments for future expenditure include operating and capital commitments arising from contracts. These commitments are disclosed in Note 15 at their nominal value and inclusive of GST payable. In addition, where it is considered appropriate and provides additional relevant information to users, the net present values of significant individual projects are stated. These future expenditures cease to be disclosed as commitments once the related liabilities are recognised in the balance sheet (notes 1(k) and 13).
(q) Contingent liabilities and contingent assets Contingent liabilities and contingent assets (including those administered on behalf of the State, where applicable) are not recognised in the balance sheet, but are disclosed by way of a note (Note 16) and, if quantifiable, are measured at nominal value. Contingent liabilities and assets are presented inclusive of GST receivable or payable, respectively.
(r) Rounding Amounts in the financial statements have been rounded to the nearest thousand dollars, unless otherwise stated.

Department of Treasury and Finance Annual Report 2015 | 16 63
(s) Accounting standards issued but not yet effective As at 30 June 2016, the following standards and interpretations (applicable to the Department) had been issued but were not mandatory for the 30 June 2016 reporting period. The Department of Treasury and Finance assesses the impact of these new standards and advises the Department of their applicability and early adoption where applicable.
AASB 9 Financial Instruments, applicable for reporting periods commencing 1 January 2018. The key changes include the simplified requirements for the classification and measurement of financial assets, a new hedging accounting model and a revised impairment loss model to recognise impairment losses earlier, as opposed to the current approach that recognises impairment only when incurred. While the Department’s assessment has not identified any material impact arising from AASB 9, it will continue to be monitored and assessed.
AASB 2010-7 Amendments to Australian Accounting Standards arising from AASB 9 (December 2010), applicable for reporting periods commencing 1 January 2018. The requirements for classifying and measuring financial liabilities were added to AASB 9. The existing requirements for the classification of financial liabilities and the ability to use the fair value option have been retained. However, where the fair value option is used for financial liabilities the change in fair value is accounted for as follows:
• the change in fair value attributable to changes in credit risk is presented in other comprehensive income; and
• other fair value changes are presented in profit or loss. If this approach creates or enlarges an accounting mismatch in the profit or loss, the effect of the changes in credit risk are also presented in profit or loss.
The Department’s assessment has identified that the amendments are likely to result in earlier recognition of impairment losses and at more regular intervals.
AASB 2014-1 Amendments to Australian Accounting Standards [Part E Financial Instruments], applicable for reporting periods commencing 1 January 2018. Amends various AASs to reflect the AASB’s decision to defer the mandatory application date of AASB 9 to annual reporting periods beginning on or after 1 January 2018; as a consequence of Chapter 6; and to amend reduced disclosure requirements. This amending standard will defer the application period of AASB 9 to the 2018-19 reporting period in accordance with the transition requirements.
AASB 2014-7 Amendments to Australian Accounting Standards arising from AASB 9, applicable for reporting periods commencing 1 January 2018. Amends various AASs to incorporate the consequential amendments arising from the issuance of AASB 9. The Department’s assessment has indicated that there will be no significant impact for the Department.
AASB 15 Revenue from Contracts with Customers, applicable for reporting periods commencing 1 January 2019. The core principle of AASB 15 requires an entity to recognise revenue when the entity satisfies a performance obligation by transferring a promised good or service to a customer. The changes in revenue recognition requirements in AASB 15 may result in changes to the timing and amount of revenue recorded in the financial statements. The Standard will also require additional disclosures on service revenue and contract modifications.
AASB 2014-5 Amendments to Australian Accounting Standards arising from AASB 15, applicable 1 January 2017, except amendments to AASB 9 (Dec 2009) and AASB 9 (Dec 2010) apply from 1 January 2018. Amends the measurement of trade receivables and the recognition of dividends. Trade receivables, that do not have a significant financing component, are to be measured at their transaction price, at initial recognition. The Department’s assessment has indicated that there will be no significant impact for the Department.
AASB 16 Leases, applicable for reporting periods commencing 1 January 2019. The key changes introduced by AASB 16 include the recognition of most operating leases (which are currently not recognised) on balance sheet. The Department’s assessment has indicated that as most operating leases will come on balance sheet, recognition of lease assets and lease liabilities will cause net debt to increase. Depreciation of lease assets and interest on lease liabilities will be recognised in the income statement with marginal impact on the operating surplus. The amounts of cash paid for the principal portion of the lease liability will be presented within financing activities and the amounts paid for the interest portion will be presented within operating activities in the cash flow statement.

64 Department of Treasury and Finance Annual Report 2015 | 16
AASB 2015-1 Amendments to Australian Accounting Standards – Annual Improvements to Australian Accounting Standards 2012-2014 Cycle [AASB 1, AASB 2, AASB 3, AASB 5, AASB 7, AASB 11, AASB 110, AASB 119, AASB 121, AASB 133, AASB 134, AASB 137 & AASB 140], applicable for reporting periods commencing 1 January 2016. Amends the methods of disposal in AASB 5 Non-current assets held for sale and discontinued operations. Amends AASB 7 Financial Instruments by including further guidance on servicing contracts. The assessment has indicated that when an asset (or disposal group) is reclassified from ‘held to sale’ to ‘held for distribution’, or vice versa, the asset does not have to be reinstated in the financial statements. Entities will be required to disclose all types of continuing involvement that an entity has, when transferring a financial asset to a third party under conditions which allow it to derecognise the asset.
AASB 2015-6 Amendments to Australian Accounting Standards – Extending Related Party Disclosures to Not-for-Profit Public Sector Entities [AASB 10, AASB 124 & AASB 1049] , applicable for reporting periods commencing 1 January 2016. AASB 2015-6 extends the scope of AASB 124 Related Party Disclosures to not-for-profit public sector entities. Guidance has been included to assist the application of the Standard by not-for-profit public sector entities. The amending standard will result in extended disclosures on the entity’s key management personnel, and the related party transactions.
Note 2. Departmental outputs (a) Objectives and outputs of the Department A description of departmental objectives and outputs during the year ended 30 June 2016 are summarised below.
Sound financial management of Victoria’s fiscal resources
These outputs contribute to the department’s objective to ensure that Government financial policies are fiscally sound.
Guide government actions to increase Victoria’s productivity and competitiveness
These outputs provide advice on key economic and financial issues, including longer-term economic development, regulation, financial strategy and taxation policy.
Drive improvements in public sector asset management and the delivery of infrastructure
The Department develops and applies prudent commercial principles and practices to influence and deliver Government policies. This promotes transparent and accountable commercial principles and practices throughout the public sector, and ensures that government-owned property assets are managed and used efficiently.
Deliver efficient whole of government common services to the Victorian public sector
The Department assists the Government agencies in providing a more integrated approach to the management of common services. This output delivers whole of government services, policies and initiatives in areas including procurement, fleet and accommodation.

Department of Treasury and Finance Annual Report 2015 | 16 65
(b) Changes to outputs As a result of machinery of government changes effective 22 September 2015, the secretariat supporting VCEC was transferred from the Department of Premier and Cabinet to the Department to support the new Commissioner for Better Regulation.
The following changes were made to output groups in 2015-16:
Strategic policy advice, Financial management services and Revenue management services have been re-grouped as Sound financial management of Victoria’s fiscal resources. Risk management services has been renamed Drive improvement in public sector asset management and delivery of infrastructure. Resource management services has been renamed Deliver efficient whole of government common services to the Victorian public sector. Regulatory services has been renamed Guide government actions to increase Victoria’s productivity and competitiveness. The Economic and financial policy output within the previous Strategic policy advice group is now included within Guide government actions to increase Victoria’s productivity and competitiveness.

66 Department of Treasury and Finance Annual Report 2015 | 16
Departmental outputs schedule
Sound financial
management of Victoria’s fiscal resources
Drive improvement in public sector asset
management and the delivery of infrastructure
2016 2015 2016 2015
$’000 $’000 $’000 $’000
Controlled income and expenses for the year ended 30 June 2016
Income from transactions
Output appropriations 138 597 144 227 35 980 24 722
Other income 1 584 936 3 063 2 478
Total income from transactions 140 181 145 163 39 043 27 201 Expenses from transactions
Employee benefits 72 017 70 709 12 432 12 382
Depreciation 20 703 10 480 101 136
Finance lease interest expense 4 18 3 6
Grants expense 5 182 5 420 106 295
Capital asset charge 69 136 4 810 2 394
Supplies and services 37 525 50 542 19 032 7 809
Payments to Consolidated Fund 2 327 43 1 978 1 056
Total expenses from transactions 137 827 137 347 38 462 24 077 Net result from transactions 2 354 7 816 581 3 124 Other economic flows included in net result
Net gain/(loss) on financial instruments (2) –
Net gain/(loss) on disposal of property, plant and equipment 72 32 (1) 7
Net gain/(loss) from revaluation of leave liabilities (855) (90) (102) (12)
Total other economic flows included in net result (785) (58) (103) (5) Net result 1 569 7 757 478 3 119 Total other economic flows – other comprehensive income
Changes in asset revaluation reserve
Comprehensive result 1 569 7 757 478 3 119 Controlled assets and liabilities as at 30 June 2016
Assets
Financial assets 9 267 8 095 7 524 4 111
Non-financial assets 18 000 34 332 260 605 270 573
Total assets 27 267 42 427 268 129 274 684 Liabilities Total liabilities (38 441) (33 479) (10 577) (5 620) Net assets/(liabilities) (11 173) 8 948 257 553 269 063
Note:
(a) Includes the outputs for the secretariat supporting the Commissioner for Better Regulation, commencing 22 September 2015 to 30 June 2016.
(b) These amounts consist predominantly of the Department’s SAU balances with the Consolidated Fund and the Trust Fund.

Department of Treasury and Finance Annual Report 2015 | 16 67
Deliver efficient whole of government common
services to the Victorian public sector
Guide government actions to increase
Victoria’s productivity and competitiveness (a)
Other – Not attributable (b) Departmental total
2016 2015 2016 2015 2016 2015 2016 2015
$’000 $’000 $’000 $’000 $’000 $’000 $’000 $’000
39 778 44 721 41 037 37 042 255 392 250 713
46 995 47 251 628 344 52 270 51 009
86 773 91 972 41 665 37 386 307 662 301 722
12 756 15 722 16 561 15 652 113 766 114 465
14 335 21 408 283 181 35 422 32 205
89 24 4 7 100 55
79 550 19 959 16 471 25 326 22 736
16 239 18 549 31 41 21 149 21 120
36 653 30 456 3 246 3 445 96 456 92 252
8 423 11 202 195 29 12 923 12 330
88 574 97 912 40 279 35 826 305 142 295 163 (1 801) (5 940) 1 386 1 560 2 520 6 559
(2) –
45 (29) 10 24 126 34
(98) (17) (125) (17) (1 180) (135)
(53) (46) (115) 7 (1 056) (101) (1 854) (5 986) 1 271 1 567 1 464 6 458
72 126 – 72 126 –
70 272 (5 986) 1 271 1 567 – – 73 590 6 458
82 952 74 165 753 1 533 187 580 150 436 288 076 238 339
295 533 227 158 977 847 – – 575 116 532 909
378 485 301 323 1 730 2 380 187 580 150 436 863 192 771 248
(70 240) (56 661) (18 965) (16 120) (138 222) (111 880) 308 245 244 662 (17 235) (13 740) 187 580 150 436 724 970 659 368

68 Department of Treasury and Finance Annual Report 2015 | 16
Note 3. Income from transactions Income from transactions includes:
2016 $’000
2015 $’000
Other income
Provision of services 16 066 18 106
Rental accommodation income 32 321 32 563
Other 3 883 340
Total other income 52 270 51 009
Note 4. Summary of compliance with annual Parliamentary and special appropriations
(a) Summary of compliance with annual Parliamentary appropriations The following table discloses the details of the various Parliamentary appropriations received by the Department during the year. In accordance with accrual output-based management procedures, ‘provision of outputs’ and ‘additions to net asset base’ are disclosed as ‘controlled’ activities of the Department. Administered transactions are those that are undertaken on behalf of the State, and over which the Department has no control or discretion.
Appropriation Act
Annual appropriations – as published
Net transfers between departments- administrative
restructure Advance from
Treasurer $’000 $’000 $’000 2016 2015 2016 2015 2016 2015
Controlled Provision of outputs 235 651 229 841 2 549 (3 413) 17 706 22 710
Additions to net asset base 4 230 24 427
Administered
Payments made on behalf of the State 1 781 946 1 753 223 50 000 –
Total 2 021 827 2 007 491 2 549 (3 413) 67 706 22 710

Department of Treasury and Finance Annual Report 2015 | 16 69
Financial Management Act 1994
Section 29 Section 32
Total
Parliamentary authority
Appropriations applied Variance
$’000 $’000 $’000 $’000 $’000 2016 2015 2016 2015 2016 2015 2016 2015 2016 2015
7 793 8 584 2 202 1 921 265 901 259 643 255 392 250 713 10 509 8 930
398 2 757 4 628 27 184 – 5 000 4 628 22 184
9 255 2 600 1 841 201 1 755 823 1 758 730 1 746 568 82 471 9 255
7 793 8 584 11 855 7 278 2 111 730 2 042 650 2 014 122 2 002 281 97 608 40 369

70 Department of Treasury and Finance Annual Report 2015 | 16
Explanation of variances between total Parliamentary authority and appropriations applied – year ended 30 June 2016.
• Provision of outputs
− $4.4 million was not drawn down due to lower depreciation costs for government owned buildings. $3.9 million has been carried over to 2016-17, in respect of various projects not completed as expected in 2015-16. $2.0 million relates to underutilisation of Treasurer’s Advance funding, as costs dependent on volumes were not incurred and $0.2 million is applied for savings.
• Additions to net asset base
− Capital funding was not applied as expected in 2015-16 due to the Department’s utilisation of depreciation equivalent.
• Payments made on behalf of the State
− $35.5 million of the Melbourne Major events contingency was not required. $21.0 million Back to Work funding was administered by another department during the year. $26.0 million in higher interest charges were not incurred as expected.
(b) Summary of compliance with special appropriations Authority Purpose Appropriations applied 2016
$’000 2015
$’000 Administered (Note 22)
Constitution Act, No. 8750 of 1975 – Governors’ Pensions
Governors’ pensions 2 207 1 005
County Court Act, No. 6230 of 1958 – Judges Judges’ pensions 16 741 13 536
Constitution Act, No. 8750 of 1975 – Supreme Court Judges
Judges’ pensions 17 169 9 776
State Superannuation Act, No. 50 of 1988, Section 90(2) – Contributions
Superannuation contributions 1 040 407 1 036 612
State Electricity Commission Act, No. 6377 of 1958, Section 85B(2)
Indemnity 65 021 86 099
Treasury Corporation of Victoria Act, No. 80 of 1992, Section 38 – Debt Retirement
Budget sector debt retirement 916 621 23 933
Taxation (Interest on Overpayments) Act, No. 35 of 1986, Section 11
Interest on overpayments of tax 4 097 977
State Owned Enterprises Act, No. 90 of 1992, Section 88
State equivalent tax refunds 21 688 8 364
Liquor Control Reform Act, No. 94 of 1998, Section 177(2)
Safety net payments 3 043 2 733
Gambling Regulation Act, No. 114 of 2003, Section 3.6.12
Payments to Community Support Fund 98 324 96 506
Financial Management Act, No. 18 of 1994, Section 39
Interest on advances 6 311 2 163
Total special appropriations 2 191 629 1 281 704

Department of Treasury and Finance Annual Report 2015 | 16 71
(c) Annotated revenue agreements Section 29 annotated revenue agreements included in the financial statements are:
2016 $’000
2015 $’000
Section 105 land tax certificates 3 232 3 251
Rural Finance Corporation divestment advisor fees – 2 896
Collaborative inter-governmental projects – 80
Construction supplier register 599 534
Government land and property 587 338
Essential Services Commission ministerial advices 1 413 293
Public financial corporations risk management and reporting framework
167 178
Government bodies gymnasium 191 189
Victorian Energy and Efficiency Target expansion 1 604 825
7 793 8 584

72 Department of Treasury and Finance Annual Report 2015 | 16
Note 5. Expenses from transactions 2016
$’000 2015
$’000
Expenses from transactions includes:
Employee expenses(a)
Salaries and wages 87 535 87 916
Annual and long service leave expense 11 306 11 801
Superannuation
• Defined contribution plans 7 729 7 506
• Defined benefits plans 1 504 1 509
Other on-costs 5 692 5 733
Total employee expenses 113 766 114 465
Depreciation
Buildings-structures and ground development 7 393 7 382
Buildings-other building components 4 788 11 751
Leasehold improvements 868 747
Office and computer equipment 1 303 1 372
Motor vehicles under finance lease 1 234 1 309
Municipal valuations database 15 538 5 548
Capitalised software development 4 298 4 096
Total depreciation 35 422 32 205
Grants expense
Victorian Government entities 20 231 17 477
Local Government entities 4 802 4 621
Other organisations 293 638
Total grants expense 25 326 22 736
Supplies and services*
Rentals and property outgoings 26 768 25 713
Purchase of services 51 591 45 437
Information and communication technology costs 12 923 13 792
Others 5 174 7 310
Total supplies and services 96 456 92 252
Payments to the Consolidated Fund
Government Accommodation Trust 9 576 12 330
Treasury Trust 3 347 –
12 923 12 330
Note:
(a) Certain expenses have been reclassified to more appropriately reflect their nature. Prior year comparatives have been adjusted accordingly.

Department of Treasury and Finance Annual Report 2015 | 16 73
Note 6. Receivables 2016
$’000 2015
$’000
Current: Contractual
Debtors 22 875 19 055
22 875 19 055 Statutory
Amounts owing from Victorian Government (a) 185 260 148 041
GST recoverable 2 013 2 430
187 273 150 471 Total current receivables 210 148 169 526 Non-current: Statutory
Amounts owing from Victorian Government (a) 2 320 2 395
Total non-current receivables 2 320 2 395 Total receivables 212 468 171 921
Note:
(a) Represents balance of appropriations relating to the provision of outputs and for additions to the net asset base, for which payments had not been disbursed at balance date, and accordingly had not been drawn from the Consolidated Fund.
Note 14 discloses an ageing analysis of contractual receivables and the nature of and extent of credit risk arising from the receivables.
Note 7. Non-financial assets classified as held for sale 2016
$’000 2015
$’000
Vehicles held for sale 93 31
Properties held for sale 8 893 –
Total non-financial assets classified as held for sale 8 986 31
Non-financial assets classified as held for sale comprise property and vehicles that the Department no longer utilises and which it intends to dispose of within the next 12 months. No impairment losses were recognised on reclassification of the property as held for sale or at balance date.

74 Department of Treasury and Finance Annual Report 2015 | 16
Fair value measurement of land held for sale Carrying
amount Fair value
measurement using: Level 1 Level 2 Level 3 Fair value measurement hierarchy at 30 June 2016 $’000 $’000 $’000 $’000 Land at fair value
Specialised land 8 893 8 893
Non-specialised land – –
Total land at fair value 8 893 8 893 Fair value measurement hierarchy at 30 June 2015 Land at fair value
Specialised land – –
Non-specialised land – – Total land at fair value – –

Department of Treasury and Finance Annual Report 2015 | 16 75
Note 8. Property, plant and equipment 2016
$’000 2015
$’000
Land
At valuation 421 860 366 191
Buildings (including heritage buildings)
At independent valuation 170 812 170 812
At cost 18 518 10 598
Less: accumulated depreciation (68 748) (56 916)
120 582 124 494
Construction in progress – at cost 247 672
Total buildings 120 829 125 166
Leasehold improvements
Leasehold improvements – at cost 10 542 10 308
Less: accumulated depreciation (8 798) (7 869) Total leasehold improvements 1 744 2 439 Plant and equipment
Office and computer equipment – at cost 11 932 12 754
Less: accumulated depreciation (11 168) (10 638)
764 2 116 Motor vehicles under finance lease 5 618 5 901
Less: accumulated depreciation (1 752) (1 709)
3 866 4 192 Total plant and equipment 4 630 6 308 Total property, plant and equipment 549 063 500 104
Valuations
The basis of valuation of land and buildings (including heritage buildings) is fair value. Fair value is determined by direct reference to recent market transactions for land of comparable size and location. For buildings (including heritage buildings), fair value is determined by applying an appropriate capitalisation rate based on factors such as building design, location, tenancy size on the average rental income of the building area. The latest revaluations of building assets were based on independent assessments as at 30 June 2012, carried out by Valuer-General Victoria, Urbis, Napier and Blakeley Pty. Ltd. and Herron Todd White Pty. Ltd. The Department’s land assets were managerially revalued in accordance with FRD 103F as at 30 June 2016.
The revaluation process normally occurs every five years, based on the asset’s government purpose classification. In the intervening period, annual assessments are made of all property, plant and equipment as to whether the fair value of a class of assets may differ materially from its carrying amount, being revalued amount, or cost for recently acquired items, less applicable accumulated depreciation.
Restricted assets
The carrying amount of buildings listed as heritage assets is $78 million (2015 – $81.3 million). These heritage assets cannot be modified nor disposed of without formal Ministerial approval.
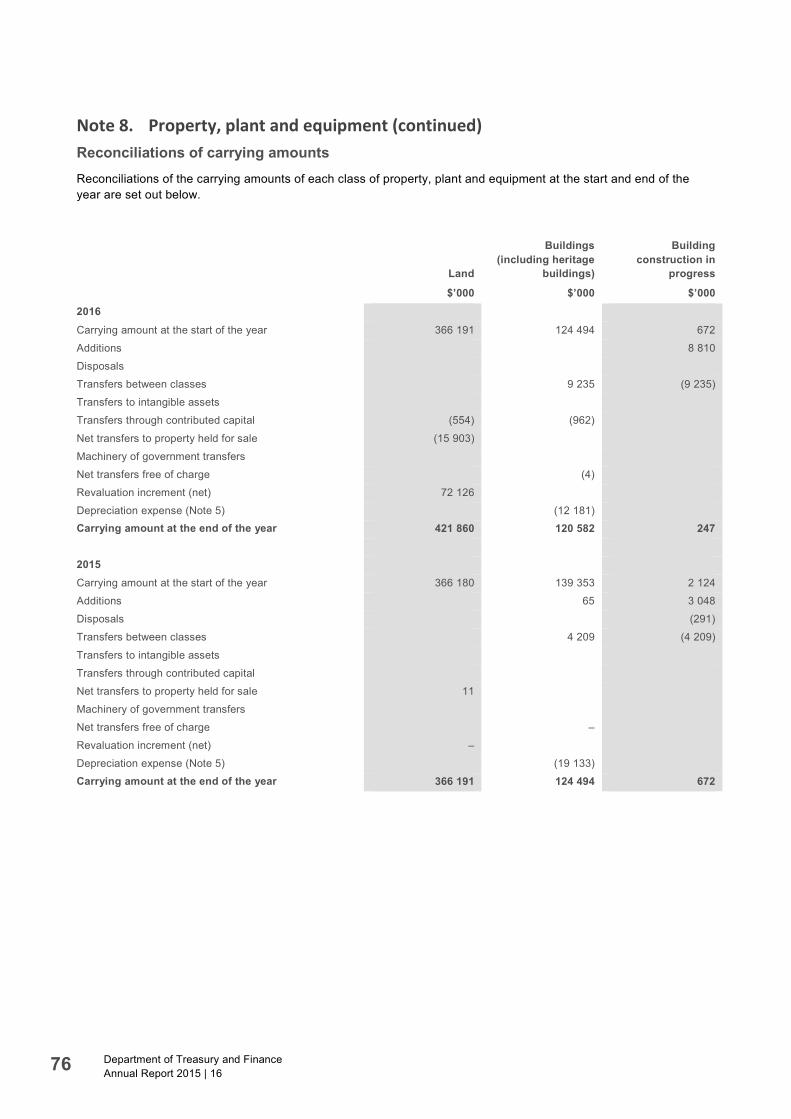
76 Department of Treasury and Finance Annual Report 2015 | 16
Note 8. Property, plant and equipment (continued) Reconciliations of carrying amounts Reconciliations of the carrying amounts of each class of property, plant and equipment at the start and end of the year are set out below.
Land
Buildings (including heritage
buildings)
Building construction in
progress
$’000 $’000 $’000 2016
Carrying amount at the start of the year 366 191 124 494 672
Additions 8 810
Disposals
Transfers between classes 9 235 (9 235)
Transfers to intangible assets
Transfers through contributed capital (554) (962)
Net transfers to property held for sale (15 903)
Machinery of government transfers
Net transfers free of charge (4)
Revaluation increment (net) 72 126
Depreciation expense (Note 5) (12 181) Carrying amount at the end of the year 421 860 120 582 247 2015
Carrying amount at the start of the year 366 180 139 353 2 124
Additions 65 3 048
Disposals (291)
Transfers between classes 4 209 (4 209)
Transfers to intangible assets
Transfers through contributed capital
Net transfers to property held for sale 11
Machinery of government transfers
Net transfers free of charge –
Revaluation increment (net) –
Depreciation expense (Note 5) (19 133)
Carrying amount at the end of the year 366 191 124 494 672

Department of Treasury and Finance Annual Report 2015 | 16 77
Leasehold improvements
Office and computer
equipment
Motor vehicles under
finance lease
Total
$’000 $’000 $’000 $’000
2 439 2 116 4 192 500 104
1 856 10 666
(11) (857) (868)
–
–
(1 516)
(93) (15 996)
173 173
(38) 2 (40)
72 126
(868) (1 303) (1 234) (15 586)
1 744 764 3 866 549 063
3 411 3 878 4 334 519 280
195 2 276 5 584
– (1 065) (1 356)
(35) 35 –
(618) (618)
–
(31) (20)
(190) (2) (13) (205)
–
–
(747) (1 372) (1 309) (22 561)
2 439 2 116 4 192 500 104
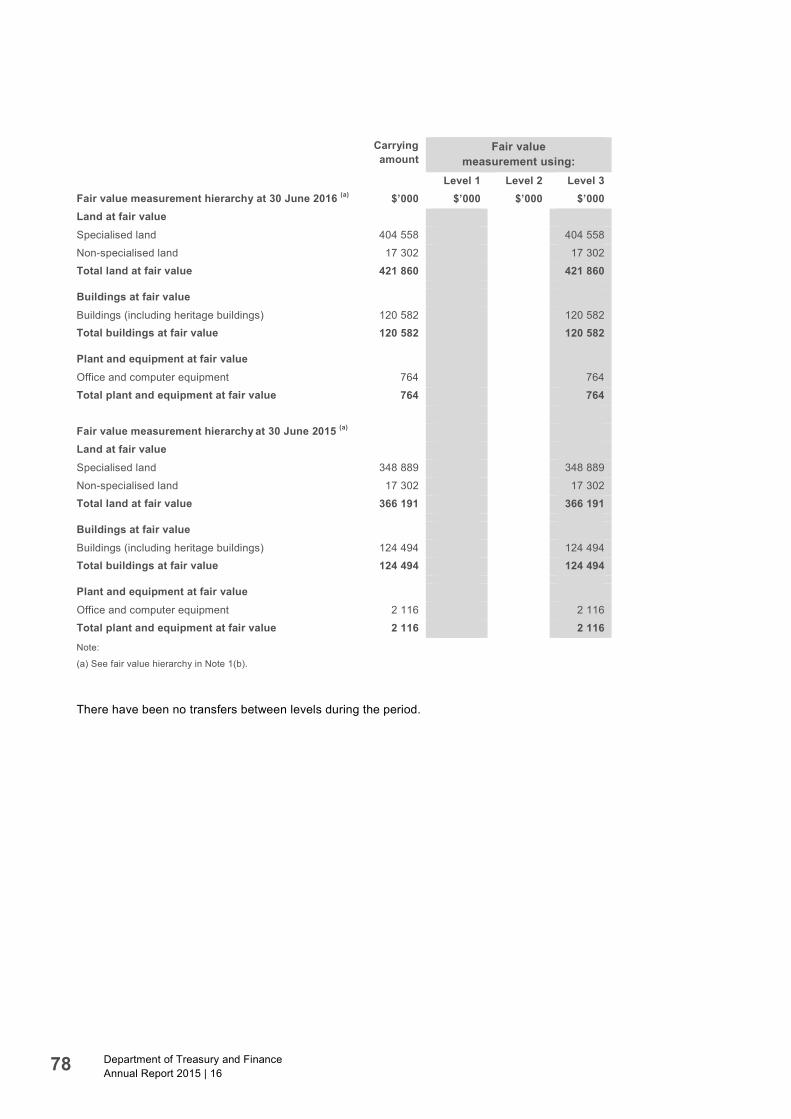
78 Department of Treasury and Finance Annual Report 2015 | 16
Carrying amount
Fair value measurement using:
Level 1 Level 2 Level 3 Fair value measurement hierarchy at 30 June 2016 (a) $’000 $’000 $’000 $’000 Land at fair value
Specialised land 404 558 404 558
Non-specialised land 17 302 17 302
Total land at fair value 421 860 421 860 Buildings at fair value
Buildings (including heritage buildings) 120 582 120 582 Total buildings at fair value 120 582 120 582 Plant and equipment at fair value
Office and computer equipment 764 764
Total plant and equipment at fair value 764 764 Fair value measurement hierarchy at 30 June 2015 (a) Land at fair value
Specialised land 348 889 348 889
Non-specialised land 17 302 17 302
Total land at fair value 366 191 366 191 Buildings at fair value
Buildings (including heritage buildings) 124 494 124 494 Total buildings at fair value 124 494 124 494 Plant and equipment at fair value
Office and computer equipment 2 116 2 116
Total plant and equipment at fair value 2 116 2 116
Note:
(a) See fair value hierarchy in Note 1(b).
There have been no transfers between levels during the period.

Department of Treasury and Finance Annual Report 2015 | 16 79
Land and buildings (including heritage buildings)
The market approach is used for land and buildings.
Specialised land is adjusted for heritage and community service obligations (CSO) to reflect the specialised nature of the land being valued.
The heritage and CSO adjustments are a reflection of the valuer’s assessment of the impact of restrictions associated with an asset to the extent that they are equally applicable to market participants. This approach is in light of the highest and best use consideration required for fair value measurement, and takes into account the use of the asset that is physically possible, legally permissible, and financially feasible. As heritage and CSO adjustments are considered as significant unobservable inputs, specialised land would be classified as Level 3 fair value assets.
For non-specialised land, the assets are compared to sales of comparable assets which are considered to have nominal or no added improvement value. The assets are classified as Level 3 under the market approach as they contain significant unobservable adjustments.
For the Department’s buildings, including heritage buildings, the market approach is adopted, adjusting for the associated depreciation. As rental per square metre, capitalisation rate and depreciation adjustments are considered as significant unobservable inputs in nature, specialised buildings are classified as Level 3 fair value assets.
Independent valuations of the Department’s specialised land and buildings were performed by the Valuer-General Victoria, Urbis, Napier and Blakeley Pty. Ltd. and Herron Todd White Pty. Ltd, as at 30 June 2012. The valuations were performed using the market approach adjusted for heritage and CSO.
In accordance with FRD 103F a managerial revaluation of land assets was performed at 30 June 2016 using indices supplied by the Victorian Valuer-General. The revaluation surplus in relation to the land assets amounted to $72 126 621.
Plant and equipment
Plant and equipment is held at fair value. When plant and equipment is specialised in use, such that it is rarely sold other than as part of a going concern, fair value is determined using the depreciated replacement cost method.
There were no changes in valuation techniques throughout the period to 30 June 2016. For all assets measured at fair value, the current use is considered the highest and best use.

80 Department of Treasury and Finance Annual Report 2015 | 16
Reconciliation of Level 3 fair value
Specialised land
Non- specialised
land
Buildings (including
heritage buildings)
Office and computer
equipment 2016 $’000 $’000 $’000 $’000
Opening balance 348 889 17 302 124 494 2 116 Net purchases/(sales) (11)
Transfers through contributed capital (554) (962)
Machinery of government transfers – –
Transfers between classes 9 235
Transfers to intangible assets
Transfers from/(to) held for sale (15 903)
Revaluation increment (net) 72 126
Net transfers free of charge (4) (38)
Depreciation (12 181) (1 303)
Closing balance 404 558 17 302 120 582 764 2015 Opening balance 348 889 17 291 139 353 3 878 Net purchases/(sales) – 65 195
Transfers through contributed capital
Machinery of government transfers – (2)
Transfer between classes 4 209 35
Transfer to intangible assets (618)
Transfer from/(to) held for sale 11
Net transfers free of charge
Revaluation increment (net) –
Depreciation (19 133) (1 372)
Closing balance 348 889 17 302 124 494 2 116
Description of significant unobservable inputs to Level 3 valuations
Valuation technique Significant Unobservable Inputs Specialised land Market approach CSO adjustment
Heritage adjustment
Non-specialised land Market approach Direct cost per square metre(a) /direct cost per parcel
Buildings (including heritage buildings)
Market approach (Net market rentals )
Rental income per square metre Capitalisation rate Useful life
Office and computer equipment
Depreciated replacement cost
Cost per unit Useful life
Note:
(a) Direct cost per square metre is a close approximation of the market cost per square metre.
The significant unobservable inputs remain unchanged from 2015.

Department of Treasury and Finance Annual Report 2015 | 16 81
Note 9. Intangible assets
2016 $’000
2015 $’000
Municipal valuations database 21 086 18 709
Less: accumulated depreciation (21 086) (5 548)
– 13 161
Capitalised software development 57 889 54 875
Less: accumulated depreciation (45 351) (41 053)
12 538 13 822
Intangible assets under development 1 696 2 530
Total intangible assets 14 234 29 513
Reconciliations of carrying amounts
Municipal valuations database
Carrying amount at the start of the year 13 161 –
Additions 2 377 18 709
Depreciation expense (Note 5) (15 538) (5 548)
Carrying amount at the end of the year – 13 161 Capitalised software development
Carrying amount at the start of the year 13 822 16 443
Additions 3 014 857
Net transfers from plant and equipment – 618
Depreciation expense (Note 5) (4 298) (4 096) Carrying amount at the end of the year 12 538 13 822 Intangible assets under development
Carrying amount at the start of the year 2 530 857
Additions 2 179 2 530
Transfers to assets (3 014) (857) Carrying amount at the end of the year 1 696 2 530

82 Department of Treasury and Finance Annual Report 2015 | 16
Note 10. Payables 2016
$’000 2015
$’000
Current: Contractual
Creditors and accruals 31 981 18 368
Statutory
Amounts payable to other government agencies 12 573 11 340
Total payables 44 554 29 708
Note 14 discloses the maturity analysis of contractual payables and the nature and extent of risks arising from contractual payables.
Note 11. Provisions 2016
$’000 2015
$’000
Current:
Employee benefits
• Annual leave
– expected to be settled within 12 months 7 247 6 985
– expected to be settled after 12 months 1 800 1 798
• Long service leave
– expected to be settled within 12 months 3 157 3 121
– expected to be settled after 12 months 20 326 17 712
• Performance bonus 827 743
33 357 30 359 Non-current:
Employee benefits
• Long service leave 2 587 2 395
2 587 2 395 Total provisions 35 944 32 754

Department of Treasury and Finance Annual Report 2015 | 16 83
Note 12. Borrowings 2016
$’000 2015
$’000
Current: Unsecured
Bank overdraft (Note 21) 933 401 Secured
Finance lease liabilities (Note 13) 2 297 1 916
3 230 2 317 Non-current: Secured
Finance lease liabilities (Note 13) 1 685 2 333
1 685 2 333 Aggregate carrying amount of borrowings
Current 3 230 2 317
Non-current 1 685 2 333
Total borrowings 4 915 4 650
Lease liabilities are effectively secured as the rights to the leased assets revert to the lessor in the event of default.
Assets pledged as security
The carrying amounts of non-current assets pledged as security are:
• Motor vehicles under finance lease 3 866 4 192
Note 14 discloses the maturity analysis of borrowings and the nature and extent of risks arising from borrowings.

84 Department of Treasury and Finance Annual Report 2015 | 16
Note 13. Leases 2016
$’000 2015
$’000
Operating lease receivables
The Department acts as a lessor for tenancies relating to its State-owned properties. The tenancy arrangements detail the lease terms, including options negotiated with the occupying departments. All tenancy arrangements contain market reviews in line with the biennial market rental valuations completed on the State-owned properties. The tenancy arrangements do not include an option to purchase the property at the expiry of the tenancy. These tenancy arrangements are not required to be recognised in the balance sheet.
Operating lease receivables
Due within one year 28 874 30 780
Due later than one year but not later than five years 115 496 123 119
144 370 153 899 Finance lease commitments
Commitments in relation to finance leases are payable as follows:
• Within one year 2 400 2 072
• Later than one year but not later than five years 1 732 2 391
Minimum lease payments 4 132 4 463
Less: future finance charges (150) (214) Total lease liabilities 3 982 4 249
Shown in the financial statements (Note 12) as:
• Current 2 297 1 916
• Non-current 1 685 2 333
3 982 4 249 Operating lease commitments
Commitments for minimum lease payments in relation to non-cancellable operating leases, not recognised as liabilities, are payable as follows:
• Within one year 6 552 6 517
• Later than one year but not later than five years 22 467 22 714
• Later than five years 2 306 6 401
31 325 35 633

Department of Treasury and Finance Annual Report 2015 | 16 85
Note 14. Financial instruments (a) Financial risk management objectives and policies Details of the significant accounting policies and methods adopted, including the criteria for recognition, the basis of measurement, and the basis on which income and expenses are recognised, with respect to each class of financial asset, financial liability and equity instrument are disclosed in Note 1.
The Department’s main financial risks include credit risk, liquidity risk and interest rate risk. The Department manages these financial risks in accordance with its financial risk management policy. The Department uses different methods to measure and manage the different risks.
(b) Categorisation of financial instruments
Carrying amount of financial instruments by category:
Notes Category 2016 $’000
2015 $’000
Financial assets
Cash and deposits 21 Loans and receivables 75 608 66 418
Receivables (a) 6 Loans and receivables 22 875 19 055
98 483 85 473 Financial liabilities
Payables (a) 10 Financial liabilities at amortised cost 31 981 18 368
Borrowings 12 Financial liabilities at amortised cost 4 915 4 650
36 896 23 018
Net holding gain/(loss) on financial instruments by category:
Category 2016 $’000
2015 $’000
Financial assets
Cash and deposits Loans and receivables 10 –
Receivables (a) Loans and receivables – –
10 – Financial liabilities
Payables (a) Financial liabilities at amortised cost
Borrowings Financial liabilities at amortised cost (100) (55)
(100) (55)
Note:
(a) Receivables and payables disclosed here exclude statutory receivables (i.e. amounts owing from Victorian Government and GST recoverable) and statutory payables (i.e. amounts payable to other government agencies).
The net holding gains or losses disclosed above are determined as follows:
• For cash and cash equivalents, loans or receivables and available for sale financial assets, the net gain or loss is calculated by taking the interest revenue minus any impairment recognised in the net result; and
• For financial liabilities measured at amortised cost, the net gain or loss is the interest expense.
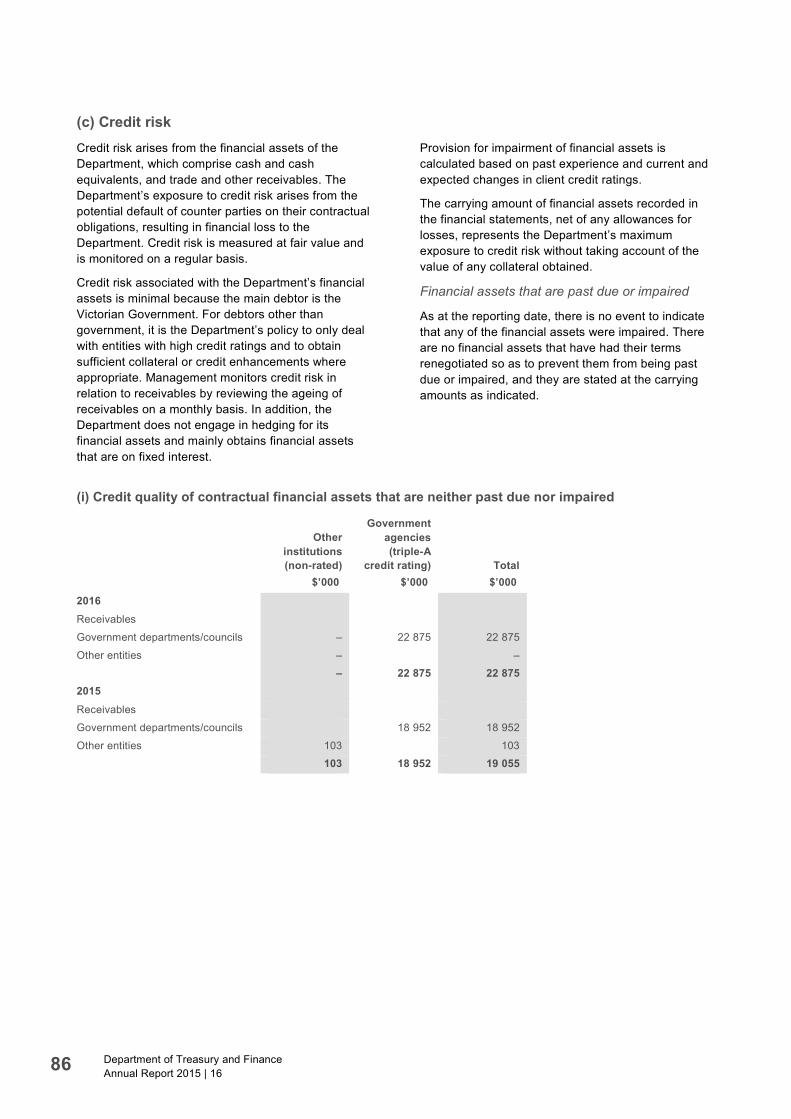
86 Department of Treasury and Finance Annual Report 2015 | 16
(c) Credit risk Credit risk arises from the financial assets of the Department, which comprise cash and cash equivalents, and trade and other receivables. The Department’s exposure to credit risk arises from the potential default of counter parties on their contractual obligations, resulting in financial loss to the Department. Credit risk is measured at fair value and is monitored on a regular basis.
Credit risk associated with the Department’s financial assets is minimal because the main debtor is the Victorian Government. For debtors other than government, it is the Department’s policy to only deal with entities with high credit ratings and to obtain sufficient collateral or credit enhancements where appropriate. Management monitors credit risk in relation to receivables by reviewing the ageing of receivables on a monthly basis. In addition, the Department does not engage in hedging for its financial assets and mainly obtains financial assets that are on fixed interest.
Provision for impairment of financial assets is calculated based on past experience and current and expected changes in client credit ratings.
The carrying amount of financial assets recorded in the financial statements, net of any allowances for losses, represents the Department’s maximum exposure to credit risk without taking account of the value of any collateral obtained.
Financial assets that are past due or impaired
As at the reporting date, there is no event to indicate that any of the financial assets were impaired. There are no financial assets that have had their terms renegotiated so as to prevent them from being past due or impaired, and they are stated at the carrying amounts as indicated.
(i) Credit quality of contractual financial assets that are neither past due nor impaired
Other
institutions (non-rated)
$’000
Government agencies (triple-A
credit rating) $’000
Total $’000
2016
Receivables
Government departments/councils – 22 875 22 875
Other entities – –
– 22 875 22 875 2015
Receivables
Government departments/councils 18 952 18 952
Other entities 103 103
103 18 952 19 055

Department of Treasury and Finance Annual Report 2015 | 16 87
(ii) Ageing analysis of contractual financial assets
Past due but not impaired
Carrying amount
$’000
Neither past due nor
impaired $’000
Less than 1 month
$’000
1–3 months
$’000
3 months–1 year $’000
1–5 years $’000
Greater than 5 years $’000
2016
Receivables 22 875 22 875
2015
Receivables 19 055 16 368 1 901 786
(d) Liquidity risk Liquidity risk arises when the Department is unable to meet its financial obligations as they fall due. The Department operates under the Government’s fair payments policy of settling financial obligations within 30 days and, in the event of a dispute, make payments within 30 days from the date of resolution. It also continuously manages risk to ensure that short-term funding needs can be met at all times and that the net interest cost on any short-term borrowings is minimised. These objectives are achieved by negotiating funding arrangements to ensure that the maximum expected short-term funding need can be met at all times and regular forecasting as a basis for borrowing or investing decisions.
The Department’s exposure to liquidity risk is deemed insignificant based on prior periods’ data and current assessment of risk.
Maximum exposure to liquidity risk is the carrying amounts of financial liabilities.
The following table discloses the contractual maturity analysis for the Department’s financial liabilities:
Maturity dates(a)
Carrying amount
Nominal amount
Less than 1 month
1–3 months
3 months– 1 year 1–5 years
Greater than 5 years
2016 $’000 $’000 $’000 $’000 $’000 $’000 $’000
Payables 31 981 31 981 31 981
Bank overdrafts 933 933 933
Finance lease liabilities 3 982 4 132 480 420 1 500 1 732
36 896 37 046 33 394 420 1 500 1 732
2015
Payables 18 368 18 368 18 368
Bank overdrafts 401 401 401
Finance lease liabilities 4 249 4 463 315 220 1 537 2 391
23 018 23 232 19 084 220 1 537 2 391 –
Note:
(a) The amounts disclosed are the contractual undiscounted cash flows of each class of financial liabilities.

88 Department of Treasury and Finance Annual Report 2015 | 16
(e) Market risk The Department’s exposures to market risk are primarily through interest rate risk, which it manages by matching borrowing and investment decisions to projected forecasts. The Department has no exposure to foreign currency or other price risks.
Interest rate risk
Exposure to interest rate risk is insignificant and may arise primarily through the Department’s borrowings. Minimisation of risk is achieved by mainly undertaking fixed rate or non-interest bearing financial instruments. For financial liabilities, the Department mainly undertakes financial liabilities with relatively even maturity profiles. The Department’s borrowings are managed by Treasury Corporation of Victoria and any movements in interest rates are monitored on a daily basis.
The Department’s exposure to interest rate risk is set out below:
Interest rate exposure
Weighted average
effective interest rate
Carrying amount
Fixed interest rate
Variable interest rate
Non-interest bearing
2016 % $’000 $’000 $’000 $’000
Financial assets
Cash and deposits 75 608 75 608
Receivables 22 875 22 875
98 483 98 483
Financial liabilities
Payables 31 981 31 981
Bank overdrafts 933 933
Finance lease liabilities 5.3 3 982 3 982
36 896 3 982 32 914
2015
Financial assets
Cash and deposits – 66 418 66 418
Receivables – 19 055 19 055
85 473 – – 85 473
Financial liabilities
Payables – 18 368 18 368
Bank overdrafts – 401 401
Finance lease liabilities 5.3 4 249 4 249
23 018 4 249 – 18 769

Department of Treasury and Finance Annual Report 2015 | 16 89
Sensitivity disclosure analysis
The Department’s sensitivity to market risk is determined based on the observed range of actual historical data for the preceding five year period, with all variables other than the primary risk variable held constant. The Department’s fund managers cannot be expected to predict movements in market rates and prices. Sensitivity analyses shown are for illustrative purposes only. The following movements in market interest rates are ‘reasonably possible’ over the next 12 months – a movement of 100 (2015 – 100) basis points up and down.
The impact on net operating result and equity for each category of financial instruments held by the Department at year end, as presented to key management personnel, if the above movements were to occur, is immaterial for the 2016 and 2015 financial years.
(f) Fair value of financial assets and liabilities The Department considers that the carrying amount of financial assets and financial liabilities recorded in the financial statements approximates their fair values.
The fair values of financial assets and financial liabilities are determined as follows:
• Level 1 – the fair value of financial assets and financial liabilities with standard terms and conditions and traded on active liquid markets are determined with reference to quoted market prices;
• Level 2 – the fair value is determined using inputs other than quoted prices that are observable for the financial asset or liability, either directly or indirectly; and
• Level 3 – the fair value of other financial assets and financial liabilities is determined in accordance with generally accepted pricing models based on discounted cash flow analysis using unobservable market inputs.
None of the classes of financial assets and liabilities are readily traded on organised markets in standardised form.
The Department currently holds a range of financial instruments that are recorded in the financial statements where the carrying amounts are a reasonable approximation of fair value, either due to their short-term nature or with the expectation that they will be paid in full by the end of the 2015-16 reporting period.

90 Department of Treasury and Finance Annual Report 2015 | 16
Note 15. Commitments for expenditure 2016
$’000 2015
$’000
Capital commitments Contracted commitments for capital expenditure on building improvements, fitouts and IT development, at the reporting date but not recognised as liabilities, and payable:
• within one year 15 125 17 765
• later than one year but not later than five years – –
15 125 17 765 Outsourcing commitments
Commitments under outsourcing contracts for human resource, property management and security services, and payable:
• within one year 15 189 13 332
• later than one year but not later than five years 2 686 9 926
17 875 23 258 In addition, the outsourcing of information technology services is subject to an open-ended memorandum of understanding with an annual cost to the Department of $6 500 000.
Other commitments
Under a State purchase contract the State is obligated to take a minimum contracted quantity of natural gas over a three year period ending 31 December 2017. The balance of the minimum contracted quantity yet to be taken up at 30 June 2016 amounts to $1 870 000.
Operating lease commitments are disclosed in Note 13.
Note 16. Contingent liabilities and contingent assets Quantifiable contingent liabilities The following table summarises quantifiable contingent liabilities relating to the Department.
2016 $m
2015 $m
Specific guarantees and indemnities under statute 263 296
Guarantees for loans to water industry entities 10 485 10 381
Guarantees for loans to other entities 572 600
Litigation against State Revenue Office 58 89
Other 89 93
Total 11 467 11 459

Department of Treasury and Finance Annual Report 2015 | 16 91
Non-quantifiable contingent liabilities The Department has a number of non-quantifiable contingent liabilities as follows.
Land remediation – environmental concerns
In addition to properties for which remediation costs have been provided in the State’s financial statements, certain other properties have been identified as potentially contaminated sites. The State does not admit any liability in respect of these sites. However, remedial expenditure may be incurred to restore the sites to an acceptable environmental standard in the event a contamination risk has been identified.
Victorian Managed Insurance Authority – insurance cover
The Victorian Managed Insurance Authority (VMIA) was established in 1996 as an insurer for state government departments, participating bodies and other entities as defined under the Victorian Managed Insurance Authority Act 1996. The VMIA provides its clients with a range of insurance cover, including for property, public and products liability, professional indemnity and contract works. The VMIA reinsures in the private market for losses above $50 million arising out of any one occurrence, up to a maximum of $1 billion for public and products liability, and for losses above $50 million arising out of any one event, up to a maximum of $3.35 billion for property. The risk of losses above these reinsured levels is borne by the State.
With effect from 28 August 2015, VMIA purchased additional reinsurance cover for property and public liability losses to better cover the State’s potential liabilities.
The VMIA also insures the Department of Health and Human Services for all public sector medical indemnity claims incurred in each policy year from 1 July 2003, regardless of when claims are finally settled. Under the indemnity deed to provide stop loss protection for the VMIA, the Department of Treasury and Finance has agreed to reimburse the VMIA if the ultimate claims payouts exceed by more than 20 per cent of the initial estimate on which the risk premium was based.
December 2015 bushfires
On 19 and 25 December 2015, Victoria experienced significant loss and damage to homes, community properties, roads and infrastructure as a result of several large bushfires in widespread parts of Victoria including the Wye River, Separation Creek, Barnawartha and Scotsburn areas.
In order to minimise the environmental, social and economic impact of the bushfires, the State developed a comprehensive project plan with a single contractor (Grocon) for a coordinated clean-up of residential properties which home-owners could opt into.
Given the safety concerns and complexities involved in the removal of bushfire waste in the affected areas, the Victorian Government is contributing towards the cost of the clean-up. The costs of the clean-up will be jointly shared with the insurers and the Commonwealth Government (under Category A of the Commonwealth-State Natural Disaster Relief and Recovery Arrangements (NDRRA)).
Any assistance for individuals and households, and local councils is provided jointly under the NDRRA by the Victorian and Commonwealth Governments. At this stage it is impractical to quantify the financial effects of these contingent liabilities.
Public lottery licence litigation
On 27 August 2014, Intralot Australia Pty Ltd (Intralot) served a Writ and Statement of Claim on the State seeking damages of $63.4 million and costs. Intralot alleges Tattersall's Sweeps Pty Ltd were granted favourable treatment with respect to the awarding of public lottery licenses on 24 October 2007. The State has lodged its defence and the Court has ordered mediation take place before the matter is listed for a directions hearing towards the end of 2016.
Other contingent liabilities not quantified There are other commitments, made by Government, which are not quantifiable at this time, arising from:
• indemnities provided in relation to transactions, including financial arrangements and consultancy services, as well as for directors and administrators;
• performance guarantees, warranties, letters of comfort;
• deeds in respect of certain obligations; and
• unclaimed monies, which may be subject to future claims by the general public against the State.

92 Department of Treasury and Finance Annual Report 2015 | 16
Note 17. Responsible persons The persons who held the positions of Ministers and Accountable Officer in the Department (from 1 July 2015 to 30 June 2016 unless otherwise stated) were as follows:
• Tim Pallas MP, Treasurer of Victoria
• Robin Scott MP, Minister for Finance
• Mr David Martine, Secretary
David Webster, Melissa Skilbeck and Gayle Porthouse acted in the office of Secretary during absences of David Martine.
Robin Scott MP and Gavin Jennings MLC acted for the Treasurer during the absences of Tim Pallas MP.
Tim Pallas MP and Gavin Jennings MLC acted for the Minister for Finance during the absences of Robin Scott MP.
Remuneration Total remuneration received or receivable by the Accountable Officer, in connection with the management of the Department during the reporting period, was in the income bands in the table below:
Income band 2016 No.
2015 No.
$550 000–$559 999 1
$580 000–$589 999 1
Amounts relating to Ministers are reported in the financial statements of the Department of Premier and Cabinet. For information regarding related party transactions of ministers, the register of members’ interests is publicly available from www.parliament.vic.gov.au/publications/register-of-interests.
Amounts relating to acting Accountable Officers are reported in “Remuneration of executives” (Note 18).
Other transactions Other related transactions and loans requiring disclosure under the Directions of the Minister for Finance have been considered and there are no matters to report.

Department of Treasury and Finance Annual Report 2015 | 16 93
Note 18. Remuneration of executives The numbers of executive officers, other than Ministers and the Accountable Officer, whose total remuneration exceeded $100 000 during the reporting period, are shown in their relevant income bands in the first two columns of the table below. The base remuneration of these executive officers is shown in the third and fourth columns. Base remuneration is exclusive of bonus payments, long service leave payments, redundancy payments and retirement benefits.
Total remuneration Base remuneration Income band 2016
No. 2015
No. 2016
No. 2015
No.
$30 000–$39 999 1 –
$40 000–$49 999 1 –
$50 000–$59 999 1 –
$80 000–$89 999 1 –
$90 000–$99 999 1 1
$100 000–$109 999 – 2 1 3
$110 000–$119 999 6 1 2 –
$120 000–$129 999 2 – 1 2
$130 000–$139 999 2 2 2 2
$140 000–$149 999 3 4 4 3
$150 000–$159 999 2 5 3 11
$160 000–$169 999 7 10 10 11
$170 000–$179 999 10 11 11 7
$180 000–$189 999 8 4 3 6
$190 000–$199 999 5 5 7 7
$200 000–$209 999 3 8 2 1
$210 000–$219 999 4 3 2 4
$220 000–$229 999 2 5 6 7
$230 000–$239 999 5 5 3 –
$240 000–$249 999 2 – 1 2
$260 000–$269 999 1 1
$270 000–$279 999 1 –
$280 000–$289 999 1 1
$290 000–$299 999 1 – 1
$300 000–$309 999 1 1 1 1
$310 000–$319 999 1 1 –
$320 000–$329 999 1 –
$330 000–$339 999 2
$350 000–$359 999 1 2 1
$370 000–$379 999 1 –
$460 000–$469 999 – 1
Total numbers 68 71 68 71 Total amount $’000 13 051 12 829 12 268 11 971 Total annualised employee equivalents
62 67.8 62 67.8

94 Department of Treasury and Finance Annual Report 2015 | 16
Note 19. Remuneration of auditors 2016
$’000 2015
$’000
Audit fees paid or payable to the Victorian Auditor-General’s Office
Annual financial statements of the Department 426 416
Annual financial report for the State of Victoria 384 374
Annual budget for the State of Victoria 434 395
Commonwealth acquittals – 20
1 244 1 205
No other services were provided by the Victorian Auditor-General’s Office.
Note 20. Superannuation Employees of the Department are entitled to receive superannuation benefits and the Department contributes to both defined benefit and defined contribution plans. The defined benefit plans provide benefits based on years of service and final average salary.
The Department does not recognise any defined benefit liability in respect of the plans because the Department has no legal or constructive obligation to pay future benefits relating to its employees. Its only obligation is to pay superannuation contributions as they fall due. The State’s superannuation liability with respect to defined benefits superannuation funds operated principally for General Government Sector employees is administered by this Department on behalf of the State and is recognised and disclosed as an administered item in these financial statements (Note 22).
However, superannuation contributions for the period relating to departmental employees are included as part of employee benefit costs in the comprehensive operating statement of the Department (Note 5).
The Department made contributions to the following major superannuation funds during the year:
Defined benefit funds Emergency Services and State Super
• Revised Scheme
• New Scheme
• State Employees Retirement Benefit Scheme
• Transport Scheme
Accumulation funds VicSuper
The Department does not have any contributions outstanding to the above funds and there have been no loans made from the funds. The bases for contributions are determined by the various schemes.

Department of Treasury and Finance Annual Report 2015 | 16 95
Note 21. Cash flow information 2016
$’000 2015
$’000
(a) Reconciliation of cash and deposits
Cash at bank and on hand 2 4
Funds held in trust 75 606 66 414
Total cash and deposits disclosed in the balance sheet 75 608 66 418
The above figures are reconciled to cash and cash equivalents at the end of the year as shown in the cash flow statement as follows:
Balances as above 75 608 66 418
Less: bank overdrafts (Note 12) (933) (401)
Cash and cash equivalents per cash flow statement 74 675 66 017
Due to the State of Victoria’s investment policy and government funding arrangements, the Department does not hold a large cash reserve in its bank accounts. Cash received by the Department from the generation of income is generally paid into the State’s bank account, known as the Public Account. Similarly, any departmental expenditure, including that in the form of cheques drawn by the Department for the payment of goods and services to its suppliers and creditors, are made via the Public Account. The process is such that the Public Account remits to the Department the cash required for the amount drawn on the cheques. This remittance by the Public Account occurs upon the presentation of the cheques by the Department’s suppliers or creditors.
The above funding arrangements often result in the Department having a notional shortfall in the cash at bank (or a notional bank overdraft) required for payment of unpresented cheques at balance date. The Department’s bank overdraft balance at 30 June 2016 was totally represented by unpresented cheques.

96 Department of Treasury and Finance Annual Report 2015 | 16
2016 $’000
2015 $’000
(b) Reconciliation of net result to net cash flows from operating activities
Net result 1 464 6 458
Depreciation expense 35 422 32 205
Net gain on disposal of property, plant and equipment (126) (34)
Net transfers free of charge 40 –
Change in operating assets and liabilities, net of effects of restructuring
(Increase)/decrease in receivables (31 794) (20 900)
(Increase)/decrease in other operating assets 428 2 670
Increase/(decrease) in payables 14 849 2 087
Increase/(decrease) in other operating liabilities 2 985 2 891
Net cash flows from operating activities 23 268 25 377

Department of Treasury and Finance Annual Report 2015 | 16 97
(c) Non-cash financing and investing activities
During the reporting period, motor vehicles with a fair value of $1 856 000 (2015 – $2 276 000) were acquired by means of finance leases.
During the reporting period, assets amounting to $40 000 (2015 – $nil) were transferred out from the Department to other organisations. These transfers were recognised in the comprehensive operating statement as resources transferred/received free of charge.
Note 22. Administered items In addition to the specific departmental operations which are included in the balance sheet, comprehensive operating statement and cash flow statement, the Department administers or manages activities on behalf of the State. The transactions relating to these State activities are reported as administered in this note. Administered transactions give rise to income, expenses, assets and liabilities and are determined on an accrual basis. Administered income includes taxes, fees, Commonwealth grants, capital asset charges to other departments and the proceeds from the sale of surplus land and buildings. Administered assets include Public Account investments, government revenues earned but yet to be collected and the State’s motor vehicle finance lease receivables. Administered liabilities include the Government’s Budget Sector Debt Portfolio, superannuation liabilities managed on behalf of the State, amounts associated with the SECV indemnity and borrowings related to the State’s motor vehicle leasing operations.
In 2013-14 the State received $1.5 billion from the Commonwealth Government as a contribution towards the former East West Link project. This was recorded as Administered income from transactions in Note 22 Administered Items. Following the election in November 2014, the new Victorian Government confirmed that the East West Link project would not proceed and that it would not return the $1.5 billion to the Commonwealth Government. The Department subsequently sought independent legal and accounting advice on the appropriate accounting treatment for this transaction in the 2014-15 financial year.
This advice has concluded that the Department is not required to recognise a liability under Australian Accounting Standards AASB 1004 Contributions and AASB 137 Provisions, Contingent Liabilities and Contingent Assets as there is no present obligation on the State to return the funding previously received for the project.
In April 2016, the Victorian Government accepted an offer from the Commonwealth to retain the funding for new road and rail infrastructure projects, and confirmed that the State will work with the Commonwealth over coming months to finalise project selection, relative contributions, and to progress necessary planning and implementation arrangements. On 30 August 2016, the State forwarded a comprehensive proposal to the Commonwealth broadly consistent with the earlier communicated proposal, with discussions continuing towards finalisation of an agreement. On this basis, no liability or expense has been recognised by the State in relation to this transaction.

98 Department of Treasury and Finance Annual Report 2015 | 16
Note 22. Administered items (continued) Administered income and expenses for the year ended 30 June 2015
Sound financial
management of Victoria’s fiscal resources
Drive improvement in public sector asset
management and the delivery of infrastructure
2016 2015 2016 2015
$’000 $’000 $’000 $’000
Administered income from transactions
Payments on behalf of the State appropriations (Note 4(a)) 1 463 126 1 435 685 1 178 8 044
Special appropriations (Note 4(b)) 1 050 084 134 676
Commonwealth grants 9 286 23 046
Taxation 16 285 911 14 690 902
Dividends 387 042 822 267
Capital asset charge
Interest 20 055 43 048
Other income 179 837 141 015 7 345 10 617
State revenues received into Consolidated Fund, net of appropriations applied within government departments
Total administered income from transactions 19 386 055 17 267 593 17 809 41 707 Administered expenses from transactions
Grants expense 285 440 232 083
Interest expense 1 260 081 1 263 501
Superannuation – non-departmental
Contribution to GST administration costs
Ex-gratia payments (a) 4 433 41 286
Other expenses (b) 341 108 23 771 1 177 1 358
Payments to Consolidated Fund 16 840 964 16 385 940 10 683 27 715
Total administered expenses from transactions 18 732 026 17 946 581 11 860 29 073 Administered net result from transactions 654 029 (678 988) 5 949 12 634
Other economic flows included in net result
Net gain/(loss) on non-financial assets 3 1 1 266 1 291
Net gain/(loss) on financial instruments (c) 134 404 (31 059)
Other gains/(losses) from other economic flows
Total other economic flows included in net result 134 407 (31 058) 1 266 1 291
Administered net result 788 436 (710 046) 7 215 13 925
Other economic flows – other comprehensive income
Remeasurement of superannuation defined benefit plans
Administered comprehensive result 788 436 (710 046) 7 215 13 925
Notes:
(a) Ex-gratia payments in the prior year mainly represent tax relief provided by the State in various circumstances including hardship and was conditionally granted in relation to duty assessed on a proposed corporate restructure. The offer for relief will be withdrawn if certain conditions of the relief are not met.
(b) The prior year amount includes a provision made by the State for the costs of settlement in relation to the discontinuation of the East West Link Project in 2014-15.
(c) The prior year amount includes a gain on disposal of investments in Rural Finance Corporation recorded by the Department on behalf of the State in 2014-15.

Department of Treasury and Finance Annual Report 2015 | 16 99
Deliver efficient whole of government common
services to the Victorian public sector
Guide government actions to increase
Victoria’s productivity and competitiveness
Other – Not attributable Departmental total
2016 2015 2016 2015 2016 2015 2016 2015
$’000 $’000 $’000 $’000 $’000 $’000 $’000 $’000
181 14 570 294 245 288 269 1 758 730 1 746 568
1 141 545 1 147 028 2 191 629 1 281 704
12 990 944 11 984 132 6 585 726 6 671 030 19 585 956 18 678 208
16 285 911 14 690 902
387 042 822 267
4 647 788 4 382 633 4 647 788 4 382 633
4 730 5 233 24 785 48 281
3 493 2 815 103 079 14 143 293 754 168 590
1 081 720 1 747 875 1 081 720 1 747 875
8 404 22 618 18 036 056 16 669 177 8 808 991 9 565 933 46 257 315 43 567 028
126 057 129 021 2 835 372 2 874 952 3 246 869 3 236 056
6 178 6 835 1 528 4 743 1 267 787 1 275 079
1 211 819 1 318 332 1 211 819 1 318 332
168 254 169 332 168 254 169 332
4 433 41 286
2 094 3 977 1 035 1 844 – 615 000 345 414 645 950
1 932 1 531 17 741 811 16 380 908 3 750 353 3 796 078 38 345 743 36 592 172
10 204 12 343 18 037 157 16 681 105 7 799 072 8 609 105 44 590 319 43 278 207
(1 800) 10 275 (1 101) (11 928) 1 009 919 956 828 1 666 996 288 821
(1 394) 7 (125) 1 299
(85 069) 405 845 49 335 374 786
(6) (1) – (11 299) (6) (11 300)
(1 400) 6 – – (85 069) 394 546 49 204 364 785
(3 200) 10 281 (1 101) (11 928) 924 850 1 351 374 1 716 200 653 606
(3 220 255) 551 305 (3 220 255) 551 305
(3 200) 10 281 (1 101) (11 928) (2 295 405) 1 902 679 (1 504 055) 1 204 911

100 Department of Treasury and Finance Annual Report 2015 | 16
Note 22. Administered items (continued) Administered assets and liabilities as at 30 June 2016
Sound financial
management of Victoria’s fiscal resources
Drive improvement in public sector asset management
and the delivery of infrastructure
2016 2015 2016 2015
$’000 $’000 $’000 $’000
Administered assets Financial assets
Cash and deposits 1 450 050 1 074 386
Receivables 1 863 347 2 035 215 1 936 5 281
Investments in controlled entities (a)
Other financial assets 13 875 833
3 313 410 3 985 434 1 936 5 281 Non-financial assets
Prepayments
Property, plant and equipment
– – – – Total administered assets 3 313 410 3 985 434 1 936 5 281
Administered liabilities Payables 70 516 76 779 30 617 28 976
Public Account SAU liability (b)
Provisions 46 967 65 370 1 336 2 407
Unearned income 68 501 74 545
Borrowings 24 167 993 25 540 477
Superannuation liability (c) Total administered liabilities 24 285 476 25 682 626 100 454 105 928 Net administered assets (20 972 066) (21 697 192) (98 518) (100 647)
Notes:
(a) On behalf of the State, the Department records the State’s investment in all its controlled entities, as an administered asset. This amount equates to the contributed capital balances of the underlying entities at year end.
(b) Net payable to other government departments relating to (a) Parliamentary appropriations applied, from which funds have not been issued from the Consolidated Fund, net of Public Account advances; and (b) Trust Fund amounts held on their behalf.
(c) On behalf of the State, the Department records the State’s superannuation liability with respect to superannuation funds operated principally for general government sector employees and the liability for accrued benefits arising from constitutionally protected pension entitlements principally in respect of judges and other judicial office holders.

Department of Treasury and Finance Annual Report 2015 | 16 101
Deliver efficient whole of government common
services to the Victorian public sector
Guide government actions to increase
Victoria’s productivity and competitiveness
Other – Not attributable Departmental total
2016 2015 2016 2015 2016 2015 2016 2015
$’000 $’000 $’000 $’000 $’000 $’000 $’000 $’000
256 735 171 431 1 706 785 1 245 817
230 936 239 647 81 675 51 001 374 212 418 127 2 552 106 2 749 271
97 955 474 93 681 171 95 955 474 93 681 171
13 875 833
230 936 239 647 81 675 51 001 96 586 421 94 270 729 100 214 378 98 552 092
– 1 123 – 1 123
23 – 23 –
23 1 123 – – – – 23 1 123 230 959 240 770 81 675 51 001 96 586 421 94 270 729 100 214 401 98 553 215
16 509 19 639 20 809 27 901 352 176 348 127 490 627 501 422
8 945 261 8 040 652 8 945 261 8 040 652
223 202 48 526 67 979
68 501 74 545
226 316 218 793 24 394 309 25 759 270
29 288 956 25 946 685 29 288 956 25 946 685
243 048 238 634 20 809 27 901 38 586 393 34 335 464 63 236 180 60 390 553
(12 089) 2 136 60 866 23 100 58 000 028 59 935 265 36 978 221 38 162 662

102 Department of Treasury and Finance Annual Report 2015 | 16
Note 22. Administered items (continued) The Department manages the State’s superannuation liability by:
• conducting regular actuarial valuations of the State’s public sector superannuation schemes;
• monitoring the performance of the associated superannuation assets, the majority of which are required to be invested through the Victorian Funds Management Corporation (VFMC);
• prudentially supervising VFMC; and
• providing advice to government on a wide range of superannuation issues.
The State’s superannuation liability with respect to superannuation funds operated principally for general government sector employees was $29 289 million as at 30 June 2016 (2015 – $25 947 million). This liability primarily represents the State’s share of the shortfall between the total net assets of the State’s general government sector superannuation funds and the present value of total benefits that members have accrued up to that date, as determined by an actuarial assessment.
The balance of the superannuation liability with respect to these funds is to be met by Commonwealth funded agencies (for example, universities). In accordance with the State Superannuation Act 1988, the Government, through the Consolidated Fund, is primarily responsible for meeting the employer’s share of the superannuation liability of the State Superannuation Fund section of the Emergency Services Superannuation Scheme. However, under the terms of that Act, the responsible Minister can effectively pass this liability to individual authorities.
The liability also includes $890 million (2015 – $895 million) for accrued benefits arising from constitutionally protected pension entitlements, principally in respect of judges and other judicial office holders. No assets are held in respect of these liabilities and the associated pensions are paid from the Consolidated Fund.
2016 $m
2015 $m
Reconciliation of the present value of the defined benefit obligation
Balance at the start of the period 45 991 44 931
Current service cost 766 719
Interest cost 1 564 1 778
Contributions by plan participants 219 211
Actuarial (gains)/losses 2 864 572
Benefits paid (2 083) (2 221)
Balance at the end of the period 49 321 45 990 Reconciliation of fair value of superannuation plan assets
Balance at the start of the period 20 044 18 677
Interest income 686 740
Expected return on plan assets excluding interest income 787 630
Actuarial gains/(losses) (1 143) 493
Employer contributions 1 522 1 513
Contributions by plan participants 219 211
Benefits paid (including tax paid) (2 083) (2 221) Balance at the end of the period 20 032 20 043 Reconciliation of assets and liabilities disclosed in the administered statement of assets and liabilities
State Superannuation Fund/Emergency Services Superannuation Scheme
28 298 24 968
Other funds 991 979
Total superannuation liability 29 289 25 947

Department of Treasury and Finance Annual Report 2015 | 16 103
2016 %
2015 %
Actuarial assumptions
State Superannuation Fund/Emergency Services Superannuation Scheme
Expected return on assets 8.0 8.0
Discount rate 2.4 3.5
Wages growth 3.1 3.7
Inflation rate 1.6 2.2
Constitutionally Protected Pensions
Discount rate 2.4 3.5
Wages growth 3.1 3.7
Inflation rate n/a n/a
Health Superannuation Fund
Expected return on assets 5.8 5.8
Discount rate 2.4 3.5
Wages growth 3.1 3.7
Inflation rate 1.6 2.2
The expected return on assets assumption is determined by weighting the expected long-term return for each asset class by the target allocation of assets to each class.
Categories of plan assets 2016 %
2015 %
The major categories of plan assets are as follows:
Domestic equity 26.7 26.8
International equity 26.7 26.8
Domestic debt assets 17.5 17.4
Property 7.6 7.6
Cash 4.2 4.2
Other 17.3 17.2
100.0 100.0

104 Department of Treasury and Finance Annual Report 2015 | 16
Note 23. Trust account balances (a) Cash and cash equivalents of trust accounts included in the financial statements
2016
Opening balance
Machinery of government
changes Inflows Outflows Closing balance
$’000 $’000 $’000 $’000 $’000 Controlled trusts
Finance Agency Trust 49 728 58 688 (54 101) 54 315
Government Accommodation Trust 6 176 35 892 (38 394) 3 674
Shared Corporate Services Trust Account 896 72 997 (62 823) 11 070
Treasury Trust 9 621 521 (4 183) 5 959
Master Agencies Media Services Trust – 976 3 214 (3 613) 577
Vehicle Lease Trust (7) 32 (14) 11 Total controlled trusts 66 414 976 171 344 (163 128) 75 606 Administered trusts
Asset Sales Deposit Trust Account – 5 – 5
Cattle Compensation Fund – 5 045 (5 045) –
Community Support Fund Trust 37 853 99 513 (104 575) 32 791
Debt Portfolio Trust 451 363 – (450 000) 1 363
Land Acquisition and Compensation Trust 146 – (146) –
Public Service Commuter Club Trust (145) 521 (544) (168)
Security Trust 27 247 16 574 (13 391) 30 430
Sheep And Goat Compensation Fund – 1 296 (1 296) –
Swine Compensation Trust – 190 (190) –
Treasury Trust (145) 2 843 332 (2 835 478) 7 709
Vehicle Lease Trust 16 217 179 340 (173 442) 22 115
Victorian Natural Disasters Relief Account 144 566 16 546 (32 806) 128 306
Victorian Transport Fund – – – – Total administered trusts 677 102 3 162 362 (3 616 913) 222 551
The Master Agencies Media Services Trust was transferred from the Department of Premier and Cabinet effective 1 July 2015 following the approval of the Special Minister of State. During the year, the Victorian Transport Fund was created under the Delivering Victorian Infrastructure (Port of Melbourne Lease Transaction) Act 2016.

Department of Treasury and Finance Annual Report 2015 | 16 105
2015
Opening balance Inflows Outflows
Closing balance
$’000 $’000 $’000 $’000
41 250 45 357 (36 879) 49 728
7 547 40 962 (42 333) 6 176
3 247 60 350 (62 701) 896
9 599 764 (742) 9 621
– – – –
– 31 (38) (7)
61 643 147 464 (142 693) 66 414
711 – (711) –
– 4 348 (4 348) –
53 444 96 514 (112 105) 37 853
1 363 450 000 – 451 363
146 – – 146
(209) 565 (501) (145)
39 596 68 810 (81 159) 27 247
– 1 404 (1 404) –
– 180 (180) –
(268) 2 881 791 (2 881 668) (145)
27 416 168 708 (179 907) 16 217
179 551 14 343 (49 328) 144 566
– – – –
301 750 3 686 662 (3 311 310) 677 102

106 Department of Treasury and Finance Annual Report 2015 | 16
(b) Victorian Natural Disasters Relief Account
The Victorian Natural Disasters Relief Account was established to provide natural disaster relief in accordance with the Commonwealth-State Natural Disaster Arrangements. Monies from the Trust are paid to individuals, small businesses, primary producers and local councils by appropriate service delivery departments, following the approval of the Treasurer or his delegate.
The following assistance measures are provided from the trust:
• grants for the relief of personal hardship and distress;
• loan assistance and grants provided by the former Rural Finance Corporation;
• grants for emergency protection and asset restoration works; and
• restoration of municipal and other public assets.
The cash and cash equivalents of the Trust for the reporting period were:
2016 $’000
2015 $’000
Opening balance 144 566 179 551 Inflows
Grants from the Commonwealth –
Appropriation revenue 16 546 14 343
161 112 14 343 Outflows
Grants to other government departments, agencies and authorities 8 853 23 386
Grants to local government 12 768 24 013
Grants to not-for-profit organisations and rural communities 10 721 1 890
Audit fees – 39
Other operating costs 464 –
32 806 49 328 Closing balance 128 306 144 566

Department of Treasury and Finance Annual Report 2015 | 16 107
Note 24. Machinery of government changes
Effective 22 September 2015, pursuant to a declaration under section 30 of the Public Administration Act 2004 the secretariat supporting the Victorian Competition and Efficiency Commission was transferred to the Department of Treasury and Finance to support the new Commissioner for Better Regulation.
The net assets transferred as a result of the administrative restructure were recognised at the carrying amount of those assets and liabilities in the transferor’s balance sheet immediately before the transfer. Where applicable, the net asset transfers were treated as contributions of capital by the Crown. No income or expense has been recognised by the Department in respect of the net assets transferred. The Department recognised the following assets and liabilities at the date of transfer:
$’000
Secretariat supporting the Commissioner for Better Regulation Output group – Guide government actions to increase Victoria’s productivity and competitiveness
Assets
Receivables 587
Property plant and equipment 173
Liabilities Payables (551)
Provision for employee benefits (36)
Net assets recognised by the Department 173 Effective 1 July 2015, the Special Minister of State approved the transfer of the Master Agency Media Services trust from the Department of Premier and Cabinet. Master Agency Media Services Trust Output group – Deliver efficient whole of government common services to the Victorian public sector
Assets
Cash 975
Receivables 53
Liabilities
Payables (649)
Provisions (13)
Net assets recognised by the Department 366

108 Department of Treasury and Finance Annual Report 2015 | 16
Note 25. Glossary of terms Actuarial gains or losses on superannuation defined benefit plans
Actuarial gains or losses reflect movements in the superannuation liability resulting from differences between the assumptions used to calculate the superannuation expense from transactions and actual experience.
Administered item
Administered item generally refers to a department lacking the capacity to benefit from that item in the pursuit of the department’s objectives and to deny or regulate the access of others to that benefit.
Annualised employee equivalent
Annualised employee equivalent is based on paid working hours of 38 ordinary hours per week over 52 weeks for a reporting period.
Borrowings
Borrowings include interest-bearing liabilities mainly from public borrowings raised through the Treasury Corporation of Victoria, finance leases and other interest-bearing arrangements. Borrowings also include non-interest-bearing advances from government that are incurred for policy purposes.
Comprehensive result
The net result of all items of income and expense recognised for the period. It is the aggregate of operating result and other comprehensive income.
Controlled item
Controlled item generally refers to the capacity of a department to benefit from that item in the pursuit of the department’s objectives and to deny or regulate the access of others to that benefit.
Capital asset charge
A charge levied on the written-down value of controlled non-current physical assets in a department’s balance sheet which aims to: attribute to agency outputs the opportunity cost of capital used in service delivery; and provide incentives to departments to identify and dispose of underutilised or surplus assets in a timely manner. The capital asset charge is calculated on the budgeted carrying amount of applicable non-financial physical assets.
Commitments
Commitments include those operating, capital and other outsourcing commitments arising from non-cancellable contractual or statutory sources.
Depreciation
Depreciation is an expense that arises from the consumption through wear or time of a produced physical or intangible asset. This expense is classified as a transaction and so reduces the net result from transactions.
Employee expenses
Employee expenses include all costs related to employment including wages and salaries, fringe benefits tax, leave entitlements, redundancy payments and superannuation contributions.
Ex gratia expenses
The voluntary payment of money or other non-monetary benefit (e.g. a write off) that is not made either to acquire goods, services or other benefits for the entity or to meet a legal liability, or to settle or resolve a possible legal liability or claim against the entity.
Financial asset
A financial asset is any asset that is:
(a) cash;
(b) an equity instrument of another entity;
(c) a contractual right:
− to receive cash or another financial asset from another entity; or
− to exchange financial assets or financial liabilities with another entity under conditions that are potentially favourable to the entity; or
(d) a contract that will or may be settled in the entity’s own equity instruments and is:
− a non-derivative for which the entity is or may be obliged to receive a variable number of the entity’s own equity instruments; or
− a derivative that will or may be settled other than by the exchange of a fixed amount of cash or another financial asset for a fixed number of the entity’s own equity instruments.
Financial instrument
A financial instrument is any contract that gives rise to a financial asset of one entity and a financial liability or equity instrument of another entity. Financial assets or liabilities that are not contractual (such as statutory receivables or payables that arise as a result of statutory requirements imposed by governments) are not financial instruments.

Department of Treasury and Finance Annual Report 2015 | 16 109
Financial liability
A financial liability is any liability that is:
(a) a contractual obligation:
− to deliver cash or another financial asset to another entity; or
− to exchange financial assets or financial liabilities with another entity under conditions that are potentially unfavourable to the entity; or
(b) a contract that will or may be settled in the entity’s own equity instruments and is:
− a non-derivative for which the entity is or may be obliged to deliver a variable number of the entity’s own equity instruments; or
− a derivative that will or may be settled other than by the exchange of a fixed amount of cash or another financial asset for a fixed number of the entity’s own equity instruments. For this purpose the entity’s own equity instruments do not include instruments that are themselves contracts for the future receipt or delivery of the entity’s own equity instruments.
Financial statements
A complete set of financial statements comprises:
(a) a comprehensive operating statement for the period;
(b) a balance sheet as at the end of the period;
(c) a statement of changes in equity for the period;
(d) a cash flow statement for the period;
(e) notes, comprising a summary of significant accounting policies and other explanatory information;
(f) comparative information in respect of the preceding period as specified in paragraph 38 of AASB 101 Presentation of Financial Statements; and
(g) a balance sheet as at the beginning of the preceding period when an entity applies an accounting policy retrospectively or makes a retrospective restatement of items in its financial statements, or when it reclassifies items in its financial statements in accordance with paragraph 41 of AASB 101.
Grants expense
Transactions in which one unit provides goods, services, assets (or extinguishes a liability) or labour to another unit without receiving approximately equal value in return. Grants can either be operating or capital in nature. While grants to governments may result in the provision of some goods or services to the transferor, they do not give the transferor a claim to receive directly benefits of approximately equal value. Receipt and sacrifice of approximately equal value may occur, but only by coincidence. For example, governments are not obliged to provide commensurate benefits, in the form of goods or services, to particular taxpayers in return for their taxes. For this reason, grants are referred to by the AASB as involuntary transfers and are termed non-reciprocal transfers.
Grants can be paid as general purpose grants which refer to grants that are not subject to conditions regarding their use. Alternatively, they may be paid as specific purpose grants which are paid for a particular purpose and/or have conditions attached regarding their use.
Grants for on-passing
All grants paid to one institutional sector (e.g. a state general government) to be passed on to another institutional sector (e.g. local government or a private non-profit institution).
Intangible assets
Intangible assets represent identifiable non-monetary assets without physical substance.
Interest expense
Costs incurred in connection with the borrowing of funds. Interest expense includes interest on bank overdrafts and short-term and long-term borrowings, amortisation of discounts or premiums relating to borrowings, interest component of finance leases, repayments and the increase in financial liabilities and non-employee provisions due to the unwinding of discounts to reflect the passage of time.
Interest revenue
Interest revenue includes interest received on bank term deposits, interest from investments, and other interest received.
Investment properties
Investment properties represent properties held to earn rentals or for capital appreciation or both. Investment properties exclude properties held to meet service delivery objectives of the State of Victoria.

110 Department of Treasury and Finance Annual Report 2015 | 16
Net result
Net result is a measure of financial performance of the operations for the period. It is the net result of items of income, gains and expenses (including losses) recognised for the period, excluding those that are classified as ‘other economic flows – other comprehensive income’.
Net result from transactions/net operating balance
Net result from transactions or net operating balance is a key fiscal aggregate and is revenue from transactions minus expenses from transactions. It is a summary measure of the ongoing sustainability of operations. It excludes gains and losses resulting from changes in price levels and other changes in the volume of assets. It is the component of the change in net worth that is due to transactions and can be attributed directly to government policies.
Non-financial assets
Non-financial assets are all assets that are not ‘financial assets’.
Other economic flows included in net result
Other economic flows included in net result are changes in the volume or value of an asset or liability that do not result from transactions. They include gains and losses from disposal or derecognition or reclassification, revaluation and impairment of non-financial physical and intangible assets, and fair value changes of financial instruments. It also includes revaluation of the present value of leave liabilities due to changes in bond interest rates and from revaluation of restoration costs provisions.
Other economic flows – other comprehensive income
Other economic flows – other comprehensive income comprises items (including reclassification adjustments) that are not recognised in net result. The components of other economic flows – other comprehensive income include changes in physical asset revaluation surplus and changes arising from the remeasurement of defined benefit superannuation liabilities.
Payables
Includes short and long term trade debt and accounts payable, grants and interest payable.
Receivables
Includes short and long term trade credit and accounts receivable, grants, taxes and interest receivable.
Sales of goods and services
Refers to revenue from the direct provision of goods and services and includes fees and charges for services rendered, sales of goods, fees from regulatory services, and work done as an agent for private enterprises. It also includes rental income under operating leases and on produced assets such as buildings and entertainment, but excludes rent income from the use of non-produced assets such as land.
Supplies and services
Supplies and services generally represent cost of goods sold and the day to day running costs, including maintenance costs, incurred in the normal operations of the Department.
Transactions
Transactions are those economic flows that are considered to arise as a result of policy decisions, usually an interaction between two entities by mutual agreement. They also include flows within an entity such as depreciation where the owner is simultaneously acting as the owner of the depreciating asset and as the consumer of the service provided by the asset. Taxation is regarded as mutually agreed interactions between the government and taxpayers. Transactions can be in kind (e.g. assets provided/given free of charge or for nominal consideration) or where the final consideration is cash. In simple terms, transactions arise from the policy decisions of the government.

Department of Treasury and Finance Annual Report 2015 | 16 111
Accountable Officer’s and Chief Financial Officer’s declaration The attached financial statements for the Department of Treasury and Finance have been prepared in accordance with Direction 4.2 of the Standing Directions of the Minister of Finance under the Financial Management Act 1994, applicable Financial Reporting Directions, Australian Accounting Standards, including Interpretations, and other mandatory professional reporting requirements.
We further state that, in our opinion, the information set out in the comprehensive operating statement, balance sheet, statement of changes in equity, cash flow statement and notes to the financial statements, presents fairly the financial transactions during the year ended 30 June 2016 and financial position of the Department as at 30 June 2016.
At the time of signing, we are not aware of any circumstance which would render any particulars included in the financial statements to be misleading or inaccurate.
We authorise the attached financial statements for issue on 29 September 2016.
Joe Bonnici Chief Financial Officer Department of Treasury and Finance
Melbourne 29 September 2016
David Martine Secretary Department of Treasury and Finance
Melbourne 29 September 2016

112 Department of Treasury and Finance Annual Report 2015 | 16
Independent auditor’s report

Department of Treasury and Finance Annual Report 2015 | 16 113

114 Department of Treasury and Finance Annual Report 2015 | 16
Appendices
Appendix 1 Disclosure index ............................................................................................. 115 Appendix 2 Workforce data ............................................................................................... 117 Appendix 3 DTF occupational health and safety report 30 June 2016 ............................... 126 Appendix 4 Environmental reporting ................................................................................. 131 Appendix 5 Community Support Fund ............................................................................... 139 Appendix 6 Consultancies and major contracts ................................................................. 140 Appendix 7 Disclosure of government advertising expenditure ......................................... 141 Appendix 8 Disclosure of Information and Communication Technology expenditure ......... 142 Appendix 9 Freedom of Information .................................................................................. 143 Appendix 10 Application of Protected Disclosure Act .......................................................... 144 Appendix 11 Compliance with the Building Act ................................................................... 146 Appendix 12 National Competition Policy ........................................................................... 148 Appendix 13 Implementation of the Victorian Industry Participation Policy .......................... 149 Appendix 14 Legislation administered by DTF portfolios ..................................................... 150 Appendix 15 Information available on request ..................................................................... 155

Department of Treasury and Finance Annual Report 2015 | 16 115
Appendix 1 Disclosure index Ministerial Directions Report of operations and appendices
Direction Requirement Page reference
Charter and purpose
FRD 22G Manner of establishment and the relevant Ministers 2
FRD 22G Purpose, functions, powers and duties 1, 5–7
FRD 8D Departmental objectives, indicators and outputs 11–33
FRD 22G Key initiatives and projects 13–23
FRD 22G Nature and range of services provided 1, 5–7
Management and structure
FRD 22G Organisational structure 4
Financial and other information
FRD 8D Performance against output performance measures 23–33
FRD 8D Budget portfolio outcomes 34–40
FRD 10A Disclosure index 115–116
FRD 12B Disclosure of major contracts 140
FRD 15C Executive officer disclosures 92–93, 119–125
FRD 22G Employment and conduct principles 117–118
FRD 22G Occupational health and safety policy 126–130
FRD 22G Summary of the financial results for the year 41
FRD 22G Significant changes in financial position during the year
41
FRD 22G Major changes or factors affecting performance 11
FRD 22G Subsequent events 60
FRD 22G Application and operation of Freedom of Information Act 1982
143
FRD 22G Compliance with building and maintenance provisions of Building Act 1993
146–147
FRD 22G Statement on National Competition Policy 148
FRD 22G Application and operation of the Protected Disclosure 2012
144–145
FRD 22G Application and operation of the Carers Recognition Act 2012
n/a
FRD 22G Details of consultancies over $10 000 140
FRD 22G Details of consultancies under $10 000 140
FRD 22G Disclosure of government advertising expenditure 141
FRD 22G Disclosure of ICT expenditure 142
FRD 22G Statement of availability of other information 155
FRD 24C Reporting of office-based environmental impacts 131–138
FRD 25B Victorian Industry Participation Policy disclosures 149
FRD 29A Workforce Data disclosures 117–125
SD 4.5.5 Attestation for compliance with Ministerial Standing Direction 4.5.5
8
Financial report SD 4.2(g) Specific information requirements 1–8
SD 4.2(j) Sign-off requirements Contents page

116 Department of Treasury and Finance Annual Report 2015 | 16
Financial statements
Direction Requirement Page reference
Financial statements required under Part 7 of the FMA
SD 4.2(a) Statement of changes in equity 46
SD 4.2(b) Operating statement 44
SD 4.2(b) Balance sheet 45
SD 4.2(b) Cash flow statement 47
Other requirements under Standing Direction 4.2
SD 4.2(c) Compliance with Australian accounting standards and other authoritative pronouncements
48
SD 4.2(c) Compliance with Ministerial Directions 111
SD 4.2(d) Rounding of amounts 62
SD 4.2(c) Accountable officer’s declaration 111
SD 4.2(f) Compliance with Model Financial Report 111
Other disclosures as required by FRDs in notes to the financial statements
FRD 9A Departmental disclosure of administered assets and liabilities by activity
97–103
FRD 11A Disclosure of ex-gratia expenses 98–99
FRD 13 Disclosure of parliamentary appropriations 68–71
FRD 21B Disclosures of responsible persons, executive officers and other personnel (contractors with significant management responsibilities) in the Financial Report
92
FRD 103F Non-financial physical assets 75–80
FRD 110A Cash flow statements 47, 95–97
FRD 112D Defined benefit superannuation obligations 52, 62, 102–103
Legislation Page reference
Freedom of Information Act 1982 143
Building Act 1993 146
Protected Disclosure Act 2012 144
Carers Recognition Act 2012 n/a
Victorian Industry Participation Policy Act 2003 149
Financial Management Act 1994 48, 111

Department of Treasury and Finance Annual Report 2015 | 16 117
Appendix 2 Workforce data People and culture strategic activities In 2015-16, the Department focused its people and culture efforts on supporting its capability agenda.
Some notable achievements are detailed below:
• Development and implementation of departmental purpose and values in consultation with staff.
• Implementing DTF’s Aboriginal Employment and Inclusion Action Plan activities.
• Development and release of DTF’s Diversity and Inclusion Action Plan 2016-18.
People development A focus in the Department has been leadership development and developing writing skills. In 2015-16, a number of brief writing and speaking notes workshops were run throughout the Department.
The leadership approach is designed to ensure offerings are aligned with development needs at varying levels of management including emerging leaders, middle managers and executives.
The Leading for the Future program, which aims to develop the leadership skills of VPS6 emerging leaders, commenced with its second cohort in February 2015 and is due to finish in October 2016. Participants have been working towards their development goals throughout 2015-16 by attending conversations with senior executives from across the VPS, and are being supported in achieving their individual development goals.
Manager Essentials was launched in early 2015 for middle management across the Department and continues to be a development resource for all people and project managers in the Department. It supports a blended approach to learning that complements the Department’s 70:20:10 learning philosophy and comprises three parts that together build the essential skills required as an effective manager. The three components are an ongoing program of formal short, sharp manager skills workshops, and online management resources to place key information and knowledge at managers’ fingertips.
In addition, DTF approved 16 new studies assistance applications, supported one staff member in the Executive Masters of Public Administration and two staff in the Executive Fellows Program during 2015-16.
Employee relations There was one industrial dispute affecting the Department lodged with Fair Work Australia for the reporting period. This matter has now been resolved.
The Department has a comprehensive grievance process to ensure that employee concerns are dealt with fairly and promptly.
One grievance was lodged by a DTF employee during the period, and one by an external party. Neither grievance was investigated as they did not meet the criteria as outlined by the Victorian Public Sector Commission (VPSC).
The Department has a full suite of policies covering recruitment and selection, issue resolution and grievance review, redeployment, unsatisfactory work, misconduct, probation and fair treatment (among others).
All HR policies have been reviewed and amended to reflect changes introduced by the Victorian Public Service Enterprise Agreement 2016.
Recruitment The Department is committed to ensuring the best available people are recruited and selected for advancement by applying merit and equity principles when appointing staff. The selection processes ensure that applicants are assessed and evaluated fairly and equitably on the basis of key selection criteria and other accountabilities without discrimination.
During 2015-16, the Department advertised externally for 96 roles. A number of additional vacancies were filled by internal appointment by transfer at level. Furthermore, during 2015-16, the Department also undertook a bulk recruitment process in the Budget and Finance division for VPS staff. As a result of this process 10 new starters external to DTF will be joining the Department. We also commenced a bulk recruitment process for executive officers in the Department.
Graduate recruitment scheme The Department continued to support the recruitment and development of university graduates by participating in the VPS graduate scheme and managing the accounting and finance and the professional graduate economist programs on behalf of the whole Victorian public service.

118 Department of Treasury and Finance Annual Report 2015 | 16
During the 2015-16 period, 15 graduates joined the Department (six economists, three generalist and six accounting and finance graduates). The Department also offers summer economist and accounting and finance internships to a small number of penultimate year university students. There were 11 internships offered last summer (seven economist and four accounting and finance).
Diversity The Department and its agencies provide a number of traineeships to young people (some from disadvantaged groups) through the Youth Employment Scheme. In 2015-16 two new traineeships commenced and four trainees continue to undertake the program.
The Department’s Aboriginal Employment and Inclusion Action Plan 2015-18 has three areas of focus:
• building pathways between education and DTF employment;
• increasing awareness of Aboriginal culture; and
• using procurement as a means of reducing barriers to building Aboriginal jobs and business growth.
DTF has formed an internal working group that meets regularly to implement actions identified in the plan. Through the working group, DTF has arranged successful celebrations of National Reconciliation Week and NAIDOC Week. Acknowledgment of Country is included at formal DTF events, such as staff forums and budget addresses. Additionally, during 2015-16, 15 staff attended two pilot sessions for cultural awareness training. The program is being further rolled out to the Department in 2016-17.
DTF has worked together with the VPSC Pathways program to support Aboriginal graduate recruitment, and with the Victorian Government Purchasing Board to identify ways of supporting Aboriginal businesses to access available public service supply opportunities. Three Aboriginal graduates joined DTF as part of the 2016 intake through the Pathways program.
DTF’s Diversity and Inclusion Action Plan 2016-18 was launched in June 2016 and recognises that a diverse workforce improves innovation, creativity, problem solving and productivity.
The objective of the plan is to ensure that DTF has a workforce that reflects the Victorian population and makes the most of the talents and skills of all employees to better serve and support the Government and the Victorian community.
There are three focus areas within the plan:
• leadership in government and the community;
• inclusion and awareness; and
• employment and retention.
A working group has been formed within DTF to assist in implementing the goals contained in the plan. A number of events promoting diversity have been celebrated within DTF including Harmony Day, International Women’s Day, International Day Against Homophobia, Transphobia and Biphobia (IDAHoBIT) and the Pride Midsumma Carnival, in which DTF staff joined the first VPS contingent to participate in the Pride March.
DTF is taking part in the pilot of the Recruit Smarter initiative to address unconscious bias in recruitment. Personal details such as name, age and address will be removed from job applications during recruitment to avoid bias or unintentional assumptions.
Human Rights Charter Throughout 2015-16, DTF’s employees continued to consider human rights in the course of their work on submissions to Cabinet on matters that would affect members of the public.
Given the nature of its portfolio, DTF interactions with the public tend to focus on individuals who are either currently engaged, or are seeking to be engaged, by DTF for a specific purpose. These include individuals who are job applicants, employees, tenderers, contractors, Board appointees, and purchasers, landlords and tenants of government land.
To guide the interactions with these individuals, the Department has various policies and processes in place to protect the rights of those individuals. These include privacy, equal opportunity, occupational health and safety, protected disclosure and employment policies.
Notes for all tables in Appendix 2 1. All figures reflect employment levels during the last pay period of
June of each year unless otherwise stated.
2. Ongoing employees means people engaged on an open-ended contract of employment and executives engaged on a standard executive contract who were active in the last pay period of June.
3. FTE means full-time equivalent.
4. Excluded are those on leave without pay or absent on secondment, external contractors/consultants and temporary staff employed by employment agencies.
5. STS means senior technical specialist.

Department of Treasury and Finance Annual Report 2015 | 16 119
Profile of Department of Treasury and Finance’s workforce: June 2016
Full time equivalents (FTE) staffing trends from 2012 to 2016
2016 2015 2014 2013 2012
503.49 490.84 548.35 608.83 675.91
Ongoing employees Fixed term and casual
Number (headcount)
Full time (headcount)
Part time (headcount) FTE FTE
Jun-16 543 456 87 503.49 12.73
Jun-15 513 441 72 490.84 16.31
Jun–16 Jun–15
Ongoing Fixed term and casual Ongoing Fixed term
and casual
Number (headcount) FTE FTE
Number (headcount) FTE FTE
Gender
Female 265 236.12 6.13 251 231.24 9.00
Male 278 267.37 6.60 262 259.60 7.31
Total 543 503.49 12.73 513 490.84 16.31
Age
Under 25 18 18.00 .. 17 17.00 1.00
25-34 144 136.48 3.00 134 129.94 7.53
35-44 155 137.12 3.90 149 136.07 3.00
45-54 115 109.61 2.00 117 114.42 1.80
55-64 99 91.88 3.43 87 84.61 2.00
Over 64 12 10.40 0.40 9 8.80 0.98
Total 543 503.49 12.73 513 490.84 16.31
Classification
Secretary 1 1.00 .. 1 1.00 ..
Executive 59 58.00 .. 63 62.05 ..
STS 8 7.70 .. 11 10.80 1.00
Grade 6 141 129.04 2.00 121 114.14 0.60
Grade 5 134 124.20 2.60 132 124.51 4.80
Grade 4 99 92.62 3.00 92 88.85 5.00
Grade 3 77 70.13 3.00 73 70.19 4.00
Grade 2 20 18.80 0.90 16 15.30 0.53
Grade 1 .. .. .. .. .. ..
Legal officer 2 2.00 .. 4 4.00 0.38
Casual 2 .. 1.23 .. .. ..
Total 543 503.49 12.73 513 490.84 16.31

120 Department of Treasury and Finance Annual Report 2015 | 16
Profile of State Revenue Office’s workforce: June 2016
Full time equivalents (FTE) staffing trends from 2012 to 2016
2016 2015 2014 2013 2012
440.08 447.23 453.38 459.46 471.14
Ongoing employees Fixed term and casual
Number (headcount)
Full time (headcount)
Part time (headcount) FTE FTE
Jun-16 461 396.00 65.00 440.08 50.46
Jun-15 468 403 65 447.23 21.86
Jun–16 Jun–15
Ongoing Fixed term and casual Ongoing Fixed term
and casual
Number (headcount) FTE FTE
Number (headcount) FTE FTE
Gender
Female 231 213.29 23.46 236 217.14 7.86
Male 230 226.79 27.00 232 230.09 14.00
Total 461 440.08 50.46 468 447.23 21.86
Age
Under 25 3 3.00 10.40 3 3.00 ..
25-34 100 97.02 26.40 115 111.02 15.00
35-44 136 125.36 8.66 133 123.27 6.86
45-54 112 107.51 5.00 117 112.45 ..
55-64 99 96.19 .. 91 88.86 ..
Over 64 11 11.00 .. 9 8.63 ..
Total 461 440.08 50.46 468 447.23 21.86
Classification
Executive 6 5.40 .. 5 5.00 ..
STS 1 1.00 .. 2 2.00 ..
Grade 6 45 44.10 2.00 46 44.80 ..
Grade 5 104 101.00 3.00 99 96.60 3.60
Grade 4 106 102.09 3.00 108 104.17 2.00
Grade 3 150 141.93 30.06 150 143.18 13.66
Grade 2 30 26.36 11.40 39 33.08 2.60
Grade 1 .. .. .. .. .. ..
Legal officer 19 18.20 1.00 19 18.40 ..
Casual .. .. .. .. .. ..
Total 461 440.08 50.46 468 447.23 21.86

Department of Treasury and Finance Annual Report 2015 | 16 121
Profile of DTF Executive Officers: June 2016
Ongoing Special projects Total
Male Female Male Female
Class 2016 2015 Var 2016 2015 Var 2016 2015 Var 2016 2015 Var 2016 2015 Var
EO-1 1 2 -1 1 2 -1 .. .. .. .. .. .. 2 4 -2
EO-2 10 12 -2 7 5 2 .. .. .. .. .. .. 17 17 0
EO-3 27 26 1 13 16 -3 .. .. .. .. .. .. 40 42 -2
Total 38 40 -2 21 23 -2 .. .. .. .. .. .. 59 63 -4
Notes:
Table excludes the Essential Services Commission and the State Revenue Office.
Table excludes the Secretary (Accountable Officer).
Nine vacancies existed at the time of reporting (June 2016).
Var column indicates the variation between the current and previous reporting periods.
Reconciliation of DTF and SRO Executive Officer numbers: June 2016
DTF SRO Total
2016 2015 2016 2015 2016 2015
Executives whose total remuneration exceeded $100 000 during the reporting period
63 66 5 5 68 71
Add Vacancies 9 10 1 2 10 12
Executives whose total remuneration was below $100 000 during the reporting period
13 9 1 .. 14 9
Accountable Officer (Secretary) 1 1 .. .. 1 1
Less Separations 14 12 .. .. 14 12
Total executive numbers 72 74 7 7 79 81
Notes:
This table reconciles with Note 18.

122 Department of Treasury and Finance Annual Report 2015 | 16
Profile of CenITex workforce: June 2016
Full time equivalents (FTE) staffing trends from 2012 to 2016
2016 2015 2014 2013 2012
449.15 442.12 444.89 460.67 412.76
Contractors/temporary staff
60 22 9 15 81
Ongoing employees Fixed term and casual
Number (headcount)
Full time (headcount)
Part time (headcount) FTE FTE
Jun-16 473 454 19 449.15 19
Jun-15 447 431 16 442.12 24.00
Jun–16 Jun–15 Ongoing Fixed term
and casual Ongoing Fixed term and casual
Number (headcount) FTE FTE
Number (headcount) FTE FTE
Gender
Female 95 90.75 5.00 98 93.32 5.00
Male 359 358.40 14.00 349 348.80 19.00
Total 454 449.15 19.00 447 442.12 24.00
Age
Under 25 10 10.00 .. 15 15.00 1.00
25-34 92 91.20 4.00 98 97.00 7.00
35-44 169 167.27 3.00 179 176.37 4.00
45-54 118 116.58 7.00 101 100.80 7.00
55-64 59 58.30 5.00 51 49.95 5.00
Over 64 6 5.80 .. 3 3.00 ..
Total 454 449.15 19.00 447 442.12 24.00
Classification
Executive .. .. 5.00 4 4.00 ..
STS 22 21.40 .. 20 19.40 ..
Grade 6 126 125.13 7.00 128 127.60 8.00
Grade 5 143 142.40 2.00 133 132.80 1.00
Grade 4 68 67.70 2.00 67 66.70 2.00
Grade 3 93 90.52 3.00 93 89.62 12.00
Grade 2 2 2.00 .. 2 2.00 1.00
Grade 1 .. .. .. .. .. ..
Legal Officer .. .. .. .. .. ..
Casual .. .. .. .. .. ..
Total 454 449.15 19.00 447 442.12 24.00

Department of Treasury and Finance Annual Report 2015 | 16 123
Profile of Emergency Services and State Super’s workforce: June 2016
Full time equivalents (FTE) staffing trends from 2012 to 2016
2016 2015 2014 2013 2012
150.22 148.12 146.21 134.85 137.07
Ongoing employees Fixed term and casual
Number (headcount)
Full time (headcount)
Part time (headcount) FTE FTE
Jun-16 160 128 32 150.22 4.00
Jun-15 158 130 28 148.12 4.80
Jun–16 Jun–15
Ongoing Fixed term and casual Ongoing Fixed term
and casual
Number (headcount) FTE FTE
Number (headcount) FTE FTE
Gender
Female 78 69.38 2.00 79 70.53 3.00
Male 82 80.84 2.00 79 77.59 1.80
Total 160 150.22 4.00 158 148.12 4.80
Age
Under 25 7 6.95 1.00 3 2.55 ..
25-34 39 37.43 1.00 39 38.23 2.00
35-44 48 42.44 1.00 55 48.57 2.00
45-54 40 38.40 1.00 36 34.64 ..
55-64 22 21.00 .. 24 23.13 0.80
Over 64 4 4.00 .. 1 1.00 ..
Total 160 150.22 4.00 158 148.12 4.80
Classification
Executive 8 8.00 .. 7 7.00 ..
ESSB 1 37 33.44 2.00 34 29.81 3.00
ESSB 2 48 43.84 .. 49 45.07 ..
ESSB 3 42 41.10 2.00 45 44.20 ..
ESSB 4 25 23.84 .. 23 22.04 1.00
Other .. .. .. .. .. 0.80
Total 160 150.22 4.00 158.00 148.12 4.80
Note:
‘Other’ refers to employees on longer term (non-executive) contracts.

124 Department of Treasury and Finance Annual Report 2015 | 16
Profile of Essential Services Commission’s workforce: June 2016
Full time equivalents (FTE) staffing trends from 2012 to 2016
2016 2015 2014 2013 2012
72.57 58.77 56.64 55.96 66.84
Ongoing employees Fixed term and casual
Number (headcount)
Full time (headcount)
Part time (headcount) FTE FTE
Jun-16 74 65 9 72.57 14.30
Jun-15 62 53 9 58.77 9.80
Jun–16 Jun–15
Ongoing Fixed term and casual Ongoing Fixed term
and casual
Number (headcount) FTE FTE
Number (headcount) FTE FTE
Gender
Female 35 33.77 6.20 31 28.17 5.00
Male 39 38.80 8.10 31 30.60 4.80
Total 74 72.57 14.30 62 58.77 9.80
Age
Under 25 2 2.00 0.20 2 2.00 ..
25-34 30 29.80 8.00 18 18.00 6.00
35-44 20 18.77 3.90 25 22.17 2.00
45-54 18 18.00 2.20 12 11.60 0.80
55-64 2 2.00 .. 3 3.00 1.00
Over 64 2 2.00 .. 2 2.00 ..
Total 74 72.57 14.30 62 58.77 9.80 Classification
Executive 5 5.00 .. 4 4.00 0.80
SRM 5 5.00 .. 3 3.00 ..
STS 1 1.00 .. 1 1.00 1.00
Grade 6 12 11.60 1.00 14 13.60 ..
Grade 5 17 16.80 4.70 13 11.60 3.00
Grade 4 19 18.60 2.00 15 14.00 1.00
Grade 3 11 10.57 3.00 12 11.57 1.00
Grade 2 4 4.00 .. .. .. ..
Grade 1 .. .. .. .. .. ..
Legal Officer .. .. .. .. .. ..
Casual .. .. 3.60 .. .. 3.00
Total 74 72.57 14.30 62 58.77 9.80 Statutory appointees .. .. 1.80 .. .. 1.80
Notes:
SRM is a senior regulatory manager.

Department of Treasury and Finance Annual Report 2015 | 16 125
DTF Portfolio Executives: June 2016
June 2016 June 2015 Change
Organisation Female Male Female Male Female Male State Electricity Commission of Victoria (Vicpower Trading) .. 2 .. 2 .. ..
State Trustees Limited 4 2 5 3 –1 –1
Transport Accident Commission 21 27 19 27 2 ..
Treasury Corporation of Victoria 1 5 1 5 .. ..
Victorian Funds Management Corporation 4 4 2 5 2 –1
Victorian Managed Insurance Authority 6 8 4 5 2 3
Victorian Workcover Authority 32 40 32 38 .. 2
Total 68 88 63 85 5 3 Total (male and female) 156 148 8
Notes:
For the purpose of this table, Executive Officers are defined as employees who have significant management responsibility and receive a total remuneration package of $152 560 or more.
All figures reflect employment levels as at 30 June 2016 unless otherwise stated.
Excluded are those on leave without pay or absent on secondment, external contractors/consultants and temporary staff employed by employment agencies.

126 Department of Treasury and Finance Annual Report 2015 | 16
Appendix 3 DTF occupational health and safety report 30 June 2016 The Department has continued its commitment to occupational health and safety (OHS) during the financial year with a number of key initiatives:
• review of DTF’s consultation procedure resulting in the development of a quarterly OHS newsletter, distributed via the employee intranet;
• provision of office ergonomic assessments with 118 assessments conducted (123 per cent increase on 2014-15). Of these assessments, 62 were conducted face-to-face and 56 were via DTF’s ‘safe workstation setup’ online module;
• annual onsite flu vaccination program held, with 237 employees receiving flu vaccinations (137 per cent increase on 2014-15);
• provision of DTF’s Eye Testing Procedure, with 28 eye wear reimbursements claimed; and
• promotion of DTF’s Employee Assistant Program (EAP), with 43 referrals made.

Department of Treasury and Finance Annual Report 2015 | 16 127
DTF’s performance against OHS management measures Measure KPI 2013-14 2014-15 2015-16 Incidents Number of incidents 7 22 18
Rate per 100 FTE 1.24 4.34 3.49
Claims Number of standardised claims (a)
2 4 1
Rate per 100 FTE 0.35 0.79 0.19
Number of lost time claims (b) 1 2 1
Rate per 100 FTE 0.17 0.39 0.19
Number of claims exceeding 13 weeks
0 2 0
Rate per 100 FTE 0 0.39 0
Fatalities Fatality claims 0 0 0
Claim costs Average cost per standard claim (c)
$3 012 $57 669 The increase in claims cost is associated with one claim being incorrectly coded by Workers Compensation Agent. This has not affected the 2015-16 premium.
$5 108
Return to work Percentage of claims with return to work plan <30 days
n/a n/a 100 per cent
Management commitment
Evidence of OHS policy statement, OHS objectives, regular reporting to senior management on OHS, and OHS plans (signed by CEO or equivalent)
Statement of commitment signed by Secretary. Monthly reporting to senior executives, including OHS Committee minutes. OHS plan included in human resources business plan.
Statement of Commitment reviewed and revised and signed by Secretary. Routine tabling of minutes from Health and Safety Committee (HSC) to People and Culture Committee (PCC). Senior manager (Director, Corporate Services) assumed role of Chair of HSC from February 2015. OHS plan included in human resources business plan.
Statement of Commitment signed by Secretary. OHS issues are raised monthly with Directors. Increased visibility of OHS reporting and issues for wider Department via OHS newsletter. DTF participated in whole of Victorian government interdepartmental Health and Safety Sub-committee, and Sub-committee working group.
Evidence of OHS criteria in purchasing guidelines (including goods, services and personnel)
Purchasing guidelines contain OHS criteria.
Purchasing guidelines contain OHS criteria.
Staff engaged through a proactive approach towards workstation assessments, with subsequent purchase of ergonomic workstation related equipment.

128 Department of Treasury and Finance Annual Report 2015 | 16
Measure KPI 2013-14 2014-15 2015-16 Consultation and participation
Evidence of agreed structure of designated work groups (DWGs), health and safety representatives (HSRs), and issue resolution procedures (IRPs)
There are seven designated work groups in total with 10 HSRs and deputy HSRs appointed and trained. Issue resolution procedures, established with clearer guidance for worker, safety committee and management. OHS Committee Constitution and Terms of Reference in place. Both OHS Committee Constitution and Terms of Reference and issue resolution procedures presented and endorsed by management and OHS Committee. 100 per cent of OHS Consultation Committee meetings conducted as a percentage of those planned.
Rationalisation of DWGs to better reflect workplaces. Rebranding of OHS Committee to Health and Safety Committee (HSC) with charter reviewed and updated in consultation with HSC members. HSR and manager engagement strategy developed and endorsed by HSC for implementation 2015-16. All scheduled HSC meetings conducted within one week of scheduled date.
Review of DTF consultation procedure resulted in replacement of quarterly HSC meeting with the co-production of a quarterly OHS newsletter with input from HSRs, for wider departmental distribution. The first newsletter was released in March 2016 via the employee intranet. The new procedure allows for HSC meetings to be held if requested by a HSR or a DTF employee. In addition, at a minimum, one HSC meeting will be held during the reporting period. Two HSC meetings were conducted during this period in August and November 2015. HSRs involved in development of OHS newsletter.
Compliance with agreed structure on DWGs, HSRs, and IRPs.
All DWG have HSR representation and an issue resolution procedure in place.
All HSR positions filled in new DWG structure to ensure enhanced worker representation and consultation.
All HSR positions were filled throughout reporting period.
Risk management
Percentage of internal audits/ inspections conducted as planned
80 per cent of inspections for first aid kits completed and 85 per cent of workplace inspections were completed.
>90 per cent of first aid kits inspected on a quarterly basis across the business and parts replaced within three weeks of ordering. Workplace inspection form reviewed, and endorsed by HSC, due to detected low usage by HSRs.
>95 per cent of first aid kits inspected on a quarterly basis with parts replaced within two weeks of ordering. Kit inspection checklist was amended to include quarterly assessment of defibrillators. 100 per cent completion of first aid room inspection. Review of first aid capability at 121 Exhibition Street resulted in the relocation of a defibrillator from Car Pool Office on ground floor, 1 Treasury Place to level 25, 121 Exhibition Street to ensure coverage for DTF employees. 60 per cent of workplace safety inspections undertaken across DTF workplaces, scheduled to be completed on a quarterly basis.

Department of Treasury and Finance Annual Report 2015 | 16 129
Measure KPI 2013-14 2014-15 2015-16 DTF OHS Advisory
attended 100 per cent of the quarterly ESC OHS Committee meetings. After each meeting a workplace inspection was undertaken. 100 per cent of workplace inspections were completed at ESC. DTF OHS Advisory and HSR addressed SSP forum on OHS on 29 June 2016. 118 ergonomic assessments were conducted: 62 face-to-face (53 per cent), including two for staff home based workstations, and 56 (47 per cent), using DTF’s ‘safe workstation setup’ online module.
Percentage of issues identified actioned arising from:
• internal audits • 100 per cent • none undertaken • annual audit of policies and procedures undertaken in January 2016. No non-conformances identified.
• HSR provisional improvement notices (PIN)
• nil issued • nil issued • nil issued
• WorkSafe notices • nil issued • nil issued • nil issued
Training Percentage of managers and staff that have received OHS training:
• induction
• management training
• contractors, temps and visitors
37 new DTF employees and contractors have successfully completed online OHS learning modules in 2013-14 through ComplianceNet.
DTF’s online OHS learning modules were reviewed and revised and all DTF staff were required to successfully complete these.
143 DTF employees and contractors have successfully completed online OHS learning modules in 2015-16 through ComplianceNet. 16 DTF staff (including paid First Aid Officers) received First Aid Training.
Percentage of HSRs trained: 100 per cent 100 per cent of HSRs are trained.
• acceptance of role • five vacancies exist • no vacancies currently exist
• no vacancies currently exist

130 Department of Treasury and Finance Annual Report 2015 | 16
Measure KPI 2013-14 2014-15 2015-16
• re-training (refresher) • annual refresher training offered to all HSRs in 2013-14 and 100 per cent completed as a percentage of those due
• 100 per cent HSRs provided with access to the five day Initial HSR training on acceptance of the role
• WorkSafe approved HSR refresher training scheduled for 14 July 2015. OHS Advisory provides HSRs with access to webinars (e.g. 16 June 2015, – WorkCover Webinar – Talking to your workers about health and safety)
• WorkSafe Approved HSR Refresher training delivered on 13 July 2015.
• reporting of incidents and injuries
• HSRs trained in reporting of incidents through OHS Committee and HSR refresher training
• HSRs trained in reporting of incidents through OHS Committee
• HSRs alerted to encourage worker take-up of online workstation setup
• HSRs trained in reporting of incidents through OHS Committee and HSR refresher training.
• HSRs alerted to encourage staff take up of online workstation setup.
Notes:
(a) VWA supplied data. Data for standardised claims, time lost claims and death claims is at 30 June 2016. Standardised claims are those that have exceeded the employer excess or are registered as a standard claim and are open with no payments at the time of extraction.
(b) VWA supplied data. A time lost claim is one with one or more days compensated by the VWA (after employer excess) at the time of extraction. They are a subset of standardised claims.
(c) VWA supplied data based on claims reported between 1 July 2015 and 30 June 2016. Claims include payments to date plus an estimate of outstanding claims costs (further costs as calculated by the VWA’s statistical case estimate model).

Department of Treasury and Finance Annual Report 2015 | 16 131
Appendix 4 Environmental reporting Office-based environmental impacts DTF monitored the environmental impacts of its operations during 2015-16. This was undertaken via DTF’s office-based environmental management system (EMS), which is based on international standard AS/NZS ISO14001 Environmental Management Systems Requirements.
The office-based EMS controls all operational activities within DTF’s offices and aims to minimise the generation of waste and the use of energy, water, paper, travel, vehicle fleet and greenhouse gas emissions in the course of operations.
The suite of environmental indicators presented below is based on Financial Reporting Direction 24C.
Energy
The Department’s energy consumption comprises its CBD office facilities. Core DTF staff were located at 1 Treasury Place, 1 Macarthur Street and 2 Lonsdale Street.
Indicator 2015-16 2014-15
Electricity Natural gas
Green power
Total Electricity Natural gas
Green power
Total
Total energy usage segmented by primary source (MJ)
2 949 182 2 949 182 3 064 141 3 064 141
Greenhouse gas emissions associated with energy use, segmented by primary source and offsets (t CO2-e)
1 032 1 032 1 157 1 157
Percentage of electricity purchased as green power
Units of energy used per FTE (MJ/FTE)
5 156 6 041
Units of energy used per unit of office area (MJ/m2)
193 201
Actions undertaken
Earth Hour DTF participated in the 2016 Earth Hour event.
Result
• Energy consumption was down 3.7 per cent from 2014-15.
Explanatory notes
• Billing data was used to calculate the Department’s energy use. Where billing data is unavailable, average consumption from the previous billing period is used.
• The decrease in units of energy used per FTE (MJ/FTE) was attributed to a consolidation of DTF FTE to the Treasury Reserve and replacement of end-of-life atmospheric boilers.

132 Department of Treasury and Finance Annual Report 2015 | 16
Paper
Paper use covered staff located in 1 Treasury Place, 1 Macarthur Street and 2 Lonsdale Street.
Indicator 2015-16 2014-15
Total units of copy paper used (reams) 5 826 5 258
Units of copy paper used per FTE (reams/FTE)
10.2 10.4
Percentage of 75–100 recycled content copy paper purchased
38 9
Percentage of 50–75 recycled content copy paper purchased
0 0
Percentage of 0–50 recycled content copy paper purchased
62 91
Greenhouse gas emissions related to paper use (t CO2-e)
22.3 19.7
Optional indicators
Total units of A4 equivalent paper used in publications (reams)
2 395 2 969
Actions undertaken
e-Reviewing DTF expanded the number of publications managed by e-Reviewing (eDrafts), reducing the requirement to print hard copy drafts.
Review of requirement for hard copy publications
DTF, as part of planning for major publications, continues to review the number of hard copy versions required and directs stakeholders to online versions as an alternative.
Targets
The following target was set for 2015-16:
• Reduce paper by 0.2 reams per FTE from 2014-15 result.
Result
• Paper use decreased by 0.2 reams per FTE from 2014-15 result.
Explanatory notes
• Paper use is calculated using the information provided under the whole of government office stationery contract.
• Where data is unavailable, average use from the previous billing period is used.
• In addition to the decrease in paper use per FTE the Department has increased the purchase of higher recycled content paper by 29 per cent from 2014-15.

Department of Treasury and Finance Annual Report 2015 | 16 133
Water
Water data covered staff located in 1 Treasury Place and 1 Macarthur Street.
Indicator 2015-16 2014-15
Total units of metered water consumed by usage types (kilolitres)
8 647 8 966
Units of metered water consumed in offices per FTE (litres/FTE)
15 170 17 678
Units of metered water consumed in offices per unit of office area (litres/m2)
566 587
Actions undertaken DTF continues to make improvements to the plumbing infrastructure on the reserve.
Explanatory notes
• The data for 2015-16 was calculated using billing data. Where billing data is unavailable, average consumption from the previous billing period is used.
• Water data covers staff located in 1 Treasury Place and 1 Macarthur Street.
• Water consumption has decreased with the Shared Services Provider relocating to the Treasury Reserve.

134 Department of Treasury and Finance Annual Report 2015 | 16
Transport
The Department utilises vehicles from the State Government Vehicle Pool for its operational car travel.
Operational vehicles 2015-16 2014-15 ULP LPG Diesel Total ULP LPG Diesel Total
Total energy consumption by vehicles (MJ)
53 400 53 400 69 115 69 115
Total vehicle travel associated with entity operations (km)
21 609 21 609 28 277 28 277
Total greenhouse gas emissions from vehicle fleet (t CO2-e)
3.6 3.6 4.6 4.6
Greenhouse gas emissions from vehicle fleet per 1 000km travelled (t CO2-e)
0.17 0.17 0.17 0.17
2015-16 2014-15 Total distance travelled by aeroplane (km) 230 221 253 958
Total greenhouse gas emissions from air travel (t CO2-e)
54.4 63.4
Percentage of employees regularly (>75 per cent of work attendance days) using public transport, cycling, walking, or car pooling to and from work or working from home, by locality type.
90 89
Actions undertaken
DTF encourages staff to use video-conferencing in preference to air travel where appropriate.
Explanatory notes
• The vehicle travel data includes DTF hire car usage from the Shared Service Provider Vehicle Pool and was provided by the Shared Service Provider.
• Air travel was provided by the State Government booking agency.
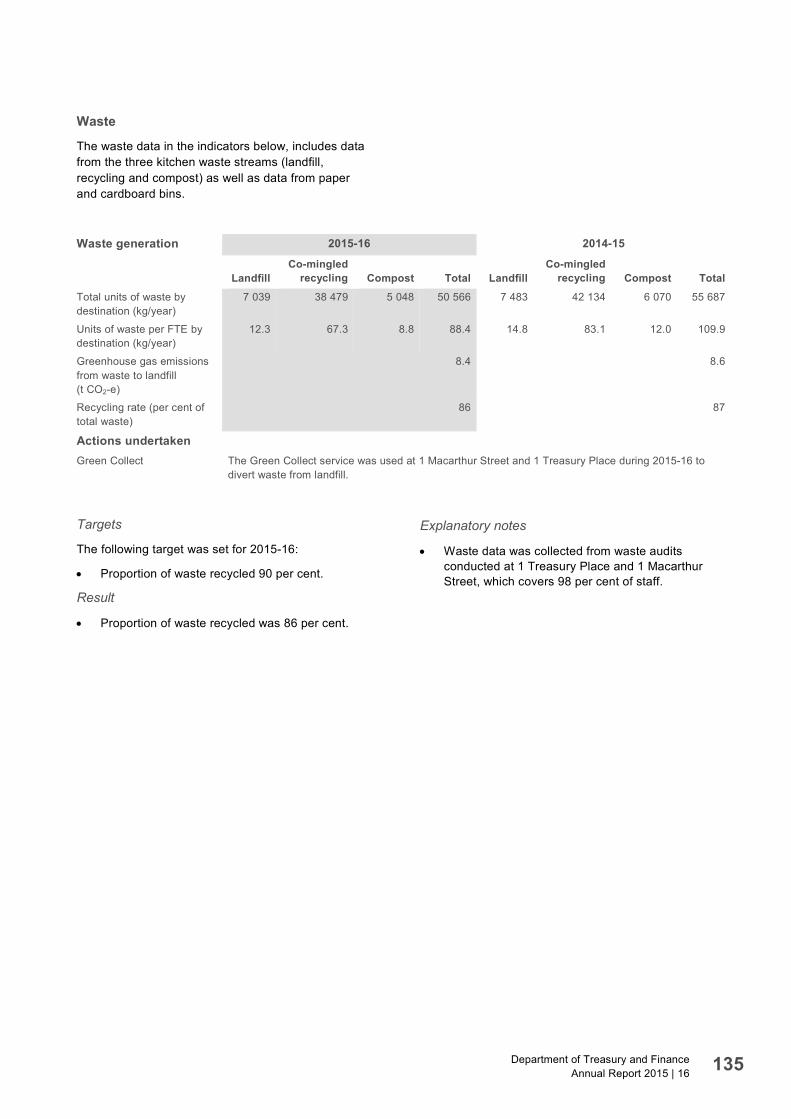
Department of Treasury and Finance Annual Report 2015 | 16 135
Waste
The waste data in the indicators below, includes data from the three kitchen waste streams (landfill, recycling and compost) as well as data from paper and cardboard bins.
Waste generation 2015-16 2014-15
Landfill
Co-mingled recycling Compost Total Landfill
Co-mingled recycling Compost Total
Total units of waste by destination (kg/year)
7 039 38 479 5 048 50 566 7 483 42 134 6 070 55 687
Units of waste per FTE by destination (kg/year)
12.3 67.3 8.8 88.4 14.8 83.1 12.0 109.9
Greenhouse gas emissions from waste to landfill (t CO2-e)
8.4 8.6
Recycling rate (per cent of total waste)
86 87
Actions undertaken
Green Collect The Green Collect service was used at 1 Macarthur Street and 1 Treasury Place during 2015-16 to divert waste from landfill.
Targets
The following target was set for 2015-16:
• Proportion of waste recycled 90 per cent.
Result
• Proportion of waste recycled was 86 per cent.
Explanatory notes
• Waste data was collected from waste audits conducted at 1 Treasury Place and 1 Macarthur Street, which covers 98 per cent of staff.

136 Department of Treasury and Finance Annual Report 2015 | 16
Greenhouse gas emissions
The emissions disclosed in the section below are taken from the previous sections and brought together here to show the Department’s greenhouse footprint.
Indicator 2015-16 2014-15
Total greenhouse gas emissions associated with energy use (t CO2-e) 1 032 1 157
Total greenhouse gas emissions associated with vehicle fleet (t CO2-e) 3.6 4.6
Total greenhouse gas emissions associated with air travel (t CO2-e) 54.5 63.4
Total greenhouse gas emissions associated with waste production (t CO2-e) 8.4 8.9
Total greenhouse gas emissions associated with paper use (t CO2-e) 22.3 19.7
Total greenhouse gas emissions (t CO2-e) 1 121 1 254
Department of Treasury and Finance Annual Report 2015 | 16 137
Procurement
DTF has undertaken procurement activities that are environmentally responsible and that support the objectives of DTF and the whole of government.
These include:
• addressing environmental requirements in tender specifications and tender evaluation criteria, as applicable;
• supplier compliance to environmental sustainability requirements monitored on an ongoing basis through the contract management process; and
• updated Victorian Government Purchasing Board guidance material to reinforce the inclusion of environmental factors and commitments in market engagement documents.
Targets for 2016-17
The following targets have been set for 2016-17:
• energy – reduce energy consumption through better use of IT;
• waste – improve communication and signage to decrease contamination levels in kitchen waste bins; and
• transport – involvement in Ride to Work and Walk to Work days.
Glossary
FTE Full time equivalent employee
kg Kilograms
kL Kilolitres
km Kilometres
L Litres
LPG Liquefied petroleum gas
m2 Metres squared
MJ Megajoules
Ream 500 sheets of A4 paper
t CO2–e Tonnes of CO2 equivalent
ULP Unleaded petrol

138 Department of Treasury and Finance Annual Report 2015 | 16
Trend charts

Department of Treasury and Finance Annual Report 2015 | 16 139
Appendix 5 Community Support Fund The Community Support Fund (CSF) is a trust fund that directs a portion of gaming revenue back into the community. It was established in 1991 and is governed by the Gambling Regulation Act 2003.
As prescribed by the legislation, the CSF receives revenue generated from electronic gaming machines in hotels less $45 million which is retained in the Consolidated Fund each year to support government priorities. Any interest earned on the balance of the trust fund is retained by the CSF. In 2015-16, the CSF received $99.0 million in revenue.
The Government can allocate funding from the CSF to a range of initiatives, which are administered by departments. Funded initiatives must be consistent with the purposes of the legislation.
Programs that tackle problem gambling are the first call on funds from the CSF. The Victorian Responsible Gambling Foundation Act 2011 gives effect to the Government’s problem gambling policy. This legislation provides the basis on which funds will be transferred from the CSF to the Responsible Gambling Fund to reduce the prevalence and severity of gambling related harm and foster responsible gambling behaviour.
The CSF can also fund:
• drug education, treatment and rehabilitation;
• financial counselling and support for families in crisis;
• youth programs;
• sport and recreation;
• arts and tourism;
• community support or advancement; and
• costs associated with administering the CSF.
The funds provided to departments are generally used to provide grants to a wide range of community-based organisations and councils, supporting them to build strong and sustainable communities.
The legislation also provides for the payment of one day’s revenue from the CSF to the Victorian Veterans Fund.
A total of $113.1 million in expenditure for 2015-16 was paid out of the CSF through programs approved in prior years. Two new community projects were approved in 2015-16 as tabled below.
The administration of the CSF forms part of the audited accounts of the Department.
For more information in relation to the CSF please refer to www.dtf.vic.gov.au/communitysupportfund
Programs approved from 1 July 2015 to 30 June 2016 Program name Portfolio $
Justice Connect Community Support 960 000
Scammell Reserve Pavilion Redevelopment Sport and Recreation 500 000
Total program approvals 1 460 000
Note:
The list above shows total funding approved for each program in the 2015-16 financial year. Expenditure will occur in future years.

140 Department of Treasury and Finance Annual Report 2015 | 16
Appendix 6 Consultancies and major contracts Details of consultancies (valued at $10 000 or greater) In 2015-16, there were 48 consultancies where the total fees payable to the consultants were $10 000 or greater. The total expenditure incurred during 2015-16 in relation to these consultancies is $19 147 460 (excluding GST). Details of individual consultancies can be viewed at www.dtf.vic.gov.au.
Details of consultancies under $10 000 In 2015-16, there were two consultancies engaged during the year, where the total fees payable to the individual consultancies was less than $10 000. The total expenditure incurred during 2015-16 in relation to these consultancies was $15 970 (excl. GST).
Disclosure of major contracts The Department has disclosed, in accordance with the requirements of Victorian Government policy and accompanying guidelines, all contracts greater than $10 million in value which it entered into during the year ended 30 June 2016. Details of contracts that have been disclosed can be viewed at contracts.vic.gov.au.

Department of Treasury and Finance Annual Report 2015 | 16 141
Appendix 7 Disclosure of government advertising expenditure Details of government advertising expenditure (campaigns with a media spend of $100 000 or greater)
Name of campaign
Campaign summary
Start/ end date
Advertising (media)
expenditure 2015-16
Creative and campaign
development expenditure
2015-16 (ex. GST)
Research and evaluation
expenditure 2015-16
(ex. GST)
Print and collateral
expenditure 2015-16
(ex. GST)
Other campaign
expenditure 2015-16
(ex. GST) Total
$ $ $ $ $
Nil Nil n/a n/a n/a n/a n/a n/a n/a

142 Department of Treasury and Finance Annual Report 2015 | 16
Appendix 8 Disclosure of Information and Communication Technology expenditure For the 2015-16 reporting period, the Department had a total Information and Communication Technology (ICT) expenditure of $29 833 000, with the details shown below.
$’000 Business as usual (BAU) ICT expenditure 26 459
Non-business as usual (non-BAU) ICT expenditure consisting of:
3 374
Operational expenditure 1 195
Capital expenditure 2 179
ICT expenditure refers to the Department’s costs in providing business-enabling ICT services. It comprises business as usual (BAU) ICT expenditure and non-business as usual (non-BAU) ICT expenditure. Non-BAU ICT expenditure relates to extending or enhancing the Department’s current ICT capabilities. BAU ICT expenditure is all remaining ICT expenditure, which primarily relates to ongoing activities to operate and maintain the current ICT capability.

Department of Treasury and Finance Annual Report 2015 | 16 143
Appendix 9 Freedom of Information The Department of Treasury and Finance is an ‘agency’ for the purposes of the Freedom of Information Act 1982 (the Act) and is therefore subject to the Act.
The Department’s website (below) provides additional information that might assist in making a request. The Department’s Part II Statement is also published on this website as required by the Act.
dtf.vic.gov.au/About/Legal/Freedom-of-Information
The Department’s Freedom of Information (FOI) Officers are authorised to deal with requests for access to documents in the possession of the Department.
This authorisation does not extend to documents in the possession of the State Revenue Office (SRO) and any such requests should be sent directly to the SRO.
During 2015-16, the Department received 81 FOI requests. Of those, 56 were from Members of Parliament, 10 were from media organisations and 15 were from members of the public.
Timeliness The Department made 78 FOI decisions during the 12 months ended 30 June 2016.
40 decisions were made within the statutory 45 day time period, 24 decisions were made within 46 to 90 days and 14 decisions were made in greater than 90 days.
The average time taken to finalise requests in 2015-16 was 55.5 days.
Information about other aspects of the Department’s FOI performance is available in the 2015-16 FOI Annual Report, prepared by the Office of the Freedom of Information Commissioner.
Section 17 of the Act sets out the formal requirements for making a request. In summary, the requirements for making a request are that:
• it should be in writing;
• it should identify as clearly as possible what document is being requested; and
• it should be accompanied by an application fee.
Requests for documents in the possession of DTF should be addressed as follows:
Freedom of Information Officer Department of Treasury and Finance GPO Box 4379 Melbourne VIC 3001
Access charges In addition to the application fee, certain other charges such as search fees and photocopying charges may apply in relation to the provision of documents as stipulated in the Freedom of Information (Access Charges) Regulations 2014.
Further information Further information regarding the operation and scope of FOI can be obtained from:
• the Act;
• regulations made under the Act; and
• foi.vic.gov.au.
Freedom of Information contact Vivian Chung, Tel: (03) 9651 2115
Mark Hamilton-Smith, Tel: (03) 9651 1413

144 Department of Treasury and Finance Annual Report 2015 | 16
Appendix 10 Application of Protected Disclosure Act The following information is required in the Annual Report pursuant to section 70 of the Protected Disclosure Act 2012 (the Act). The Act replaced the Whistleblowers Protection Act 2001 on 10 February 2013.
Message from the Secretary The Department of Treasury and Finance is committed to the aims and objectives of the Act. It does not tolerate improper conduct by its employees, officers or members. Nor does the department tolerate reprisals against those who come forward to disclose such conduct, and it is dedicated to protecting the welfare of such persons.
During 2015-16, there were no disclosures made under the Act.
The Department reports that in 2015-16 it did not notify any disclosures to the Independent Broad-based Anti-corruption Commission under the Act.
David Martine Secretary
Compliance with the Protected Disclosure Act 2012 The Act encourages and assists people in making disclosures of improper conduct by public officers and public bodies. The Act provides protection to people who make disclosures in accordance with the Act and establishes a system for the matters disclosed to be investigated and rectifying action to be taken.
The Department does not tolerate improper conduct by employees, nor the taking of reprisals against those who come forward to disclose such conduct. It is committed to ensuring transparency and accountability in its administrative and management practices and supports the making of disclosures that reveal corrupt conduct, conduct involving a substantial mismanagement of public resources, or conduct involving a substantial risk to public health and safety or the environment.
The Department will take all reasonable steps to protect people who make such disclosures from any detrimental action in reprisal for making the disclosure. It will also afford natural justice to the person who is the subject of the disclosure to the extent it is legally possible.
Reporting procedures Disclosures of improper conduct or detrimental action by the Department or any of its employees and/or officers may be made to any of the following Department personnel:
• the Protected Disclosure Coordinator;
• the Secretary of the Department;
• a Protected Disclosure Officer of the Department;
• a manager or supervisor of a person from the Department who chooses to make a disclosure; or
• a manager or supervisor of a person from the Department about whom a disclosure has been made.

Department of Treasury and Finance Annual Report 2015 | 16 145
Alternatively, disclosures of improper conduct or detrimental action by the Department or any of its employees and/or officers may also be made directly to the Independent Broad-based Anti-corruption Commission:
Level 1, North Tower, 459 Collins Street Melbourne VIC 3000
Phone: 1300 735 135 Internet: ibac.vic.gov.au
Further information The Protected Disclosure Policy and Procedures, which outline the system for reporting disclosures of improper conduct or detrimental action by the Department or any of its employees and/or officers, are available on the Department’s website.
Disclosures under the Protected Disclosure Act 2012 2015-16
(number) 2014-15
(number) The number of disclosures made by an individual to the Department and notified to the Independent Broad-based Anti-corruption Commission
Assessable disclosures – –

146 Department of Treasury and Finance Annual Report 2015 | 16
Appendix 11 Compliance with the Building Act 1993 Standards for publicly owned buildings The Department employs an external service provider to manage the government-owned office accommodation portfolio and provide facilities management to ensure compliance with standards for publicly owned buildings and provide essential safety measures reporting. Since April 2014, UGL Services Pty Ltd (DTZ), now known as Cushman & Wakefield, has provided these services.
The Shared Service Provider (SSP) within DTF coordinates building projects through the engagement of registered building consultants and contractors. The conditions of engagement require compliance with the standards for publicly owned buildings.
At 30 June 2016, DTF was responsible for 17 department-owned office buildings.
Mechanisms to ensure that buildings conform with the building standards DTF complies with the Building Act 1993, the Building Regulations 2006 and associated statutory requirements and amendments. An occupancy permit or a certificate of final inspection endorsed by a Registered Building Surveyor is obtained for all upgrades to existing facilities requiring a building permit.
DTF ensures that design consultants and building contractors engaged for building works are registered building practitioners and that registrations are maintained during the course of the work. Design consultants and building contractors are sourced from the government Construction Supplier Register maintained by DTF.
Works projects (greater than $50 000) Treasury Reserve, East Melbourne
Provision of new secure bicycle facility
1 Treasury Place, East Melbourne
Emergency warning intercom system (EWIS) upgrade
1 Macarthur Street, East Melbourne
EWIS upgrade Boiler upgrade
2 Treasury Place, East Melbourne
Structural floor repairs
23 St Andrews Place, East Melbourne
Carpet replacement
33 St Andrews Place, East Melbourne
Carpet replacement
55 St Andrews Place, East Melbourne
Garden bed and drainage upgrade
20 Spring Street, East Melbourne
Fire sprinkler upgrade
565 Lonsdale Street, Melbourne
Base building upgrade associated with tenancy fitout
30–38 Little Malop Street, Geelong
Window covers, carpet and lighting upgrade
Major works (greater than $50 000) not subject to certification of plans, mandatory inspections of the works and issue of occupancy permits or certification of final inspection
All works are undertaken by registered building practitioners with certification that the work either complies with the existing occupancy permit, a revised permit, or a certificate of final inspection.

Department of Treasury and Finance Annual Report 2015 | 16 147
Mechanisms for inspection, reporting, scheduling and carrying out of rectification works on existing buildings
There are five main mechanisms established for inspecting, reporting, scheduling and performing rectification and maintenance works on the existing buildings.
1. Provision and management of maintenance service contracts for all owned buildings.
2. Six monthly property inspection reports, liaison with tenants and responses to identified issues.
3. Ensuring there is an annual essential safety measures report for each building.
4. Commissioning independent formal condition, maintenance and compliance audits on buildings every five years (last conducted 2011-12). SSP undertakes the five-year independent condition audits of the owned portfolio.
5. Commissioning engineering/consultant reports.
Cushman & Wakefield manages the service maintenance contracts for the DTF-owned government office buildings. They are responsible for:
• undertaking breakdown, preventative and cyclical maintenance (point 1 above);
• identifying and prioritising works required in consultation with DTF (point 1 above);
• managing rectification works (point 1 above);
• conducting regular inspections to ensure works are performed to standard (point 2 above); and
• managing maintenance to support the issue of the annual essential safety measures reports (point 1 above).
Quality assurance, performance measures and governance are built into the contract with Cushman & Wakefield.
Number of buildings conforming with the building standards
17
Number of buildings that have been brought into conformity during the reporting period
Nil
Number of cases and circumstances where registered building practitioners became deregistered
Nil

148 Department of Treasury and Finance Annual Report 2015 | 16
Appendix 12 National Competition Policy The Department continues to comply with the requirements of the National Competition Policy. Competitive neutrality requires government businesses to ensure where services compete, or potentially compete with the private sector, any advantage arising solely from their government ownership be removed if it is not in the public interest. Government businesses are required to cost and price these services as if they were privately owned and thus be fully cost reflective. Competitive neutrality policy provides government businesses with a tool to enhance decisions on resource allocation. This policy does not override other policy objectives of government and focuses on efficiency in the provision of service.
Following a review of National Competition Policy in 2005, the Council of Australian Governments agreed to annual reporting against enhanced competitive neutrality principles for incorporated government business entities engaged in significant business activities in competition with the private sector. Reports against these principles are made annually through the Heads of Treasuries and published on the Council on Federal Financial Relations’ website.
In 2015-16, the Victorian Competition and Efficiency Commission and, from 22 September 2015, the Commissioner for Better Regulation, were responsible for considering competitive neutrality complaints by individuals and businesses against government entities and reported to the Government on compliance with the policy. No competitive neutrality complaints were lodged against business activities operated by DTF.

Department of Treasury and Finance Annual Report 2015 | 16 149
Appendix 13 Implementation of the Victorian Industry Participation Policy The Victorian Industry Participation Policy Act 2003 requires departments and public sector bodies to report on the implementation of the Victorian Industry Participation Policy (VIPP). Departments and public sector bodies are required to apply VIPP in all procurement activities valued at:
• $3 million or more in metropolitan Melbourne and for statewide projects; or
• $1 million or more for procurement activities in regional Victoria.
Shortlisted bidders for eligible procurement activities must complete a VIPP Plan that has been certified by the Industry Capability Network Victoria. The VIPP Plan needs to include:
• the level of local content expected within the procurement activity;
• expected employment levels (new and retained jobs);
• expected training, skills development and technology transfer; and
• how the plan will be implemented.
During 2015-16, the Department1 entered into no new arrangements to which the VIPP applied.
The Department is the lead agency for a number of State Purchase Contracts (SPCs). During 2015-16 the Department entered into four SPCs to which VIPP Plans were not required as the procurement is local by nature.
Five SPC arrangements to which the VIPP applied were completed in 2015-16. These contracts provided both statewide and metropolitan coverage.
1 VIPP reporting of DTF agencies is contained in the agency annual reports.

150 Department of Treasury and Finance Annual Report 2015 | 16
Appendix 14 Legislation administered by DTF portfolios There have been two changes to the General Order dated 1 January 2015 since the 2014-15 Annual Report, being the General Order dated 1 March 2016 and the General Order dated 23 May 2016.
For reporting purposes, the legislation administered by DTF portfolios as per the General Order dated 1 January 2015 has been included in the 2015-16 Annual Report.
Prior to 1 March 2016 Treasurer
In accordance with the General Order dated 1 January 2015, the Treasurer was responsible for the administration of the following Acts during the time period of 30 June 2015–1 March 2016.
Alcoa (Portland Aluminium Smelter) Act 1980
Appropriation Acts (passed annually)
Bank Integration Act 1992
Borrowing and Investment Powers Act 1987
Business Franchise (Petroleum Products) Act 1979
Commonwealth Places (Mirror Taxes Administration) Act 1999
Competition Policy Reform (Victoria) Act 1995
Congestion Levy Act 2005
Co-operative Housing Societies Act 1958
Duties Act 2000
Educational Institutions (Guarantees) Act 1976
Electricity Industry (Residual Provisions) Act 1993
Financial Agreement Act 1994
Financial Management Act 1994 – except:
• Sections 1-3 and 7 (these provisions are jointly administered with the Minister for Finance)
• Sections 5, 6, 8, 13-16, 18-23(1) and 27A-27C; Part 7; Part 7A; Part 7B; Part 8; and sections 62-63
(these provisions are administered by the Minister for Finance)
Financial Sector Reform (Victoria) Act 1999
Fire Services Property Levy Act 2012
First Home Owner Grant Act 2000
Gambling Regulation Act 2003 –
• Section 3.4.33
• Section 4.3.12
• Division 1 of Part 3 of Chapter 10
(The Act is otherwise administered by the Minister for Consumer Affairs, Gaming and Liquor Regulation and the Minister for Racing)
Gas and Fuel Corporation (Heatane Gas) Act 1993
Gas Industry (Residual Provisions) Act 1994
Grain Handling and Storage Act 1995 – except:
• Part 3 (this Part is administered by the Minister for Agriculture)
Land Tax Act 2005
Loy Yang B Act 1992
Melbourne Cricket Club Act 1974
Monetary Units Act 2004
Mutual Recognition (Victoria) Act 1998
National Taxation Reform (Consequential Provisions) Act 2000
New Tax System Price Exploitation Code (Victoria) Act 1999
Occupational Licensing National Law Act 2010
Occupational Licensing National Law (Victoria)
Payroll Tax Act 2007

Department of Treasury and Finance Annual Report 2015 | 16 151
Planning and Environment Act 1987 –
• Part 9B (this Part is jointly and severally administered with the Minister for Planning)
(The Act is otherwise administered by the Minister for Planning)
Port Management Act 1995 –
• Sections 160, 171 and 173
(The Act is otherwise administered by the Minister for Finance and the Minister for Ports)
Public Authorities (Dividends) Act 1983
Rural Finance Act 1988
Snowy Hydro Corporatisation Act 1997
State Bank (Succession of Commonwealth Bank) Act 1990
State Electricity Commission Act 1958 – except:
• Section 107 (this section is administered by the Minister for Energy and Resources)
State Owned Enterprises Act 1992 – except:
• Division 2 of Part 2 in so far as it relates to the Victorian Competition and Efficiency Commission (in so far as they relate to that matter, these provisions are administered by the Premier)
• Division 2 of Part 2 in so far as it relates to CenITex (in so far as they relate to that matter, these provisions are administered by the Minister for Finance)
• Division 2 of Part 2 in so far as it relates to the Victorian Plantations Corporation (in so far as they relate to that matter, these provisions are administered by the Minister for Environment, Climate Change and Water)
• Division 2 of Part 2 in so far as it relates to the Water Training Centre (in so far as they relate to that matter, these provisions are administered by the Minister for Environment, Climate Change and Water)
• Division 2 of Part 2, and Part 3, in so far as they relate to the Victorian Interpreting and Translating Service (in so far as they relate to that matter, these provisions are administered by the Minister for Multicultural Affairs)
State Trustees (State Owned Company) Act 1994 – except:
• Part 4 (this Part is administered by the Minister for Families and Children)
Supply Acts (passed annually)
Taxation Administration Act 1997
Taxation (Interest on Overpayments) Act 1986
Trans-Tasman Mutual Recognition (Victoria) Act 1998
Treasury Corporation of Victoria Act 1992
Trustee Companies Act 1984 –
• The Act is jointly administered with the Attorney-General
Victorian Funds Management Corporation Act 1994
Workers Compensation Act 1958 –
• Division 8 of Part 1
(The Act is otherwise administered by the Minister for Finance)
Young Farmers’ Finance Council Act 1979

152 Department of Treasury and Finance Annual Report 2015 | 16
Minister for Finance
In accordance with the General Order dated 1 January 2015, the Minister for Finance was responsible for the administration of the following Acts during the time period of 30 June 2015–1 March 2016.
Accident Compensation Act 1985
Accident Compensation (Occupational Health and Safety) Act 1996
Asbestos Diseases Compensation Act 2008
Casino Control Act 1991 –
• Section 128K(2)
(The Act is otherwise administered by the Minister for Consumer Affairs, Gaming and Liquor Regulation and the Minister for Planning)
Coal Mines (Pensions) Act 1958
Crown Land (Reserves) Act 1978 –
• In so far as it relates to the land shown as:
− Crown Allotments 2A, 3 and 4 of Section 5, City of Melbourne, Parish of Melbourne North (Parish Plan No. 5514C) and known as the Treasury Reserve
− Crown Allotments 4A and 4B on Certified Plan 111284 lodged with the Central Plan Office and to be known as the Old Treasury Building Reserve
(The Act is otherwise administered by the Minister for Corrections, the Minister for Environment, Climate Change and Water, the Minister for Ports, the Minister for Health, the Minister for Tourism and Major Events and the Premier)
Dangerous Goods Act 1985
Equipment (Public Safety) Act 1994
Emergency Services Superannuation Act 1986
Essential Services Commission Act 2001
Financial Management Act 1994 –
• Sections 5, 6, 8, 13-16, 18-23(1) and 27A-27C; Part 7; Part 7A; Part 7B; Part 8; and sections 62-63
• Sections 1-3 and 7 (these provisions are jointly administered with the Treasurer)
(The Act is otherwise administered by the Treasurer)
Government Superannuation Act 1999
House Contracts Guarantee Act 1987
Housing Act 1983 –
• Part 8
• Schedules 7 and 8
• Sections 143(1), 143(2)(d), 143(2)(e), 143(2)(f), 143(2)(i) and 143(3) (these provisions are jointly and severally administered with the Minister for Housing, Disability and Ageing)
(The Act is otherwise administered by the Minister for Housing, Disability and Ageing)
Land Act 1958 –
• In so far as it relates to the exercise of powers relating to leases and licences under Subdivisions 1 and 2 of Division 9 of Part I in respect of:
− land in the Melbourne Casino area within the meaning of Part 9A of the Casino Control Act 1991
− Crown land coloured brown on Plans numbered LEGL./93-211, LEGL./93-212, LEGL./93-213, LEGL./93-214 and LEGL./93-215 lodged in the Central Plan Office
− land shown as Crown Allotment 32E, section 7 on Certified Plan No. 108871 lodged in the Central Plan Office
− land shown as Crown Allotment 4A, section 1A on Certified Plan No. 75050 lodged in the Central Plan Office
− land shown as Crown Allotment 4D, section 1A on Certified Plan No. 112128 lodged in the Central Plan Office
− The area of 3643 square metres of land in the city of Port Melbourne as shown on Plan LEGL./96-216 lodged in the Central Plan Office
− land shown as Crown Allotment 4, section 1A on Certified Plan No. 109991 lodged in the Central Plan Office
• Division 6 of Part I, Subdivision 3 of Division 9 of Part I, section 209, and the remainder of the Act where it relates to the sale and alienation of Crown Lands as set out in Administrative Arrangements Order No. 58
Department of Treasury and Finance Annual Report 2015 | 16 153
• Sections 201, 201A and 399 except in so far as they relate to the land described as Crown Allotment 16 of Section 5, at Elwood, Parish of Prahran being the site of the former Elwood Police Station (except in so far as they relate to that land, these provisions are jointly administered with the Minister for Environment, Climate Change and Water)
• Sections 201, 201A and 399 in so far as they relate to the land described as Crown Allotment 16 of Section 5, at Elwood, Parish of Prahran being the site of the former Elwood Police Station (in so far as they relate to that land, these provisions are jointly administered with the Attorney-General)
(The Act is otherwise administered by the Attorney-General, the Minister for Corrections, the Minister for Environment, Climate Change and Water, the Minister for Health, the Minister for Ports and the Minister for Roads and Road Safety)
Occupational Health and Safety Act 2004
Parliamentary Salaries and Superannuation Act 1968 –
• Part 3
(The Act is otherwise administered by the Special Minister of State)
Petroleum Products Subsidy Act 1965
Police Regulation (Pensions) Act 1958 –
• Part III
(The Act is otherwise administered by the Minister for Police)
Port Management Act 1995 –
• Sections 63A-63J
(The Act is otherwise administered by the Minister for Ports and the Treasurer)
Project Development and Construction Management Act 1994 –
• Part 4
(The Act is otherwise administered by the Minister for Planning, the Minister for Employment and the Premier)
State Employees Retirement Benefits Act 1979
State Owned Enterprises Act 1992 –
• Division 2 of Part 2 in so far as it relates to the CenITex
(The Act is otherwise administered by the Premier, the Treasurer, the Minister for Environment, Climate Change and Water and the Minister for Multicultural Affairs)
State Superannuation Act 1988
Superannuation (Portability) Act 1989
Transport Accident Act 1986 – except:
• Sections 11-14 in so far as they relate to road safety (in so far as they relate to those matters, these sections are jointly and severally administered with the Minister for Finance)
• Sections 15-18, 25 and 29 (these sections are jointly administered with the Minister for Roads and Road Safety)
Transport Superannuation Act 1988
Unclaimed Money Act 2008
Victorian Managed Insurance Authority Act 1996
Workers Compensation Act 1958 – except:
• Division 8 of Part 1 (this Division is administered by the Treasurer)
Workplace Injury Rehabilitation and Compensation Act 2013 – except:
• Division 1 of Part 6 (this Division is administered by the Attorney-General)
154 Department of Treasury and Finance Annual Report 2015 | 16
Post 1 March 2016 Treasurer
In addition to his responsibilities under the previous General Order dated 1 January 2015, the Treasurer became responsible for the administration of the following Acts during the time period of 1 March 2016–23 May 2016 pursuant to the General Order dated 1 March 2016.
Back to Work Act 2015
Constitution Act 1975 –
• Section 88 in so far as it relates to the appointment of the Commissioner for Better Regulation and the Red Tape Commissioner
(The Act is otherwise administered by the Attorney-General, the Minister for Training and Skills, the Premier and the Special Minister of State)
State Owned Enterprises Act 1992 – except:
• Division 2 of Part 2 in so far as it relates to CenITex (in so far as they relate to that matter, these provisions are administered by the Minister for Finance)
• Division 2 of Part 2 in so far as it relates to the Victorian Plantations Corporation (in so far as they relate to that matter, these provisions are administered by the Minister for Environment, Climate Change and Water)
• Division 2 of Part 2 in so far as it relates to the Water Training Centre (in so far as they relate to that matter, these provisions are administered by the Minister for Environment, Climate Change and Water)
• Division 2 of Part 2, and Part 3, in so far as they relate to the Victorian Interpreting and Translating Service (in so far as they relate to that matter, these provisions are administered by the Minister for Multicultural Affairs)
The Treasurer did not become responsible for the administration of any additional Acts during the time period of 23 May 2016–30 June 2016 pursuant to the General Order dated 23 May 2016.
Minister for Finance
In addition to his responsibilities under the previous General Order dated 1 January 2015, the Minister for Finance became responsible for the administration of the following Acts during the time period of 1 March 2016–23 May 2016 pursuant to the General Order dated 1 March 2016:
Audit Act 1994 –
• Sections 8-10, 16A, 16B, 16D, 16E and 16G
• Sections 13, 16C and 21 (these sections are jointly and severally administered with the Special Minister of State)
(The Act is otherwise administered by the Special Minister of State)
Housing Act 1983 –
• Divisions 1–5 and Divisions 7–9 of Part VIII
The Minister for Finance no longer became responsible for the following Acts during the time period of 1 March 2016–23 May 2016 pursuant to the General Order dated 1 March 2016:
Housing Act 1983 –
• Part 8
Transport Accident Act 1986 – except:
• Sections 11-14 in so far as they relate to road safety (in so far as they relate to those matters, these sections are jointly and severally administered with the Minister for Roads and Road Safety)
• Sections 15-18, 25 and 29 (these sections are jointly administered with the Minister for Roads and Road Safety)
The Minister for Finance did not become responsible for the administration of any additional Acts during the time period of 23 May 2016–30 June 2016 pursuant to the General Order dated 23 May 2016.

Department of Treasury and Finance Annual Report 2015 | 16 155
Appendix 15 Information available on request Financial Reporting Direction 22G provides for the information listed below to be retained by the Accountable Officer and to be made available on request subject to the provisions of the Freedom of Information Act 1982.
Information available on request:
• a statement that declarations of pecuniary interests have been duly completed by all relevant officers;
• details of shares held by a senior officer as nominee or held beneficially in a statutory authority or subsidiary;
• details of publications produced by the entity about itself, and how these can be obtained;
• details of changes in prices, fees, charges, rates and levies charged by the entity;
• details of any major external reviews carried out on the entity;
• details of major research and development activities undertaken by the entity;
• details of overseas visits undertaken including a summary of the objectives and outcomes of each visit;
• details of major promotional, public relations and marketing activities undertaken by the entity to develop community awareness of the entity and its services;
• details of assessments and measures undertaken to improve the occupational health and safety of employees;
• a general statement on industrial relations within the entity and details of time lost through industrial accidents and disputes;
• a list of major committees sponsored by the entity, the purposes of each committee and the extent to which the purposes have been achieved; and
• details of all consultancies and contractors including:
− consultants/contractors engaged; − services provided; and − expenditure committed to for each
engagement.
To ensure the Department is meeting its accountability and compliance requirements some of the additional information has been included in this annual report where relevant.
This information is available on request from:
Director Corporate Delivery Services Department of Treasury and Finance GPO Box 4379 Melbourne, Victoria, 3001 Email [email protected] for the attention of the Director, Corporate Delivery Services.

The Secretary Department of Treasury and Finance 1 Treasury Place Melbourne Victoria 3002 Australia
Telephone: +61 3 9651 5111 Facsimile: +61 3 9651 2062 Website: dtf.vic.gov.au
Authorised by the Victorian Government 1 Treasury Place, Melbourne, 3002
Printed by On Demand, Port Melbourne
Printed on recycled paper
© State of Victoria 2016
This work, Department of Treasury and Finance 2015 | 16 Annual Report, is licensed under a Creative Commons Attribution 4.0 licence. You are free to re-use the work under that licence, on the condition that you credit the State of Victoria as author. The licence does not apply to any images, photographs or branding, including the Victorian Coat of Arms, the Victorian Government logo and the Department of Treasury and Finance logo.
Copyright queries may be directed to [email protected]
ISSN 1325 1775
Published October 2016
If you would like to receive this publication in an accessible format, please telephone 03 9651 0909 or email [email protected]
This document is also available in PDF and Word format at dtf.vic.gov.au
9375 DTF 2014_2015_annual_report_cover_FA2.indd 4-6 28/10/2015 3:58 pm

Annual Report 2015 | 16
Annual Report 2015 | 16 dtf.vic.gov.au
An
nu
al R
epo
rt 2015
| 16
9375 DTF 2014_2015_annual_report_cover_FA2.indd 1-3 28/10/2015 3:58 pm
Department of Treasury and Finance
De
pa
rtme
nt o
f Tre
asu
ry a
nd
Fin
an
ce