Embed Size (px)
Citation preview
Water Research Pergamon Press 1973. Vol. 7, pp. 489-500. Printed in Great Britain
D E N I T R I F I C A T I O N . S T U D I E S W I T H
L A B O R A T O R Y - S C A L E C O N T I N U O U S - F L O W U N I T S
P. J. DO TOIT* and T. R. DAVIES National Institute for Water R6~.arch, South African Council for Scientific and Industrial Research,
P.O. Box 395, Pretoria, South Africa
(Received 1971)
Almtmet---Settled domestic sewage, lactate and methanol were all investigated as carbon sourc~ for denitrifieation in different types of denitrifying units. Lactate and methanol were both found to be satisfactory.
Denitritieation was found to be an economically attractive way of removing nitrogen from water in large-scale water reclamation schemes.
INTRODUCTION
TI-mRE is an ever increasing need for an economical method of removing nitrogen from sewage effluents, especially in a country like South Africa, where the limited supply of water has led to a situation of almost constant restrictions on the use of water. Various chemical schemes for water reclamation developed recently (STANDER and VAN VUUREN, 1969; VAN VtJUREN et aL, 1967) could be operated more effectively and costs reduced if nitrogen had been efficiently removed from water prior to treatment by such processes.
In view of this fact the process of denitrification was studied under a variety of operational conditions with particular regard to the possible use of readily available carbon sources for denitrification. Observations by BALAKRISHNAN and ECKL'NEELDER (1970), SEIDEL and CRITES (1970) and ST AMANT and McCARTY (1969) indicated that before total denitrification can take place an extraneous carbon source must be supplied. FINSEN and SAMPSON (1959) achieved total nitrate reduction by this means, but only at the expense of increasing COD values.
Studies in denitrification were carded out with continuous-flow units. Initial investi- gations involved the use of settled domestic sewage alone or with an added carbon source as hydrogen donor. Later the settled sewage was omitted and a nitrified effluent denitrified by addition of methanol only.
MATERIALS AND METHODS
Source of denitrifying bacteria
The denitrifying bacteria were obtained from a laboratory-scale activated sludge unit receiving the supernatant fluid of settled domestic sewage. An enrichment culture was prepared in the medium shown in TABLE 1. This was used as an initial population in the coke PC (packed column) unit as inoculum in place of the above supernatant.
Denitrifying units
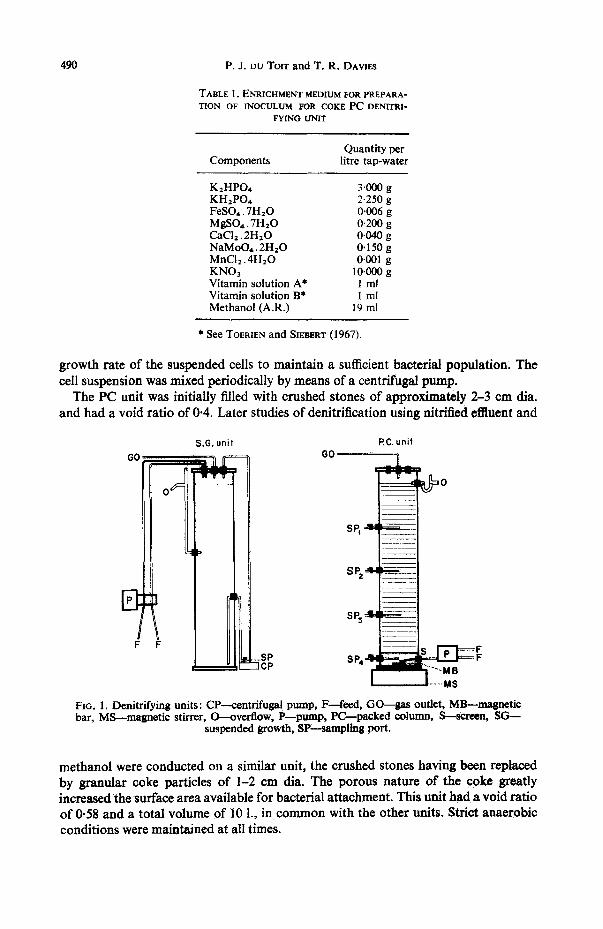
The denitrifying units consisted of a suspended growth (SG) unit and a PC unit. The units were constructed as depicted in FIG. 1. The SG unit relied solely on the
* Present address: Dept. of Biochemistry, Rand Afrikaans University, P.O. Box 524, Johannesburg, South A/flea.
489
490 P . J . DU Torr and T. R. DAVIES
TABLE 1. ENRICHMENT MEDIUM FOR PREPARA- TION OF INOCULUM FOR COKE PC DENITRI-
FYING UNIT
Quantity per Components litre tap-water
K2HPO,, 3'000 g KH2PO4 2-250 g FeSO4.7H20 0.006 g MgSO4.7H20 0.200 g CaCl2.2H20 0.040 g NaMoO, . 2H20 0.150 g MnCl2 .4H20 0.001 g KNOa 10.000 g Vitamin solution A* ! ml Vitamin solution B* 1 ml Methanol (A.R.) 19 ml
* See TOERIEN and SIEBERT (1967).
growth rate of the suspended cells to maintain a sufficient bacterial population, The cell suspension was mixed periodically by means of a centrifugal pump.
The PC unit was initially filled with crushed stones of approximately 2-3 cm alia. and had a void ratio of 0.4. Later studies of denitrification using nitrified eittuent and
S.G. uni t
oo
F F ._SP ~cP
P. C. unit
GO ~,
--~@o
Sp~ = ~ v===
i L-
. . . . . MB L~----MS
FiG. I. Denitrifying units: CP--centrifugal pump, F--feed, GO- -gas outlet, MB--magnet ic bar, MS---magnetic stirrer, O---overflow, P- -pump, PC--packed column, S--screen, S G - -
suspended growth, SP---sampling port.
methanol were conducted on a similar unit, the crushed stones having been replaced by granular coke particles of 1-2 cm dia. The porous nature of the coke greatly increased the surface area available for bacterial attachment. This unit had a void ratio of 0.58 and a total volume of 10 1., in common with the other units. Strict anaerobic conditions were maintained at all times.
Denitrification. Studies with Laboratory-scale Continuous-flow Units 491
Feed For the first series of experiments no natural nitrified effiuent was conveniently
available and a synthetically prepared substrate was used, containing a solution of KNOa in tap water. To this was added either of the two additional carbon sources, lactate and methanol. Settled domestic sewage was dosed in an equal volume together with this above mentioned feed. The composition of the feed was varied at different stages as shown in TABLE 2. The experiments conducted to determine the optimal operating rate of the PC unit did use nitrified effluent, however. This was obtained from the bacterial disc unit described by PR~rORIUS 0971). The concentration of NOa-N in this effiuent varied between 40 and 60 mg N 1-1 with only small amounts of NO2-N and traces of NH3-N present.
TABLE 2. COMPOSITION OF FEED TO DENITRIFYING UNITS AT DIFFERENT STAGES
NOa-N C-source Settled (rng I- 1 in (rag 1- * in sewage
final final (part of mixture) mixture) final
mixture) (%)
Stage 1 300 1200 50 Stage 2 150 600 50 Stage 3 75 300 50 Stage 4* 37.5 150 50 Stage 5 37.5 0 50
* Stage 4 of the SG unit receiving Na-lactate was 75 mg l - ~ NO3-N and 50 per cent settled domestic sewage. There was no stage 5.
Methanol was dosed as hydrogen donor at a rate calculated according to the equa- tion of ST AMANT and McCAItTY (1969) taking the dissolved oxygen into account.
Operation of dentrifying units The SG units were operated at a hydraulic residence time of 40 h. The stone PC
unit was operated at a hydraulic residence time of l0 h. The coke PC unit was operated at different residence times to determine the minimum time required for efficient denitrification of the nitrified effluent. Samples were withdrawn, at the different sampling ports (PC units) at each stage of the experiment after at least three hydraulic residence times had elapsed. Gas samples were periodically taken for analysis. The units were operated in a controlled temperature room at 20°C.
Chemical analysis General chemical analysis (COD, total- and ortho-phosphate, total- and NH 3-
nitrogen, volatile fatty acids and ABS determinations) was performed by means of a Technicon autoanalyser. Nitrates were determined by the method described by MOLLEI~ and WIDEMANN (1955) and nitrites by that of MONTGOI~RY and DYMOCK (1961). Lactate was determined enzymatically (B~Rt3Mm~R, 1963).
492 P, J. DU TOIT and T. R. DAVIES
Gas analysis
Gas samples were routinely analysed on the F and M gas chromatograph on a Poropak S (100-200 mesh) column. For separation of nitrogen and oxygen, samples were analysed on a molecular sieve column.
Activated carbon column
A glass column (3 × 22.5 era) was packed with granular activated carbon giving a total bed volume of 159 ml and a void volume of 48 ml. Effluent from the denitrification unit was pumped through the column with an upward flow rate of 450 ml h- ~ and fractions of 30 ml each were collected for analysis on a fraction collector.
RESULTS AND DISCUSSION
Suspended growth unit
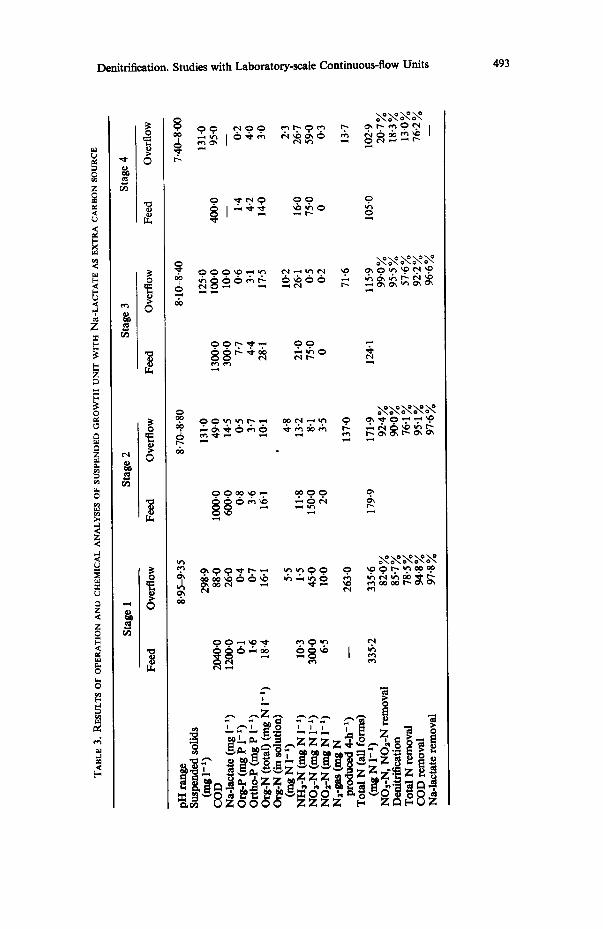
Na-lactate as extraneous carbon source. The results of these analyses (TABLE 3) show that denitrification was at its best with relatively low concentrations of nitrate (75 rag- ~) in the presence of lactate, when 95.5 per cent denitrification was achieved. When the lactate was removed from the feed and nitrate concentration left unchanged, denitrification was reduced drastically to 18.3 per cent. This indicates that settled domestic sewage did not provide a suitable source of carbon for the process of denitrification.
Total nitrogen removal was greatest (78.5 per cent) with large concentrations of nitrate and lactate. This is apparently due to almost all of the nitrogen present being in the nitrate form. As the nitrate concentration was reduced, the ammonia nitrogen concentration became proportionately larger. While the ammonia was rapidly assimi- lated for production of large amounts of cellular material in the higher nitrate-- lactate concentrations, this was less marked at later stages, resulting in slower removal of the ammonia, and consequently less efficient removal of total nitrogen. Total nitrogen removal was poor (13 per cen0 when lactate was removed from the feed, due to the decreased rate of denitrification and a slower rate of cell synthesis.
During stages 1 and 2 (TABLE 3) N20 was formed, but at later stages this gas was not detected. Traces of hydrogen appeared in the gas phase once N20 production ceased.
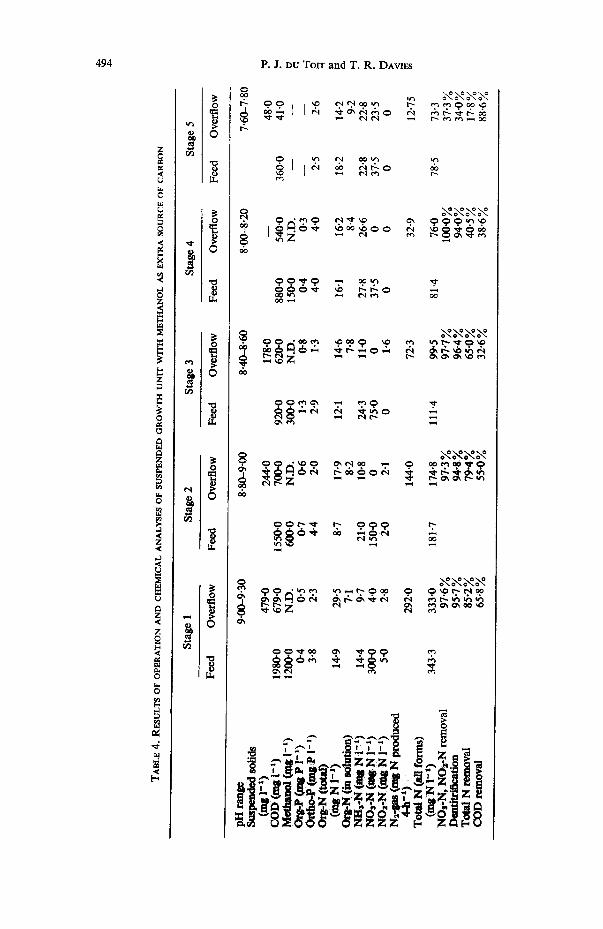
Methanol as extraneous carbon source. The results of chemical analyses when methanol was used as extraneous carbon source are presented in TABLE 4.
Initial results from this unit were very disappointing, but after six hydraulic displacements the population appeared to adapt to the new substrate and 97.6 per cent removal of the nitrites and nitrates present in the feed and 85.2 per cent total nitrogen removal were obtained. Denitrification remained above 90 per cent at all stages of the experiment until the methanol was removed, when this figure dropped to 34 per cent.
Total N removal fell with each decrease in methanol added. High concentrations of ammonia (9.7-22.8 mg 1-~) passed right through the unit at all stages, and these concentrations remained virtually unchanged at the lower nitrate/methanol concentra- tions.
COD removal was not as efficient as that reported for lactate. This was only from 38.6 to 65"8 per cent while methanol was present. This appears to be due to excess methanol in the feed, which indicates that the 4:1 ratio of methanol to NO3-N recommended by BARTn et al. (1968) is probably too high. The discrepancy is probably
TAB
LE 3
. R
ES
UL
TS
OF
OP
ER
AT
ION
AN
D C
HE
MIC
AL
AN
AL
YS
ES
OF
SU
SP
EN
DE
D G
RO
WT
H U
NIT
WIT
H N
a-L
AC
TA
TE
AS
EX
TR
A C
AR
BO
N S
OU
RC
E
Sta
ge 1
S
tage
2
Sta
ge 3
S
tage
4
Fee
d O
verf
low
F
eed
Ove
rflo
w
Fee
d O
verf
low
F
eed
Ove
rflo
w
O
pH r
ange
S
uspe
nded
sol
ids
(rag
1-0
C
OD
20
40.0
N
a-la
ctat
e (r
ag 1
-t)
1200
-0
Org
-P (
nag
P l -
t)
0.1
Ort
ho-P
(ra
g P
1- t)
1.
6 O
rg-N
(to
tal)
(ra
g N
i -t
) 18
.4
Org
-N (
in s
olut
ion)
(m
gN
l -t
) N
H3-
N (
rag
N 1
-0
10.3
N
O3-
N (
rag
N l
- t)
30
0-0
NO
a-N
(m
g N
l -t
) 6.
5 N
a-ga
s (n
ag N
pr
oduc
ed 4
-h-
t)
Tot
al N
(al
l fo
rms)
(m
s N
1-1
) 33
5.2
NO
a-N
, N
O~
-N r
emov
al
Den
itri
iica
tion
T
otal
N r
emov
al
CO
D r
emov
al
Na-
lact
ate
rem
oval
8"95
-9-3
5 8.
70-8
-80
8"10
-8"4
0 7.
40-8
-00
e~
298
"9
131
"0
125 "
0 13
1 "0
~"
88
-0
1000
"0
49.0
13
00.0
10
0.0
400.
0 95
"0
26.0
60
0.0
14-5
30
0.0
10.0
--
--
0.
4 0"
8 0-
5 7-
7 0"
6 1 "
4 0"
2 t-
0-
7 3"
6 3.
7 4-
4 3"
1 4-
2 4"
0 ~-
16
-1
10.1
28
.1
17.5
14
.0
3.0
16-1
5.5
4.8
10.2
2.
3 ~,
1-
5 I 1
-8
13-2
21
-0
26-1
16
"0
26-7
~_
45
-0
150.
0 8"
1 75
-0
0"5
75.0
59
-0
o 10
"0
2"0
3"5
0 0"
2 0
0"3
263"
0 13
7"0
71"6
13
"7
~"
335"
6 17
9-9
171-
9 12
4.1
115"
9 10
5-0
102"
9 82
-0 %
92
"4 %
99
"0 %
20
-7 %
=a
85
.7%
90
.0%
95
-5%
18
"3%
78
"5%
76
.1%
57
-6%
13
"0%
94
-8%
95
-1%
92
.2%
76
.2%
.~
. 97
.8 %
97
-6 %
96
.6 %
--
~"
4~
TAB
LE 4.
RES
ULT
S oF
OP
ER
AT
ION
AN
D C
HE
MIC
AL
AN
AL
YS
ES
OF
SU
SP
EN
DE
D G
RO
WT
H U
NIT
WIT
H M
ET
HA
NO
L A
S E
XT
RA
SO
UR
CE
OF
CA
RB
ON
Sta
ge 1
S
tage
2
Sta
ge 3
S
tage
4
Sta
ge 5
Fee
d O
verf
low
F
eed
Ove
rflo
w
Fee
d O
verf
low
F
eed
Ove
rflo
w
Fee
d O
verf
low
pH r
anp
S
mp
~d
~l solids
(mg
l "t)
C
OD
(ta
g 1-
t)
~0
~1
-1)
Org
-P ~
P
1 -a )
O
rtho
-P O
lqg P
1-1
) 0
rg-N
(total)
(rag
N l
-a)
Org
-N (
in s
olut
ion)
N
I-Is
~l (
ms
N 1
-1)
N0~
-N (
I~N
1 -
a)
NO
z-N
~
N 1
- a)
Na-
gas
~ N
pro
duce
d 4-
h'~
) T
otal
N (
all
form
s)
(msN
l-D
N
OrN
, N
O~
-N r
emov
al
Dea
Gi~
.3fa
eatio
n T
otal
N r
emov
al
CO
D r
emov
al
9"00
-9-3
0 8-
80--
9-00
8.
40-8
.60
8.00
-8.2
0
479-
0 24
4.0
178.
0 --
19
80-0
67
9.0
1550
.0
700.
0 92
0-0
620-
0 88
0-0
540"
0 36
0-0
1200
.0
N.D
. 60
0.0
N.D
. 30
0-0
N.D
. 15
0-0
N.D
. --
0-
4 0"
5 0.
7 0-
6 1"
3 0-
8 0-
4 0"
3 --
3"
8 2-
3 4-
4 2-
0 2-
9 1.
3 4.
0 4"
0 2"
5
14"9
29
.5
8.7
17.9
12
.1
14"6
16
"1
16-2
18
.2
7"1
8.2
7.8
8"4
14.4
9-
7 21
.0
10-8
24
-3
11-0
27
-8
26"6
22
"8
300.
0 4"
0 15
0.0
0 75
.0
0 37
.5
0 37
.5
5-0
2-8
2.0
2-1
0 1-
6 0
0 0
292.
0 14
4-0
72.3
32
.9
343.
3 33
3-0
181.
7 17
4.8
111.
4 99
.5
81.4
76
-0
97
.6~
97
-3~o
97
-7~o
10
0-0%
95
.7 ~
. 94
-8 ~
. 96
.4 %
94
-0 ~
o 85
.2 ~
. 79
.4 ~
. 65
-0 ~
. 40
-5 %
65'8 ~0
55-0 ~
32"6 ~o
38-6
78.5
7.60
-7.8
0
48-0
41
.0
2-6
14-2
9-
2 22
-8
23.5
0 12
-75
73.3
37
.3~
34
-0Y
o 17
.8%
88
.6%
~7
t~
<
TA
BL
E 5
. R
ES
UL
TS
OF
OP
ER
AT
ION
AN
D C
HE
MIC
AL
AN
AL
YS
IS O
F P
AC
KE
D C
OL
UM
N U
NIT
VV
ITH
Na-
LA
CT
AT
E A
S E
XT
RA
CA
RB
ON
SO
UR
CE
Sta
ge 1
S
tage
2
Sta
ge 3
S
tage
4
Sta
ge 5
Fee
d O
verf
low
F
eed
Ove
rflo
w
Fee
d O
verf
low
F
eed
Ove
rflo
w
Fee
d O
verf
low
O
pH
CO
D (
rag
1 -x)
19
00.0
N
a-la
ctat
e (n
ag 1
-1)
1200
.0
Org
-P (
nag
P 1-
1)
1.9
Ort
ho-P
(m
g P
1-1)
6.
9 O
rg-N
(na
g N
1-1
) 28
.3
NH
s-N
(na
g N
1-1
) 28
-1
NO
3-N
(na
g N
1- t
) 30
0.0
NO
a-N
(na
g N
1-1
) 1.
0 N
2-ga
a (n
ag N
pro
duce
d 1-
1 fe
ed)
Tot
al N
(al
l fo
rms,
nag
1-1
) 3
56
.4
NO
3-N
, N
O2-
N r
emov
al
Den
itri
fica
tion
T
otal
-N r
emov
al
CO
D r
emov
al
Na-
lact
ate
rem
oval
9-2
8"7
7.8
8.0
8"2
141"
0 10
70"0
68
-0
1040
-0
107"
0 78
0-0
145-
0 35
0-0
57-0
30
"0
600.
0 14
"3
300-
0 11
.0
150-
0 5.
7 0
0 0"
4 0-
8 0.
7 0.
7 0.
2 0-
6 0-
6 1.
2 1.
2 2.
3 3-
6 3"
3 4"
4 6-
5 5"
3 5"
3 4.
8 4-
7 11
.2
15.8
6-
0 17
.5
10.5
21
.0
10-2
14
.0
6"3
11"4
21
"0
25.6
24
.7
23-5
20
"8
29.2
26
"5
29-8
18
"9
150.
0 0
75.0
0
37.5
0
37.5
16
.0
0"5
1"0
0 0
0 0
0 0
0
270"
0 14
1.0
73.5
36
-0
18-1
31
2.0
187-
8 17
2.6
117-
2 10
7.5
79.3
75
.4
78-0
70
-2
92.8
~o
100-
0 ~o
10
0.0
~ 10
0.0
~ 57
.3 ~
o 89
-8 ~
93
-4~0
98
-0~o
96
-1%
48
-3 ~o
87
.5 ~
o 75
-1 ~
62
.7 ~
o 45
.5 ~
o 23
.2 ~
o 92
.4 ~
o 93
.7 ~
o 89
-7 ~
o 82
-7 ~
o 83
.8
97.6
~0
97.6
~e
96.4
y0
96.1
~o
--
0" o &
t~
0 ~a
0
4~
O~
TA
BL
E 6
. R
ES
UL
TS
O
F C
HE
MIC
AL
A
NA
LY
SIS
ON
E
FF
LU
EN
T
FR
OM
DE
N1
TR
IFY
ING
U
NIT
A
ND
F
EE
D G
OIN
G
INT
O D
EN
ITR
IFY
ING
U
NIT
A
T
DIF
FE
RE
NT
H
YD
RA
UL
IC
RE
SID
EN
CE
T
IME
S
HR
T*
N
Oa-
N
NO
2-N
N
Ha-
N
Org
anic
-N
Ort
ho
-P
CO
D
Met
han
ol
(h)
Sam
ple
(mg
N l
- 1)
(m
gN
l-
1 )
(mg
N l
- ~)
(m
gN
l-
1 )
(mg
P l
- ~ )
(m
g l-
1 )
(mg
1 - 1
)
8"65
F
eed
55
-90
0-70
0
3"50
10
"03
63'0
5 14
1.01
- E
fflu
ent
0 0
0 0-
70
5"34
36
"0
15"0
4-
80
Fee
d
49-9
0 0-
10
0 1.
40
11-8
3 40
.0+
+
125-
5t
Eff
luen
t 0
0 0
0.90
5-
71
40"0
7.
0 2.
62
Fee
d
54.1
0 0.
70
0.3
3.10
7.
10
40.6
+ +
137.
0-~
Eff
luen
t 0-
63
0.06
0.
05
2.05
4.
97
38.0
9-
3 1.
61
Fee
d
56.4
0 0.
18
0.40
3-
20
11.1
5 36
.3++
14
2"31
- E
fflu
ent
0"63
0.
29
0.06
2-
14
6.25
42
"3
7.0
I'0
0
Fee
d
44.3
0 0.
38
4.80
2-
10
10-6
0 39
.6++
11
2"41
- E
fflu
ent
0-63
0-
12
2.60
2.
90
6.70
40
.0
5-5
0.81
F
eed
40
.70
1-05
3.
75
0.75
8-
25
34.0
+
104.
4"~
Eff
luen
t 0.
95
0-10
0.
80
1.50
3.
30
18.0
5.
0 0.
41
Fee
d
52.4
0 1.
00
6.25
1.
25
10.8
0 62
-55
134-
0t
F_~
uent
18
"50
0-22
6"
25
1-25
5"
80
69.0
22
.5
C £ ~7
_<
* H
RT
: H
yd
rau
lic
resi
den
ce ti
me,
cal
cula
ted
fro
m v
oid
vol
ume
of
5'8
1.
t A
mo
un
t ca
lcul
ated
fro
m e
qu
atio
n g
iven
by
ST A
MA
NT
an
d M
cCA
RT
Y (1
969)
. ++
CO
D o
f ni
trif
ied
effl
uent
onl
y.
Denitrification. Studies with Laboratory-scale Continuous-flow Units 497
caused by adherance to anaerobic conditions in the experiment reported here, a similar observation to that reported by ST A~ANT and MCCARrZ (1969) who also found a 4:1 ratio to be excessive.
Packed column unit (stones)
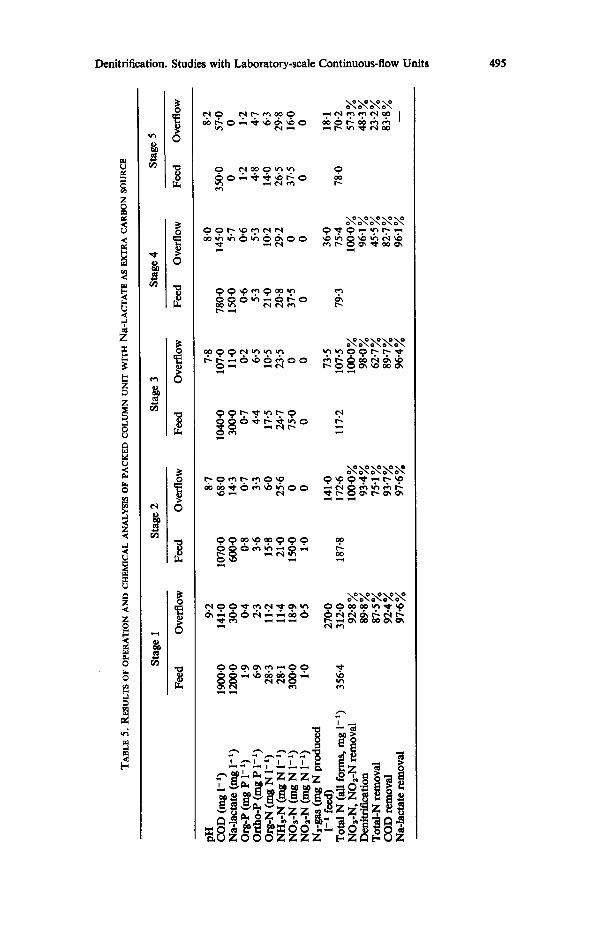
Na-lactate as extraneous carbon source. Results of chemical analysis are presented in TABLE 5.
This unit was operated at a pumping rate four times faster than with the SG units. For this reason denitrification was not quite complete at the highest nitrate concentra- tion (300 mg NO3-N 1- 2) but once again the best total nitrogen removal was obtained at these high levels.
When settled sewage was the only carbon source, nitrate removal (57.3 per cent) and total N removal (23.2 per cent) were unsatisfactory.
The first sampling port was only about 1 cm above and 7 cm horizontally away from the inlet point, but virtually all the nitrate was removed within this short distance. This indicates a zone of extremely active denitrifying bacteria close to the inlet point and shows that this kind of unit is remarkably efficient in achieving its purpose, providing a suitable extraneous carbon source is supplied.
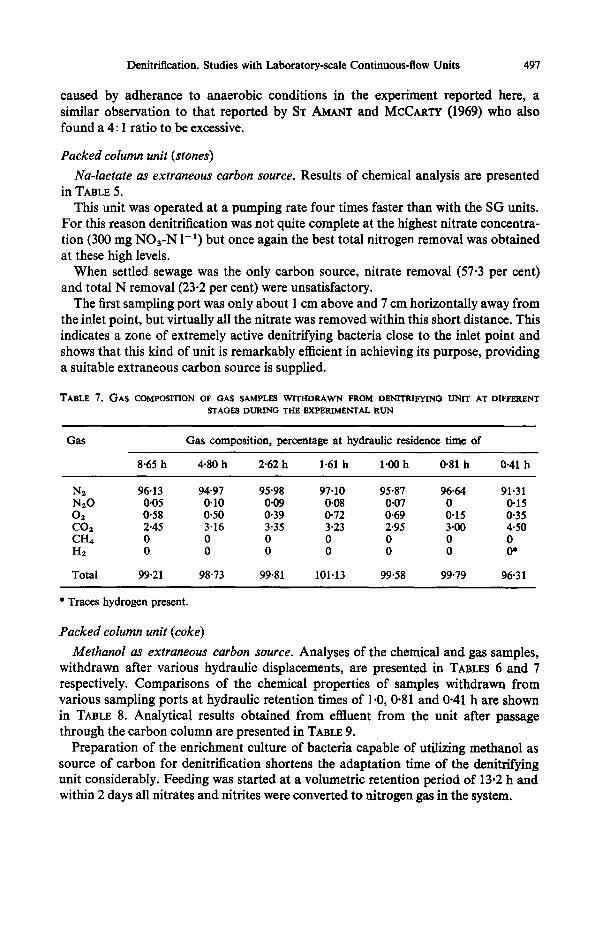
TABLE 7. GAS COMPOSITION OF GAS SAMPLES WITHDRAWN FROM DENITRIFYINO UNIT AT DIFFERENT STAGES DURING THE EXPERIMENTAL RUN
Gas Gas composition, percentage at hydraulic residence time of
8.65 h 4.80 h 2.62 h 1-61 h 1.00 h 0.81 h 0.41 h
N2 96.13 94.97 95.98 97.10 95.87 96.64 91.31 N20 0.05 0-10 0.09 0.08 0.07 0 0.15 02 0.58 0.50 0.39 0.72 0.69 0.15 0.35 CO2 2.45 3-16 3.35 3.23 2.95 3.00 4.50 CH4 0 0 0 0 0 0 0 Hz 0 0 0 0 0 0 0*
Total 99.21 98.73 99.81 101.13 99.58 99.79 96.31
* Traces hydrogen present.
Packed column unit (coke)
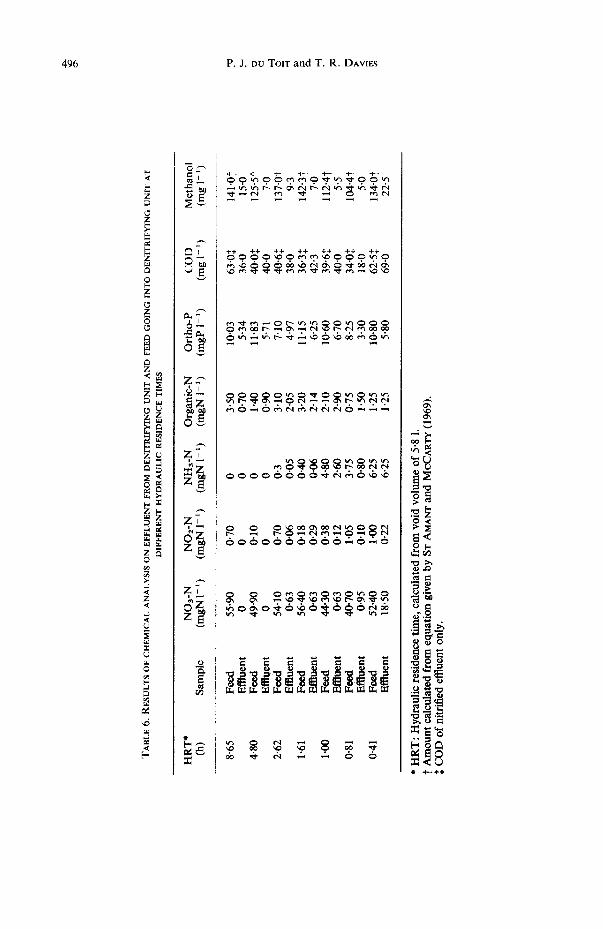
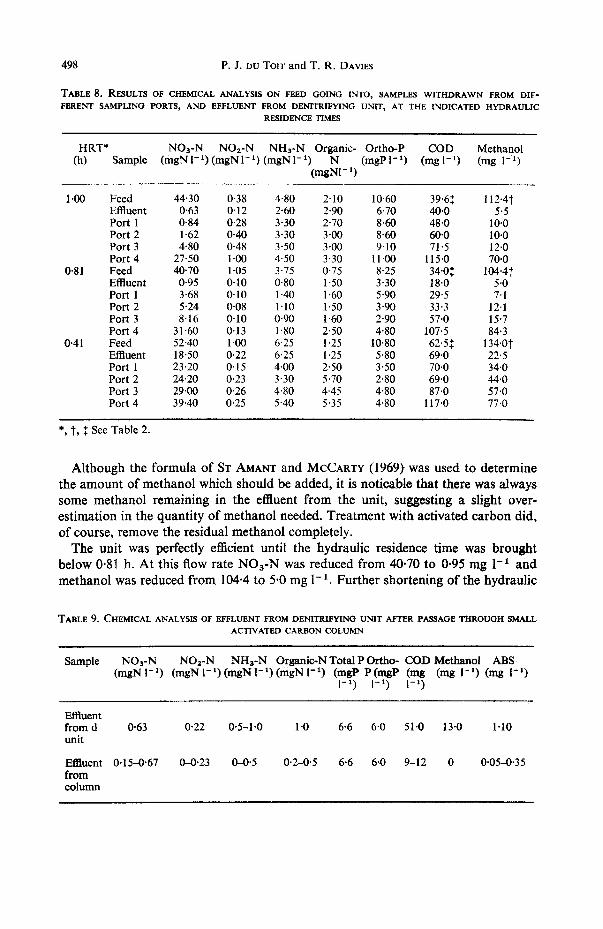
Methanol as extraneous carbon source. Analyses of the chemical and gas samples, withdrawn after various hydraulic displacements, are presented in TABLES 6 and 7 respectively. Comparisons of the chemical properties of samples withdrawn from various sampling ports at hydraulic retention times of 1.0, 0"81 and 0-41 h are shown in TABLE 8. Analytical results obtained from effluent from the unit after passage through the carbon column are presented in TABLE 9.
Preparation of the enrichment culture of bacteria capable of utilizing methanol as source of carbon for denitrification shortens the adaptation time of the denitnfying unit considerably. Feeding was started at a volumetric retention period of 13-2 h and within 2 days all nitrates and nitrites were converted to nitrogen gas in the system.
498 P .J . DU TO1T and T. R. DAVIES
TABLE 8. RF~ULTS OF CHEMICAL ANALYSIS ON FEED GOING INTO, SAMPLES WITHDRAWN FROM DIF-
FERENT SAMPLING PORTS, AND EFFLUENT FROM DENITRIFYING UNIT, AT THE INDICATED HYDRAULIC
RESIDENCE TIMES
HRT* NOa-N NO2-N NHa-N Organic- Ortho-P COD Methanol (h) Sample (mgNl-1 ) (mgN1-1) (mgN1-1) N (mgP1-1) (mg1-1) (rag 1-1)
(mgN1 - l )
1.00 Feed 44"30 0.38 4"80 2-10 10-60 39.6.~ 112"4t Effluent 0"63 0"12 2"60 2.90 6"70 40.0 5-5 Port 1 0-84 0'28 3"30 2-70 8.60 48"0 10"0 Port 2 1-62 0.40 3-30 3.00 8.60 60.0 10.0 Port 3 4"80 0-48 3"50 3"00 9.10 71-5 12"0 Port 4 27.50 1.00 4.50 3-30 11.00 115'0 70.0
0.81 Feed 40-70 1-05 3'75 0.75 8'25 34-0, + 104.4"[ Effluent 0.95 0.10 0.80 1.50 3.30 18.0 5.0 Port 1 3.68 0.10 1.40 1-60 5.90 29.5 7.1 Port 2 5"24 0.08 1'10 1"50 3.90 33-3 12.1 Port 3 8'16 0'10 0.90 1.60 2"90 57-0 15"7 Port 4 31-60 0"13 1'80 2.50 4"80 107'5 84.3
0"41 Feed 52.40 1.00 6.25 1.25 10'80 62'5+ + 134"0t Effluent 18.50 0.22 6.25 1.25 5.80 69.0 22.5 Port 1 23.20 0"15 4.00 2.50 3"50 70.0 34.0 Port 2 24.20 0.23 3.30 5-70 2"80 69.0 44.0 Port 3 29.00 0-26 4'80 4.45 4-80 87.0 57'0 Port 4 39.40 0.25 5.40 5.35 4-80 117.0 77.0
*, I", + See Table 2.
Although the formula of ST AMANT and MCCARI'Y (1969) was used to determine the amount of methanol which should be added, it is noticable that there was always some methanol remaining in the effluent from the unit, suggesting a slight over- estimation in the quantity of methanol needed. Treatment with activated carbon did, of course, remove the residual methanol completely.
The unit was perfectly efficient until the hydraulic residence time was brought below 0.81 h. At this flow rate NOa-N was reduced from 40.70 to 0.95 mg 1 -I and methanol was reduced from 104.4 to 5.0 mg 1- i. Further shortening of the hydraulic
TABLE 9. CHEMICAL ANALYSIS OF EFFLUENT FROM DENITRIFYING UNIT AFTER PASSAGE THROUGH SMALL
ACTIVATED CARBON COLUMN
Sample NO3-N NOz-N NHs-N Organic-N Total P Ortho- COD Methanol ABS (mgN1-1) (mgNt -1 ) (mgNl -1 ) (mgN 1-1) (mgP P(mgP (nag (nag 1-1) (nag ! -1)
1-1) 1-1 ) 1-1)
Effluent from d unit
Effluent from column
0"63 0.22 0.5-1.0 I'0 6.6 6'0 51.0 13.0 1"10
0.15--0.67 0--0.23 {)4).5 0.2-0.5 6.6 6,0 9-12 0 0.05--0.35
Denitrifieation. Studies with Laboratory-scale Continuous-flow Units 499
residence time to 0.41 h resulted in fairly large amounts of nitrate and methanol being detected in the effiuent. Analysis of samples taken at various points along the column showed that the level at which denitriflcation was complete moved further up with each successive increase in the flow rate. At a hydraulic residence time of 0.81 h complete denitrification was only completed between Port 1 and the overflow. The residual nitrate detected in the effluent at 0.41 h residence time was quite as expected. Table 8 would seem to indicate that a 1-h hydraulic residence time would be suitable for a unit of these dimensions, as denitrification was virtually complete before Port 1, allowing a slight leeway as a safety margin.
CONCLUSIONS
Settled domestic sewage is unsuitable as a carbon source for inducing denitrification, although efficient COD removals can be obtained in the system. The fact that ammonia nitrogen flows freely through this system results in poor total nitrogen removal values.
Lactate is an efficient additive for achieving denitdfication. Efficient removal of nitrate by lactate addition can be achieved effectively by a C:N ratio of less than 1.5: 1, where N represents -NOa or -NO2 nitrogen.
Methanol is also suitable for inducing an acceptable rate of denitdfication. The 4: 1 ratio of methanol to NOa-N suggested by BARTH et aL (1968) appears to be too high if anaerobic conditions are maintained. The ratio given by ST AMANT and McCARTY (1969), about 2.5: 1, would be more suitable.
The packed column type unit appears to be a very effective system for use as a denitrifying unit, particularly when packed with coke to increase the surface area.
A denitrifying unit packed with coke and receiving methanol as hydrogen donor used in series with a bacterial disc unit appears to provide an efficient unit for use in water reclamation schemes. The low suspended solids and ABS values recorded would make processes for foam fractionation, flocculation and ammonia stripping unneces- sary. The fast flow rate at which the unit can be operated would make possible the construction of a relatively small unit, keeping down capital costs. The low operating cost at which the unit can be run, less than 3 c per thousand gallons for water containing 50 nag 1-1 NO3-N, make this method of treatment an attractive proposition for large scale water reclamation schemes.
SUMMARY
Studies on denitdfication were carded out with various types of continuous flow units. Settled domestic sewage, lactate and methanol were used as hydrogen donors.
The results discussed in this paper include: (i) settled domestic sewage was not a suitable carbon source, introducing ammonia
which could not be handled by the unit; (ii) both lactate and methanol were suitable carbon sources for denitdfication.
Adaptation of the bacterial population to use methanol took a considerable time; (iii) a coke filled column receiving methanol achieved total denitdfication with a
hydraulic residence time of less than 1 h, and; (iv) such a denitdfying unit appears to be a technically and economically sound
method for use in water reclamation processes.
500 P.J. Du TOIT and T. R. DAVI~S
Acknowledgements--Mr. R. J. L. C. Ds~ws is thanked for supplying inoculum of de, nitrifying bacteria. Our thanks are due to Miss K. L. HYMAN for technical assistance and Dr. W. A. Pn~'roRius for helpful discussions.
R E F E R E N C E S
BALAKRI$HNAN S. and ECKENFELDER W. W. (1970) Nitrogen removal by modified activated sludge process. J. sanit. Engng Die. Am. Soc. ely. Engrs SA2, 501-512.
BARTH E. F., B g ~ R. C. and LEwis R. F, (1968) Chemlcal-biological control of nitrogen and phosphorus in waste water effluent. J. Wat. Pollut. Control Fed. 40, 2040-2054.
B~OML~/T.R H. U. (1963) Methods of Enzymatic Analysis. Academic Press, New York. Fn~SEN P. O. and SAMPSON D. (1959) Denitrification of sewage effluents. Wat. Waste Treat. J. 298-300. MONTGOMERY H. A. C. and DYMOCK J. F. (1961) The determination of nitrite in water. Analyst,
Lend. 86, 414-416. MOI.LER R. and WIDEMANN O. (1955) Best immtmg des Nitrat-Ions Lm Was~r. Wasser 22, 247-271. SALLE A. J. (1961) Laboratory Manual on Fundamental Principles of Bacteriology, p. 196. McGraw-
Hill, New York. SEIDEL D. F. and CRrr~ R. W. (1970) Evaluation of anaerobic denitriilcation processes./, sanit.
Engng Die. Am. Soc. cir. Engrs SA2, 267-277. ST AMANT P. P. and McCARTY P. L. (1969) Treatment of high nitrate waters. J. Am. Wat. Wks. Ass.
61, 659-662. STANDER G. J. and VAN Vtnm~ L. R. J. (1969) The reclamation of potable water from waste water.
J. Wat. Pollut. Control Fed. 41, 355-367. VAN VUUREN L. R. J., STANDER G. J.) HENZEN M. R., MEIRING P. G. J. and VAN BLERK S. H. V. (1967)
Advanced purification of sewage works effluent using a combined system of lime softening and floatation. Water Research 1, 463-474.


![Continuous Random Variables. Consider the following table of sales, divided into intervals of 1000 units each, interval (0,1000] (1000,2000] (2000,3000]](https://img.dokumen.tips/doc/110x75/56649e035503460f94aee40b/continuous-random-variables-consider-the-following-table-of-sales-divided.jpg)