Embed Size (px)
Citation preview
AUA Working Paper Series No. 2014-6 September 2014
Demand for Imported Meat in Greece: A Source-Differentiated
Almost Ideal Demand System Approach
Stathis Klonaris Dept. of Agricultural Economics and Rural Development, Agricultural University of Athens [email protected] This series contains preliminary manuscripts which are not (yet) published in professional journals
Agricultural University of Athens · Department of Agricultural Economics & Rural Development · http://www.aoa.aua.gr
1
Demand for Imported Meat in Greece: A Source-
Differentiated Almost Ideal Demand System Approach
Stathis Klonaris Dept. of Agricultural Economics and Rural Development
Agricultural University of Athens
Abstract
Greece is self-sufficient in crop production but it relies heavily on meat and dairy imports. The Greek balance of trade for agricultural products was steadily deficit due to the heavy imports of meat and dairy products. In this study the restricted source differentiated AIDS was employed in order to study the demand of imported meat. The results is indicted that Germany and France have the most to gain from a Greek exit from the financial crisis which it will lead to an expansion in beef and pork market. Moreover, the results indicate that in the pork market Germany and France has a comparative advantage to Denmark and Netherlands.
Key words: imported demand, Greek meat imports, AIDS model, source differentiation,
Introduction
While Greece is a world renowned producer of agricultural products, the country is
dependent on imports of many key products to meet its needs. The agricultural
sector is basically self-sufficient in crop production, but it relies heavily on meat and
dairy imports. According to Greek Statistics Authority, (EL.STAT), the balance of trade
for agricultural products for the period 2004-2009 was steadily deficit. Meat
products represent almost the 46% of the agricultural trade deficit. During the
period 1992-2003, quantities of imported meat increased by 5.6% annually while
between 2005 and 2008 the meat imports increased by 14%. France, Germany and
Netherlands are the main suppliers to Greece. Also, some quantities of meat,
especially turkey, are imported from Italy. Domestic products cover almost 35% of
bovine meat consumption and the rest is covered by imports. In recent years the
level of agricultural imports has decreased. Due the ongoing recession, imports were
reduced, with the trade deficit dropping by 5.7%, while between January and
October of 2013 the trade balance deficit dropped by 13.1%. Finally, the trade deficit
of agricultural products decreased significantly in the first quarter of 2013
withdrawing to € 280,2 million from € 353.5 million of the first quarter of 2012 due
to the significant increase in exports and smaller increase in imports (Alpha Bank
2013)
2
Trade liberalization via the World Trade Organization and especially after the Doha
Round, is expected to have an impact on EU agriculture. An important question for
the EU is whether the reforms of the Common Agricultural Policy (CAP) have
improved the ability of EU to adjust to a more liberal trade environment. Although
the domestic reforms did not overtly deal with external trade and import protection,
benefits from CAP reforms in terms of a reduced need for export subsidies and tariff
protection are automatically the results of lower support prices for EU agricultural
products. Furthermore, the decision of the EU to combine all of its domestic support
payments for agriculture into one decoupled Single Farm Payment (SFP) is expected
to improve the ability of the EU to adjust to the gradual liberalization of agricultural
markets that lies ahead. According to Hung-Niemi et al (2009), due to trade
liberalization and the establishment of the new CAP, EU imports would escalate and
EU exports would plummet with declining EU production. Their results suggest that
CAP reforms accompanied by tariff reductions and the removal of export subsidies
would cause a reduction in EU production in the most of agricultural sectors and
especially on meat sector. The decoupling of the CAP support payments and a drastic
increase in input prices such as fertilizers, energy and labor have lowered the
incentive for high cost producers to continue production. In this context, the
empirical analysis of imported demand for meat of a solid importer such as Greece
becomes of interest both to the country’s potential trade partners and to domestic
policy makers, interested on the impact of trade flows on the domestic livestock
sector
In applied International Economics, the analysis of the effects on trade flows caused
the changes of incomes and prices, is a very interesting issue. The “elasticities”
approach of the econometric specifications of import and export demand functions
has always been used in international economics to determine the causes of trade
because of its capacity both to explain the past and to forecast and, consequently,
plan the future. The increasing interdependence among countries and their efforts
to maximize benefits from international trade makes the import and export demand
specifications essential not only for forecasts, planning and policy formulation but
also for the quantification of welfare gains from trade (Hamori S., Yin F., 2011).
Consequently, policy evaluations and simulations require reliable estimates of
demand responsiveness to prices and expenditures. Welfare analysis also based on
accurate demand estimates. However, little effort has been made to estimate Greek
meat import demand with the only exception the work of Pantzios and Fousekis
(1998; 1999) that they estimated meat import behavior of Greece using data from
FAO and alternative differential demand systems. Although both of these studies
addressed meat import demands in Greece, meats are not differentiated by source
of supply.
3
In this light, the general objective of this study is to estimate the Greek demand for
meats from different sources. More specifically, the objective of this study is to
analyze the impact of economic factors on several EU countries competitiveness in
the Greek meat import market and to provide estimates of meat import demand
elasticites for this market. The remainder of this study is organized as follows: in the
next section, the model of the Greek meat demand is presented. This section is
followed by a discussion of empirical results. The summary and conclusion are given
in the last section.
Model specification
The early literature of the trade modelling was mostly concerned with individual
countries and large aggregates of commodities due to the fact that researchers was
interested in predicting gross trade flows and evaluating the impact of exchange rate
fluctuations on balance of payment. However, moving the interest of empirical
research on analyzing intervention policies and competitiveness of different
exporters, the methodologies shifted towards to microeconomic foundations.
The Argmington trade model was one of the most popular model that was used as
vehicle in empirical trade analysis. (among others Babula, 1987; Penson and
Babula1988; Duffy et al, 1990). Armington model provides an insight in the
international trade theory providing a way to account to the fact that commodities
are differentiated by place of origins. Thus this model allows imperfect substitution
among goods from different origins. However, this models suffers from the
restrictive assumptions of a constant elasticity of substitution (CES), and
homotheticity which may leads to biased parameter estimates (Alston et al, 1990;
Winters, 1984)
Over the last twenty years, a wide range of solutions has been implemented to
overcome the weaknesses of the Armington model. More flexible functional forms
for estimating demand systems became available and extensively used in domestic
demand analysis. Hence, following the seminal paper of Winters (1984), a long list of
econometric studies was published, dealing with the estimation of import demand
models by geographical sources using flexible functional forms such as AIDS,
Rotterdam, translog, generalized Leontief and normalized symmetric quadratic
functional forms, etc.
The AIDS model of Deaton and Muellbauer (1980) is one of the widely used models.
It represents a a flexible compete demand system and it does not require the
additivity of the utility function. It satisfies the axioms of choice exactly and under
certain conditions aggregates perfectly over consumers. de Gorter and Maike (1987)
and Alston et al (1990) are among the first researchers that used the AIDS
specification in the context of estimating source-differentiated demand for imported
4
commodities. Although all imports of commodities considered in their study are
aggregated into a single commodity, the common assumption of weak separability
between imported and domestic demand is relaxed. Even though theoretically
formulation of source-differentiated AIDS model for more than one good is
straightforward, in practice such a model will grow in size very fast. For instance, for
five groups of products and three sources of imports in each group, an unrestricted
AIDS model will have 18 equations and 18 x (18+2) = 300 parameters to estimate.
Under such circumstances, even the standard assumptions of adding-up,
homogeneity and symmetry may not be sufficient to solve the degrees-of-freedom
problem.
To reduce the number of parameters to be estimated, Yang and Koo (1994) specify
an AIDS model and introduce an assumption of block- substitutability (BLSUB).
Opposite to the Armington model which requires two-stage budgeting, according to
the assumption of block-substitutability, expenditures are allocated simultaneously
over all products under consideration. This allows for direct cross-price effects
among the products belonging to different groups. Their model assumes, however,
that while allocating expenditures among different sources of the same good,
consumers do not distinguish among sources of other goods.
Following Yang and Koo, the Source Differentiated AIDS (SDAIDS) model is specified
as:
∑ ∑ ( )
όπου (1)
where subscripts i and j indicate goods (i,j=1,2,….,N) and h and k indicate countries of
origin of sources. Good I may imported from m different origins, while good j may
have n origins (where i≠j , h=1,….,m) and k=1,…,n). wih measures the budget share of
good I imported from source h (product ih), pjk is the price of good j imported from
source k (product jk). E is the total expenditure on all goods in this demand system
and P* is the price index defined as:
∑ ∑
∑ ∑ ∑ ∑
(2)
The model in equation (1) is nonlinear as a result of nonlinear price index in equation
(2). To make the system linear, as Deaton and Muellbauer suggest, we substitute the
nonlinear price index with the linear one specified by Stone as:
∑ ∑ . In order to avoid the simultaneous equation bias since wih is
used as dependent variable in equation (1) is employed as an independent variable
in the Stone’s price index, we employed a lagged wih in the Stone’s price index as
proposed by Eales and Unnevehr (1988).
Model’s specification (1) allows for different responses on the part of an importing
country to different goods and origins. Nevertheless, the SDAIDS may suffer from a
degree of freedom problem in empirical specification depending on the number of
5
goods and origins as it was mentioned before. To avoid this, Yank and Koo in order
to reduce the number of parameters, they introduced the assumption of block
substitutability where which indicates that cross-price
effects on different sources in goof j on the demand for origin h in good i are the
same for all the goods from different sources in good j. For example, block
substitutability says that the Greek demand for German beef shows the same cross-
price response as pork meat from Denmark or pork meat from Netherlands. Hence,
this assumption transformed the proposed SDAIDS model in (1) as:
∑ ∑ ( )
(3)
where ( ) ∑ . This restricted version of SDAIDS (RSDAIDS) has
m+(n-1)+2 parameters to be estimated in each equation whereas the SDAIDS model
has mn+2 coefficients in each equation if all goods have the same number of import
origins(Yang and Koo, 1994).
The basic demand restrictions for import behavior are expressed in terms of the coefficients of the RSDAIDS model as:
Adding up ∑ ∑ ; ∑ ; ∑ ∑ ; ∑ ∑ ; (4.1)
Homogeneity ∑ ∑ ; and (4.2)
Symmetry . (4.3)
Because of Block substitutability, symmetry restriction cannot be applied among
goods but only within group goods.
Marshallian measures of price elasticities are computed from the estimated
parameters as:
(5.1)
(5.2)
(5.3)
Equation (5.1) represents own-price elasticities, equation (5.2) represents cross-price
elasticities between the same goods from different sources and equation (5.3)
represents cross-price elasticites between different goods. Expenditure elasticity is
specified as:
(6.)
It should be noted that these elasticities are derived by assuming
⁄
(Chalfant, 1987). Also, since the model is highly disaggregated and expenditure
shares are small, the compensated elasticities are approximately equal to
uncompensated elasticities (Green and Alston, 1990)
6
Data, estimation and empirical results
Data Description
Quarterly data for 1995 to 2012 was employed for this study. Greek’s meat imports
are grouped into five goods: beef, sheep, pork, poultry and other meats. Import
quantities and values were taken from EUROSTAT data base, International Trade,
Standard International Trade Classification. Imported quantity is reported in 100Kg
and values in Euros. Imported prices for individual meats by origin are not publicly
available. Hence, as a proxy for imported price was employed the unit value
obtained by dividing the value by the quantity was used. However, the unit price is
not what consumers actually pay. According to Yang and Koo (1994), it is difficult if
not impossible to construct a data set with imported values and domestic prices.
This is especially so when the marketing channels are different between import and
domestic goods. Thus, this study assumes separability between domestic and import
meats.
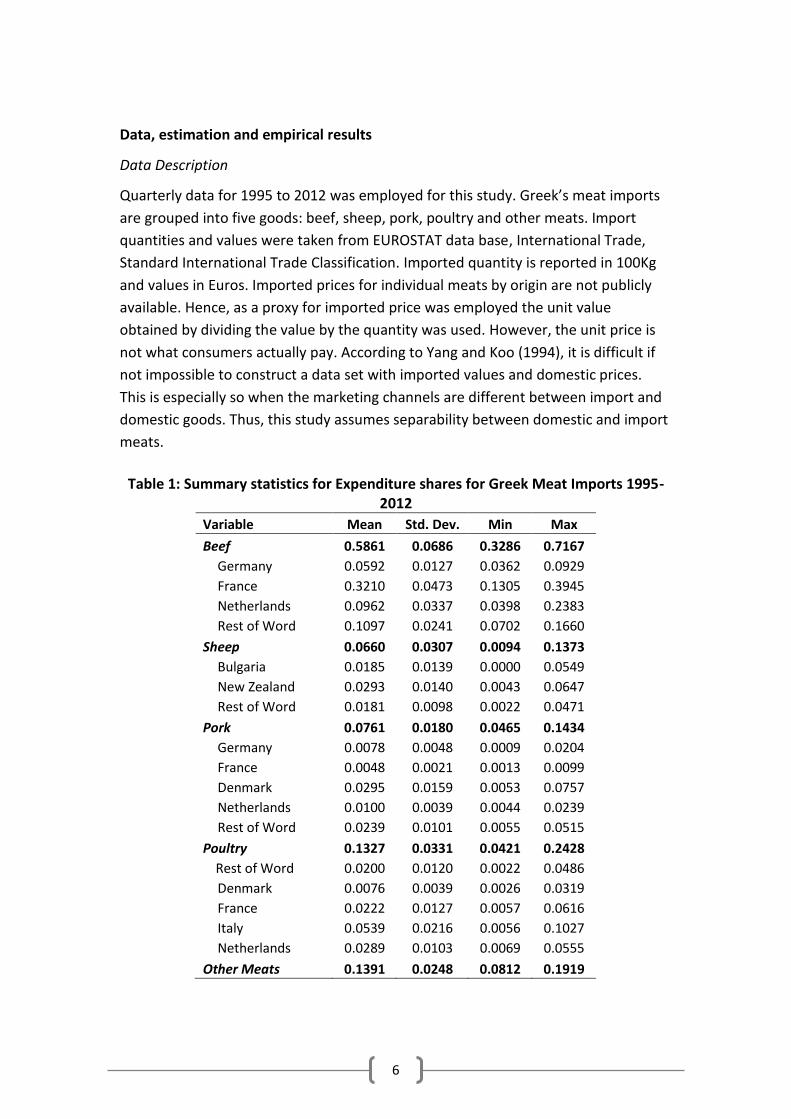
Table 1: Summary statistics for Expenditure shares for Greek Meat Imports 1995-
2012
Variable Mean Std. Dev. Min Max
Beef 0.5861 0.0686 0.3286 0.7167
Germany 0.0592 0.0127 0.0362 0.0929
France 0.3210 0.0473 0.1305 0.3945
Netherlands 0.0962 0.0337 0.0398 0.2383
Rest of Word 0.1097 0.0241 0.0702 0.1660
Sheep 0.0660 0.0307 0.0094 0.1373
Bulgaria 0.0185 0.0139 0.0000 0.0549
New Zealand 0.0293 0.0140 0.0043 0.0647
Rest of Word 0.0181 0.0098 0.0022 0.0471
Pork 0.0761 0.0180 0.0465 0.1434
Germany 0.0078 0.0048 0.0009 0.0204
France 0.0048 0.0021 0.0013 0.0099
Denmark 0.0295 0.0159 0.0053 0.0757
Netherlands 0.0100 0.0039 0.0044 0.0239
Rest of Word 0.0239 0.0101 0.0055 0.0515
Poultry 0.1327 0.0331 0.0421 0.2428
Rest of Word 0.0200 0.0120 0.0022 0.0486
Denmark 0.0076 0.0039 0.0026 0.0319
France 0.0222 0.0127 0.0057 0.0616
Italy 0.0539 0.0216 0.0056 0.1027
Netherlands 0.0289 0.0103 0.0069 0.0555
Other Meats 0.1391 0.0248 0.0812 0.1919
7
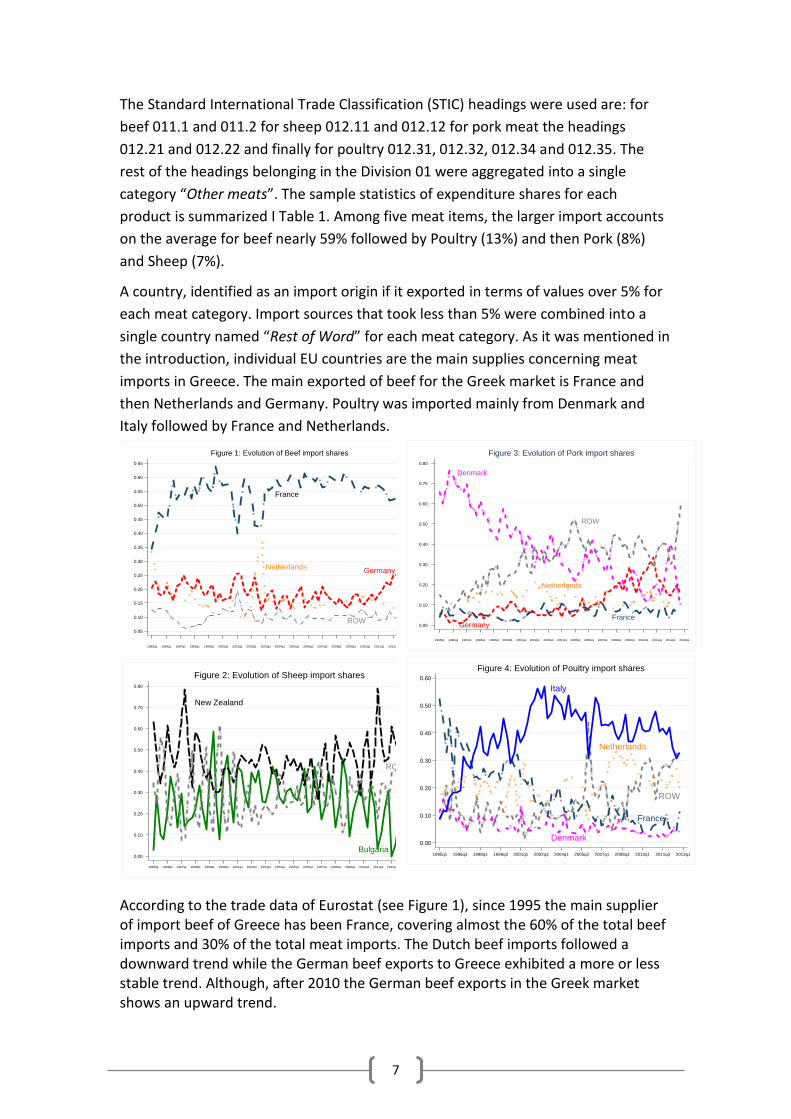
The Standard International Trade Classification (STIC) headings were used are: for
beef 011.1 and 011.2 for sheep 012.11 and 012.12 for pork meat the headings
012.21 and 012.22 and finally for poultry 012.31, 012.32, 012.34 and 012.35. The
rest of the headings belonging in the Division 01 were aggregated into a single
category “Other meats”. The sample statistics of expenditure shares for each
product is summarized I Table 1. Among five meat items, the larger import accounts
on the average for beef nearly 59% followed by Poultry (13%) and then Pork (8%)
and Sheep (7%).
A country, identified as an import origin if it exported in terms of values over 5% for
each meat category. Import sources that took less than 5% were combined into a
single country named “Rest of Word” for each meat category. As it was mentioned in
the introduction, individual EU countries are the main supplies concerning meat
imports in Greece. The main exported of beef for the Greek market is France and
then Netherlands and Germany. Poultry was imported mainly from Denmark and
Italy followed by France and Netherlands.
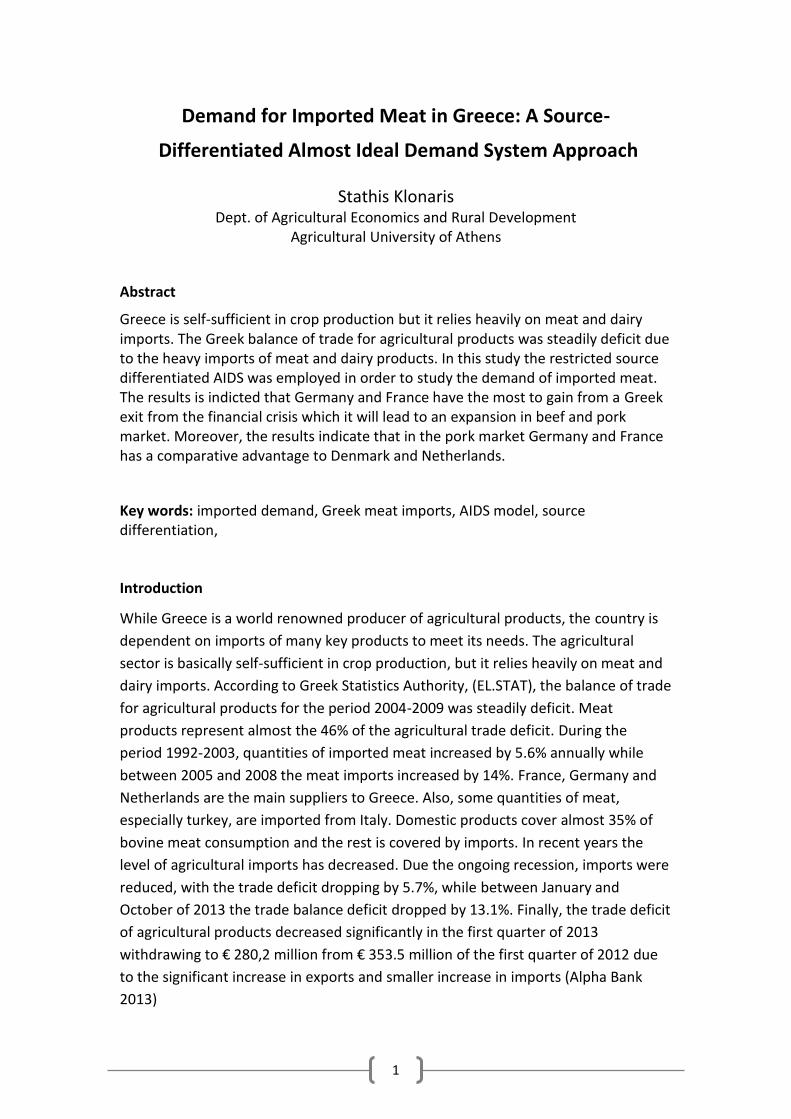
According to the trade data of Eurostat (see Figure 1), since 1995 the main supplier of import beef of Greece has been France, covering almost the 60% of the total beef imports and 30% of the total meat imports. The Dutch beef imports followed a downward trend while the German beef exports to Greece exhibited a more or less stable trend. Although, after 2010 the German beef exports in the Greek market shows an upward trend.
France
NetherlandsGermany
ROW
0.05
0.10
0.15
0.20
0.25
0.30
0.35
0.40
0.45
0.50
0.55
0.60
0.65
1995q1 1996q1 1997q1 1998q1 1999q1 2000q1 2001q1 2002q1 2003q1 2004q1 2005q1 2006q1 2007q1 2008q1 2009q1 2010q1 2011q1 2012q1 2013q1
Figure 1: Evolution of Beef import shares
New Zealand
Bulgaria
ROW
0.00
0.10
0.20
0.30
0.40
0.50
0.60
0.70
0.80
1995q1 1996q1 1997q1 1998q1 1999q1 2000q1 2001q1 2002q1 2003q1 2004q1 2005q1 2006q1 2007q1 2008q1 2009q1 2010q1 2011q1 2012q1 2013q1
Figure 2: Evolution of Sheep import shares
Denmark
ROW
Netherlands
GermanyFrance
0.00
0.10
0.20
0.30
0.40
0.50
0.60
0.70
0.80
1995q1 1996q1 1997q1 1998q1 1999q1 2000q1 2001q1 2002q1 2003q1 2004q1 2005q1 2006q1 2007q1 2008q1 2009q1 2010q1 2011q1 2012q1 2013q1
Figure 3: Evolution of Pork import shares
Italy
ROW
Netherlands
Denmark
France
0.00
0.10
0.20
0.30
0.40
0.50
0.60
1995q1 1996q3 1998q1 1999q3 2001q1 2002q3 2004q1 2005q3 2007q1 2008q3 2010q1 2011q3 2013q1
Figure 4: Evolution of Poultry import shares
8
Imports of sheep meat represent a negligible part of total meat imports since Greece has a self-sufficiency of 85%. However, these imports mainly cover the high demand for sheep meat in the spring season due to Greek orthodox Easter. The main supplies for sheep meat are traditionally New Zealand and Bulgaria because of the proximity with the Greek market. Due to a Foot Mouth Disease (FMD) outbreak in Bulgaria (EU, 2011), the sheep imports after 2006 followed a downward trend.
Remarkable is the downward trend that followed the Danish pork exports in Greece (Figure 3), which were substituted by imports from others countries and since 2004 from pork meat from Germany. The upward trend that exhibits the Italian poultry exports to Greece (see Figure 4) is mainly due to turkey exports which substitute other meat products (mainly ham and bacon) for the sake of a more healthy diet.
Estimation Procedure
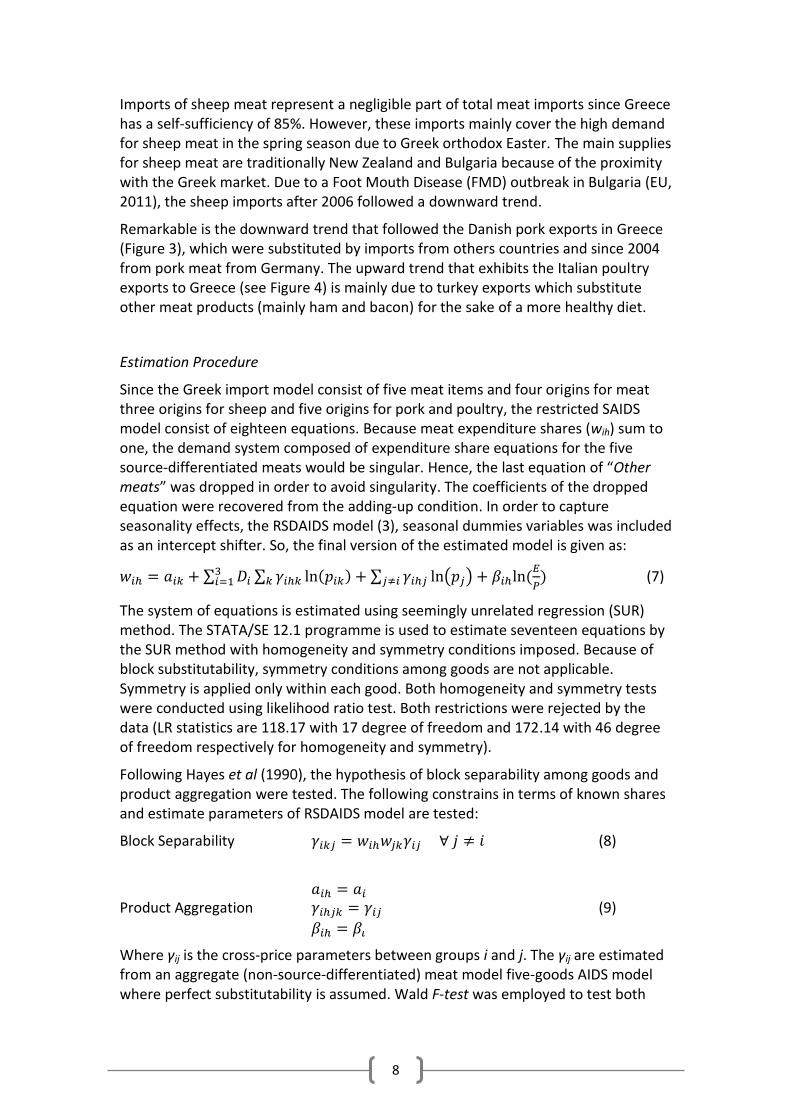
Since the Greek import model consist of five meat items and four origins for meat three origins for sheep and five origins for pork and poultry, the restricted SAIDS model consist of eighteen equations. Because meat expenditure shares (wih) sum to one, the demand system composed of expenditure share equations for the five source-differentiated meats would be singular. Hence, the last equation of “Other meats” was dropped in order to avoid singularity. The coefficients of the dropped equation were recovered from the adding-up condition. In order to capture seasonality effects, the RSDAIDS model (3), seasonal dummies variables was included as an intercept shifter. So, the final version of the estimated model is given as:
∑ ∑ ∑ ( )
(7)
The system of equations is estimated using seemingly unrelated regression (SUR) method. The STATA/SE 12.1 programme is used to estimate seventeen equations by the SUR method with homogeneity and symmetry conditions imposed. Because of block substitutability, symmetry conditions among goods are not applicable. Symmetry is applied only within each good. Both homogeneity and symmetry tests were conducted using likelihood ratio test. Both restrictions were rejected by the data (LR statistics are 118.17 with 17 degree of freedom and 172.14 with 46 degree of freedom respectively for homogeneity and symmetry).
Following Hayes et al (1990), the hypothesis of block separability among goods and product aggregation were tested. The following constrains in terms of known shares and estimate parameters of RSDAIDS model are tested:
Block Separability (8)
Product Aggregation (9)
Where γij is the cross-price parameters between groups i and j. The γij are estimated from an aggregate (non-source-differentiated) meat model five-goods AIDS model where perfect substitutability is assumed. Wald F-test was employed to test both
9
hypotheses. These tests were conducted by imposing the restrictions in (8) and (9) on the RSDAIDS model.
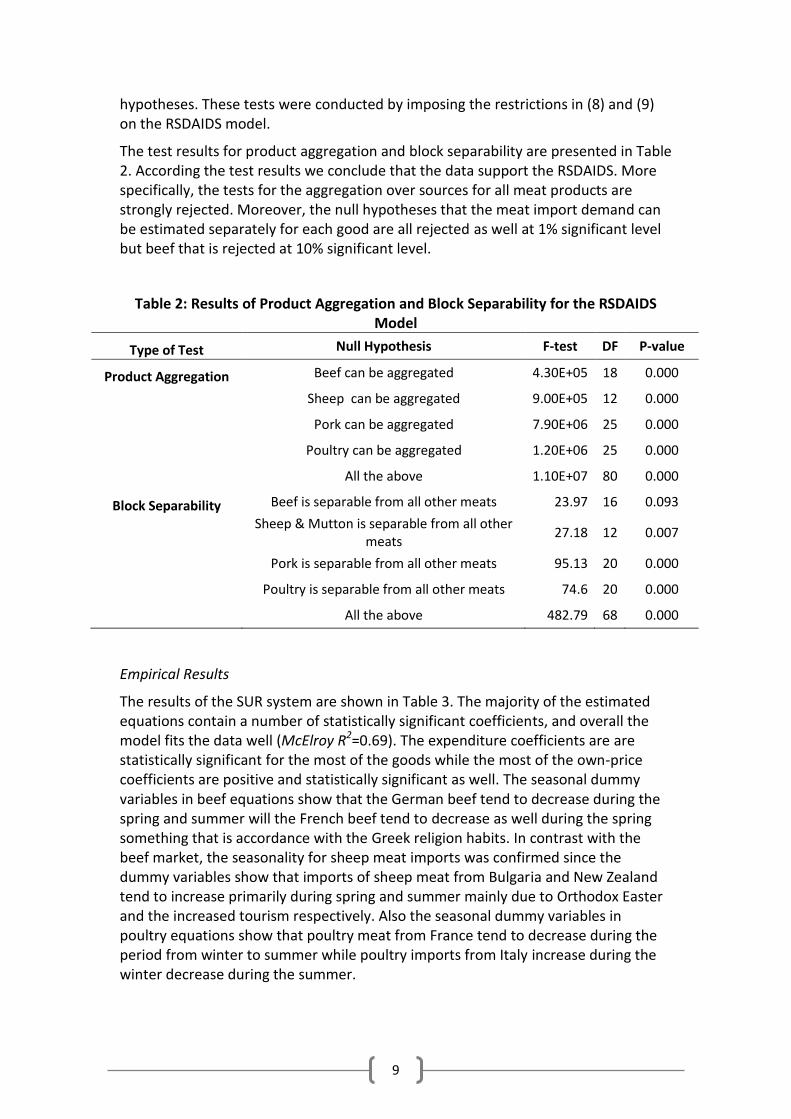
The test results for product aggregation and block separability are presented in Table 2. According the test results we conclude that the data support the RSDAIDS. More specifically, the tests for the aggregation over sources for all meat products are strongly rejected. Moreover, the null hypotheses that the meat import demand can be estimated separately for each good are all rejected as well at 1% significant level but beef that is rejected at 10% significant level.
Table 2: Results of Product Aggregation and Block Separability for the RSDAIDS Model
Type of Test Null Hypothesis F-test DF P-value
Product Aggregation Beef can be aggregated 4.30E+05 18 0.000
Sheep can be aggregated 9.00E+05 12 0.000
Pork can be aggregated 7.90E+06 25 0.000
Poultry can be aggregated 1.20E+06 25 0.000
All the above 1.10E+07 80 0.000
Block Separability Beef is separable from all other meats 23.97 16 0.093
Sheep & Mutton is separable from all other
meats 27.18 12 0.007
Pork is separable from all other meats 95.13 20 0.000
Poultry is separable from all other meats 74.6 20 0.000
All the above 482.79 68 0.000
Empirical Results
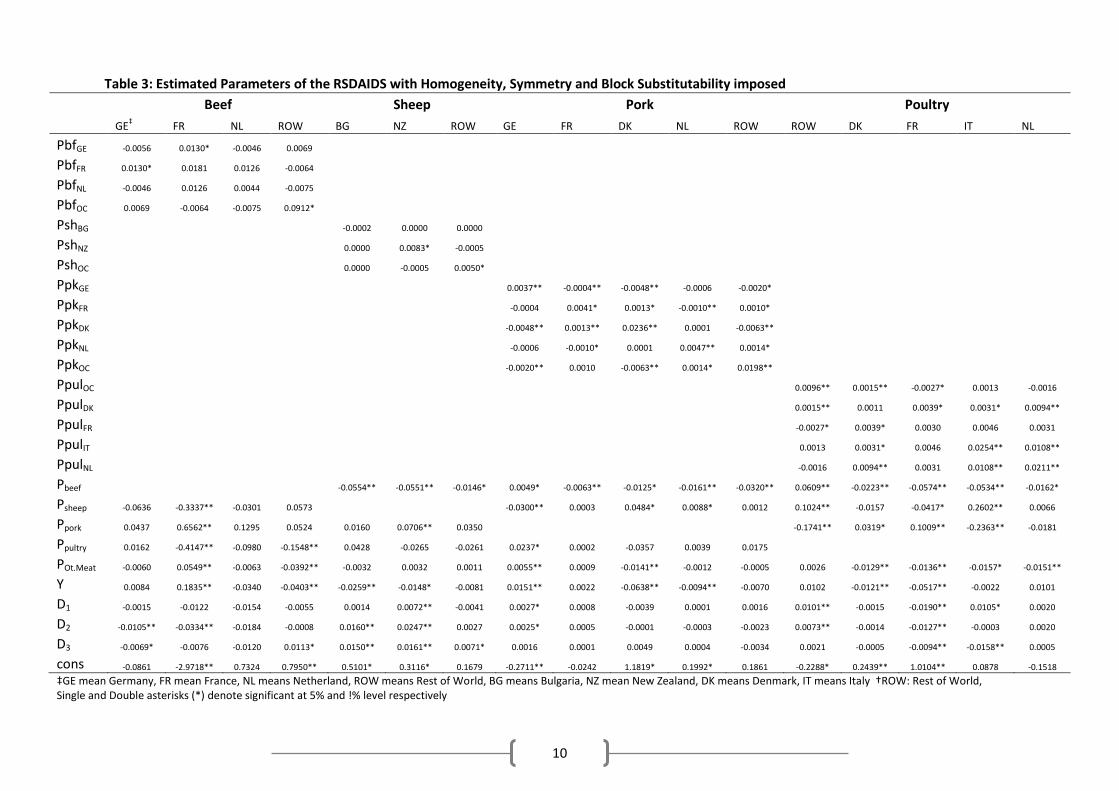
The results of the SUR system are shown in Table 3. The majority of the estimated equations contain a number of statistically significant coefficients, and overall the model fits the data well (McElroy R2=0.69). The expenditure coefficients are are statistically significant for the most of the goods while the most of the own-price coefficients are positive and statistically significant as well. The seasonal dummy variables in beef equations show that the German beef tend to decrease during the spring and summer will the French beef tend to decrease as well during the spring something that is accordance with the Greek religion habits. In contrast with the beef market, the seasonality for sheep meat imports was confirmed since the dummy variables show that imports of sheep meat from Bulgaria and New Zealand tend to increase primarily during spring and summer mainly due to Orthodox Easter and the increased tourism respectively. Also the seasonal dummy variables in poultry equations show that poultry meat from France tend to decrease during the period from winter to summer while poultry imports from Italy increase during the winter decrease during the summer.
10
Table 3: Estimated Parameters of the RSDAIDS with Homogeneity, Symmetry and Block Substitutability imposed
Beef Sheep Pork Poultry
GE
‡ FR NL ROW BG NZ ROW GE FR DK NL ROW ROW DK FR IT NL
PbfGE -0.0056 0.0130* -0.0046 0.0069 PbfFR 0.0130* 0.0181 0.0126 -0.0064 PbfNL -0.0046 0.0126 0.0044 -0.0075 PbfOC 0.0069 -0.0064 -0.0075 0.0912* PshBG
-0.0002 0.0000 0.0000
PshNZ
0.0000 0.0083* -0.0005 PshOC
0.0000 -0.0005 0.0050*
PpkGE
0.0037** -0.0004** -0.0048** -0.0006 -0.0020* PpkFR
-0.0004 0.0041* 0.0013* -0.0010** 0.0010*
PpkDK
-0.0048** 0.0013** 0.0236** 0.0001 -0.0063** PpkNL
-0.0006 -0.0010* 0.0001 0.0047** 0.0014*
PpkOC
-0.0020** 0.0010 -0.0063** 0.0014* 0.0198** PpulOC
0.0096** 0.0015** -0.0027* 0.0013 -0.0016
PpulDK
0.0015** 0.0011 0.0039* 0.0031* 0.0094**
PpulFR
-0.0027* 0.0039* 0.0030 0.0046 0.0031
PpulIT
0.0013 0.0031* 0.0046 0.0254** 0.0108**
PpulNL
-0.0016 0.0094** 0.0031 0.0108** 0.0211**
Pbeef
-0.0554** -0.0551** -0.0146* 0.0049* -0.0063** -0.0125* -0.0161** -0.0320** 0.0609** -0.0223** -0.0574** -0.0534** -0.0162*
Psheep -0.0636 -0.3337** -0.0301 0.0573
-0.0300** 0.0003 0.0484* 0.0088* 0.0012 0.1024** -0.0157 -0.0417* 0.2602** 0.0066
Ppork 0.0437 0.6562** 0.1295 0.0524 0.0160 0.0706** 0.0350
-0.1741** 0.0319* 0.1009** -0.2363** -0.0181
Ppultry 0.0162 -0.4147** -0.0980 -0.1548** 0.0428 -0.0265 -0.0261 0.0237* 0.0002 -0.0357 0.0039 0.0175 POt.Meat -0.0060 0.0549** -0.0063 -0.0392** -0.0032 0.0032 0.0011 0.0055** 0.0009 -0.0141** -0.0012 -0.0005 0.0026 -0.0129** -0.0136** -0.0157* -0.0151**
Y 0.0084 0.1835** -0.0340 -0.0403** -0.0259** -0.0148* -0.0081 0.0151** 0.0022 -0.0638** -0.0094** -0.0070 0.0102 -0.0121** -0.0517** -0.0022 0.0101
D1 -0.0015 -0.0122 -0.0154 -0.0055 0.0014 0.0072** -0.0041 0.0027* 0.0008 -0.0039 0.0001 0.0016 0.0101** -0.0015 -0.0190** 0.0105* 0.0020
D2 -0.0105** -0.0334** -0.0184 -0.0008 0.0160** 0.0247** 0.0027 0.0025* 0.0005 -0.0001 -0.0003 -0.0023 0.0073** -0.0014 -0.0127** -0.0003 0.0020
D3 -0.0069* -0.0076 -0.0120 0.0113* 0.0150** 0.0161** 0.0071* 0.0016 0.0001 0.0049 0.0004 -0.0034 0.0021 -0.0005 -0.0094** -0.0158** 0.0005
cons -0.0861 -2.9718** 0.7324 0.7950** 0.5101* 0.3116* 0.1679 -0.2711** -0.0242 1.1819* 0.1992* 0.1861 -0.2288* 0.2439** 1.0104** 0.0878 -0.1518
‡GE mean Germany, FR mean France, NL means Netherland, ROW means Rest of World, BG means Bulgaria, NZ mean New Zealand, DK means Denmark, IT means Italy †ROW: Rest of World, Single and Double asterisks (*) denote significant at 5% and !% level respectively
11
Table 4: Marshallian Elasticities for of Greek Meat Import Demand using Restricted Source Differentiated AIDS (Columns are prices)
Beef Sheep Pork Poultry
Price GE‡ FR NL. ROW BG NZ ROW GE FR DK NL. ROW ROW DK FR IT NL.s
Beef
Germany -1.103** 0.174 -0.091 0.101
France 0.007 -1.127** -0.016 -0.083*
Netherlands
-0.027 0.165 -0.920** -0.039
ROW† 0.084 0.060 -0.033 -0.128
Sheep
Bulgaria
-0.986** 0.044 0.026
New Zealand
0.011 -0.702** -0.007
ROW
0.009 -0.012 -0.717**
Pork
Germany
-0.540** -0.057 -0.670** -0.096 -0.300**
France
-0.081 -0.164** 0.254* -0.221** 0.190*
Denmark
-0.145** 0.054** -0.135 0.024 -0.163**
Netherlands
-0.053 -0.100** 0.036 -0.520** 0.157*
ROW
-0.080* 0.042* -0.256** 0.059* -0.165*
Poultry
ROW
-0.529** 0.072* -0.149* 0.039 -0.095
Denmark
0.229** -0.83**9 0.522* 0.489* 1.279**
France
-0.077 0.194* -0.814** 0.258 0.206
Italy
0.025 0.058 0.086 -0.527** 0.201**
Netherlands
-0.063 0.324** 0.099 0.355** -0.279*
Beef
-2.144** -1.571** -0.532 -0.556 -1.569** 0.901** -1.029** -1.160** 2.728** -1.946** -1.161** -0.964** -0.774**
Sheep -1.084* -1.076** -0.291 0.546
-3.969** 0.024 1.779** 0.937* 0.070 5.079** -1.956 -1.735 4.827** 0.205
Pork 0.729 2.002** 1.371 0.504 0.969 2.442** 1.963
-8.725** 4.283 4.725** -4.378** -0.652
Poultry 0.257 -1.358** -0.977 -1.369** 2.477 -0.846 -1.387 2.807* -0.003 -0.960 0.501 0.764
Other Meats -0.121 0.092* -0.016 -0.306** 0.023 0.180 0.123 0.432* 0.122 -0.175 0.016 0.019 0.058 -1.470** -0.290 -0.286* -0.571**
Expenditure 1.141** 1.572** 0.646* 0.633** -0.399 0.497* 0.556 2.936** 1.445** -1.165** 0.061 0.709** 1.511** -0.582 -1.331** 0.959** 1.349**
‡GE mean Germany, FR mean France, NL means Netherland, ROW means Rest of World, BG means Bulgaria, NZ mean New Zealand, DK means Denmark, IT means Italy †ROW: Rest of World, Single and Double asterisks (*) denote significant at 5% and !% level respectively
12
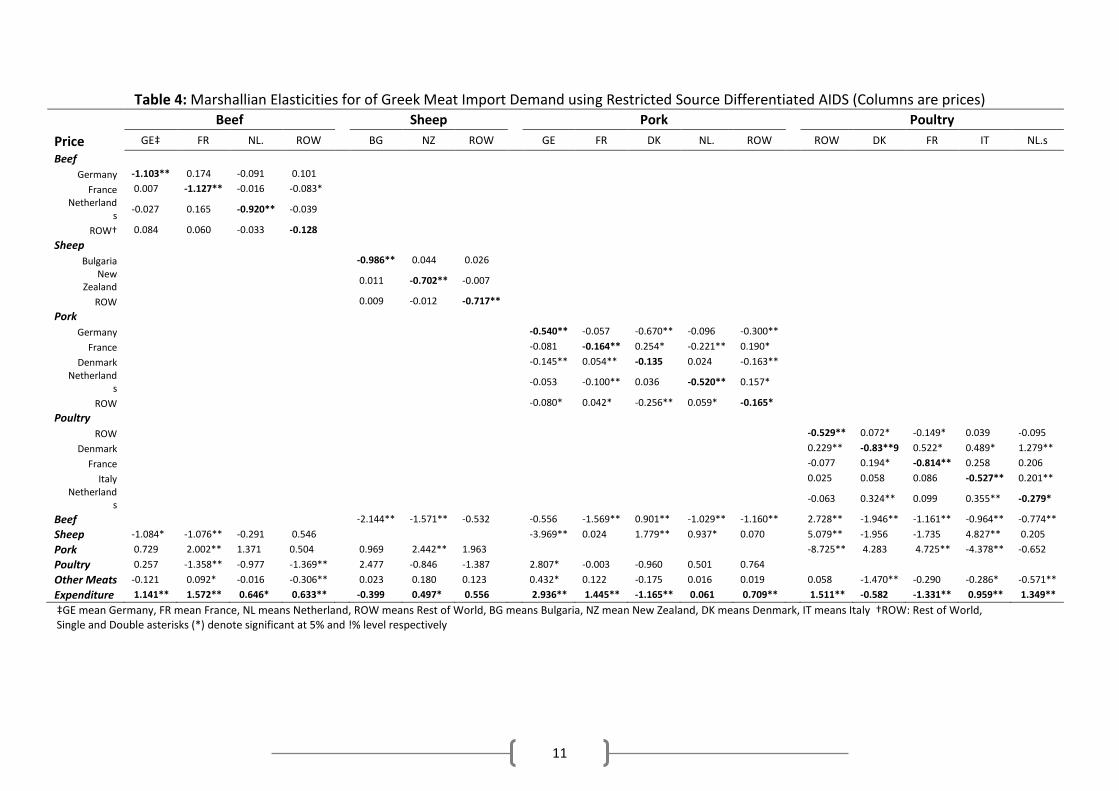
Table 4 presents the uncompensated elasticities. Prior to further interpreting the elasticity estimates, the methodological framework that typically underlies demand system should be brought to attention. In analyzing demand systems, the consumer is assumed to follow a multi-stage approach in allocating his income (expenditure). In the first stage, the consumer (in our case Greece) allocates expenditure among different food categories, assumed to be separable with each other. In a second stage, expenditure allocated to each food category, is further allocated among the goods making up the food category, within each food category, goods are no longer separable with each other. First the country allocates the total expenditure for imports among primary groups such as fruits and vegetable, fish, meats, dairy products etc. In this stage meat is one composite good among other composite goods, within some primary group, say food imports. Next, the country allocates the given expenditure for meat within a second-level group made-up from the seventeen goods, considered in this study. Hence, the price and expenditure elasticities estimated here must be interpreted as conditional on the consumer expenditure allocated to the examined group of meat, as a whole. Also, price elasticities are calculated with regard to budget shares and not with respect to quantities. This implies that an increase in import price may lead to a decrease in budget share. In the beef market all expenditure elasticities are positive and statistically significant.
Beef from France shows the highest expenditure elasticitiy (1.57) because of its perceived superior quality. Also, among the imported beef products, the demand for German beef is more expenditure elastic (1.14) compared with the demand for Dutch beef (0.65) and beef from the Rest of World (0.63), implying a higher percentage of beef would be imported from Germany compared to Netherland and various countries, given an increase in the size of the meat market in Greece after the end of the debt crisis that hit Greece.
With regard to sheep expenditure elasticities, only the elasticity for New Zealand is statistically significant and below unity (0.49) which reflects the long-run strong preferences of Greek consumers for lamp from New Zealand.
As far the pork market is concerned, all the expenditure elasticities are statistically significant. The values of German and French pork imports (2.93 and 1.44 respectively) are positive and highest than those of Dutch imports pork from rest of World (0.06 and 0.71 respectively). In contrast, the expenditure elasticity for Denmark pork imports is negative and statistically significant (-1.16) implying that reporting the Denmark pork as inferior good implying that given an increase in pork market pork from Denmark will lead to a fall of demand and may lead to changes to more luxurious substitutes such as pork from Germany or France.
Finally, concerning poultry market, all the elasticities are statistically significant but French poultry imports. The high value of expenditure elasticity of Dutch poultry imports (1.34) imply that in a given increase of poultry market, higher percentage of imports from Netherlands will be imported to Greece compared to Italy where the expenditure elasticity is below the unity (0.95). Also, the negative expenditure elasticity for French poultry reports this product as inferior good.
13
Consistent with what is expected from economic theory, the results of this study show negative source-differentiated own price elasticities for all individual meats and statistically significant (except for the beef imports for the ROW and pork imports from Denmark. All the own price elasticities are lower than one indicating inelastic demand, except beef from Germany and France where in both sources the own-price elasticity is greater than one (1.10 and 1.12 respectively).
Cross price elasticities may indicate substitutability or complementary relationships among products from various sources. The non-significance cross-price elasticities between sources differentiated imported beef and sheep imply no significant impact on imported beef and sheep consumption as a result of imported beef or pork price changes. Regarding the pork market, the statistically significant and positive cross-price elasticities shows that pork from France is substitute for Danish and ROW pork. This competition is consistent since France and Denmark borh produce pork of similar quality. Also, statistically significant substitutability relationship is found between Dutch pork and pork from ROW. However, a statistically significant complementary relationship is found between the German and Danish pork on one hand and the German and ROW pork on the other. Similar, complementary relationship is found between Dutch and French pork and between Dutch and ROW pork. In all the cases the lack of competitiveness might be due to different pork products and cuts of meat are imported in the Greek market from the above mentioned sources. In the poultry market, the competition is strong between Denmark and ROW while weak substitutability is shown between, Denmark and France in one hand and between Denmark and Netherlands in the other. Also, weak substitutability is shown between Italy and Netherlands.
Among other cross-commodity relationships, German pork shows strong substitutability with poultry as well as, between Italian and French poultry with pork. Strong complementary relationships are shown between French and Danish pork with beef and between Danish poultry and beef.
Summary and Conclusions
This study estimates the impact of prices and expenditures on the Greek demand of source differentiated meats using the restricted source differentiated almost ideal demand system and assuming block substitutability. Tests of two hypotheses regarding the behavior of Greek meat consumers were contacted: (a) separability of meat categories from one another (beef, sheep, pork, poultry and other meats), (b) non-source differentiation (product aggregation) of individual meats.
Results of separability tests indicate that the various studied meats are not separable from one another. Additionally, non-source differentiation was resected, and therefore meats from various sources were treated as different products and demand estimation was conducted for these disaggregated products.
Results of this study shed light on Greek consumer preferences with regard to imported meats. This is the first study that analyzes the Greek meat demand differentiated by source. The calculated expenditure elasticities indicate that Germany and France have the most gain from an increase in the size of the imported
14
meat market in terms of their beef and pork exports. Hence, a quick exit of Greece from the financial crisis that has overwhelmed the last five years will work partly for the benefit of foreign trade of Germany and France.
For pork, estimation results shown that Germany and France have a competitive advantage compared with the rest sources (Denmark, Netherlands and ROW). This is determined by the German’s and France’s relatively low own-price elasticity and high expenditure elasticity. Compared with e rest three sources and considering the future growth in Greek consumer’s per capita incomes. Therefore, the growing per capita incomes in Greece are expected to expand the marketing potentials for German and French pork exporters.

15
References
Alpha Bank “Input-Output Prices and Trade of Agricultural Products” Weekly Economic Reports 18-07-2013 Dept. of Economic Studies (2013), 7-8
Alston, J., C. Carter, R. Green and D., Pick “Whither Armington Trade Model?” American Journal of Agricultural Economics, 72, (1990):455-67
Badula,R. “An Armington Model for US Cotton Exports”, Journal of Agricultural Economic Research, 39(4), (1969):12-22
Chalfant, J. “A Globally Flexible Almost Ideal Demand System”, Journal of Business and Economic. Statistics, 5, (1987):233-42
Green, R. and J.M. Alston “Elasticities in AIDS model”, American Journal of Agricultural Economics, 72, (1990): 442-45
Deaton A. and J. Muellbauer, “An Almost Ideal Demand System”, American Economic Review, 70, (1980):312-26
de Gorter, H. and Meilke, K., 1987. The EEC's wheat price policies and international trade in differentiated products. American Journal of Agrecultural Economics, 69: (1987), 223-229.
Duffy, P., Wohlgenant, M. K. and Richardson, J. W. “The Elasticity of Export Demand for U.S. Cotton” American Journal of Agricultural. Economics., 72 (2), (1990):468-474
Eales, J., and L.A. Unnevehr “Demand for Beef and Chicken Products: Separability and Structural Change” American Journal of Agricultural Economics 70, (1988) 1025-36
European Commission, DG Health and Consumers “ Information on the foot and mouth disease outbreak in Bulgaria in 2011” http://ec.europa.eu/food/animal/diseases/controlmeasures/fmd_bg_en.htm (August 2014)
Hamori S., Yin F. “Estimating the import demand function in the autoregressive distributed lag framework: the case of China”, Economics bulletin, 31, 2, (2011):1576-1591
Hayes, D., T., Wahl and G. Williams “Testing restrictions on a Model of Japanese Meat Demand”, American Journal of Agricultural Economics, 72 (1990): 556-66
E., Huan-Niemi, L., Kerkela, H., Lehtonen and J. Niemi “Implications of Trade Liberalization and Domestic Reforms on EU Agricultural Markets”
16
International Food and Agribusiness Management Review, 12, 4, (2009):29-82
C., J. Pantzios and P., Fousekis “A differential approach in analyzing meat import demand in Greece”, Medit 9-3, (1998):20-25
C., J. Pantzios and P., Fousekis “An Empirical Demand Analysis of the Greek Meat and Dairy Imports by using Alternative Differential Demand Systems”, RISEC, 46-1, (1999):191-207
Penson, J.R. R. Babula “Japanese Monetary Policies and U.S. Agricultural Exports”, Journal of Agricultural Economic Research, 40(1), , (1988):11-18
Winters, L. “Separability and the Specification of Foreign Trade Functions”, Journal of International Economics, 17, (1984):239-63
Yang, S.R., and W.W. Koo, “Japanese Meat Import Demand Elasticities with the Source Differentiated AIDS Model” Journal of Agricultural Resource Economics, 19, (1994), 396-408


![Competitive Industry Report on the Philippines Market for Imported Meat and Poultry [2010]](https://img.dokumen.tips/doc/110x75/563db9e8550346aa9aa0fbab/competitive-industry-report-on-the-philippines-market-for-imported-meat-and.jpg)