Embed Size (px)
Citation preview

Applied Geography (1984), 4, 267-281
Delineating regions for transit assistance allocation: a geographical approach
Eliahu Stern
Department of Geography, Ben-G&on University of the Negev, Beer Sheva 84105. Israel
Abstract Governmental assistance to transport operators, which is increasing simul- taneously with a decrease in patronage, is aimed at ensuring a regular service to all populated areas regardless of economic rationale. A purely geographical approach has been proposed to define priority transport subsidy allocation regions. A priority allocation index based on fundamental principles such as rank-size distribution, gravitation, and spatial equity has been used as a national experiment in Israel. This involves cluster analysis to generate several alternative allocation regions from which planners may select an appropriate policy. This paper reviews the experiment and discusses the implications of the results for allocation of transport subsidies.
Introduction
The decrease in the relative demand for public transport services due to increased usage of private cars has resulted, in many countries, in a recognition of the need for both urban and rural transport to be seen more as a social commodity than as a pure commercial service (McGillivary 1979; Bly et al. 1980a). Thus, the proportion of total operating cost provided to transit operators by local and national governments is increasing both in absolute and relative terms (Bly et al. 1980b). A common aim of this assistance in many countries is the provision of regular services to the maximum possible area. This social aim is particularly characteristic of the transit sector in Israel in which the 1980 inter- and intraregional transport services included 380 scheduled bus lines constituting 76 per cent of the total 499 scheduled lines operated in the country. Although in most countries long-distance, inter-regional, services stand a better chance of being profitable due to lower unit operating costs, in Israel the metropolitan services are the most profitable (see Table 1). This is explained by the strong competition in the inter-urban transport sector, most noticeably by service taxis. In principle, cabs and service taxis should be used to achieve economic efficiency mainly in markets where travel demand is very sparse and bus operation too costly; however, the monopolistic profits of the bus companies in inter-urban markets attract taxis from the areas where economically their services are most needed.
Governmental assistance to the public transport sector in Israel is primarily aimed at ensuring a regular service to all populated areas regardless of economic rationale. Subsidies are given to the operators on the basis of an agreed basket of inputs, and a constant level of ‘recognized’ expenditures. The difference between total ‘recognized’ revenue and total ‘recognized’ expenditures determines the current subsidy. Above that, the Government adds retroactive subsidy to compensate for the lag between incurring the costs and the payment of the subsidy,
0143-h22X/84/040267-15 $03.00 0 1984 Butterworth & Co (Publishers) Ltd

268 Transit assistance allocation in Israel
Table 1. Selected characteristics of the Israeli public transport market, 1980
Service
Number of
routes
Total number of daily
trips Average operating Profitability
cost per km index
Inter-urban 133 1928 38.39 0.80 Metropolitan 119 4699 48.82 0,89 Regional 247 1080 50.93 0.60
Source: Egged ( 1980)
as well as other specific purpose subsidies and capital grants. Due to the relatively low fares (e.g. $0.15 for a typical intra-urban bus trip and about $2.0 for a lOO-km inter-urban bus trip in 1980) and the annual lump-sum type of subsidy, the operators practise an intra-firm cross-subsidy mechanism in order to maintain services in the sparsely populated areas. Nevertheless, the level of transport service in these areas is generally minimal. Table 1 presents selected characteristics of the Israeli public transport market. The sparsely populated areas (including over 70 per cent of the settlements in Israel) are those served by the regional lines. It is clear from Table 1 that the number of routes needed to serve the scattered settlements is the largest, although with the lowest frequency and the highest operating cost per kilometre. As a resuit, the profitability of the regional lines is the lowest.
Upgrading the inter- and intraregional transport service has consequently become one of the main development objectives in Israel’s peripheral areas and a means of contributing to such national goals as security and population dispersion. At the same time, transport planners are attempting to maintain the existing level of transport subsidy. The solution has thus been to ensure an economic service for the operator on the less profitable services (e.g. intraregional or rural lines) without subsidizing the more profitable ones (e.g. major inter-urban and intra-metropolitan lines). However, it has been found practically impossible to allocate governmental subsidy according to service lines since the bus budgeting system is non-line based (Berechman 1980). The essence of the problem is that the bus companies operate simultaneously in a variety of markets defined by trip type, time of day, and geographical location. The operators transfer buses from one geographical area to another when the level of demand shifts over the day, and use the same buses for different purposes, such as special excursion trips, regular intra-urban lines and inter-urban lines. The calculation of operation cost per given bus according to service line is therefore impossible, and consequently the operators provide only yearly aggregate data on input and output variables for the sector as a whole. Thus, available data do not permit differentiation between regular and special bus trips, nor between different inter-urban and intra-urban trips. As an alternative, a regional allocation system has been proposed aimed at converting the existing, monopolistic, radial transport system in the country towards a regionally based system complementing the inter-urban lines.
Criteria for allocation of regional transport subsidies have always been largely political (White 1978; Vickery 1980). In an attempt to develop a more objective approach, the author was contracted by the Israeli ministry of Transport to propose a method for delineating allocation regions and determining their subsidy priorities (Stern 1981). The method adopted involves a purely geographical approach based on the assumption that a higher level of service and greater spatial equity can be achieved by allocating the current subsidy on a regional basis. Accordingly, a

Eliahu Stern 269
simple (in terms of data requirements) and dynamic tool has been developed, making it possible to provide the decision makers with several alternative schemes of allocation regions, which can also serve as a basis for the operation of regional transport systems. This paper outlines the approach, the method, and the results of these efforts, and discusses the implications of the study.
The geographical approach
Criteria for allocating transport subsidies are commonly based on efficiency indicators (Forkenbrock and Dueker 1979; Cervero 1980). The decisions taken, however, derive from intuitive judgements, usually influenced by the specific political system (Quarmby 1977; Webster and Bly 1980). A more objective, geographical approach can be proposed, however, in which the spatial population structure is considered as the only factor guiding the allocation of transport subsidy. Accordingly, regional priorities should be determined from (1) the location of the individual settlement in the transportation system which can be represented by a distance measure; and (2) the settlement’s rank-size order. The former can be assessed by the slope of each node on the national adcessibility surface. This depends on the nodal location in the transport network and indicates the unit increase in nodal accessibility with a unit increase in nodal transport assistance. In practice, this slope indicates nodes where a relatively small increase in transport subsidy will yield a relativeiy high improvement in accessibility.
The second indicator can be measured in terms of the size of the functional hinterland of each settlement (i.e. node). This may be expressed as the relative weight of each node in the national settlement system reflecting the population being subsidized. A relative weight can be applied here to allow for changes, either natural or directed, in the population system. In the case of an absolute weight one should expect an indicator similar to the gravity power affecting each element located on a transportation surface (Marchand 1973).
The proposed procedure for regional delineation is shown in Fig. 1. The procedure involves five main steps: data collection and coding, determination of nodal functional hinterlands, measurement of the slope of nodal access, calculation of transport assistance priorities on a nodal basis, and finally regional clustering and mapping.
The simplicity of this approach means that basic and easily available data are required: nodal population, nodal location, length of the national road segments, and the location of intersections in the road network, These data, when coded, constitute the national settlement and road systems used throughout the analysis as explained in the following sections.
The nodal functional hinterland
As already mentioned, nodal accessibility is measured within the functional hinterland of each settlement. This hinterland is defined as the area within which a given settlement can find all its necessary functions or requirements, such as medical, educational, commercial and other services. It is obvious that a resident of a metropolitan area travels less to reach these opportunities than a resident of a peripheral town or remote rural village. The criterion of giving subsidies to obtain a given accessibility is thus based on the principle of equal opportunities; accordingly, the accessibility of a given node should be measured in relation to all its potential opportunities. However, travel practices are affected by the specific

270 Transit assistance allocation in lsruel
Locetion Of res and interso
CodlllQ SettlellleOtS
Defining nodal
functional htnterland
Nodal population
Measuring
nodal accessibility
COni,tWCtinQ
accesstbitlty surface
J
- Regional ClusterlnQ
* 1
Mawlns Regional allocation and 4 priorities
tabulating 0 Data
Figure 1. General procedure for delineating transit assistance allocation regions.

Eliahu Stern 271
geographic, transportation, or socioeconomic situation, and so vary from one settlement to another (Stern 1979). Therefore, when measuring an opportunity space for a given population, one should consider the need for accessibility rather than the observed travel pattern, and thus measure the accessibility to all potential opportunities rather than only to the actual destinations (Breheny 1978). This approach of compensating spatially disadvantaged populations has also been adopted in efforts to build a model for transport assistance allocation on the intra-urban level (Hedge 1981).
A. Integral approach B. Determlnlrtlc approach
0
*
Orlgh node i
Derthmon node j fClrcle proportbonal to populatkn size)
Destination node c i Potential htractkn
ho-potential line
Boundary of functlonal hkterfand
C. Propored approach
Figure 2. Approaches for defining a functional hinterland.
In reality the principle of equal opportunities implies two ways of defining potential nodal opportunities (or destinations) to which accessibility is to be measured (Fig. 2). The first is a general way by which the accessibility should be measured from each node to all other nodes, known as integral accessibility (Morris et al. 1979). The second is a deterministic approach by which accessibility is measured only to those destinations depicted in the observed travel pattern of each node. The first way obviously includes the measurement of accessibility between nodes which currently have very limited or even no interactions with each other. The second way requires a tremendous amount of data on the travel pattern of each settlement in the country; this is impractical. Moreover, it is very difficult to determine a single destination for each type of activity, for in many cases a given activity (e.g. shopping) has several destinations. To overcome these limitations, the functionai hinterland has been defined by a gravitation principle using nodal population potentials. Accordingly, in calculating the accessibility of a given node,

272 Transit ussistance allncation in Israel
one should consider all the nodes bounded by a selected iso-potential line around it as potential destinations.
Since this approach does not solve the problem of limited or non-existent interaction, the population potential of each node (i) was calculated only with regard to higher-order nodes, thus reflecting a central place interaction system (Berry 1976). Furthermore, since only a system including all the opportunities for access to all nodes will satisfy the equal opportunities principle, the number of destinations for a given node will decrease with the increase in the size of the node. Thus, the provision of an equal opportunity of access to a low-order node requires a greater transport assistance than would be required for a higher-order node.
To attain the requirement of the equal opportunities principle, it is necessary to include the closest highest-order node in the functional hinterland of each settlement. Therefore, the boundary of each hinterland is defined by the minimal iso-potential line which includes the closest highest-order node. Accordingly, the functional hinterland of node i will include all higher-order nodes having a higher potential interaction with i than the interaction between i and the closest highest-order destination. Ah these n nodes, including the closest highest-order one, are considered as destinations in the calculation of i’s accessibility (case C in Fig. 2).
The slope of nodal accessibility
It is well known that nodal accessibility, when defined by travel effort, depends on the nodal topological location and the type and quality of the road system (Taaffe and Gauthier 1973). Transport assistance, however, is not aimed at improving the roads but rather attempts to increase the travel opportunities by public transport, especially in remote areas. Consequently, the accessibility measure should reflect the relative location of each node within its functional hinterland as a function of its topological location. Accessibility (D) is thus simply measured as the average of the distances fd) of node i from all n nodes j included in its functional hinterland:
This measure is used to construct the national accessibility surface using a trend surface analysis with Di and i’s coordinates as the principal dimensions. The accessibility surface is the base for calculating the slope of nodal accessibility.
The slope of each node on the accessibility surface shows the increase in the accessibility of the node for a small improvement in its topological situation, or, alternatively, it indicates the likely effect on nodal accessibility of a small subsidy payment. It is thus an efficiency measure. The slope (S) is calculated_from the accessibility surface polynomial expressing the calculated accessibility D and the partial derivatives of the nodal coordinates (X and Y):
where Sj represents the ‘topographical’ location of each node i on the accessibility surface. The accessibility of a node on a plateau of the fitted accessibility surface will hardly be influenced by transport subsidies, whereas the accessibility of nodes located on steep slopes of this surface will exhibit the greatest improvement with a small subsidy.

Elk&u Stern 273
The priority index for transport assistance
In order to allow updating, a dynamic priority index is needed, incorporating the relative weight of each target population (Pi) in a given period of time (t), From a purely geographical point of view, the priority index (AP) of transit assistance allocation to node i in a given period t is:
(3)
Nodal priority indices are impractical from an operational point of view if the transport line serves more nodes than its departure and destination points. A regional clustering should therefore be practised.
Regional clustering
Regional clustering is aimed at delineating homogeneous regions in terms of transport subsidy priorities. In order to avoid clustering of geographically separate nodes with identical AP, or in contrast, clustering of close places with great differences in AP, a three-dimensional clustering space was needed to introduce both the geographical location (X and Y coordinates) and the priority index. Clustering is thus executed under a contiguity constraint using the taxonomic distance between the Z-scores in a three-dimensional system.
The CLUSTER program (Baxter 1976:2&l-286) was used and regions with minimum within variance and maximum between variance were delineated. The decision maker has, however, the freedom to decide on the desired number of allocation regions or, alternatively, the planner can choose between various regional systems on the grounds of operational standards.
The Israeli case study
Two major data files were prepared to apply the above methodology in Israel. The first included the population and the location of the 862 settlements located outside the three metropolitan areas of the country; the second included the location of the 2196 intersections and the length of the 2314 segments of the national road network. Population potentials were calculated on the basis of actual road distances using a minimum path algorithm (Stern 1978).
Distribution and size of functional hinterlands
According to the principle of equal opportunities, the model generated three metropolitan spheres of influence (Fig. 3) differing in their size and in the number of settlements they included. Jerusalem’s sphere was the biggest in area, but included only 9.8 per cent of the total settlements in Israel. In contrast, Tel Aviv’s sphere included 48-l per cent, while Haifa’s included the remaining 42.1 per cent.
The size of the nodal functional hinterland is defined by the number of settlements which can potentially serve the node under consideration. This size varies from one settlement (e.g. the nearest metropolitan core) to a maximum of eight settlements.
As indicated in Fig. 3, 44.3 per cent of the total nodal hinterlands are based on the nearest metropolitan core as the only potential destination. For these nodes,

274 Trmsit assistance ullocution in ismel
1%) 60
50
40
30
20
10
I 1 I
2
6. I%)
!ii ; 40 :
30 :
1.
20 ‘,
10 i
w aifa
T-l---L _ y+w
2 3 4 5 6
I I
/, Number of *I functional hlnterlandr
Hinterland size
(#of nodes )
Total Israel
Metropolitan sphere of influence
Sub-metropolitan sphere
Metropolitan core
Other urban settlements
Figure 3. Distribution of functional hinterlands by size in the three Israeli metropolitan spheres of influence.

Eliahu Stern 27.5
the existing radial transport system provides an optimal service. However nodes which have two (20.9 per cent) or more (34.8 per cent) potential destinations in their functional hinterland must rely upon an interregional transport service.
The distribution of hinterlands by size is different in the three metropolitan spheres. It is clear from the distribution that, in general, an intraregional service is needed far more in the northern parts of the country. The average hinterland in the north includes 2.5 settlements whereas in Tel Aviv’s sphere of influence the average nodal hinterland includes 2.1 settlements. The highest dependency on one central settlement is found in Jerusalem’s sphere, where the average size of a nodal hinterland is only 1.4 settlements. Within this sphere, 60 per cent of the settlements require more transport to interact with the metropolitan core than their counterparts elsewhere in the country. This excludes the settlements in the submetropolitan sphere of Beer Sheva (see Fig. 3) which includes 4.5 per cent of the total settlements studied and which use both intraregional transit services to Beer Sheva and radial services to Jerusalem or Tel Aviv. The size of the hinterlands thus influence the particular type of accessibility measured.
The accessibility surface
A distinction is commonly made between measures of relative accessibility and those of integral accessibility (Ingram 1971). The accessibility measure used in this study obviously belongs to the second group. However, in contrast to the normal integral accessibility measure, which allows comparison between nodes, the present measure defines each nodal accessibility with reference to a different set of destinations included in a pre-defined area. Therefore comparison is not possible, and the concept of accessibility used here is somewhat different from the operational definition of the integral accessibility measure. The accessibility surface for Israel derived from this measure is presented in Fig. 4.
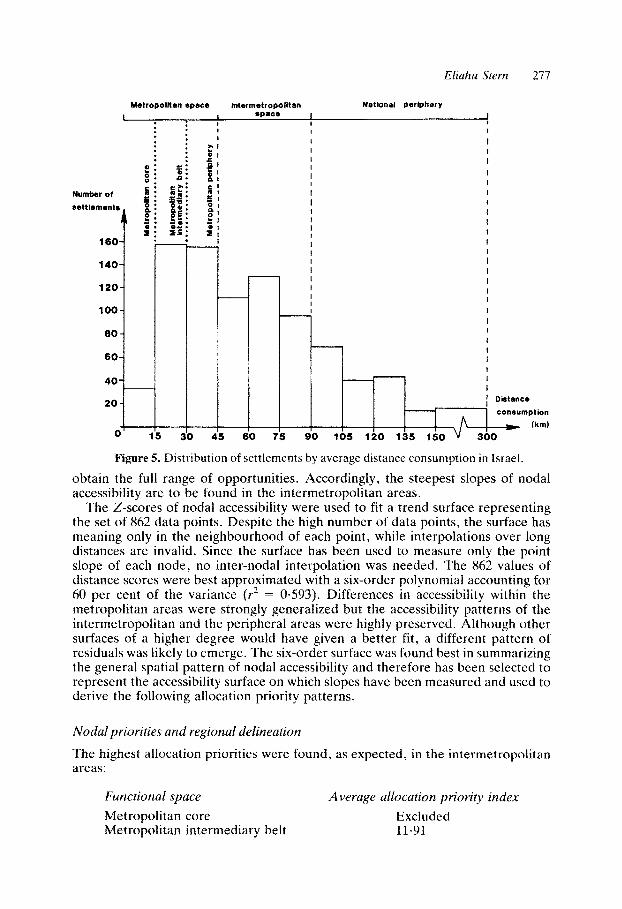
An accessibility decay trend is noticed around the three metropolitan areas, with the lowest accessibility, interpreted as an average travel distance of 2.50 km for full opportunities provision, in the extreme southern part of the country. The average national travel distance is 62.5 km. Forty-four per cent of the settlements, however, require larger distances to obtain the same opportunities available to the residents of the metropolitan cores. The accessibility pattern enables the division of the country into three major functional spaces: metropolitan, intermetropolitan and peripheral (Fig. 5).
The metropolitan area is commonly defined by the commuting pattern (Kfir 1978). Its expansion occurs at the expense of the intermetropolitan area (Taaffe et aZ. 1980). The latter shrinks as nodal accessibility increases. The distribution of nodal accessibility presented in Fig. 5 indicates that, on average, the metropolitan areas in Israel involve a travel distance of 45 km. The areas (including 40 per cent of the total settlements) are further divided into three rings: the metropolitan cores (including the 32 settlements which were excluded, as mentioned earlier, from the present study) with a travel distance of 15 km; the metropolitan intermediary belt (including 158 settlements) with a travel distance of up to 30 km; and the metropolitan periphery (including 15’7 settlements) with a maximum travel distance of 45 km. The spatial pattern of this division is presented in Fig. 6.
The intermetropolitan areas are relatively small in Israel (including 39 per cent of the total settlements)l indicating the megalopolitan trend in the Mediterranean coastal strip. The national periphery includes only 20.5 per cent of the settlements (179 settlements) in which the individual would have to travel more than 90 km to

Urban settlement
Iso-access Ilne
ACCOM lower than the nation81
average 162,51
967 boundarie8 Figure 4. The accessibility
surface in Israel.
Eliahu Stern
National Perivhsry
277
Number of f settlements
t
2 2
9 180
140-
120-
loo-
80-
80-
40
20
~ 0' ~ :
80 7 ‘5 R 1 I I I I
u 1
consumption
t (km)
90 105 120 135 150 300
Figure 5. Distribution of settlements by average distance consumption in Israel.
obtain the full range of opportunities. Accordingly, the steepest slopes of nodal accessibility are to be found in the intermetropolitan areas.
The Z-scores of nodal accessibility were used to fit a trend surface representing the set of 862 data points. Despite the high number of data points, the surface has meaning only in the neighbourhood of each point, while interpolations over long distances are invalid. Since the surface has been used to measure only the point slope of each node, no inter-nodal interpolation was needed. The 862 values of distance scores were best approximated with a six-order polynomial accounting for 60 per cent of the variance (2 = 0.593). Differences in accessibility within the metropolitan areas were strongly generalized but the accessibility patterns of the intermetropolitan and the peripheral areas were highly preserved. Although other surfaces of a higher degree would have given a better fit, a different pattern of residuals was likely to emerge. The six-order surface was found best in summarizing the genera1 spatial pattern of nodal accessibility and therefore has been selected to represent the accessibility surface on which slopes have been measured and used to derive the following allocation priority patterns.
Nodal priorities and regional delineation
The highest allocation priorities were found, as expected, in the intermetropolitan areas:
Functional space Average allocation priority index
Metropolitan core Excluded Metropolitan intermediary belt 11.91

278 Trunsit assistance allocution in Israel
2* _, Iso-access line
Metropolitan core
Metropoiltan intermedlery bel
perlphery
/II Intermetropollta~ space
cl Natlonal perlphel Figure 6. Functional spaces.

Eliahu Stern 279
Metropolitan periphery Intermetropolitan National periphery
9.76 12.85
7.38
The national periphery reflects a ‘valley’ in the accessibility surface with a slope value smaller than one. The same probably applies to the metropolitan cores, though reflecting ‘high plateaux’ in the accessibility surface with the highest accessibility possible. The metropolitan intermediary belt, although central in location, exhibits a relatively high allocation priority which is explained by the relatively high nodal weight of the settlements in these areas. The general pattern thus indicates that larger improvements in accessibility with less resources allocated can be expected in the intermetropolitan periphery than in any other area in the country.
The delineation of allocation priority regions is based on the nodal allocation priority indices used in a clustering program. The ciustering dendrogram can be used to generate spatial divisions with different numbers of regions. Figure 7 illustrates three alternative regional divisions derived from such a procedure. The regional priority is taken as the average of the nodal priorities in the region.
i 7
i :t
\ / i I t ’
S-Allocation ii ,’
8 16 Regions :ec
._- ,’ 5
41
i
3 ,'
7 ./..-, ‘\.
8:
1 !
~
1 '.I
12 c L_. 14 5
Q S.
/'
..'16
9
7 ' ,' , _--* ,
</ 15 \ \, \ \ \ 2 : \ \ .: \ !
/ I
I f . !
\ \ :
! \
11 ‘j \ f
12 Regions !S[ .r -. ,C'
7 5j
1
4 !
20 1
L!!?
8/ '-- i i.
11.1 \
2f \
10 ! f
Figure 7. Alternative divisions of prioritized regions for transit assistance allocation.
With reference to the alternative containing 22 allocation regions, it is interesting to note that six of the ten first priority regions are found in the intermetropolitan area, while an additional one (priority rank 4) covers both the intermetropolitan and the metropolitan areas. Two out of these ten regions are found in the northern

280 Transit assistance allocation in Israel
part of the national periphery. Selection of the desired regional division is, however, left in the hands of the decision makers, the operators, or both.
Conclusion
This paper presents the use of well-known geographical concepts for proposing options for transport subsidy allocation in Israel. Rank-size, gravitation, and spatial equity form the basis of the proposed methodology. It may be argued that nodal access slope is not directly related to transport subsidy and the latter is therefore treated solely in compensatory terms. An alternative way could have been to measure the nodal slope on a transit access surface rather than on a road access surface, using a nodal measure of transit service level as the one proposed, for example, by Stern (1979). This will obviously reflect the present transit service network which, in turn, reflects certain managerial decisions and operational constraints stemming from the existing mechanism of subsidy provision. Because of the existing transit budgeting system, a direct measure of the efficiency in resource allocation is impractical. Therefore allocation priority should be based on latent demand for access, rather than on observed travel demand under the operational constraints of the existing public transport network.
The simplicity of the method, the ease of updating, its open-ended nature allowing for clients’ final decisions, and the accessible, simple data needed, make this an alternative approach for subsidy planning. The concept of spatial equity thus has great relevance when dealing with the provision of a social commodity like transport in non-urban areas.
Acknowledgements
The author wishes to thank two anonymous referees for their useful comments and suggestions on an earlier draft of this paper.
References
Baxter, S. R. (1076) Computer and stutistical techniques for planners. London: Methuen. Berechman, .I. (1980) Transit subsidies and regulations: lessorzs from the Israeli experience.
‘Yei Aviv: Tel Aviv University, Center for LJrban and Regional Studies. Berry, J. L. B. (1976) Geography of market centers und retail distribution. New Jersey:
Prentice Hall. Bly, P. H., Webster, F. V. and Pounds, S. (198Oa) Effect of subsidies on urban public
transport. Transportation Research Y, 3 1 l-33 1. Bly. P. t-I., Webster F. V. and Pounds, S. (1980b) Subsidisation of urban public transport.
Crowthorne: Transport and Road Research Laboratories, TRRL Report, No. 541. Breheny, J. M. (197X) The measurement of spatial opportunity in strategic planning.
Regional Studies 12, 463--179. Gervero, B. R. (1980) Efficiency and equity implications of alternative transit fare policies.
Washington: US Department of Transportation. DOT--l--80-32. Egged (1980) T/X desired Structure of turiff and subsiily fur Egged service lines. Tel Aviv (in
Hebrew). Forkenbrock, J. D. and Dueker, A. (1979) Transit assistance ailocation. Tra~~~urtat~o~z
Rese~lrc~i 33A_ 317-327. Hodge. C. D. (l%Sl) Modcl~ing the geographic componeIlt of mass transit subsidies.
~~z~~ir~~~~~lent and ~eha~if~[~r 13A, 5X1-599. Ingram. 0. Ii. (1971) The concept of accessibility: a search for an operational form.
Regional Studies 5, 10 I - 107.

Eliahu Stern 281
Kfir, G. (1978) Similarity of commuting patterns: quantitative analysis of variance in commuting patterns in the Tel Aviv metropolitan area. Tel Aviv: The Israeli Institute of Transportation Planning and Research, Report No. 58 (in Hebrew).
Marchand, B. (1973) Deformation of a transportation surface. Annals of the Association of American Geographers 63, 507-521.
McGillivary, R. G. (1979) Should the intercity bus industry be subsidized? Traffic Quarterly 32(l), 99-115.
Morris, J. M., Dumble, P. L. and Wigan, M. R. (1979) Accessibility indicators for transport planning. Transportation Research 13A, 91-109.
Quarmby, D. A. (1977) Choice of investment priorities: practical aspects. Paper presented at the Seventh International Symposium on Theory and Practice in Transport Economics, London.
Stern, E. (1978) Priorities in aZiocat~ng subsidy to public tra~portation: research method- ology. Jerusalem: Ministry of Transportation, Planning and Economic Division (in Hebrew).
Stern, E. (1979) Inter-nodal association of bus services. GeoJournai3, 89-96. Stern, E. (1981) Geographical approach to transit resource allocation on a regional basis.
Beer Sheva: Report submitted to the Ministry of Transport, Planning and Economic Division (English summary).
Taaffe, E. J., Gauthier, H. L., and Maroffe, T. H. (1980) Extended commuting and the intermetropolitan periphery. Annals of the Association of American Geographers 70, 313-329.
Vickery, W. (1980) Optimal transit subsidy policy. Transportation 9, 389-409. Webster, F. V. and Bly, P. H. (eds) (1980) The demand for public transport. Crowthorne:
Transport and Road Research Laboratories. White, P. R. (1978) Allocation of funds to public transport investment and operating
support. Transportation 7, 225-242.
(Revised manuscript received 3 February 1984)