Embed Size (px)
Citation preview
PCI JOllrnn l Vol. )7, No . 1, 1992
pp. 74-84
Deformation of Progressively Cracking Partially Prestressed Concrete Beams
Jenn-Chuan Chern Associate Professor of Civil
Engineering Nafionaf T afwan University
Taipei. Tafwan. ROC
Chll-Mlng You Graduate Studellf
National Tafwan University Taipei. Taiwan . ROC
Zde~k P. Baf:ant Professor of Civil Engineering
Northwestern University E~anstl)ll. illinois
Deflections of partially prestressed concrete beams are analyzed on the basis of bending theory with plane cross sections, taking illlo account not only plasticity of steel and nonlinearity of concrete in compression, but also the tensile strain softening of concrete. The results agree with previous experiments quite well, and better than calculations in which the tensile stresses in concrete are neglected. However, their effect is not very large and is much less than that previously found in Satan! and Oh's analysis of nonprestressed concrete beams. The effect of tensile strain softening is found to be significant only in the initial post·cracking response (cracked elastic stage) and vanish near the ultimate load. The effect of tension stiffening of steel due 10 the surrounding concrete and the associated bond slip is neglected, since the discrepancy from test data which could be ascribed /0 this phenomenon is quite small and adequate agreement with tests in the initial post-crack· ing slage is found without tension stiffening. Comparisons are also made with the /-effective method of Branson and Trost, although generally these predictions are softer than measured and become unacceptable near the ultimate load. Comparisons of calculations as well as measurements be/ween beams with bonded and unbonded reinforcement show a relatively small difference.
PCIJOURNAl
In partially prestressed concrete structures, the prestressed reinforcement is mixed with a significant amount of nonprestressed reinforcement, either unstressed prestressing
steel or ordinary reinforcing steel. Such a design approach, whose essence was implied already in a suggestion by Emperger,l makes it possible to keep the effective prestress lower than its maximum allowable value.
In contrast to fully prestressed concrete structures, this results in some cracking under the service loads, although only the infrequently occurring maximum loads.2-4 The advantages gained include an increased ductility and energy absorption capability, as well as improved economy. Another advantage is reduction of the camber due to prestress.
The standard assumptions for the analysis of reinforced (nonprestressed), fully prestressed and partially prestressed concrete beams are identical and lead to good results for the ultimate load capacity. They include the use of bending theory with plane cross sections remaining plane, and neglect of tensile resistance of concrete and of bond slip. These assumptions, however, yield an erroneous prediction of beam curvatures and deflections above the service load range.
Various improved simplified methods for deflection calculations were proposed by Shaikh and Bransons and Basu et a1.6•
7 The latest state-of-the-art in the simplified curvature and deflection analysis is perhaps represented by the formulas of Branson and Tros~·9 and of Tadros, Ghali and Meyer.1O Their practical solutions, based on semiempirical adjustment of bending stiffness after the start of cracking, yield relatively good predictions of the initial post-cracking deflections, but are not intended to be used near the ultimate load range.
From research on nonprestressed reinforced concrete beams, it is known that neglect of the tensile resistance of concrete, customary in ultimate load calculations, leads to significant underestimations of deflections. The actual behavior is stiffer, due to the capability of concrete to transmit stresses in tension even after cracking begins. To explain this stiffening, two different mechanisms have been proposed:
1. Tensile strain softening of concrete, i.e., the fact that, after reaching the strength limit, the tensile stress does not drop suddenly to zero but declines gradually at increasing strain.
2. Tension stiffening of steel bars due to the tensile resistance of the concrete layer surrounding the bar, which is forced by bond stresses to extend simultaneously with the bar.
Design engineers have generally ignored the first mechanism, while many material researchers, driven by the results of fracture mechanics research, attach to it primary importance. The existing tension stiffening theory implies the assumption that the stress drops suddenly to zero as soon as the strength limit is reached, and that continuous tension-free cracks, normal to the bar, form immediately at a certain spacing.
After that, part of the bar force is assumed to be transmitted into the concrete between the cracks by means of bond stresses (and, conversely, the tensile resistance of concrete between the cracks restrains the steel bar against axial extension). The development of bond stresses, of course, requires a finite bond slip." However, the neglect of strain softening in the existing tension stiffening theory (i.e., the assumption of a sudden drop of stress to zero), is not realistic.
January-February 1992
As became clear from recent fracture mechanics research, strain softening takes place because of the phenomenon of crack bridging by aggregate pieces and fragments that remain anchored at both surfaces of the crack. and because the cracks that start to form at the peak stress are discontinuous and do not become continuous until the stress gets reduced to zero. A stability analysis of the fracture also showed that a sudden stress drop from the peak stress point occurs only as an instability (of snapback type), e.g .. when a tensile specimen that is not sufficiently short is tested in an ordinary testing machine that is not adequately stiff. In a beam, however, such instabilities, which would be manifested as dynamic events, are not observed. which is due to the fact that concrete is restrained by the bars.
Therefore, strain softening must be expected to take place in the reinforced concrete beam. Continuous. tension-free cracks can be expected to form only after a large increase of strain in the steel bar occurs. This suggests that the strain softening should be a primary mechanism. occurring first. and tension stiffening should come into play only much later, after the concrete tensile stress is reduced to nearly zero.
A fully consistent theory should obviously take into account both the strain softening and the tension stiffening with bond slip. However, this might be unnecessarily complicated. We, therefore, restrict our attention to only one mechanism, especially since both mechanisms have a similar effect. Due to the foregoing observation that the strain softening is primary and tension stiffening is secondary. we consider only the strain softening. Besides, this has also the advantage of simplicity, since the cross sections may still be assumed to remain plane, while for the latter mechanism they cannot. Whether this simplification is adequate will be decided by comparison with test data; if a significant discrepancy is found, of course, it would have to be attributed to tension stiffening.
From a preceding study by BaZant and Oh,12 dealing with post-cracking curvature and deflections up to the ultimate load in nonprestressed beams, it transpired that acceptable agreement with test results can be obtained even if exclusively the tensile strain softening of concrete is taken into account. It should further be noted that consideration of tensile strain softening is also essential for a realistic modeling of shrinkage stresses and the effect of drying on concrete creep. I)."
Nonlinear analysis of concrete beams that takes into account the actual nonlinear stress-strain relations for steel and concrete is by now well established; see, for example, the excellent survey by Scordelis. IS
ANALYSIS WITH STRAIN SOFTENING As usual, plane cross sections are assumed to remain
plane and normal during bending, which implies that deformations due to shear forces are neglected. The concrete and steel, prestressed as well as nonprestressed, are assumed to be perfectly bonded. Geometrically nonlinear effects are neglected.
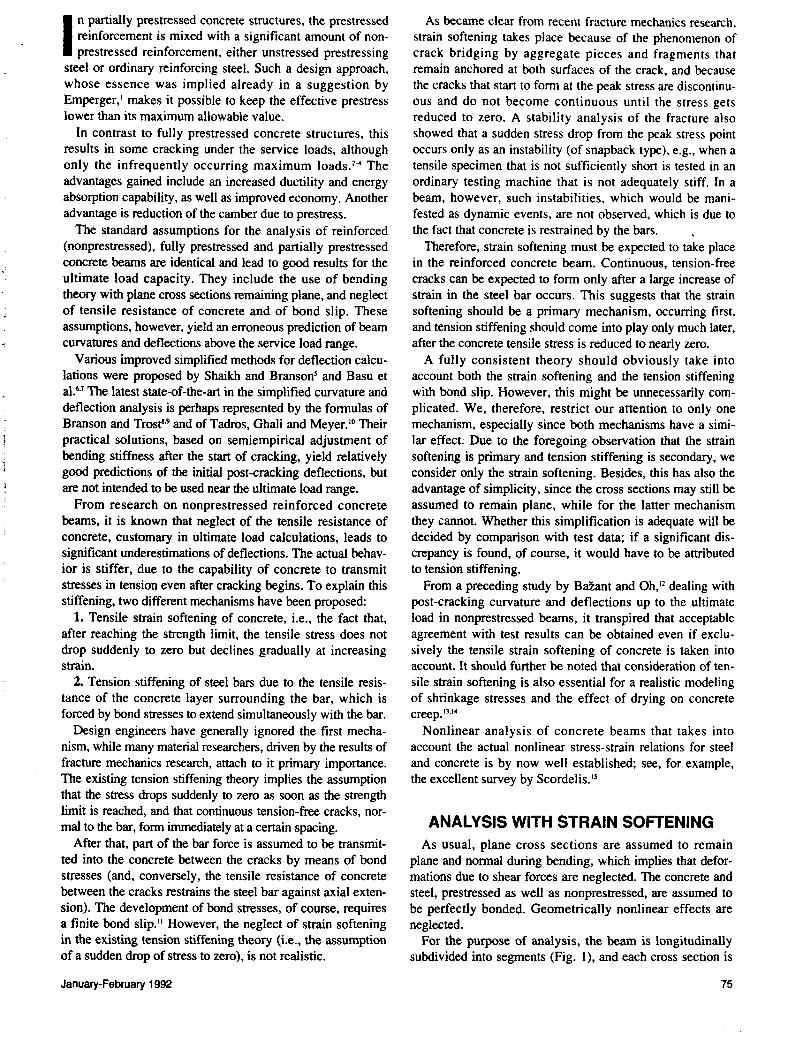
For the purpose of analysis, the beam is longitudinally subdivided into segments (Fig. I), and each cross section is
75
As used by Bahmt and Oh, u the stress-strain diagram of Cf. Saenz is adopted for concrete in compression (£c < 0):
1.: 2 M
Fig. 1. Arrangement of beam segments along the test beam used in deflection analysis.
subdivided int~ ml concrete layers of areas A/I and depth d/I (Figs. 2a and 2b); i = 1, 2, , .. mi' The net areas of concrete, not including the area of steel, are considered. The reinforcing bars (nonprestressed reinforcement) are grouped into m2layers with areas A/I and depths ds(j); j = 1,2, ... . m2 (Fig.2c).
For prestressing tendons, all the tendons located at the same depth and having the same effective prestress are grouped into one layer. Several such layers may occur; the area of each is All and the depth is dll; k = 1, 2, ... m3 (Fig. 2d). Except for the initial effective prestressing force, the treatment of prestressed and nonprestressed steel is identical.
At! At! "7
Ac (,) dc(i )
dc(m1)
Ac (m 1)
(a)
• • • • I!2Z.2I
Furthermore:
For 0 < £c S £,p:
For £Ip < £c < £tf
For £c > £,i
In the above equations:
O'c = EcEc
O'c = f; - (£c - £tp) (-E,) O'c = 0
= uniaxial stress and strain of concrete
= f~ = peak compressive stress (compressive strength) = strain at peak compressive stress = Young's elastic modulus of concrete =" direct tensile strength
(2)
= tangent strain softening modulus (negative value) = strain at peak tensile stress = final strain when the tensile stress is reduced to
zero The strain of concrete at any point of the coordinate z is
£ i::: - Kz + A, where K is the beam curvature and A is the strain at the chosen reference axis of the beam.
The strain in prestressing steel is £ = -Kz + A + f pe/Ep,
t::=======:j Ac (i)
(b)
d (1) ds{j)
(0) As(j) ds(m2)
Cd)
• • • •
c c c c c
ell",
• IL2Z'ZZZ.3
• ~m2
p(1)
dp(k) dp(3) =dp (4)
Fig. 2. Layered finite element for: (a-b) concrete cross section with regular or irregular shape; (c) reinforcing bars; (d) prestressing tendons; Ap(3) and AP(4) represent prestressing tendons subjected to different magnitudes of effective prestress.
76 PCIJOURNAL
at oc fi compressioo •
_ Ecp f t
fc
l' c Etp Etf Ec
(a) (b)
CTs (f
fpu Kfpy -'-Es
/ I fpy I. 1
op 1
Es 'I Epl
1 : Ep
Epy
(c) (d)
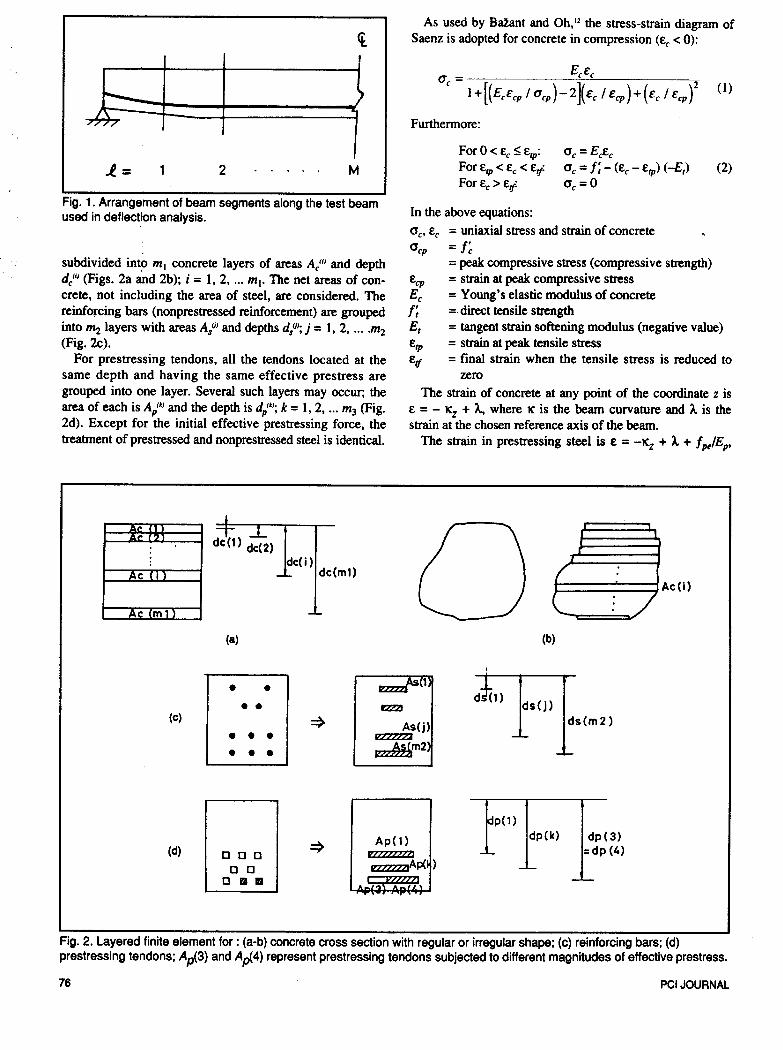
Fig. 3. Assumed uniaxial stress-strain relations for: (a-b) concrete in tension and compression; (c) reinforcing steel; and (d) prestressing steel.
where fpe is the effective prestress and Ep is Young's elastic modulus of prestressing steel.
The nonprestressed reinforcing steel is assumed to be elastic-perfectly plastic, characterized by Young's elastic modulus Es and uniaxial yield stress fy (Fig. 3c). For the prestressing tendons, the stress-strain formula proposed by Menegotto and Pinto,16 which was shown by Naaman2 to be realistic, is adopted for the analysis. It has the form (see Fig. 3d):
(3)
(4)
where fpy is the yield stress; fpu and Epu are the ultimate stress and strain, respectively; and N, K, and Q are empirical parameters whose values are recommended by Naaman as 6.06, 1.0325, and 0.00625, respectively.
The conditions of eqUilibrium of stresses with the axial force N and bending moment M are:
January-February 1992
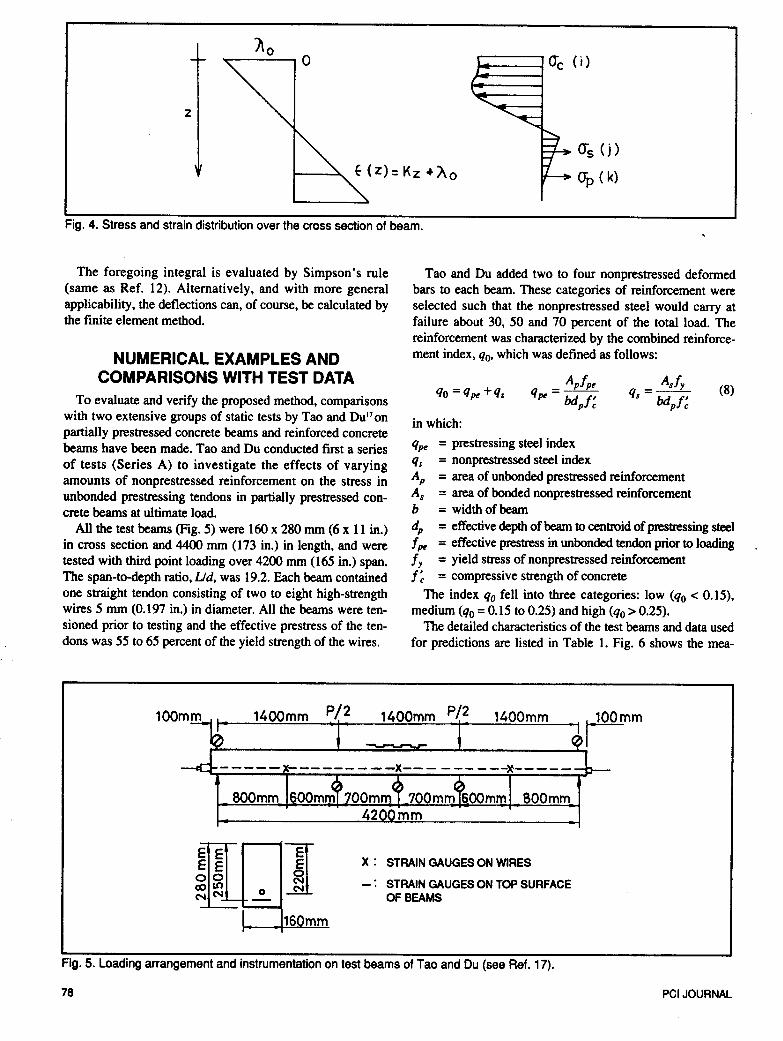
The moment-curvature or load-deflection diagram IS calculated by a step-by-step procedure which is described in Appendix A. The procedure starts from an initial state characterized by the initial curvature leo and the initial axial strain ~ produced at the beam axis by the initial prestress load from the tendons on the beam (see Fig. 4).
In each step of this procedure, the increments of curvature and the corresponding actual strains are determined on the basis of the previous step and successive iterations are used to satisfy the equilibrium relations. The midspan deflection 5 is evaluated according to the unit load method (principle of virtual work):
(7)
in which M(x) is the bending moment distribution corresponding to unit load in the direction of deflection 5.
77
110
z
...----1 <Yc (i)
o-s (j) <Yp (k)
Fig. 4. Stress and strain distribution over the cross section of beam.
The foregoing integral is evaluated by Simpson's rule (same as Ref. 12). Alternatively, and with more general applicability, the deflections can, of course, be calculated by the finite element method.
NUMERICAL EXAMPLES AND COMPARISONS WITH TEST DATA
To evaluate and verify the proposed method, comparisons with two extensive groups of static tests by Tao and Du17 on partially prestressed concrete beams and reinforced concrete beams have been made. Tao and Du conducted first a series of tests (Series A) to investigate the effects of varying amounts of nonprestressed reinforcement on the stress in unbonded prestressing tendons in partially prestressed concrete beams at ultimate load.
All the test beams (Fig. 5) were 160 x 280 mm (6 x 11 in.) in cross section and 4400 mm (173 in.) in length, and were tested with third point loading over 4200 mm (165 in.) span. The span-to-depth ratio, Ud, was 19.2. Each beam contained one straight tendon consisting of two to eight high-strength wires 5 mm (0.197 in.) in diameter. All the beams were tensioned prior to testing and the effective prestress of the tendons was 55 to 65 percent of the yield strength of the wires.
Tao and Du added two to four nonprestressed deformed bars to each beam. These categories of reinforcement were selected such that the nonprestressed steel would carry at failure about 30, 50 and 70 percent of the total load. The reinforcement was characterized by the combined reinforcement index, qo, which was defined as follows:
in which:
qpe = prestressing steel index q s = nonprestressed steel index
Asly qs = btl I'
p c
Ap = area of unbonded prestressed reinforcement As = area of bonded nonprestressed reinforcement b = width of beam
(8)
dp = effective depth of beam to centroid of prestressing steel 1 fH = effective prestress in unbonded tendon prior to loading Iy = yield stress of nonprestressed reinforcement 1 ~ = compressive strength of concrete
The index qo fell into three categories: low (qo < 0.15), medium (qo = 0.15 to 0.25) and high (qo > 0.25).
The detailed characteristics of the test beams and data used for predictions are listed in Table 1. Fig. 6 shows the mea-
1400mm P/2 1400mm P/2 1400mm
E E I x: STRAIN GAUGES ON WIRES E E ~ 0 0 STRAIN GAUGES ON TOP SURFACE co It) ('oj -. N N 0 OF BEAMS
16 mm
Fig. 5. Loading arrangement and instrumentation on test beams of Tao and Du (see Ref. 17).
78 PCIJOURNAL
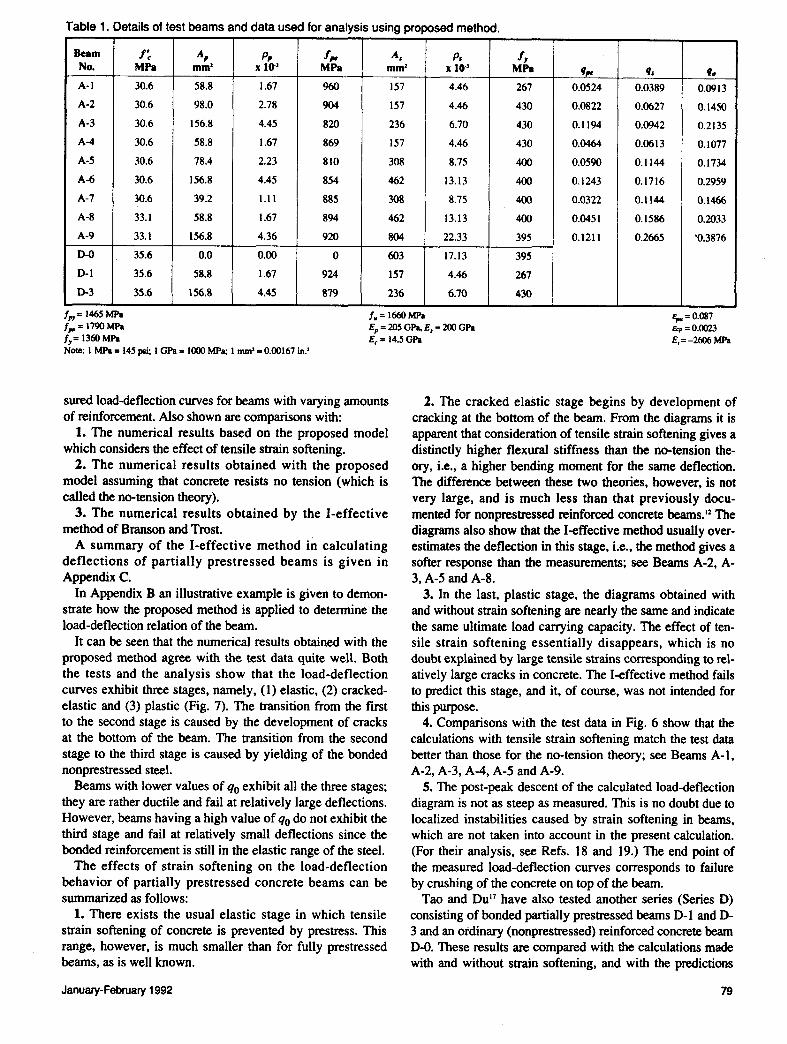
Table 1. Details of test beams and data used for analysis using proposed method.
Beam I~ A, P, I,. A, P, I, No. MP. mm' x 10"' MP. mm' x 10" MPa 9,. 9, 90
A·I 30.6 58.8 1.67 960 157 4.46 267 0.0524 0.0389 0.0913
A·2 30.6 98.0 2.78 904 157 4.46 430 0.0822 0.0627 0.1450
A·3 30.6 156.8 4.45 820 236 6.70 430 0.1194 0.0942 0.2135
A-4 30.6 58.8 1.67 869 157 4.46 430 0.0464 0.0613 0.1077
A·5 30.6 78.4 2.23 810 308 8.75 400 0.0590 0.1144 0.1734
A-6 30.6 156.8 4.45 854 462 13.13 400 0.1243 0.1716 0.2959
A·7 30.6 39.2 l.ll 885 308 8.75 400 0.0322 0.1144 0.1466
A·8 33.1 58.8 1.67 894 462 13.13 400 0.0451 0.1586 0.2033
A·9 33.1 156.8 4.36 920 804 22.33 395 0.1211 0.2665 '0.3876
0-0 35.6 0.0 0.00 0 603 17.13 395
0·1 35.6 58.8 1.67 924 157 4.46 267
0-3 35.6 156.8 4.45 879 236 6.70 430
1,,= 1465 MPa 1,..= 1790MPa 1,= 1360MPa
1.= 1660MPa E,. = 0.087 &p=O.OO23 Ep = 205 GPa, E, = 200 GPa
Ec = 14.5GPa E, = -2606 MPa Note: 1 MPa = 145 psi; 1 GPa = 1000 MPa; 1 mm' = 0.00167 in.'
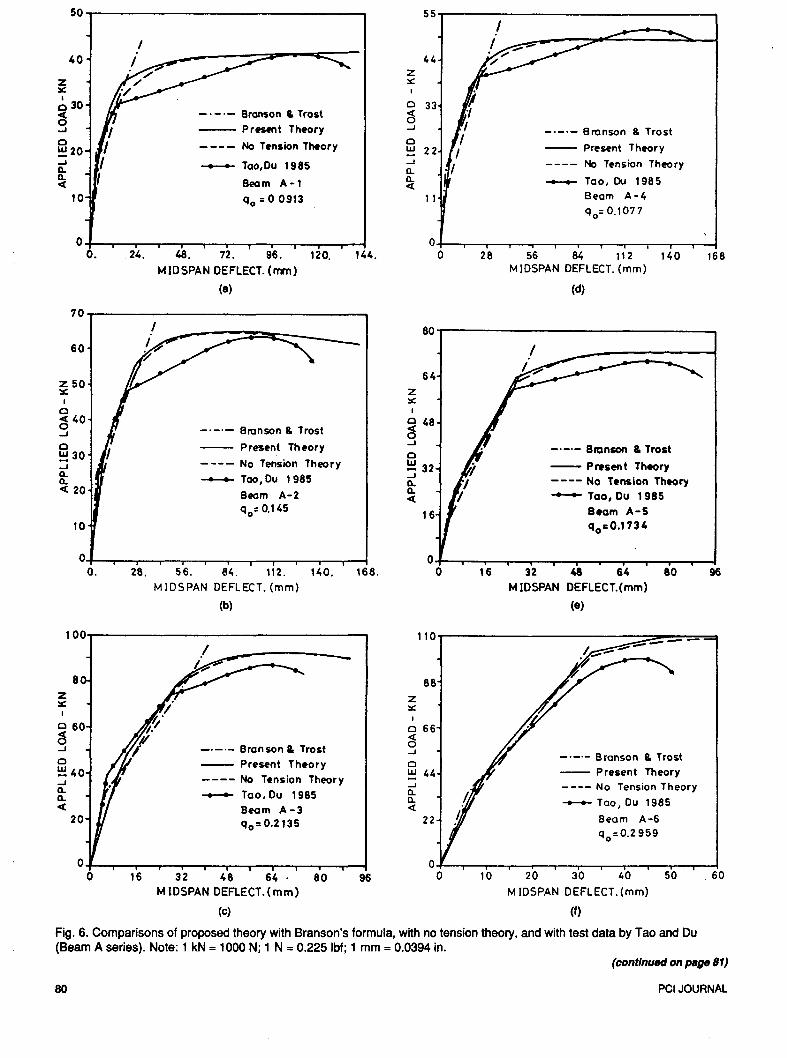
sured load-deflection curves for beams with varying amounts of reinforcement. Also shown are comparisons with:
1. The numerical results based on the proposed model which considers the effect of tensile strain softening.
2. The numerical results obtained with the proposed model assuming that concrete resists no tension (which is called the no-tension theory).
3. The numerical results obtained by the I-effective method of Branson and Trost.
A summary of the I-effective method in calculating deflections of partially prestressed beams is given in Appendix C.
In Appendix B an illustrative example is given to demonstrate how the proposed method is applied to determine the load-deflection relation of the beam.
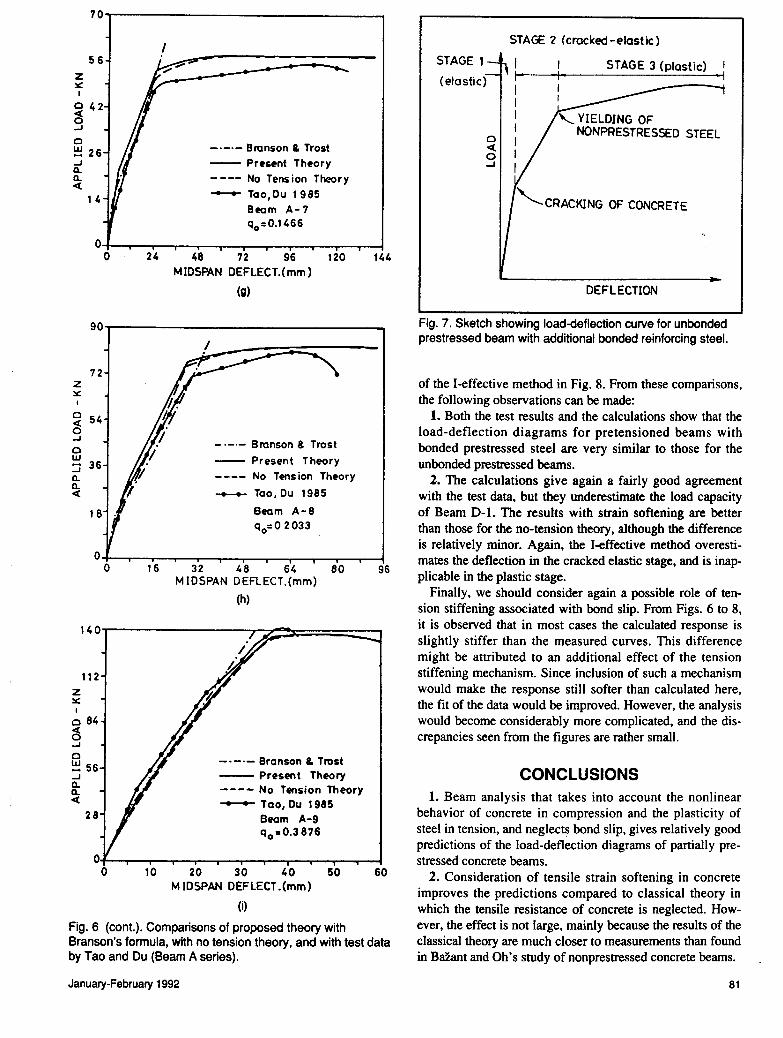
It can be seen that the numerical results obtained with the proposed method agree with the test data quite well. Both the tests and the analysis show that the load-deflection curves exhibit three stages, namely, (1) elastic, (2) crackedelastic and (3) plastic (Fig. 7). The transition from the fIrst to the second stage is caused by the development of cracks at the bottom of the beam. The transition from the second stage to the third stage is caused by yielding of the bonded nonprestressed steel.
Beams with lower values of qo exhibit all the three stages; they are rather ductile and fail at relatively large deflections. However, beams having a high value of qo do not exhibit the third stage and fail at relatively small deflections since the bonded reinforcement is still in the elastic range of the steel.
The effects of strain softening on the load-deflection behavior of partially prestressed concrete beams can be summarized as follows:
1. There exists the usual elastic stage in which tensile strain softening of concrete is prevented by prestress. This range, however, is much smaller than for fully prestressed beams, as is well known.
January·February 1992
2. The cracked elastic stage begins by development of cracking at the bottom of the beam. From the diagrams it is apparent that consideration of tensile strain softening gives a distinctly higher flexural stiffness than the no-tension theory, i.e., a higher bending moment for the same deflection. The difference between these two theories, however, is not very large, and is much less than that previously documented for nonprestressed reinforced concrete beams. 12 The diagrams also show that the I-effective method usually overestimates the deflection in this stage, i.e., the method gives a softer response than the measurements; see Beams A-2, A-3, A-5 and A-8.
3. In the last, plastic stage, the diagrams obtained with and without strain softening are nearly the same and indicate the same ultimate load carrying capacity. The effect of tensile strain softening essentially disappears, which is no doubt explained by large tensile strains corresponding to relatively large cracks in concrete. The I-effective method fails to predict this stage, and it, of course, was not intended for this purpose.
4. Comparisons with the test data in Fig. 6 show that the calculations with tensile strain softening match the test data better than those for the no-tension theory; see Beams A-I, A-2, A-3, A-4, A-5 and A-9.
5. The post-peak descent of the calculated load-deflection diagram is not as steep as measured. This is no doubt due to localized instabilities caused by strain softening in beams, which are not taken into account in the present calculation. (For their analysis, see Refs. 18 and 19.) The end point of the measured load-deflection curves corresponds to failure by crushing of the concrete on top of the beam.
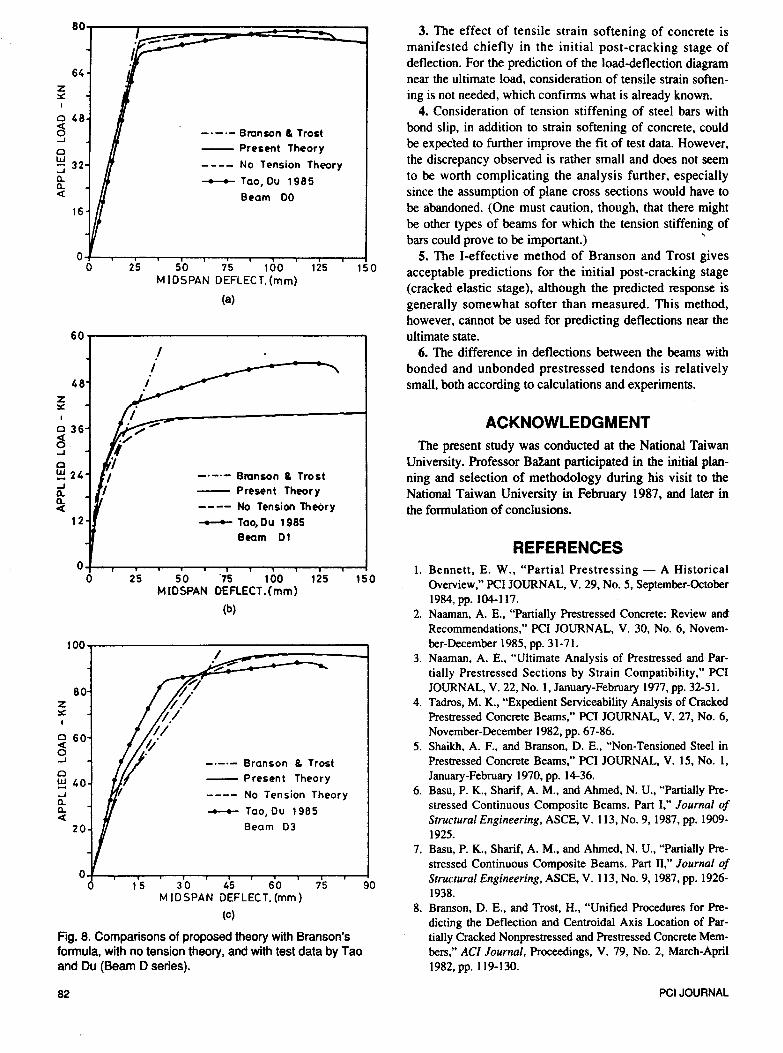
Tao and Du l7 have also tested another series (Series D) consisting of bonded partially prestressed beams D-l and D-3 and an ordinary (nonprestressed) reinforced concrete beam D-O. These results are compared with the calculations made with and without strain softening, and with the predictions
79
50~--------------------------------~
z :oc
I
40
0 30 a ..J
o ~20 ..J Q.. Q.. c(
10
-. -.- Bronson &. Trost
--- Present Theory
---- No Tension TMory
--- Tao,Du 1985
Beam A-I
qo = 00913
24. 48. 72. 96. 120. M lDSPAN DEFLECT. (mm)
(a)
144.
10~--------------------------------~
60
z 50 :oc
I
o a40 ..J
o ~ 30 ..J Q.. Q.. c( 20
10
-.-.- Bronson & Trost
---- Present Th eory
---- No Tension Theory
--- Tao, Du 1 985 Beam A-2 qo= 0.145
O~~--~~--r--.~--'-~--~-r--r-~ O. 28. 56. 84. 112. 140. 168.
MIDSPAN DEFLECT. (mm)
(b)
100~--------------------------------~
8
060 a ..J
o !!:! 40 ..J Q.. Q.. c(
20
_.-.- Branson &. Trost
--- Present Theory ---- No Tension Theory ~ Tao.Du 1985
Beam A-3 qo=0.2135
16 32 48 64· 80 MIDSPAN DEFLECT.(mm)
(e)
96
55~---------------------------------,
44
o 33 (§ ....J
o w 22 ....J
Q.. Q.. c(
11
-.-.- Bronson & Trost
---- Present Theory
No Tension Theory
_ Tao, Du 1985 Beam A-4
qo= 0.1077
O+-~--r--r--r-'-~--'--T--~-r--r-~ o 28 56 84 11 2 1 40 168
MIDSPAN DEFLECT. (mm)
(d)
80~---------------------~
z :oc
64
o 48 ~ ..J
o ~ 32 ..J Q.. Q.. c(
16
I
-.-.- Branson & Trost
- Present Theory ---- No Tension Theory
- Tao, Du 1985 aeam A-5 qo .. 0.1134
16 32 48 64 80 M lDSPAN DEFLECT.(mm)
(e)
96
110~-----------------------=~~~~
Z :oc
88
o 66
~ ....J
o w 44 ....J Q. Q. c(
22
-.-.- Branson &. Trost -- P resent Theory ---- No Tension Theory
- Tao, Ou 1985 Beam A-6 qo=O.2959
10 20 30 40 50
MIDSPAN DEFLECT.(mm)
(f)
60
Fig. 6. Comparisons of proposed theory with Branson's formula, with no tension theory, and with test data by Tao and Du (Beam A series). Note: 1 kN = 1000 N; 1 N = 0.225Ibf; 1 mm = 0.0394 in.
(continued on page 81)
80 PCIJOURNAL
70
56 z x: I
o 42 c5 ...J
0 !:!! 26 ...J 0.. 0.. c(
14
0
90
72 z x:
0 54 c( 0 ...J
0 UJ ::::; 36 0.. 0.. c(
18
0
140
z x: I
112
084 c5 ...J
o !:!! 56 ...J 0.. 0.. c(
28
0 24
0 16
-.-.- Bronson & Trost -- Present Theory ---- No Tension T~ry ~ Tao,Du 1985
Beam A-7 Qo=0.1466
48 72 96 120 MIDSPAN DEFLECT.(mm)
(g)
- ·-·-Bronson & Trost
-- Present Theory
---- No Tension Theory
-.-.- Tao.Du 1985
Beam A-8 Qo=O 2033
32 48 64 80 MIDSPAN DEFLECT.(mm)
(h)
-.-.- Branson & Trost - Present Theory ---- No Tension Theory --- Too, Du 1985
Beam A-9 Qo=0.3876
144
96
O'+-~-T--r--~~~--~~--T-~--T-~ o 10 20 30 40 50 60
MIDSPAN DEFLECT .(mm)
(i)
Fig. 6 (cont.). Comparisons of proposed theory with Branson's formula, with no tension theory, and with test data by Tao and Du (Beam A series).
January-February 1992
STAGE 1
(elastic)
o c( o .....
STAGE 2 (cracked-elastic)
STAGE 3 (plastic)
'-- YIELDING OF NON PRESTRESSED STEEL
'-CRACKING OF CONCRETE
DEFLECTION
Fig. 7. Sketch showing load-deflection curve for unbonded prestressed beam with additional bonded reinforcing steel.
of the I-effective method in Fig. 8. From these comparisons, the following observations can be made:
1. Both the test results and the calculations show that the load-deflection diagrams for pretensioned beams with bonded prestressed steel are very similar to those for the unbonded prestressed beams.
2. The calculations give again a fairly good agreement with the test data, but they underestimate the load capacity of Beam D-l. The results with strain softening are better than those for the no-tension theory, although the difference is relatively minor. Again, the I-effective method overestimates the deflection in the cracked elastic stage, and is inapplicable in the plastic stage.
Finally, we should consider again a possible role of tension stiffening associated with bond slip. From Figs. 6 to 8, it is observed that in most cases the calculated response is slightly stiffer than the measured curves. This difference might be attributed to an additional effect of the tension stiffening mechanism. Since inclusion of such a mechanism would make the response still softer than calculated here, the fit of the data would be improved. However, the analysis would become considerably more complicated, and the discrepancies seen from the figures are rather small.
CONCLUSIONS 1. Beam analysis that takes into account the nonlinear
behavior of concrete in compression and the plasticity of steel in tension, and neglects bond slip, gives relatively good predictions of the load-deflection diagrams of partially prestressed concrete beams.
2. Consideration of tensile strain softening in concrete improves the predictions compared to classical theory in which the tensile resistance of concrete is neglected. However, the effect is not large, mainly because the results of the classical theory are much closer to measurements than found in BaZant and Oh' s study of nonprestressed concrete beams.
81
z x:
64
o 48 C3 ..J
o !:!:! 32 ..J a. a. «
16
-.-.- Bronson & Trost -- Present Theory
---- No Tension Theory
- Tao,Ou 1985 Beam 00
25 50 75 100 125 150 MIDSPAN DEFLECT.(mm)
(a)
60~-----------------~
z x:
48
036 C3 ..J
o ~ 24 ..J a. a. «
12
I I
_.-.- Bronson & Trost --- Present Theory ---- No Tension Theory --- Tao,Ou 1985
Beom 01
25 5075 100 125 MIDSPAN OEFLECT.(mm)
(b)
150
100~------------------,
z x:
80
o 60 ~ ..J
o !:!::! 40 ..J a. a. «
20
-'-'- Branson & Trost -- Present Theory ---- No Tension Theory ~ Tao,Ou 1985
Beam 03
15 30 45 60 75 90 MIDSPAN DEFLECT.(mm)
(e)
Fig. 8. Comparisons of proposed theory with Branson's formula, with no tension theory, and with test data by Tao and Du (Beam 0 series).
82
3. The effect of tensile strain softening of concrete is manifested chiefly in the initial post-cracking stage of deflection. For the prediction of the load-deflection diagram near the ultimate load, consideration of tensile strain softening is not needed, which confirms what is already known.
4. Consideration of tension stiffening of steel bars with bond slip, in addition to strain softening of concrete, could be expected to further improve the fit of test data. However, the discrepancy observed is rather small and does not seem to be worth complicating the analysis further, especially since the assumption of plane cross sections would have to be abandoned. (One must caution, though, that there might be other types of beams for which the tension stiffening of bars could prove to be important.) ,
5. The I-effective method of Branson and Trost gives acceptable predictions for the initial post-cracking stage (cracked elastic stage), although the predicted response is generally somewhat softer than measured. This method, however, cannot be used for predicting deflections near the ultimate state.
6. The difference in deflections between the beams with bonded and unbonded prestressed tendons is relatively small, both according to calculations and experiments.
ACKNOWLEDGMENT The present study was conducted at the National Taiwan
University. Professor Ba!ant participated in the initial planning and selection of methodology during his visit to the National Taiwan University in February 1987, and later in the formulation of conclusions.
REFERENCES 1. Bennett, E. W., "Partial Prestressing - A Historical
Overview," PCI JOURNAL, V. 29, No.5, September-October 1984, pp. 104-117.
2. Naaman, A. E., "Partially Prestressed Concrete: Review and Recommendations," PCI JOURNAL, V. 30, No.6, November-December 1985, pp. 31-71.
3. Naaman, A. E., "Ultimate Analysis of Prestressed and Partially Prestressed Sections by Strain Compatibility," PCI JOURNAL, V. 22, No. I, January-February 1977, pp. 32-51.
4. Tadros, M. K., "Expedient Serviceability Analysis of Cracked Prestressed Concrete Beams," PCI JOURNAL, V. 27, No.6, November-December 1982, pp. 67-86.
5. Shaikh, A. F., and Branson, D. E., "Non-Tensioned Steel in Prestressed Concrete Beams," PCI JOURNAL, V. 15, No. I, January-February 1970, pp. 14-36.
6. Basu, P. K., Sharif, A. M., and Ahmed, N. U., "Partially Prestressed Continuous Composite Beams. Part I," Journal of Structural Engineering, ASCE, V. 113, No.9, 1987, pp. 1909-1925.
7. Basu, P. K., Sharif, A. M., and Ahmed, N. U., "Partially Prestressed Continuous Composite Beams. Part II," Journal of Structural Engineering, ASCE, V. 113, No.9, 1987, pp. 1926-1938.
8. Branson, D. E., and Trost, H., "Unified Procedures for Predicting the Deflection and Centroidal Axis Location of Partially Cracked Nonprestressed and Prestressed Concrete Members," ACI Journal, Proceedings, V. 79, No.2, March-April 1982, pp. 119-130.
PCIJOURNAL
9. Branson, D. E., and Trost, H., "Application of the I-Effective Method in Calculating Deflections of Partially Prestressed Members," PCI JOURNAL, V. 27, No.5, September-October 1982, pp. 62-77.
10. Tadros, M. K., Ghali, A., and Meyer, A. W., "Prestress Loss and Deflection of Precast Concrete Members," PCI JOURNAL, V. 30, No.1, January-February 1985, pp. 114-141.
11. Eligehausen, R., Popov, E. P., and Bertero, V. V., "Local Bond Stress Slip Relationships of Deformed Bars Under Generalized Excitations," Earthquake Engineering Research Center, Report UCB/EERC83-23, Department of Civil Engineering, University of California, Berkeley, 1983.
12. Bafant, Z. P., and Oh, B. H., "Deformation of Progressively Cracking Reinforced Concrete Beams," ACI Journal, V. 81, No.3, May-June 1984, pp. 268-278.
13. Bafant, Z. P., and Chern, 1. C., "Concrete Creep at Variable Humidity: Constitutive Law and Mechanism," Materials and Structures, RILEM, V. 18, No. 103,1985, pp. 1-20.
14. Chern, J. C., and Marchertas, A. H., "Long-Term Analysis of Concrete Structures with Cracking," Paper 2/6, Proceedings 8th International Conference on Structural Mechanics in Reactor Technology, Brussels, Belgium, August 1985.
15. Scordelis, A. C., "Computer Models for Nonlinear Analysis of Reinforced and Prestressed Concrete Structures," PCI JOURNAL, V. 29, No.6, November-December 1984, 116-135.
16. Menegotto, M., and Pinto, P. E., "Method of Analysis for Cyclically Loaded R. C. Plane Frames, Including Changes in Geometry and Non-Elastic Behavior of Elements Under Combined Normal Force and Bending," IABSE Preliminary Report for Symposium on Resistance and Ultimate Deformability of Structures Acted on by Well-Defined Repeated Loads, Lisbon, 1973, pp. 15-22.
17. Tao, X., and Du, G., "Ultimate Stress of Unbonded Tendons in Partially Prestressed Concrete Beams," PCI JOURNAL, V. 30, No.6, November-December 1985, pp. 72-91.
18. Bafant, Z. P., Pan, J., Pijaudier-Cabot, G., "Softening in Reinforced Concrete Beams and Frames," Journal of Structural Engineering, ASCE. V. 113, No. 12, December 1987, pp. 2333-2347.
19. Balant, Z. P., Pijaudier-Cabot, G., and Pan, J., "Ductility, Snap-Back, Size Effect and Redistribution in Softening Beams or Frames," Journal of Structural Engineering, ASCE, V. 113, No. 12, December 1987, pp. 2348-2364.
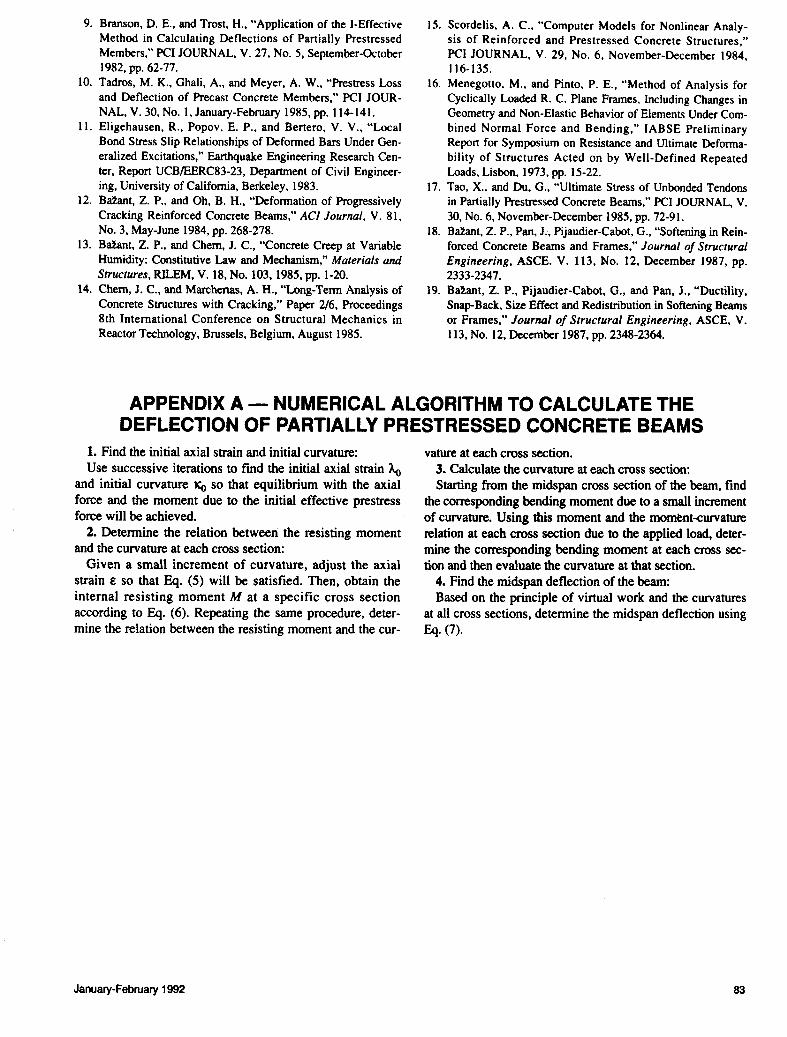
APPENDIX A - NUMERICAL ALGORITHM TO CALCULATE THE DEFLECTION OF PARTIALLY PRESTRESSED CONCRETE BEAMS
1. Find the initial axial strain and initial curvature: Use successive iterations to fmd the initial axial strain ~
and initial curvature !Co so that equilibrium with the axial force and the moment due to the initial effective prestress force will be achieVed.
2. Determine the relation between the resisting moment and the curvature at each cross section:
Given a small increment of curvature, adjust the axial strain £ so that Eq. (5) will be satisfied. Then, obtain the internal resisting moment M at a specific cross section according to Eq. (6). Repeating the same procedure, determine the relation between the resisting moment and the cur-
January-February 1992
vature at each cross section. 3. Calculate the curvature at each cross section: Starting from the midspan cross section of the beam, find
the corresponding bending moment due to a small increment of curvature. Using this moment and the moment-curvature relation at each cross section due to the applied load, determine the corresponding bending moment at each cross section and then evaluate the curvature at that section.
4. Find the midspan deflection of the beam: Based on the principle of virtual work and the curvatures
at all cross sections, determine the midspan deflection using Eq. (7).
83
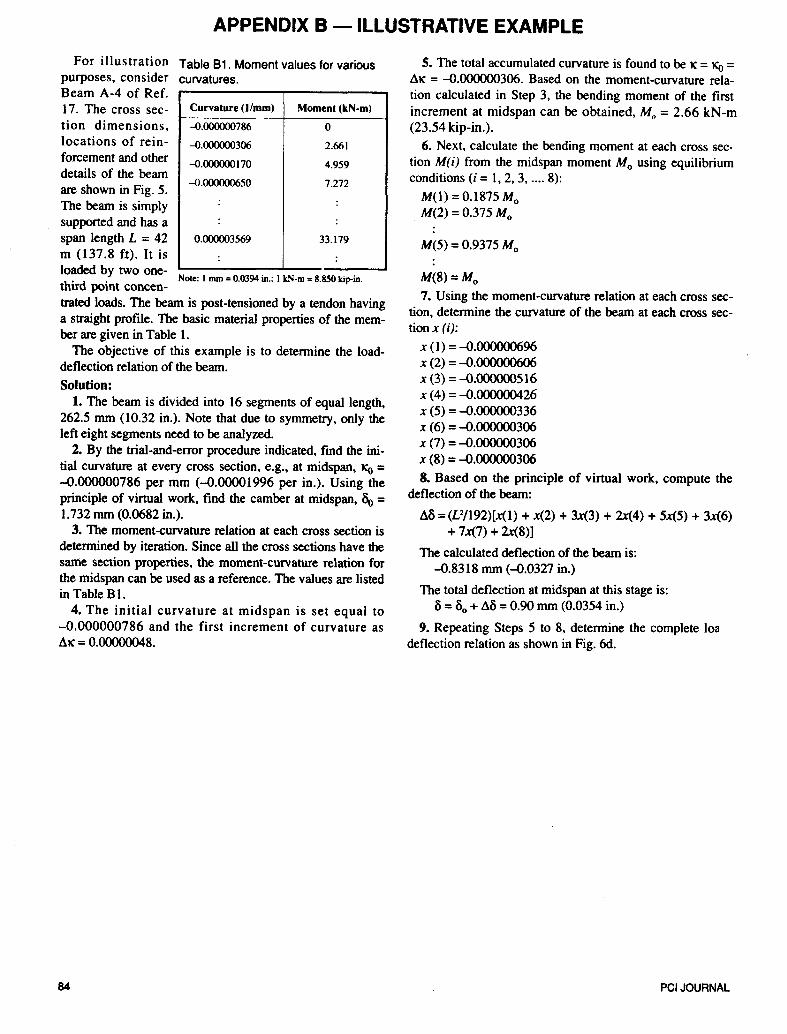
APPENDIX B - ILLUSTRATIVE EXAMPLE
For illustration Table 81. Moment values for various purposes, consider curvatures.
Curvature (l/mm) Moment (kN-m)
~.()()()()()()786 0
~.()()()()()()306 2.66\
~.()()()()()() 170 4.959
~.000000650 7.272
: :
: :
0.000003569 33.179
: :
Beam A-4 of Ref. 17. The cross section dimensions, locations of reinforcement and other details of the beam are shown in Fig. 5. The beam is simply supported and has a span length L = 42 m (137.8 ft). It is loaded by two one-third point concen-
Note: 1 mm = 0.0394 in.; 1 kN-m = 8.850 kip-in.
trated loads. The beam is post-tensioned by a tendon having a straight profile. The basic material properties of the member are given in Table 1.
The objective of this example is to determine the loaddeflection relation of the beam.
Solution: 1. The beam is divided into 16 segments of equal length,
262.5 mm (10.32 in.). Note that due to symmetry, only the left eight segments need to be analyzed.
2. By the trial-and-error procedure indicated, find the initial curvature at every cross section, e.g., at midspan, Ko = -0.000000786 per mm (-0.00001996 per in.). Using the principle of virtual work, find the camber at midspan, 00 = 1.732 mm (0.0682 in.).
3. The moment-curvature relation at each cross section is determined by iteration. Since all the cross sections have the same section properties, the moment-curvature relation for the midspan can be used as a reference. The values are listed in Table B1.
4. The initial curvature at midspan is set equal to -0.000000786 and the first increment of curvature as £\1C = 0.00000048.
84
s. The total accumulated curvature is found to be 1C = Ko = .1.1C = -0.000000306. Based on the moment-curvature relation calculated in Step 3, the bending moment of the first increment at midspan can be obtained, Mo = 2.66 kN-m (23.54 kip-in.).
6. Next, calculate the bending moment at each cross section M(i) from the midspan moment Mo using equilibrium conditions (i = 1,2,3, .... 8):
M(l) = 0.1875 Mo M(2) = 0.375 Mo
M(5) = 0.9375 Mo
M(8)=Mo
7. Using the moment-curvature relation at each cross section, determine the curvature of the beam at each cross section x (i):
x (1) = -0.000000696 x (2) = -0.000000606 x (3) = -0.000000516 x (4) = -0.000000426 x (5) = -0.000000336 x (6) = -0.000000306 x (7) = -0.000000306 x (8) = -0.000000306
8. Based on the principle of virtual work, compute the deflection of the beam:
£\5 = (V/192)[.x(I) + .x(2) + 3.x(3) + 2.x(4) + 5.x(5) + 3.x(6) + 7.x(7) + 2.x(8)]
The calculated deflection of the beam is: -0.8318 mm (-0.0327 in.)
The total deflection at midspan at this stage is: 5 = 50 + .1.5 = 0.90 mm (0.0354 in.)
9. Repeating Steps 5 to 8, determine the complete loa deflection relation as shown in Fig. 6d.
PCIJOURNAL