Embed Size (px)
Citation preview
1
Deformation of continuously cast Carbon Steels in the Range of γ-α Transformation
M.Hochegger1), J. Six1), H.P. Degischer1), Sergiu Ilie2), B. Harrer3)
1)Institute of Materials Science and Technology, Vienna University of Technology, Vienna/Austria,
2)Voest-Alpine Stahl GmbH B2E, Linz/Austria, 3) University of Applied Sciences, Wels/Austria
Abstract: Specimens taken from surface near region of continuously cast low carbon steel slabs are prepared for compression and tensile tests by means of a Gleeble machine. Specimens are cooled from austenitizing to deformation temperature between 740°C and 810°C. Stress-strain curves are evaluated and correlated to the microstructure developed during deformation in the range of 0.2 to 1 total true strain. Strain rates between 3*10-3 – 7*10-2/s are applied. The deformation induced ferrite formation is quantified. The changes in ductility are correlated to the microstructure. Damage indication is documented by x-ray tomography and metallography. Keywords: Compression test, tensile test, continuously cast steel slabs, deformation induced ferrite, x-ray tomography Introduction: Continuously cast steel slabs are subject to thermal and mechanical stresses from the mold to the reheating furnace, which can cause local deformations in the slabs. For this work the secondary cooling area of a continuous casting plant is important where the bending and straightening of the slabs take place. Due to that straightening at a temperature range of 900°C to 700°C, the ferrite forms as thin films arround the austenite grains. This deformation induced ferrite is softer than the austenite grains which causes that the strain becomes concentrated in these films during straightening. The result is that the thin ferrite films can induce transversal cracks [1]. In this study the influence of the deformation induced ferrite to the so called 2nd ductility minimum [2], which occurs during the cooling of a continuously cast slab of a plain carbon steel is examined in detail. Furthermore the deformation induced ferrite formation is investigated by means of hot tensile and compression tests at different temperatures and strain rates. 1. Materials and experiments Table 1 lists the chemical composition of the investigated heats E17-854 and A15-723. Table 1: Concentration of the main elements for heat E17-854 and A15-723
Heat C Si Mn Nb Al N E17-854 0,16 0,44 1,53 0,016 0,03 0,005 A15-723 0,14 0,006 1,13 <0,001 0,04 0,002
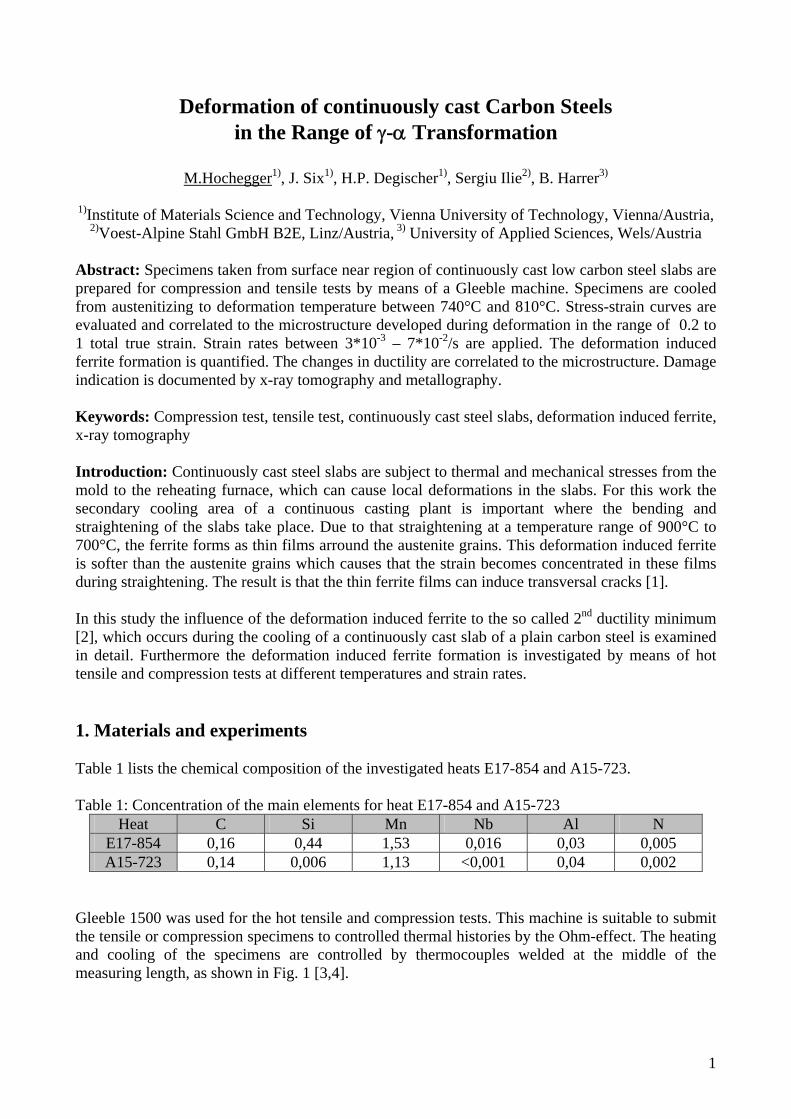
Gleeble 1500 was used for the hot tensile and compression tests. This machine is suitable to submit the tensile or compression specimens to controlled thermal histories by the Ohm-effect. The heating and cooling of the specimens are controlled by thermocouples welded at the middle of the measuring length, as shown in Fig. 1 [3,4].
2
Fig. 2 shows the temperature path for the specimens taken from the relatively fine grained regions close to the surface of the continuous casting slabs: from room temperature at 20K/s to 900°C then at 10K/s up to 1250°C, after 60s holding, cooling at 1K/s to a test temperature, where the specimen was strained after a 30s holding at strain rates between 3x10⁻³/s and 0,3/s until rupture. The phase transformation temperatures were determined at the heating/cooling condition (Fig. 2) of the specimens by dilatometer tests (specimen Ø4×20 mm). Fig. 1: Tensile specimen with thermocouples Fig. 2: Heating path of the specimens X-ray computer tomography (XCT) was accomplished at the University of Applied Sciences in Wels/Austria by the means of a rayscan 250 XE. Table 2 shows the XCT settings [5][6]. Table 2: X-ray computer tomography settings Sample ∅ Anode - Current- Integration Voxel- tension time size 8 mm 195 kV 50 μA 4 s (8 μm)3 The XCT data evaluation was executed with the VGStudio MAX 1.2.1. software. 2. Results and discussion 2.1 Compression tests Light optical micrographs in Fig. 3 compare the ferrite film formation after the same degree of straining at different temperatures with the undeformed microstructure exhibiting original γ-grain size of>0.5mm. At 780°C fine grained recrystallized regions are observed. At 740°C and 750°C the ferrite film formation at original γ-grain boundaries is observed and at deformation bands the frequency of which increases with decreasing temperature.
15
Φ8
M10
thermocouples
° °
indentation for strain measuring
16,5
900
t (s)
T (°C)
20 K/s
1250°C, 60s
10 K/s
1 K/s Td, 30s
12501080°C, 60s
for dilatometry
to RT
tensile test
quenched
3
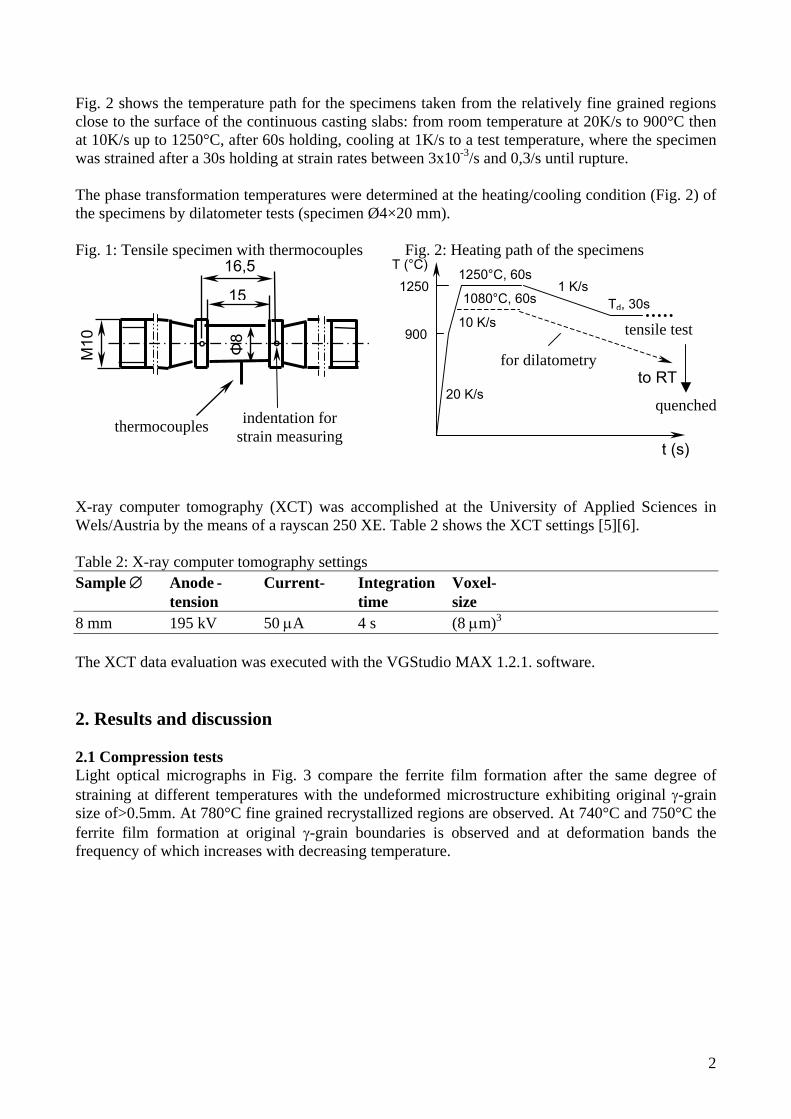
Fig. 3: Light optical micrographs of deformed and undeformed heat A15-723 at three different temperatures: a) 740°C/ϕ=0,5, b) 750°C/ϕ=0,5, c) 780°C/ϕ=0,5; d) 780°C/ϕ=0 (without deformation, but same thermal history)
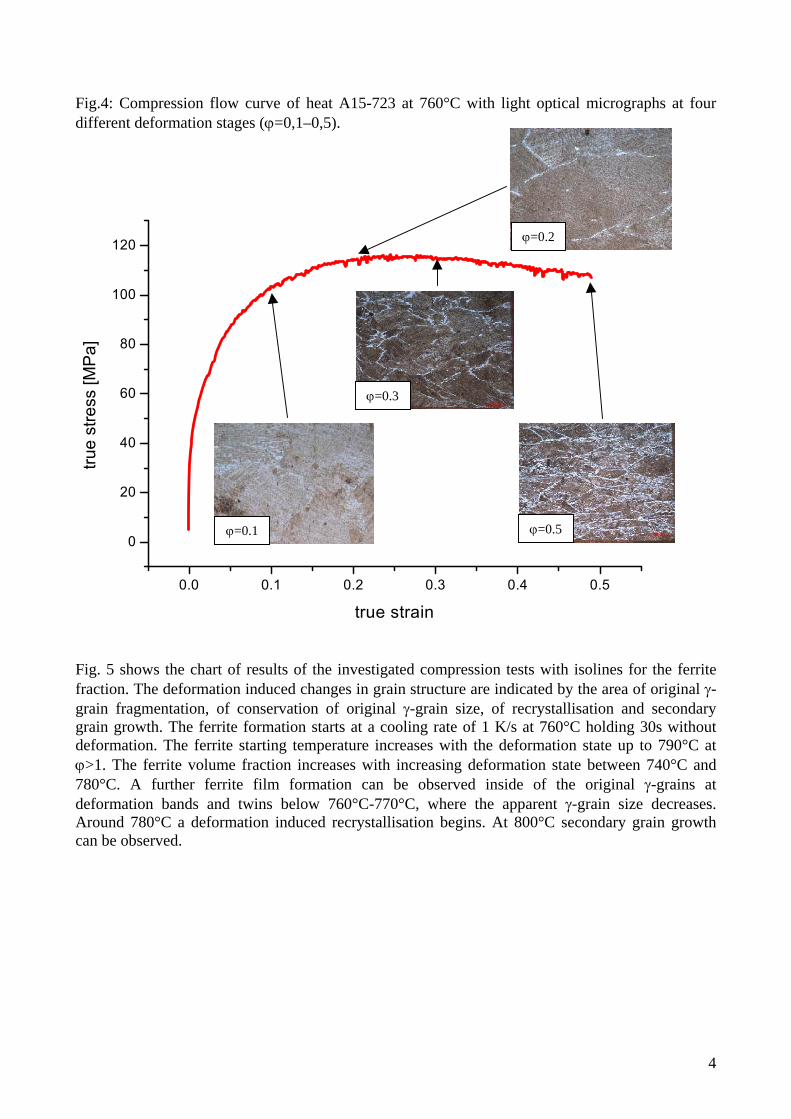
Fig. 4 shows the compression flow curve of heat A15-723 at 760°C with light optical micrographs after quenching from four different deformation stages. Depending on the deformation stage the amount of deformation induced ferrite increases with ϕ. At ϕ=0.1 almost no ferrite can be observed but the original γ-grains measure a few hundred µm in diameter. At ϕ=0.2 the original γ-grain boundaries are clearly decorated by ferrite films. The ferrite films appear denser at ϕ=0.3 which indicates γ-grain fragmentation by twinning and deformation bands. This tendency increases as seen at ϕ=0.5. At ϕ>0.2 softening can be observed in the flow curve.
200µm
200µm200µm
200µmd)c)
b)a)
4
Fig.4: Compression flow curve of heat A15-723 at 760°C with light optical micrographs at four different deformation stages (ϕ=0,1–0,5).
0.0 0.1 0.2 0.3 0.4 0.5
0
20
40
60
80
100
120
true
stre
ss [M
Pa]
true strain
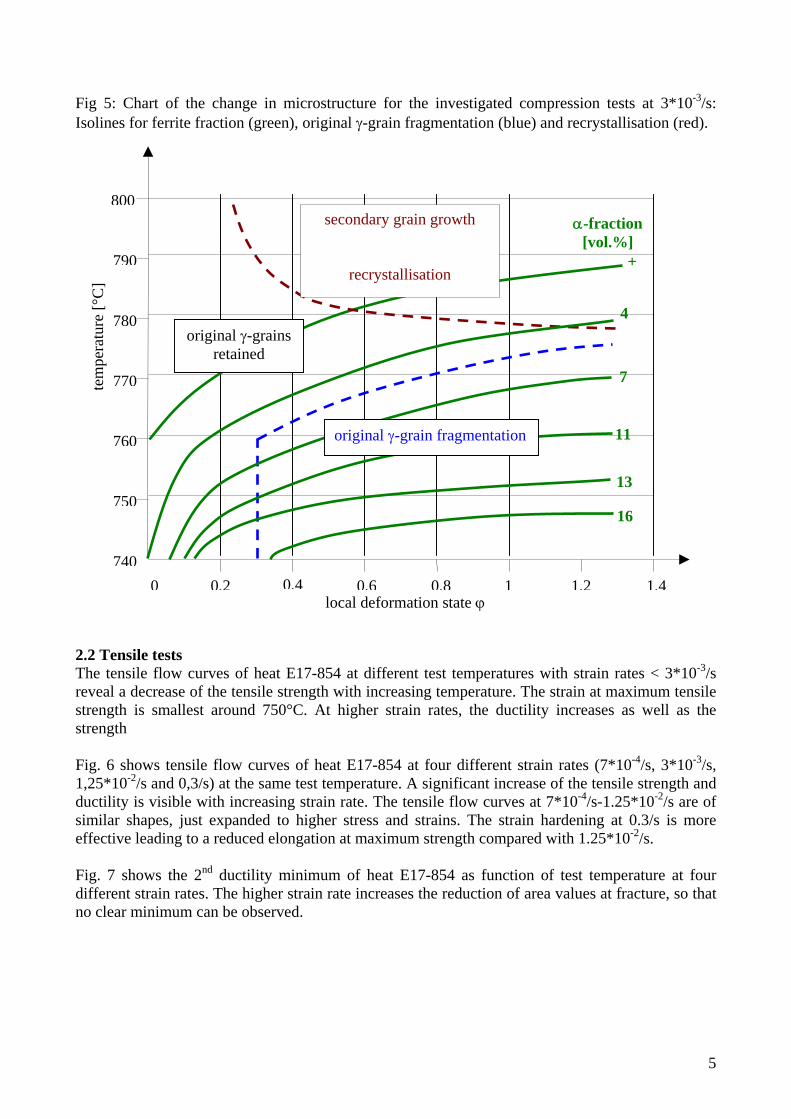
Fig. 5 shows the chart of results of the investigated compression tests with isolines for the ferrite fraction. The deformation induced changes in grain structure are indicated by the area of original γ-grain fragmentation, of conservation of original γ-grain size, of recrystallisation and secondary grain growth. The ferrite formation starts at a cooling rate of 1 K/s at 760°C holding 30s without deformation. The ferrite starting temperature increases with the deformation state up to 790°C at ϕ>1. The ferrite volume fraction increases with increasing deformation state between 740°C and 780°C. A further ferrite film formation can be observed inside of the original γ-grains at deformation bands and twins below 760°C-770°C, where the apparent γ-grain size decreases. Around 780°C a deformation induced recrystallisation begins. At 800°C secondary grain growth can be observed.
ϕ=0.1 ϕ=0.5
ϕ=0.2
ϕ=0.3
5
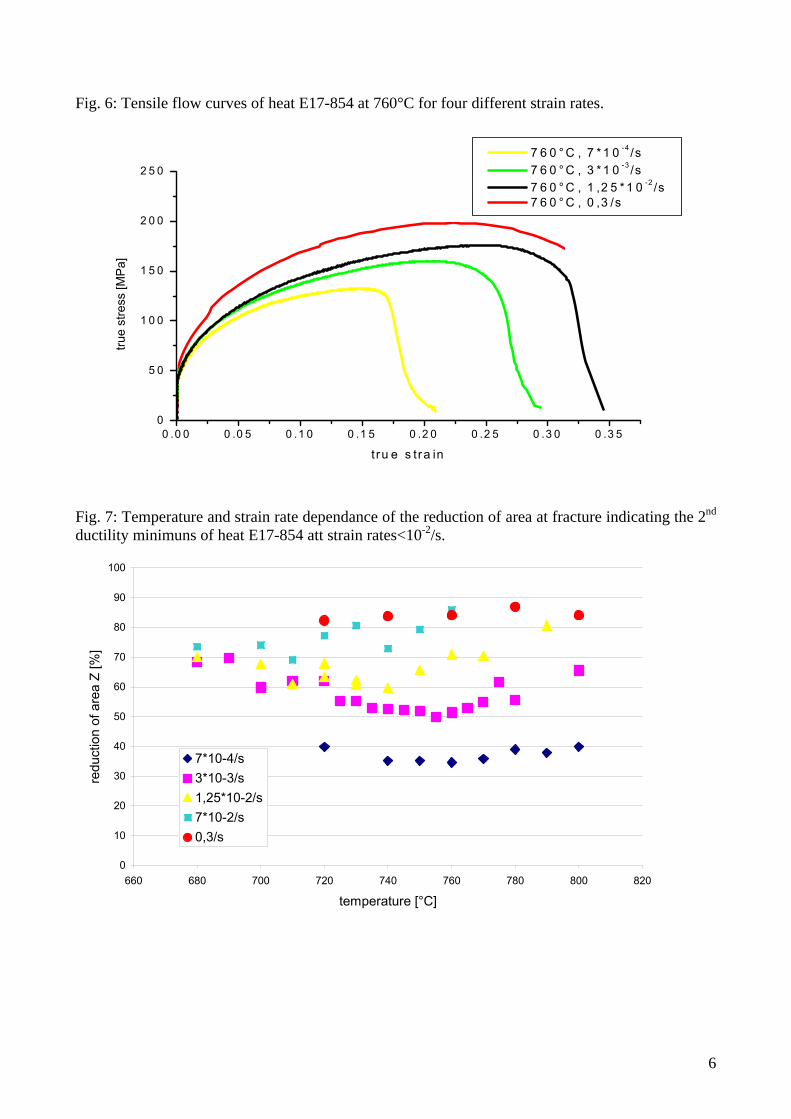
Fig 5: Chart of the change in microstructure for the investigated compression tests at 3*10-3/s: Isolines for ferrite fraction (green), original γ-grain fragmentation (blue) and recrystallisation (red). 2.2 Tensile tests The tensile flow curves of heat E17-854 at different test temperatures with strain rates < 3*10-3/s reveal a decrease of the tensile strength with increasing temperature. The strain at maximum tensile strength is smallest around 750°C. At higher strain rates, the ductility increases as well as the strength Fig. 6 shows tensile flow curves of heat E17-854 at four different strain rates (7*10-4/s, 3*10-3/s, 1,25*10-2/s and 0,3/s) at the same test temperature. A significant increase of the tensile strength and ductility is visible with increasing strain rate. The tensile flow curves at 7*10-4/s-1.25*10-2/s are of similar shapes, just expanded to higher stress and strains. The strain hardening at 0.3/s is more effective leading to a reduced elongation at maximum strength compared with 1.25*10-2/s. Fig. 7 shows the 2nd ductility minimum of heat E17-854 as function of test temperature at four different strain rates. The higher strain rate increases the reduction of area values at fracture, so that no clear minimum can be observed.
+
0 0,2 0,4 0,6 0,8 1 1,2 1,4
800
790
780
770
760
750
740
local deformation state ϕ
tem
pera
ture
[°C
]
secondary grain growth
recrystallisation
7
α-fraction [vol.%]
4
11
13
16
original γ-grain fragmentation
original γ-grains retained
6
Fig. 6: Tensile flow curves of heat E17-854 at 760°C for four different strain rates.
0 .0 0 0 .0 5 0 .1 0 0 .1 5 0 .2 0 0 .2 5 0 .3 0 0 .3 50
5 0
1 0 0
1 5 0
2 0 0
2 5 0 7 6 0 ° C , 7 * 1 0 -4 /s 7 6 0 ° C , 3 * 1 0 -3 /s 7 6 0 ° C , 1 ,2 5 * 1 0 -2 /s 7 6 0 ° C , 0 ,3 /s
true
stre
ss [M
Pa]
t r u e s tra in
Fig. 7: Temperature and strain rate dependance of the reduction of area at fracture indicating the 2nd ductility minimuns of heat E17-854 att strain rates<10-2/s.
0
10
20
30
40
50
60
70
80
90
100
660 680 700 720 740 760 780 800 820
temperature [°C]
redu
ctio
n of
are
a Z
[%]
7*10-4/s3*10-3/s1,25*10-2/s7*10-2/s0,3/s
7
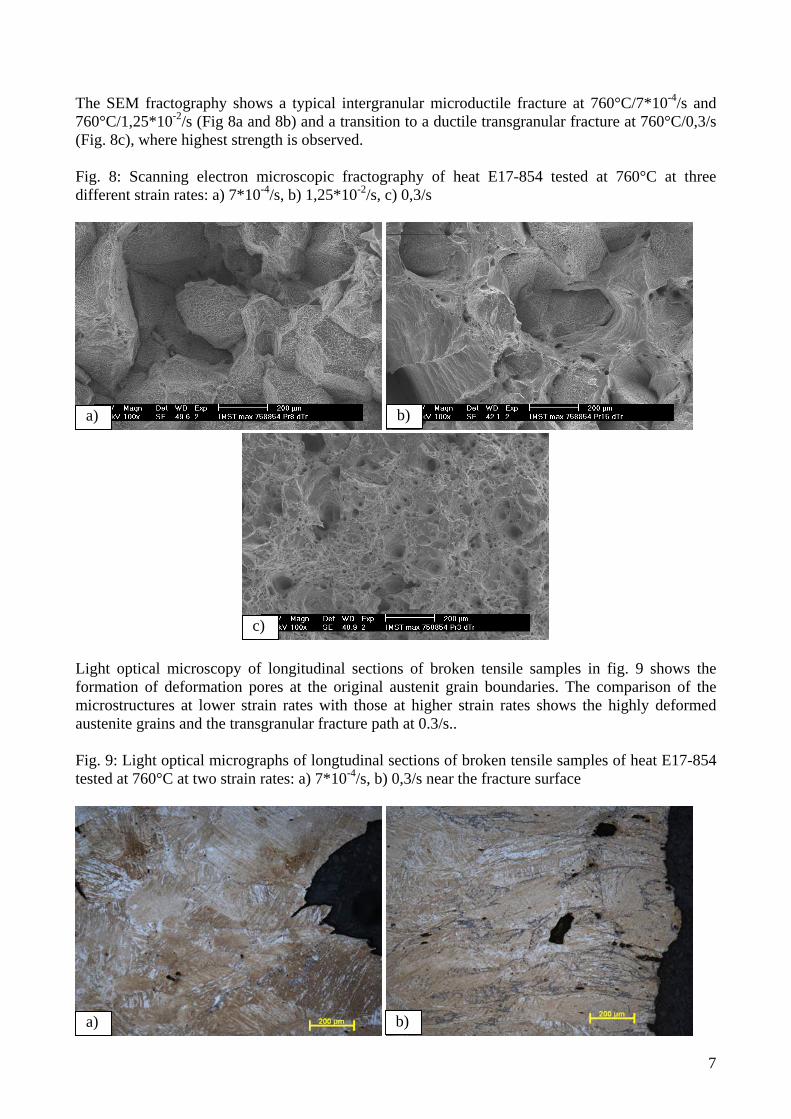
The SEM fractography shows a typical intergranular microductile fracture at 760°C/7*10-4/s and 760°C/1,25*10-2/s (Fig 8a and 8b) and a transition to a ductile transgranular fracture at 760°C/0,3/s (Fig. 8c), where highest strength is observed. Fig. 8: Scanning electron microscopic fractography of heat E17-854 tested at 760°C at three different strain rates: a) 7*10-4/s, b) 1,25*10-2/s, c) 0,3/s
Light optical microscopy of longitudinal sections of broken tensile samples in fig. 9 shows the formation of deformation pores at the original austenit grain boundaries. The comparison of the microstructures at lower strain rates with those at higher strain rates shows the highly deformed austenite grains and the transgranular fracture path at 0.3/s.. Fig. 9: Light optical micrographs of longtudinal sections of broken tensile samples of heat E17-854 tested at 760°C at two strain rates: a) 7*10-4/s, b) 0,3/s near the fracture surface
b)
b)a)
c)
a)
8
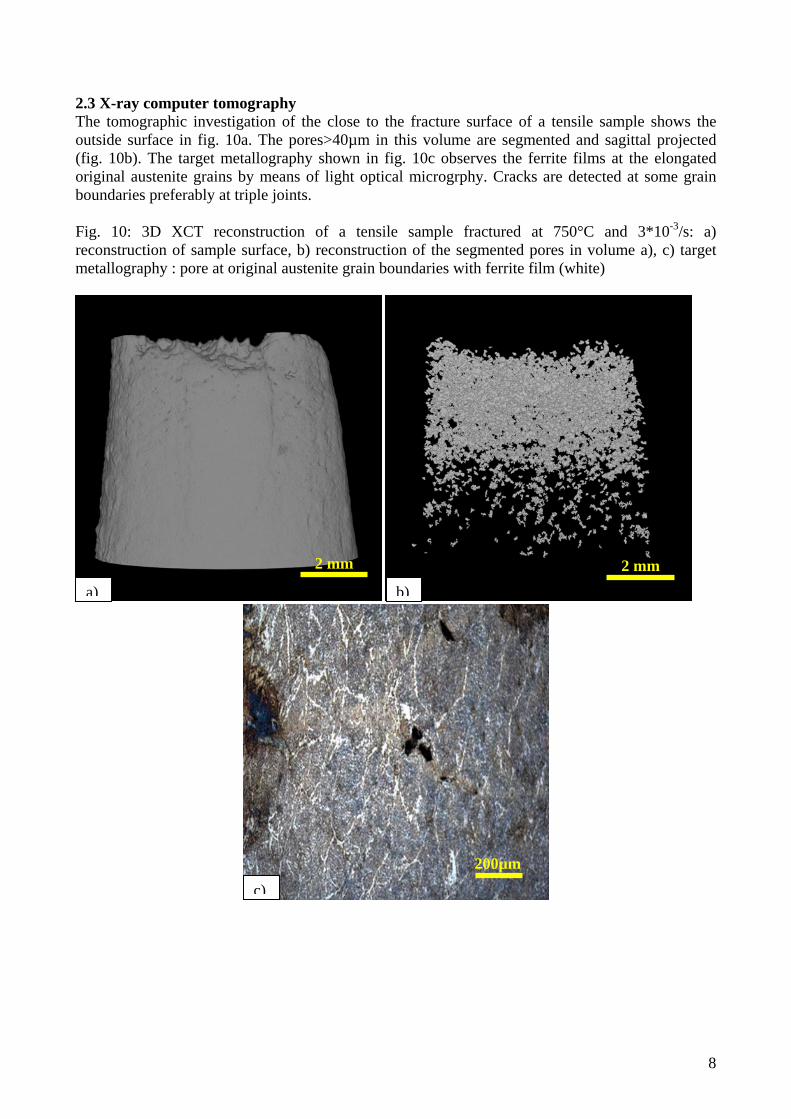
2.3 X-ray computer tomography The tomographic investigation of the close to the fracture surface of a tensile sample shows the outside surface in fig. 10a. The pores>40µm in this volume are segmented and sagittal projected (fig. 10b). The target metallography shown in fig. 10c observes the ferrite films at the elongated original austenite grains by means of light optical microgrphy. Cracks are detected at some grain boundaries preferably at triple joints. Fig. 10: 3D XCT reconstruction of a tensile sample fractured at 750°C and 3*10-3/s: a) reconstruction of sample surface, b) reconstruction of the segmented pores in volume a), c) target metallography : pore at original austenite grain boundaries with ferrite film (white)
c)
b)a)
2 mm 2 mm
200µm
9
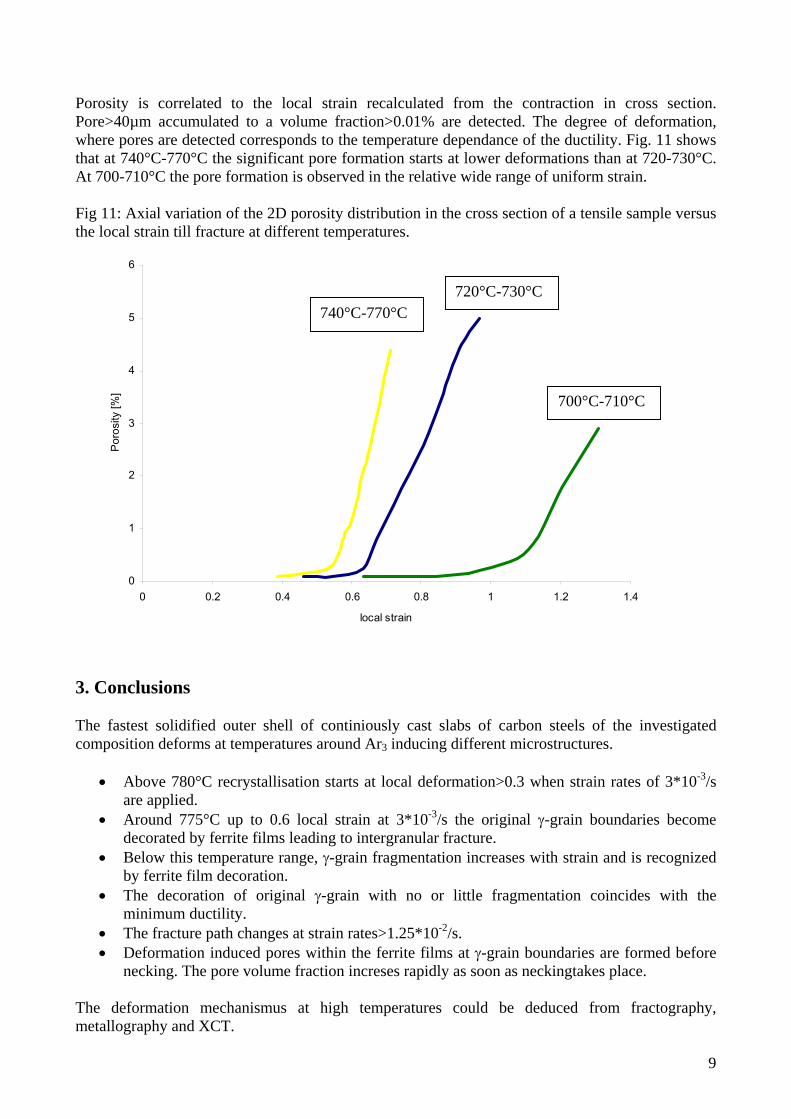
Porosity is correlated to the local strain recalculated from the contraction in cross section. Pore>40µm accumulated to a volume fraction>0.01% are detected. The degree of deformation, where pores are detected corresponds to the temperature dependance of the ductility. Fig. 11 shows that at 740°C-770°C the significant pore formation starts at lower deformations than at 720-730°C. At 700-710°C the pore formation is observed in the relative wide range of uniform strain. Fig 11: Axial variation of the 2D porosity distribution in the cross section of a tensile sample versus the local strain till fracture at different temperatures.
0
1
2
3
4
5
6
0 0.2 0.4 0.6 0.8 1 1.2 1.4
local strain
Por
osity
[%]
3. Conclusions The fastest solidified outer shell of continiously cast slabs of carbon steels of the investigated composition deforms at temperatures around Ar3 inducing different microstructures.
• Above 780°C recrystallisation starts at local deformation>0.3 when strain rates of 3*10-3/s are applied.
• Around 775°C up to 0.6 local strain at 3*10-3/s the original γ-grain boundaries become decorated by ferrite films leading to intergranular fracture.
• Below this temperature range, γ-grain fragmentation increases with strain and is recognized by ferrite film decoration.
• The decoration of original γ-grain with no or little fragmentation coincides with the minimum ductility.
• The fracture path changes at strain rates>1.25*10-2/s. • Deformation induced pores within the ferrite films at γ-grain boundaries are formed before
necking. The pore volume fraction increses rapidly as soon as neckingtakes place.
The deformation mechanismus at high temperatures could be deduced from fractography, metallography and XCT.
740°C-770°C720°C-730°C
700°C-710°C
10
Acknowledgement The authors are very indebted to voestalpine steel Linz for the provision of material and the financial support of this work. References
[1] B. Mintz, J. Lewis, J.J. Jonas, Importance of deformation induced ferrite and factors which control its formation, Materials Science and Technology, Vol. 13, May 1997, pp 379-388
[2] B. G. Thomas, J. K. Brimacombe, et al: The formation of panel cracks in steel ingots: a state-o-the-art review, ISS Transactions, Vol. 7, 1986, S7-20
[3] B. Yang, H.P. Degischer, H. Presslinger, G. Xia, P. Reisinger, Influence of Chemical Composition on High Temperature Tensile Properties of Carbon Steels, BHM, Heft 9, 150.Jg.(2005), pp 313-320
[4] B. Yang, H.P. Degischer, H. Presslinger, G. Xia, Hot toughness of continuously cast steel slabs during reheating, Steel Res. Int., 2007
[5] B.Harrer, J. Kastner, A. Kottar, H. P. Dgischer,‚ Charakterisierung von Inhomogenitäten in metallischen Gusswerkstoffen mittels 3D-Röntgen-Computertomografie, Deutsche Gesellschaft für zerstörungsfreie Prüfung e.V., (2007), ISBN: 978-3-931381-98-1; Paper-Nr. 94, 11 S.
[6] M. Hochegger, B. Harrer, H. P. Degischer, Sergiu Ilie, Röngten-Computertomografie der Verformungsporen in Warmzugproben aus Baustahlbrammen, Sbd. Prakt. Metallogr. 40, DGM Werkstoffinformationsg mbH, (2008), in press


![DIRECT AND REVERSE MARTENSITIC TRANSFORMATION AND ... · deformation (SPD) of metastable austenitic steels we observe direct ( o) and ( ) martensitic transformations (MTs) [1-3]](https://img.dokumen.tips/doc/110x75/5fedd562ca3da635561e7efc/direct-and-reverse-martensitic-transformation-and-deformation-spd-of-metastable.jpg)