Embed Size (px)
Citation preview
Please cite this paper as:
Inderst, G., Kaminker, Ch., Stewart, F. (2012), “Defining and Measuring Green Investments: Implications for Institutional Investors‟ Asset Allocations”, OECD Working Papers on Finance, Insurance and Private Pensions, No.24, OECD Publishing.
OECD WORKING PAPERS ON FINANCE, INSURANCE
AND PRIVATE PENSIONS, NO. 24
DEFINING AND MEASURING GREEN INVESTMENTS: IMPLICATIONS FOR INSTITUTIONAL INVESTORS’ ASSET ALLOCATIONS
August 2012
2
OECD WORKING PAPERS ON FINANCE, INSURANCE AND PRIVATE PENSIONS OECD Working Papers on Finance, Insurance and Private Pensions provide timely analysis and background on industry developments, structural issues, and public policy in the financial sector, including insurance and private pensions. Topics include risk management, governance, investments, benefit protection, and financial education. These studies are prepared for dissemination in order to stimulate wider discussion and further analysis and obtain feedback from interested audiences. The papers are generally available only in their original language English or French with a summary in the other if available.
OECD WORKING PAPERS ON FINANCE, INSURANCE AND PRIVATE PENSIONS are published on www.oecd.org/daf/fin/wp
This document and any map included herein are without prejudice to the status of or sovereignty over any
territory, to the delimitation of international frontiers and boundaries and to the name of any territory, city or area.
Ce document et toute carte qu'il peut comprendre ne préjugent en rien du statut de tout territoire, de la souveraineté s’exerçant sur ce dernier, du tracé des frontières et limites internationales, et du nom de tout territoire, ville ou région.
* Georg Inderst is an independent consultant acting on behalf of the OECD. Christopher Kaminker is an economist.in
the OECD‟s Environment Directorate. Fiona Stewart is a principal administrator in the Financial Affairs Division of
the OECD„s Directorate for Financial and Enterprise Affairs. The views expressed are the sole responsibility of the
authors and do not reflect those of their organisations or the governments of OECD Member countries. The authors
are solely responsible for any errors.
3
DEFINING AND MEASURING GREEN INVESTMENTS: IMPLICATIONS FOR
INSTITUTIONAL INVESTORS’ ASSET ALLOCATIONS
By Georg Inderst , Christopher Kaminker and Fiona Stewart
TABLE OF CONTENTS
EXECUTIVE SUMMARY ............................................................................................................................. 6
I. Background ........................................................................................................................................... 9 II. Definitions ....................................................................................................................................... 10
1. Defining „green‟ .............................................................................................................................. 10 2. Defining „investment‟ ..................................................................................................................... 12
Green assets vs. green overlays .......................................................................................................... 14 Strategic asset allocation approaches .................................................................................................. 14 Green investment approaches ............................................................................................................. 14 Green in the Context of SRI/ ESG ...................................................................................................... 14 Motivations ......................................................................................................................................... 15
III. Green Investment by Asset Class .................................................................................................... 19 1. Green Equities ................................................................................................................................. 21
Green equity indices ........................................................................................................................... 22 2. Green bonds .................................................................................................................................... 26
Definitional Debates and Initiatives ................................................................................................... 28 3. Green private equity and infrastructure ........................................................................................... 30
Alternative asset classes ..................................................................................................................... 30 Cleantech private equity ..................................................................................................................... 31 Defining low-carbon, climate resilient infrastructure ......................................................................... 33
IV. Measuring Institutional Investors‟ Green Investment ..................................................................... 35 V. Conclusions ..................................................................................................................................... 38
REFERENCES .............................................................................................................................................. 42
APPENDIX 1: EXAMPLES OF GREEN EQUITY INDICES .................................................................... 45
APPENDIX 2: INVESTOR INITIATIVES ................................................................................................. 50
WORKING PAPERS PUBLISHED TO DATE ........................................................................................... 54

4
Tables
Table 1. Motivations for Green Investing ............................................................................................ 16 Table 2. Deutsche Bank Climate Change Investment Universe .......................................................... 21 Table 3. Green equity indices - Overview ........................................................................................... 22 Table 4. Selection approaches ............................................................................................................. 23 Table 5. Green equity indices: definitions and constituents ................................................................ 24 Table 6. Prequin Infrastructure Database ............................................................................................ 31 Table 7. Examples of Sustainable Strategies among Funds ................................................................ 35 Table 8. estimates of market volumes in green and ESG assets .......................................................... 36
Figures
Figure 1. Relative Share and Total Assets by Type of Institutional Investors in OECD (1995-2010) ... 9 Figure 2. Green investment pyramid..................................................................................................... 13 Figure 3. Number of sustainable energy public equity funds launched, 2000-2012 ............................. 26 Figure 4. Pension fund and direct insurers asset allocation for selected investment categories in ..........
selected OECD countries, 2010 ............................................................................................. 27 Figure 5. Global Total new investment in clean energy (2004-11, USD Billions) ............................... 33
Boxes
Box 1. Definitions from other Sectors ....................................................................................................... 11
Box 2. Investor Surveys ............................................................................................................................. 17
5
Abstract
DEFINING AND MEASURING GREEN INVESTMENTS: IMPLICATIONS FOR
INSTITUTIONAL INVESTORS’ ASSET ALLOCATIONS
This definitional, stocktaking paper aims to provide a comprehensive review of the concepts and
definitions related to „green‟ investments that are currently used in the market place. The purpose of this
research is not to take a position on a specific definition but rather to explore what is being generally used,
whether there are commonalties and inconsistencies, and what lessons can be drawn from this analysis.
The paper examines how „green‟ investments are defined across different asset classes (equities,
bonds and alternative investments), as well as providing some estimates of the size of these investments.
The paper concludes that, given the lack of consensus on the usage and definition of the term „green‟, the
most productive approach could be to take an open and dynamic stance towards definitions and standards,
with international institutions and governments adopting a „governance approach to green investment‟.
JEL codes: G15, G18, G23, G28, J26
Keywords: pension funds, green bonds, socially responsible investment (SRI), environmental, social and
governance (ESG)
Résumé
Ce document à caractère définitionnel et d‟inventaire vise à fournir une revue complète des concepts et
définitions liés aux investissements « verts » utilisés actuellement sur le marché. L‟objectif de cette
recherche n‟est pas de prendre position pour une définition particulière mais plutôt d‟explorer ce qui est
généralement utilisé, s‟il existe des points communs et des incohérences et quelles leçons peuvent être
tirées de cette analyse.
Le document examine comment les investissements « verts » sont définis à travers différentes classes
d‟actif (actions, obligations and investissements alternatifs) et fournit également certaines estimations de la
taille de ces investissements. Le document conclut que, étant donné le manque de consensus autour de
l‟usage et de la définition du terme « vert », l‟approche la plus productive pourrait être d‟adopter une
attitude ouverte et dynamique au regard des définitions et des standards, les institutions internationales et
les gouvernements pouvant adopter „une approche de gouvernance pour l‟investissement vert‟.
Codes JEL: G15, G18, G23, G28, J26
Mots clés: fonds de pension, obligations vertes, investissement socialement responsable (ISR),
l‟environnement, le social/sociétal et la gouvernance (ESG)
6
EXECUTIVE SUMMARY
In support of OECD work on private financing of green growth, long-term investment and the role of
institutional investors, this definitional, stocktacking paper aims to fill a hole in the literature by providing
a comprehensive review of the concepts and definitions related to „green‟ investments (also variously
referred to as „clean‟, „sustainable‟, and „climate change‟ investments) that are currently used in the market
place. The purpose of this research is not to take a position on a specific definition but rather to explore
what is being generally used, whether there are commonalties and inconsistencies, and what lessons can
be drawn from this analysis.
It investigates two main questions:
1. Is there a broad consensus around the definitions or is the term used in different ways by different
investors and in different contexts?
2. Can a proposal be constructed for a broad definition of „green investment‟ and possibly a „green
standard‟ or check list?
Since institutional investors use a multitude of approaches, both at the macro and micro level of
decision-making, the paper finds that it is therefore unlikely that an agreement can be found on an all-
encompassing and exact operational definition of „green investment‟.
A principal driver for a consensus around definitions for green investments is to support easy
preferencing of thematic investments. Thematic investing is about capitalising on future trends –
identifying (and profiting from) the winners and, just as importantly, avoiding (or underweighting) the
losers. Its forward-looking nature stands in clear contrast to the more widely used approach of market-
capitalisation investing where it is implicitly assumed that the past winners will continue to win out and
therefore deserve more attention and weight in the portfolio. Therefore, the argument frequently made is
that if governments aim to shift or scale up private capital into a thematic area (such as green growth),
clarity – and low cost - of definition (or standards) makes placement of funds more likely, helping to
accelerate the desired shift. It essentially allows thematic screening to be commoditised.
Before looking into whatlevel of consensus exists on definitions, it is necessary to understand what
precisely is meant by „green‟ and „investment‟. In terms of „green‟, some definitions are very broad and
generic, others are more technical and specific. Nonetheless, a sizeable common intersection exists of the
various definitions, but there are also some areas of controversy and uncertainty. The devil is still in the
detail on what exactly is included and what is not. Nor is there clarity around the appropriate metric for
„greenness‟.
Green „investment‟ is a very broad term. It can be stand-alone, a sub-set of a broader investment
theme or closely related to other investment approaches such as SRI (socially responsible investing), ESG
(environmental, social and governance investing), sustainable, long-term investing or similar concepts.
Investors‟ attention to climate change, resource efficiency and green issues in general, has been rising
in recent years and investor initiatives in this respect are growing in support. The paper presents some key
findings of investor surveys on their actions and motivations.
There are fundamentally different investment approaches applied by investors. Some investors use a
form of ESG or green „overlay‟ in the general investment process while others allocate a certain percentage
of assets to a specific green product or manager.
Green investment policies in use vary across asset classes. Sustainable investing has advanced most in
equities. An analysis of equity indices reveals a great variety of „green‟ methodologies applied across the
market place. Different approaches to selecting green investments have evolved over the years, in
particular (negative or positive) screening, green thematic investing and engagement with companies. In

7
effect, some favour investment in specialist green companies, while others are designed to filter out the
best companies within a sector, exclude certain „dirty‟ companies or to persuade „heavy polluters‟ to
change.
Green bonds are a relatively new development but are an area of growth. Some (broad and narrow)
definitions are being discussed in the financial industry, and a „Climate Bonds Standard‟ has been
proposed. In real estate, the focus is traditionally on the underlying characteristic of the assets, e.g. on the
energy efficiency of buildings.
Green factors have so far been less important in alternative asset classes. Nonetheless, green
investments have been growing over the past years, mostly in renewable energy or cleantech companies,
often via green private equity and infrastructure funds. Generally, the underlying definitions tend to be
very broad. Interestingly, investors have been less concerned about exact standards of what is „green‟ in
alternative assets classes, and have invested anyway.
The paper provides some indications on the market volume of green investments. It is important to
note that green investment has traditionally been mostly embedded within a broader approach. In fact, the
current investment volumes in ESG / SRI assets, estimated at over USD 10 trillion, are a multiple of those
in „pure‟ green investments (estimated in the tens or hundreds of billions, depending on the definition).
This constitutes an opportunity for the direction of funds to more specific climate change related investing.
To answer the second question, whether a broad definition or standard can be established, one strategy
could be to focus on the agreed commonalties, and to try to find a broad enough consensus to come up with
a basic definition. The risk to this approach is two-fold: either the definition would be too broad and
therefore (almost) meaningless; or the definition would be too narrow and may well be perceived as too
restrictive and constrain capital flows unnecessarily. Another strategy could be to focus on specific asset
classes where it is easier or more useful to have a common definition. Understanding the drivers behind
interest in these terms is a useful exercise. Clarity on this will allow for better reflection on the
efficaciousness of different current and prospective usages of the term.
However, it may be more productive for the cause (i.e. green growth, climate change policy, etc.) to
take an open and dynamic approach to definitions and standards. The science and the general
understanding of the environment, climate change and resource scarcity are evolving as are clean
technologies which are being developed and scaled-up to deal with these challenges. Markets are moving
rapidly. There are many environmental and investment experts trying to find good investment
opportunities. Any green definitions, standards and codes will therefore need to be adjusted over time.
A „competition of definition and standards‟ has the benefit of making productive use of the full
breadth of knowledge available. It may be beneficial for climate change-related investing across the full
range of opportunities, ranging from new funds for innovative ventures to shifting the economy into a
greener direction.
An open, dynamic strategy is to monitor the „competition‟ of definitions and encourage the
development of green standards in the market place. International institutions and governments could take
a „governance approach to green investment‟. This would mean an extension of the existing governance
frameworks of policy recommendations on corporate governance of companies, investments, pension
funds, infrastructure investments, etc.

8
Acknowledgements
The authors would like to thank their colleagues from the OECD who provided valuable
comments and review as well as external expert reviewers for their input, comments and guidance.
9
I. Background
It is estimated that transitioning to a low-carbon, climate resilient and resource-efficient economy, and
more broadly „greening growth‟ over the next 20 years to 2030 will require significant investment and
consequently private sources of capital on a much larger scale than previously.1
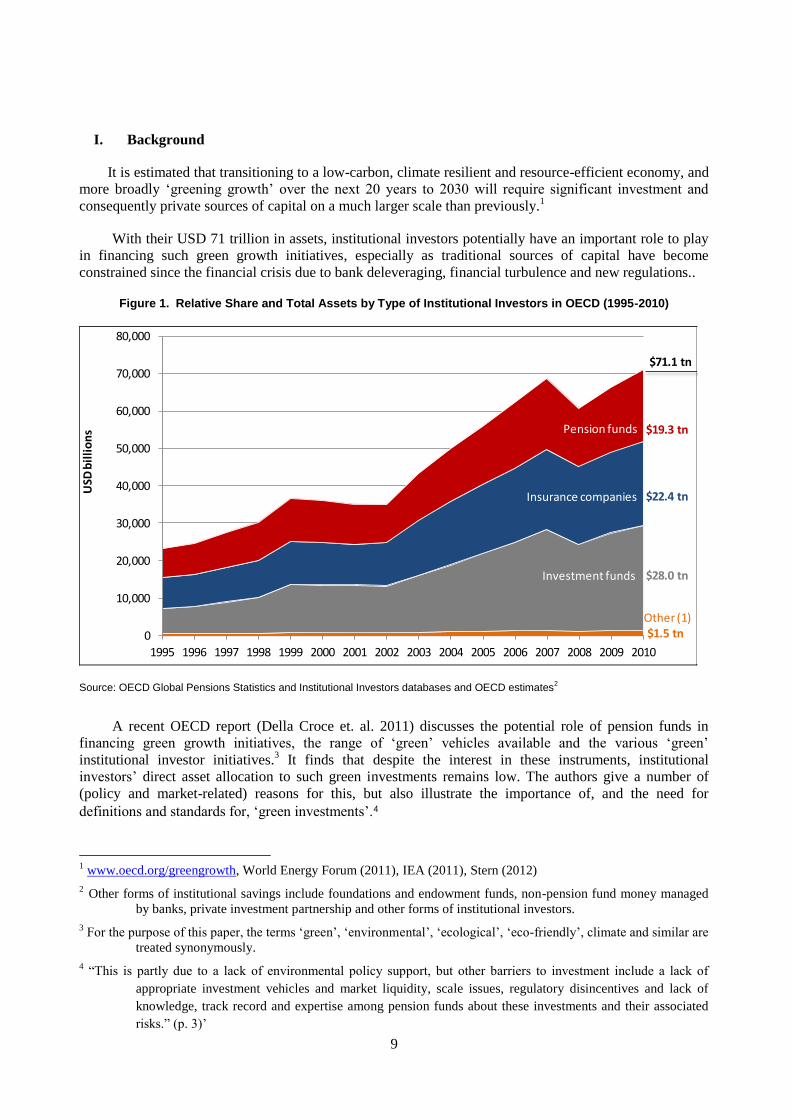
With their USD 71 trillion in assets, institutional investors potentially have an important role to play
in financing such green growth initiatives, especially as traditional sources of capital have become
constrained since the financial crisis due to bank deleveraging, financial turbulence and new regulations..
Figure 1. Relative Share and Total Assets by Type of Institutional Investors in OECD (1995-2010)
Investment funds
Insurance companies
Pension funds
0
10,000
20,000
30,000
40,000
50,000
60,000
70,000
80,000
1995 1996 1997 1998 1999 2000 2001 2002 2003 2004 2005 2006 2007 2008 2009 2010
USD
bil
lio
ns $19.3 tn
$22.4 tn
$28.0 tn
Other (1)$1.5 tn
$71.1 tn
Source: OECD Global Pensions Statistics and Institutional Investors databases and OECD estimates2
A recent OECD report (Della Croce et. al. 2011) discusses the potential role of pension funds in
financing green growth initiatives, the range of „green‟ vehicles available and the various „green‟
institutional investor initiatives.3 It finds that despite the interest in these instruments, institutional
investors‟ direct asset allocation to such green investments remains low. The authors give a number of
(policy and market-related) reasons for this, but also illustrate the importance of, and the need for
definitions and standards for, „green investments‟.4
1 www.oecd.org/greengrowth, World Energy Forum (2011), IEA (2011), Stern (2012)
2 Other forms of institutional savings include foundations and endowment funds, non-pension fund money managed
by banks, private investment partnership and other forms of institutional investors.
3 For the purpose of this paper, the terms „green‟, „environmental‟, „ecological‟, „eco-friendly‟, climate and similar are
treated synonymously.
4 “This is partly due to a lack of environmental policy support, but other barriers to investment include a lack of
appropriate investment vehicles and market liquidity, scale issues, regulatory disincentives and lack of
knowledge, track record and expertise among pension funds about these investments and their associated
risks.” (p. 3)‟
10
“There is no unique definition among investors of what green investing entails. However, for the
purpose of this paper, „green‟ investments refer broadly to low carbon and climate resilient
investments made in companies, projects and financial instruments that operate primarily in the
renewable energy, clean technology, environmental technology or sustainability related markets as
well as those investments that are climate change specific.” (p. 11)
Among the policy recommendations, the report therefore recommends further work on the definition
and measurement of „green investments‟ in order to facilitate a common understanding among institutional
investors and governments, and measure the scale and evolutions of green investment over time.
Furthermore, governments should support the constitution of a „standard setter‟ or „rating agencies‟ to
approve, certify or rate green projects (or investment vehicles such as green bonds or green funds) to
ensure that funds are used for justifiably green investments.
This “call for action” has been included in the OECD Policy Framework for Green Infrastructure
Investment (see OECD forthcoming 2012).
“Finally standardizing and rating green investments is paramount to deliver transparency and market
liquidity alongside of environmentally sound outcomes.”
The OECD‟s recent work on Tracking Climate Finance (see Clapp et al. 2012) also pointed to the
need for clearer definitions on climate finance. Another OECD (2011a) report discusses the lack of agreed
international standards at the level of measuring and disclosing greenhouse gas emissions by companies.5
The OECD Policy Brief “Financing Climate Change Action” (OECD 2011b) sums up the key messages:
“Encourage good corporate governance, accountability and transparency on climate issues;
internationally harmonise greenhouse gas reporting standards at the company level. Standardise
definitions of low-carbon, climate-resilient or „green‟ investments to better guide investor behaviour.”
(p. 1)
The issue of uncertainty as to what is „green‟, the lack of data, credible standards, transparency and
similar points also come up regularly in institutional investor surveys when asked about the main barriers
to green investing (e.g. EDHEC 2010, IIGCC et. al. 2011, Scholtens 2011).
II. Definitions
There are hundreds of definitions for green investments in circulation and use, and it would be futile
to try to list and compare even a fraction of them. The purpose of this research is not to take a position on a
specific definition but rather to explore what is being commonly used in the market place, whether there
are commonalties and inconsistencies, and what lessons can be drawn from this analysis.
Opinions differ not only on the definition of „green‟ but also on what is meant by „investment‟. It is
therefore more productive to approach the question in two stages.
1. Defining ‘green’
Definitions of „green‟ can be explicit or implicit. Some are very broad and generic, others are more
technical and specific. Some are investment-driven, others come out of ecological or ethical discussions.
The „greenness‟ of assets can be postulated in absolute terms (a good or technology is green or not green)
or in relative terms (e.g. one company has lower greenhouse gas emissions than another or is more energy-
5 “Requesting companies to measure and disclose emission-related information is also an important tool for policy
makers. At present however, there are no internationally agreed standards for reporting and corporate
climate change-related information. Addressing these concerns will require greater cooperation across
governments to improve the consistency of GHG reporting methodologies.” (p. 17)
11
efficient). Green investments are invariably conflated with climate change mitigation or adaptation, and the
definitions focusing around climate change are more uniform as they can to a certain extent be deduced
from the science about how to address climate change.
Definitions of „green‟ can be based on ex ante arguments (e.g. any activity in sustainable energy,
energy efficiency or water management), or based on specific indicators. There are qualitative and
quantitative definitions, trying to measure different grades of „greenness‟. The latter requires some sort of
indicator or measure of greenness (e.g. greenhouse gas emissions, energy efficiency, recycling and waste
management, more points in a scoring system, etc.). A purpose for the investment is key in order to pin
green criteria down, as it allows for the navigation of potential conflicts such as debates between aesthetics
and wind energy.
The question of defining „green‟ is, of course, neither new nor restricted to institutional investing. It is
useful to look at work already undertaken in related areas, and the lessons that can be learnt. Some
examples are provided in Box 1.
Box 1. Definitions from other Sectors
Macroeconomic definition of green investment A recent IMF Working Paper by Eyraud et. al. (2011) refers to green investment as “the investment necessary to reduce greenhouse gas and air pollutant emissions, without significantly reducing the production and consumption of non-energy goods” (p. 5). It covers both public and private investment. There are three main components of green investment: Low-emission energy supply (including renewable energy, bio fuels and nuclear); energy efficiency (in energy supply and energy-consuming sectors); and carbon capture and sequestration (including deforestation and agriculture).
Defining trade in green goods and services In international trade, development aid and other fields, the understanding of „green‟ is often restricted to “a matter of what you produce, not how you produce it or how use of the good affects the environment relative to substitutes for that good” (Golub et. al. 2011), p. 18). Eurostat (2009) go further and propose a definition that includes not only goods and services but also technologies. They are divided into „environmental protection activities‟ and „resource management activities‟. Defining and measuring green FDI The OECD (Golub et. al. 2011) has started work on defining and measuring green foreign direct investment (FDI) with the aim to provide a statistical foundation in support of government‟s efforts to evaluate the role of private sector investment flows and to assess policy performance in providing a framework for green investment.
FDI is generally recognized as an important source of financing and of transfer of technology and know-how between countries. However, little is known about the magnitude of FDI„s contribution to green growth, and this is largely due to the lack of an internationally agreed definition of and relevant data on „green‟ FDI. A number of obstacles are identified. Many goods and services have multiple (green and non-green) uses. Also, firms may produce a variety of green and non-green products. Finally, green activity may be associated not just with a particular product or service but a green technology or process. Activities and actors can be separated. It appears easier to clearly define an activity as green or not, but more difficult to certify an actor as „green‟ – although perhaps some ESCOs (Energy Service Company) could be so defined. The authors draw on other efforts to identify green industries and processes in international trade and aid (including those of UNCTAD and Eurostat). As a result, a two-part definition of „green FDI‟ is proposed:
1) FDI in environmental goods and services (EGS) sectors, and 2) FDI in environmental-damage mitigation processes, i.e. use of cleaner and/or more energy-efficient
technologies.
In terms of part 1 of the definition, the authors find: “There is general agreement that the production of renewable energy is a green activity, including wind, solar, hydropower, biomass, geothermal and ocean energy (…) These account for the bulk of the renewable energy sector. The major exception is nuclear power, which elicits controversy: it is a low-carbon source of energy but entails other risks related to waste treatment, national security and release of radiation.” (p. 23)
12
Furthermore, there is no consensus in some areas such as co-generation, hydrogen and waste, as these are usually by-products of industries which themselves contribute substantially to greenhouse gas emissions. Green FDI services
include water and wastewater treatment and waste management, air pollution control, soil and water remediation and noise abatement. As far as part 2 of the definition is concerned, the focus is on FDI in sectors that have significant environmental spillovers (agriculture, manufacturing, mining, forestry, transport, construction and energy). However, formulation of a useful metric is found to be very complex. Defining green patents
Researchers of the European Patent Office and OECD (2011c) have developed a „tagging‟ scheme for a number of climate change mitigation technologies. They are grouped into 7 categories:
General environmental management (including waste management, air and water pollution abatement, soil remediation
Renewable energy (including bio fuels)
Combustion technologies for improved efficiency
Climate change mitigation (e.g. capture, storage, sequestration, disposal of GHG)
Indirect contribution (e.g. energy storage)
Transportation (emissions abatement, efficiency)
Buildings (energy efficiency).
As a further example, the UK Government is in the process of setting up a Green Investment Bank,
an investment bank solely dedicated to greening the economy. It defines the priority sectors they will
invest in as: offshore wind power generation, commercial and industrial waste processing and recycling,
energy from waste generation, non-domestic and domestic energy efficiency.6
A lot of effort has already gone into defining „green‟ in different economic and policy areas. The
answers are not without problems, and likely to change over time. Nonetheless, some conclusions can be
drawn:
There are a number of different operational definitions of „green‟ in place for different economic
and government activities.
There appears to be a sizeable common intersection of the various definitions in terms of some
sectors (e.g. renewable energy), commodities (e.g. carbon or renewable energy credits) services
(e.g. waste management) and technologies (e.g. to enhance energy efficiency).
There are some areas of major controversy (e.g. nuclear and large-scale hydro energy), changing
consensus (e.g. biofuels, biomass, shale gas), ambiguity (e.g. agriculture, green IT, financial
services, waste) or uncertainty how to deal with (e.g. biodiversity, conservation).
Defining „greenness‟ appears easier for specific goods or services than for technologies and
processes of making companies and the economy in general „greener‟.
It often remains unclear as to what the (implicit or explicit) metric for „greenness‟ is, or should be
(for a discussion of environmental metrics see, e.g., Salo 2012) The same is true for the assessment
of the actual impact.
2. Defining ‘investment’
A lot of actions are referred to as „investment‟, and this creates considerable confusion also for the
definition of green investments.
6 See http://www.bis.gov.uk/policies/business-sectors/low-carbon-business-opportunities/gib/faq
13
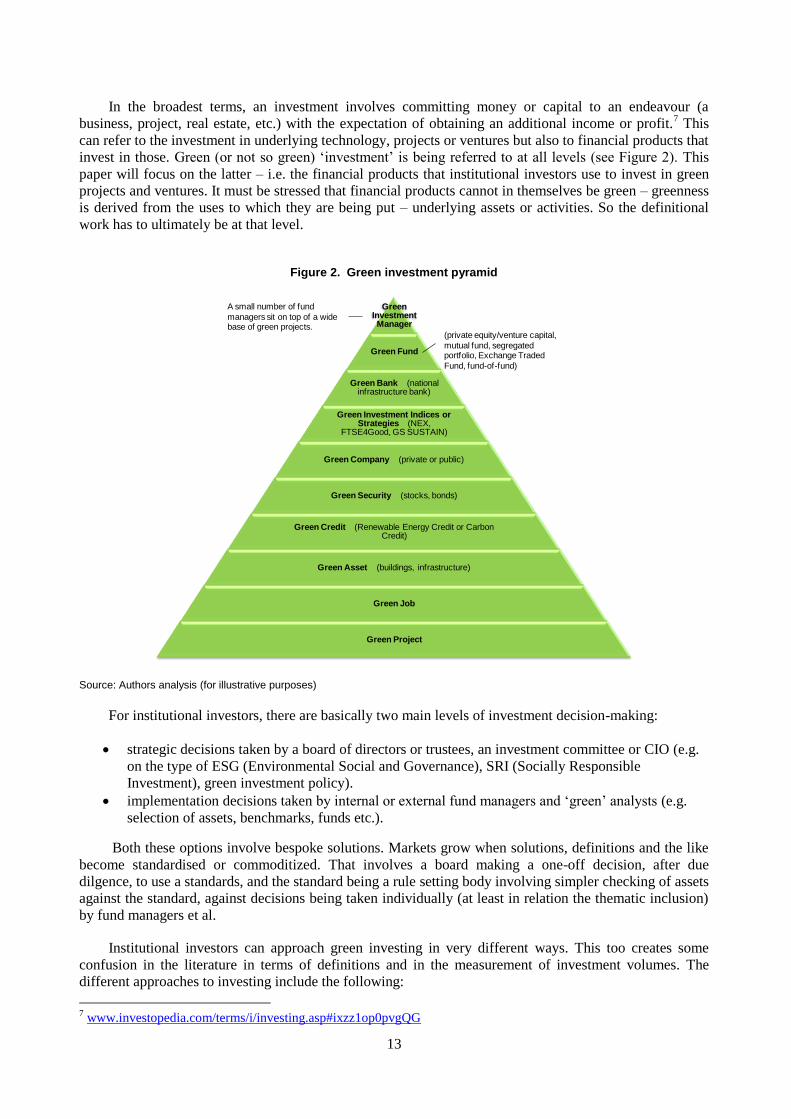
In the broadest terms, an investment involves committing money or capital to an endeavour (a
business, project, real estate, etc.) with the expectation of obtaining an additional income or profit.7 This
can refer to the investment in underlying technology, projects or ventures but also to financial products that
invest in those. Green (or not so green) „investment‟ is being referred to at all levels (see Figure 2). This
paper will focus on the latter – i.e. the financial products that institutional investors use to invest in green
projects and ventures. It must be stressed that financial products cannot in themselves be green – greenness
is derived from the uses to which they are being put – underlying assets or activities. So the definitional
work has to ultimately be at that level.
Figure 2. Green investment pyramid
Source: Authors analysis (for illustrative purposes)
For institutional investors, there are basically two main levels of investment decision-making:
strategic decisions taken by a board of directors or trustees, an investment committee or CIO (e.g.
on the type of ESG (Environmental Social and Governance), SRI (Socially Responsible
Investment), green investment policy).
implementation decisions taken by internal or external fund managers and „green‟ analysts (e.g.
selection of assets, benchmarks, funds etc.).
Both these options involve bespoke solutions. Markets grow when solutions, definitions and the like
become standardised or commoditized. That involves a board making a one-off decision, after due
dilgence, to use a standards, and the standard being a rule setting body involving simpler checking of assets
against the standard, against decisions being taken individually (at least in relation the thematic inclusion)
by fund managers et al.
Institutional investors can approach green investing in very different ways. This too creates some
confusion in the literature in terms of definitions and in the measurement of investment volumes. The
different approaches to investing include the following:
7 www.investopedia.com/terms/i/investing.asp#ixzz1op0pvgQG
Green Investment Manager
Green Fund
Green Bank (national infrastructure bank)
Green Investment Indices or Strategies (NEX,
FTSE4Good, GS SUSTAIN)
Green Company (private or public)
Green Security (stocks, bonds)
Green Credit (Renewable Energy Credit or Carbon Credit)
Green Asset (buildings, infrastructure)
Green Job
Green Project
(private equity/venture capital,
mutual fund, segregated portfolio, Exchange Traded
Fund, fund-of-fund)
A small number of fund
managers sit on top of a wide base of green projects.
14
Green assets vs. green overlays
Green „investments‟ refer to assets that are in some way defined as „green‟, e.g. a renewable energy
company, or a thematic green fund managing assets, or a carbon credit. However, green „investing‟ can
also be undertaken in the form of an investment overlay, e.g. the integration of climate change or ESG
elements in the general investment approach or legal SRI compliance.
The terminology varies across the industry. A similar distinction has been made for ESG investing
using the terms (Urwin 2010): „integrated ESG‟ versus „targeted ESG‟. The former refers to the use of
ESG parameters in the general investment process, the latter to specific mandates, products or managers.
Strategic asset allocation approaches
At the level of strategic asset allocation, a number of key decisions need to be made. First, in the form
of an ESG / SRI / green overlay in the general investment process (e.g. „all managers need to integrate
environmental considerations in their analysis‟). Second, the decision can be to allocate a certain
percentage of total assets to green investments. Third, trustees decide to set certain targets for green
investments within the different asset classes. Fourth, a decision is made about the type of green
investment. Fifth, the implementation may be delegated to mainstream managers or to go to specialist
green managers.
Green investment approaches
Investment managers then implement the strategic decisions in their mandates or funds. Over the
years, a number of different approaches have developed. The main strands are:
1. Negative screening, exclusion of undesirable products (e.g. tobacco, palm oil) or sectors (e.g. the
arms industry, nuclear industry)
2. Positive screening or selection of assets (e.g. with the help of filters)
3. Investment in „green themes‟
4. Engagement, activism, voting (to make companies greener)
5. Integration of green / ESG factors in general investment analysis
These approaches are not mutually exclusive. Investors often use a combination of different green and
ESG approaches.
Green in the Context of SRI/ ESG
„Green‟ investment can be stand-alone, a sub-set of a broader investment theme or closely related to
other investment approaches:
Green (eco-friendly, climate change, etc.) investing
the „E‟ in ESG (environmental, social and governance) investing
thematic investing (in green sectors or themes such as water, agriculture)
SRI (socially or sustainable responsible investing)
RI (responsible investing)
SI (sustainable investing), sustainable capitalism
Impact investing (including microfinance)
Long-term investing
Universal ownership concept
Double or triple bottom-line investing (with financial, social and ecological goals).
15
There is no agreement on how exactly all these terms relate to each other.8 They are not mutually
exclusive and can be complementary, but they can also be „competing‟, at least in parts. For example, a
clean tech company could have problems with human rights or labour laws, a well-governed company
doing good community work may be a serious polluter. Even within the „E‟ sector, a company producing a
green good may use substandard processes from a green perspective, and vice versa. Companies can also
“offset” their emissions or “green” aspects of their value chain through the purchase of emission reduction
credits, carbon credits or renewable energy certificates.9
Sometimes, two or more concepts are applied at the same time by investors. The preferences for the
various concepts vary across countries and investors, and historical, cultural and regulatory reasons play
their role.
These concepts have evolved rapidly over time, and are continuously changing. SRI and ESG came
up strongly in the 1990s with a strong focus on governance issues but generally also include environmental
factors. In the 2000s, sustainability and long-term investing became popular. Some green funds have been
around since the 1980s and 1990s but it has been climate change and elevating concerns about natural
resource depletion and resource efficiency (e.g. McKinsey 2011) that brought the big boost to green
investing in recent years. Lately, the concepts of impact investing, universal ownership and sustainable
capitalism have been introduced. It is certainly not easy for pension trustees and other investment decision
makers to find a good „Jack of all trades‟.
It is important to note that green investing has traditionally mostly been embedded in a broader
investment approach. Therefore, it would be unwise to restrict any analysis only to what is explicitly
declared as „green investment‟ in a pure form. To simplify the discussion for the purposes of this paper,
„green‟ is considered a subset of ESG, SRI, responsible, sustainable or similar investment approaches that
are all being treated synonymously.
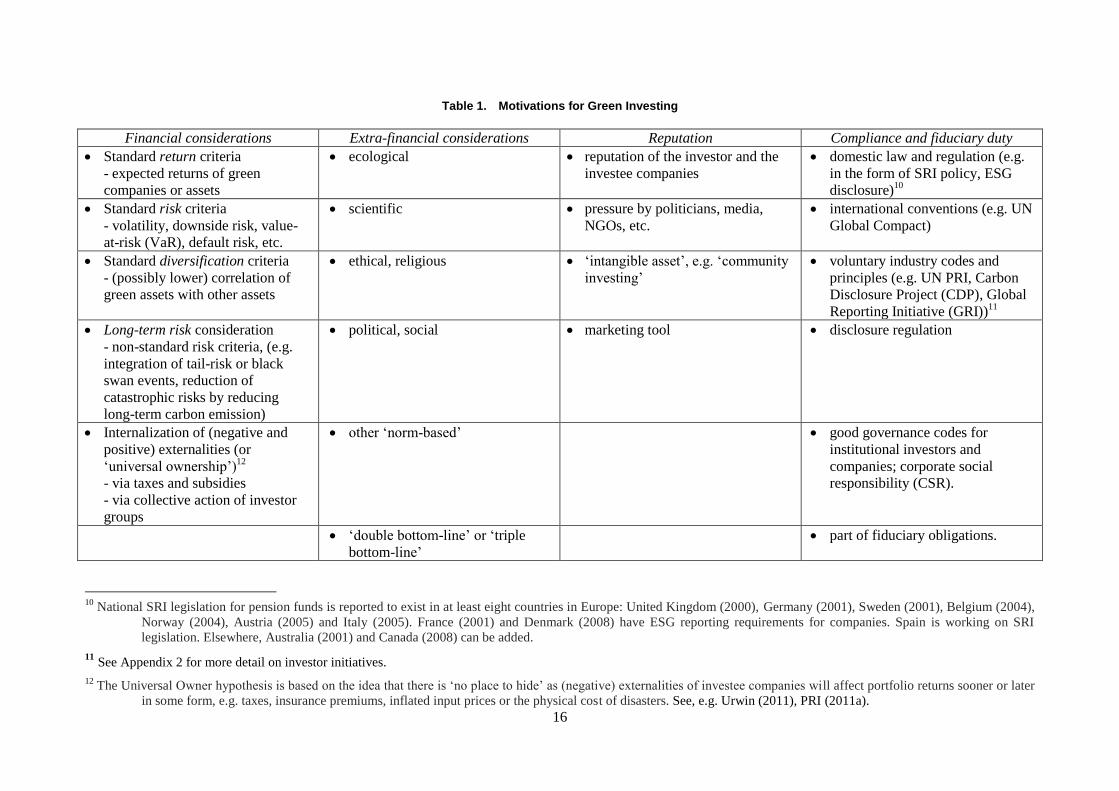
Motivations
Motivations for green investment also differ. It is important to be aware of the different motivations
on the side of green investors because this will shape their definition and understanding of what „green
investment‟ is.
8 For a discussion, see, e.g., EDHEC (2010), Staub-Biswang (2012).
9 For example, in U.S. States with Renewable Portfolio Standards, electricity generators that do not operate
renewables can even “green” their “brown” electricity generation by purchasing renewable energy
certificates awarded to those companies or generators operating renewables.
http://www.epa.gov/greenpower/documents/gpp_basics-recs.pdf
16
Table 1. Motivations for Green Investing
Financial considerations Extra-financial considerations Reputation Compliance and fiduciary duty
Standard return criteria
- expected returns of green
companies or assets
ecological reputation of the investor and the
investee companies
domestic law and regulation (e.g.
in the form of SRI policy, ESG
disclosure)10
Standard risk criteria
- volatility, downside risk, value-
at-risk (VaR), default risk, etc.
scientific pressure by politicians, media,
NGOs, etc.
international conventions (e.g. UN
Global Compact)
Standard diversification criteria
- (possibly lower) correlation of
green assets with other assets
ethical, religious „intangible asset‟, e.g. „community
investing‟
voluntary industry codes and
principles (e.g. UN PRI, Carbon
Disclosure Project (CDP), Global
Reporting Initiative (GRI))11
Long-term risk consideration
- non-standard risk criteria, (e.g.
integration of tail-risk or black
swan events, reduction of
catastrophic risks by reducing
long-term carbon emission)
political, social marketing tool disclosure regulation
Internalization of (negative and
positive) externalities (or
„universal ownership‟)12
- via taxes and subsidies
- via collective action of investor
groups
other „norm-based‟ good governance codes for
institutional investors and
companies; corporate social
responsibility (CSR).
„double bottom-line‟ or „triple
bottom-line‟
part of fiduciary obligations.
10
National SRI legislation for pension funds is reported to exist in at least eight countries in Europe: United Kingdom (2000), Germany (2001), Sweden (2001), Belgium (2004),
Norway (2004), Austria (2005) and Italy (2005). France (2001) and Denmark (2008) have ESG reporting requirements for companies. Spain is working on SRI
legislation. Elsewhere, Australia (2001) and Canada (2008) can be added.
11 See Appendix 2 for more detail on investor initiatives.
12 The Universal Owner hypothesis is based on the idea that there is „no place to hide‟ as (negative) externalities of investee companies will affect portfolio returns sooner or later
in some form, e.g. taxes, insurance premiums, inflated input prices or the physical cost of disasters. See, e.g. Urwin (2011), PRI (2011a).
17
The motivations are not mutually exclusive. Different investors have different priorities, risk/return
profiles and rankings of motivations (see, e.g., discussions in Clearpath 2011). The specific rankings
depend on the legal environment, the institutions‟ own constitution and the preferences of the decision-
makers. For most companies and financial institutions financial considerations remain the primary concern.
On the other hand, a foundation, charity or SWF may well have explicit green policy or ethical targets.
There is a discussion about what „fiduciary duty‟ implies in terms of responsible investing.
Historically, it was sometimes argued that an SRI policy was incompatible with the fiduciary responsibility
to achieve the primary financial task such as a maximising returns or producing a stable pension or life
insurance for its participants. Therefore, „green investments‟ needed to be at least financially at par with a
non-green investment.
Amongst other work, Freshfields (2005) compiled a report for the UNEP Finance Initiative (UNEP
FI). It argued that different jurisdictions have different interpretations of the fiduciary responsibility of
pension funds and that integrating ESG factors is permissible. Some experts go further and believe there is
a duty for fiduciaries to consider ESG factors or even taking leadership in climate change action (e.g.
UNEP FI 2009, Richardson 2011, Woods 2009).
Investor Initiatives
There are a number of investor initiatives in this field that are trying to lead the way into green
investing. Many investors realize that individual action will have very limited impact on climate change
and other green macro issues, and have grouped in order to have a louder voice in the dialogue with
governments and the financial industry.
It is worth not just concentrating on the pure „green‟ initiatives but also include responsible,
sustainable and similar investment. Environmental factors constitute an essential part of them. There is a
range of networks for reasons of history, geography, scope and motivations. See Appendix 2 for more
detail in particular on their coverage and volumes.
Box 2. Investor Surveys
Investor surveys give insights into the relevance of different definitions, motivations and investment approaches currently used in practice. Clearly, such surveys have their limitations but are still useful in terms of forming a picture of the dynamics in the field.
SRI surveys
The European SRI Study (Eurosif 2011a) distinguishes core and broad SRI investing and finds that exclusions are most popular within core SRI, well ahead of positive screening (including best-in-class, thematic) strategies. Within broad SRI, integration is used most, followed by engagement. Overall, broad strategies are three times as popular as core strategies but there is a high variation across countries.
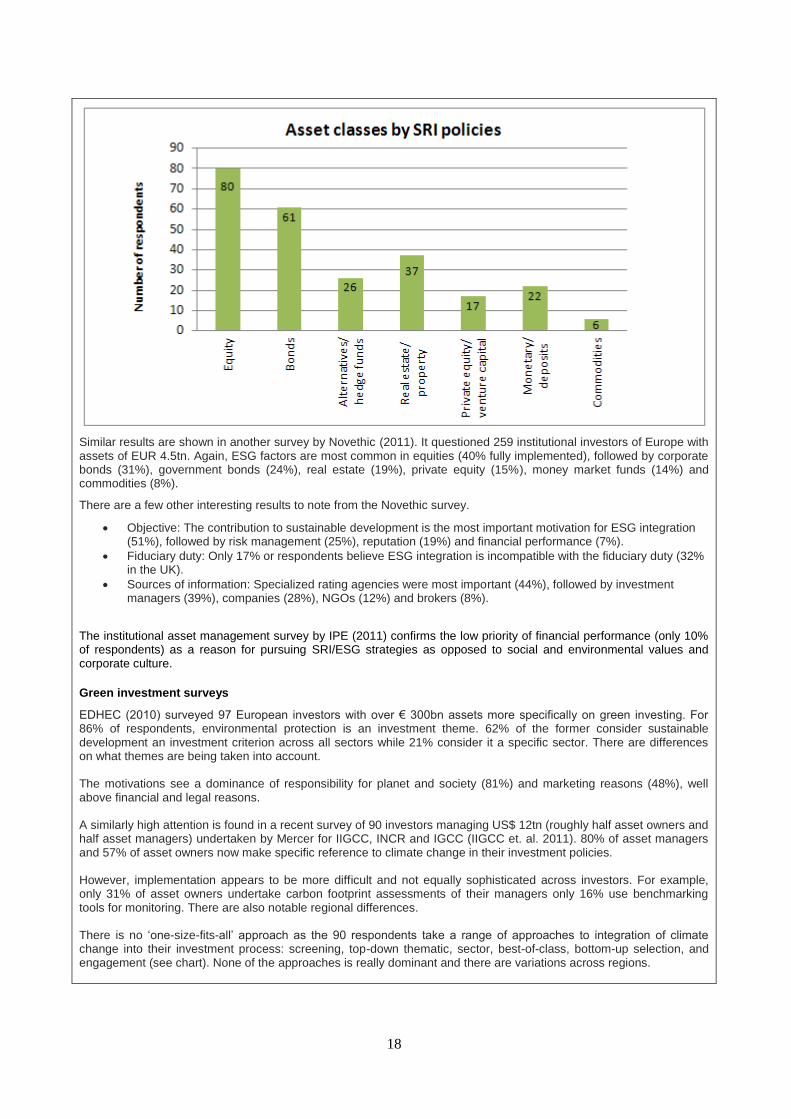
A survey of corporate pension funds (Eurosif 2011b) reports on the coverage of asset classes by SRI policies. Equities and bonds are well ahead of other asset classes (see chart).
18
Similar results are shown in another survey by Novethic (2011). It questioned 259 institutional investors of Europe with assets of EUR 4.5tn. Again, ESG factors are most common in equities (40% fully implemented), followed by corporate bonds (31%), government bonds (24%), real estate (19%), private equity (15%), money market funds (14%) and commodities (8%).
There are a few other interesting results to note from the Novethic survey.
Objective: The contribution to sustainable development is the most important motivation for ESG integration (51%), followed by risk management (25%), reputation (19%) and financial performance (7%).
Fiduciary duty: Only 17% or respondents believe ESG integration is incompatible with the fiduciary duty (32% in the UK).
Sources of information: Specialized rating agencies were most important (44%), followed by investment managers (39%), companies (28%), NGOs (12%) and brokers (8%).
The institutional asset management survey by IPE (2011) confirms the low priority of financial performance (only 10% of respondents) as a reason for pursuing SRI/ESG strategies as opposed to social and environmental values and corporate culture.
Green investment surveys
EDHEC (2010) surveyed 97 European investors with over € 300bn assets more specifically on green investing. For 86% of respondents, environmental protection is an investment theme. 62% of the former consider sustainable development an investment criterion across all sectors while 21% consider it a specific sector. There are differences on what themes are being taken into account. The motivations see a dominance of responsibility for planet and society (81%) and marketing reasons (48%), well above financial and legal reasons. A similarly high attention is found in a recent survey of 90 investors managing US$ 12tn (roughly half asset owners and half asset managers) undertaken by Mercer for IIGCC, INCR and IGCC (IIGCC et. al. 2011). 80% of asset managers and 57% of asset owners now make specific reference to climate change in their investment policies. However, implementation appears to be more difficult and not equally sophisticated across investors. For example, only 31% of asset owners undertake carbon footprint assessments of their managers only 16% use benchmarking tools for monitoring. There are also notable regional differences. There is no „one-size-fits-all‟ approach as the 90 respondents take a range of approaches to integration of climate change into their investment process: screening, top-down thematic, sector, best-of-class, bottom-up selection, and engagement (see chart). None of the approaches is really dominant and there are variations across regions.

19
The integration of climate change issues is most widespread for listed equities. Real estate, private equity and corporate bonds range in the middle while there is still little „green analysis‟ for government bonds, commodities and hedge funds. Thematic investments in climate change funds is still relatively small, i.e. 0.3% or US$ 63bn among respondents. Asset owners have invested most commonly in thematic climate-related private equity funds, followed by listed equity and infrastructure. PRI (2011b) reports that cleantech is the most popular ESG theme, followed by water (see chart). The survey gives also information of what are considered the major challenges and hurdles. They range from more clarity in public policy to issues of data, disclosure and education. One particular point is the disappointment about the development of the carbon markets.
III. Green Investment by Asset Class
Green investment policies are not equally applied to all asset classes. Sustainable investing has
traditionally been applied most in equities.13
In recent years, however, the attention has also turned to
bonds, real estate, alternative assets, and also a climate change-related overall asset allocation process.
Asset allocation process
While investing in green themes or funds has a certain tradition, approaching green investing at the
level of asset classes is quite new. It has been spurred by the intensifying discussion about investor action
against climate change and the potential opportunities available in the transition to a low carbon and
resource efficient economy. The idea is to differentiate the „greenness‟ of entire asset classes and adjust
investment policy accordingly.
Mercer (2011) evaluates the implications of climate change on institutional asset allocation. It notes
that traditional strategic asset allocation (SAA), while key to the determination of portfolio management
outcomes, fails to take account of climate change. An assessment framework for climate change risk is
developed with three dimensions: 1. low carbon technology; 2. impact of climate change itself on
investments and; 3. cost of emissions resulting from policy changes.
13
For example, Mercer‟s global ESG rating process of fund managers covers 5175 strategies, 57% of them in listed
equities, 20% fixed income and the remaining 23% across alternatives (Mercer 2012b). Overall, only 9%
of strategies receive top ratings. The highest percentage of 26% is in private equity, partly due to the
expanding coverage of renewable equity and cleantech funds.
30%
21%
13% 13% 13%
0%
5%
10%
15%
20%
25%
30%
35%
Cleantech Water Global health
Sustainable forestry
Microfinance
Proportion of signatories investing in different themed funds
20
The report evaluates the climate-sensitivity of different asset classes under different scenarios and
finds that allocations to sustainable equities, energy efficiency and renewable energy technologies in listed
and unlisted assets, timberland and agricultural land could improve portfolio performance and resilience to
climate change.14
The follow-on report, Mercer (2012a), surveys investors‟ actions in this respect and provides some
investor examples of adjusting asset allocation to portfolios that support climate change action. Anecdotal
evidence confirms that investments into infrastructure, timber, land and other „real assets‟, are increasing
and are a popular theme for considerations other than just climate change.
Blackrock, the world‟s largest asset manager launched a renewable power investment group in 2011
stating that renewable power projects represent a compelling investment opportunity for the investment
community by providing access to an asset class that potentially combines sought-after investment
characteristics of several different types of investments. Other investors mention green bonds or
sustainable real estate as well as the integration of climate risk into the ESG and general investment
process.
A strategic asset allocation approach to climate risk sensitivity is receiving some attention in the
financial community. A recent report by DB Climate Change Advisors (2011) discusses the impact of
climate change on the risk and return prospects of a broad range of asset classes. Long-term investment
opportunities and /or climate risk protection are identified in some sectors of public and private equity (in
particular clean tech, energy efficiency), infrastructure, and fixed income portfolios tilted for carbon
management. Finally, a carbon overlay strategy using carbon offset credits can serve as a tool to achieve
carbon neutral positions and to add financial diversification benefits.
Investing in green assets provides new investment opportunities but also new specific investment
risks. Sullivan (2011) explicitly discusses the main uncertainties perceived by investors, in particular
(implicit and explicit policy risks and technology risks of low carbon investments.
In summing up, the analysis of the effect of climate change on different asset classes is still a nascent
field. It is difficult to determine the absolute and relative „greenness‟ of entire asset classes, and more work
needs to be done in this field. Such exercises risk becoming tautological when „sustainable equities‟ are
found to be beneficial in terms of climate change or green development. While an asset allocation approach
can move large amounts of capital relatively quickly, the debate will be on whether such an approach is too
crude and simplistic to deliver real environmental benefits in parallel with desired financial returns.
14
Sustainable equity refers to broad multi-themed listed equity companies that generate a substantial proportion
(typically more than 25%) of their earnings through sustainable activities. Sustainable activities at the
broadest level are those that seek to support sustainable economic development, enhancing quality of life
and safeguarding the environment.
Efficiency/renewables assets refers to both listed/unlisted sustainability-themed assets whose core activities
are theme specific and more concentrated in terms of exposure than are broad sustainability equity. This
includes (but is not limited to) energy efficiency, low energy transport, renewable energy, bioenergy,
carbon capture and storage, smart grid, water supply, usage; and management, waste management, hydro
energy, and geothermal, to name a few.
21
1. Green Equities
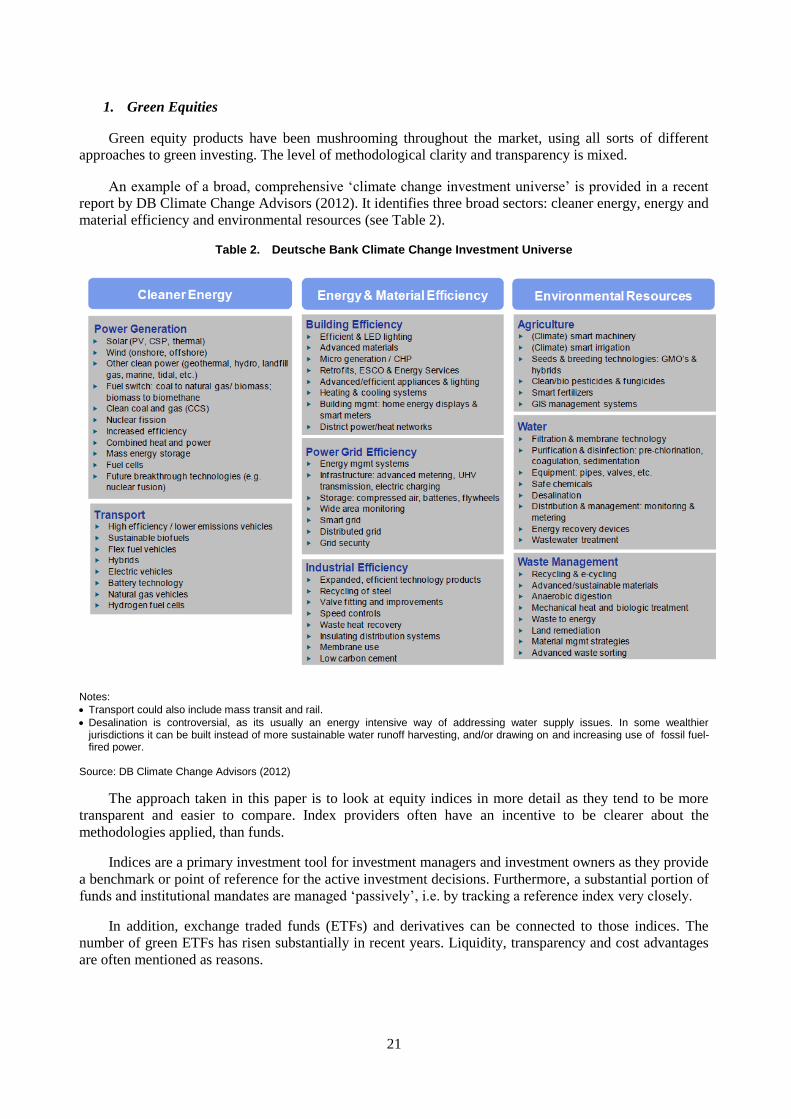
Green equity products have been mushrooming throughout the market, using all sorts of different
approaches to green investing. The level of methodological clarity and transparency is mixed.
An example of a broad, comprehensive „climate change investment universe‟ is provided in a recent
report by DB Climate Change Advisors (2012). It identifies three broad sectors: cleaner energy, energy and
material efficiency and environmental resources (see Table 2).
Table 2. Deutsche Bank Climate Change Investment Universe
Notes:
Transport could also include mass transit and rail.
Desalination is controversial, as its usually an energy intensive way of addressing water supply issues. In some wealthier jurisdictions it can be built instead of more sustainable water runoff harvesting, and/or drawing on and increasing use of fossil fuel-fired power.
Source: DB Climate Change Advisors (2012)
The approach taken in this paper is to look at equity indices in more detail as they tend to be more
transparent and easier to compare. Index providers often have an incentive to be clearer about the
methodologies applied, than funds.
Indices are a primary investment tool for investment managers and investment owners as they provide
a benchmark or point of reference for the active investment decisions. Furthermore, a substantial portion of
funds and institutional mandates are managed „passively‟, i.e. by tracking a reference index very closely.
In addition, exchange traded funds (ETFs) and derivatives can be connected to those indices. The
number of green ETFs has risen substantially in recent years. Liquidity, transparency and cost advantages
are often mentioned as reasons.

22
Green equity indices
All major index providers have over time developed some sort of SRI, ESG and/or environmental
change indices. There is now wide choice of equity indices available, using different approaches,
definition, composition, coverage and methodology.15
Table 3 gives an overview on some indices currently available to investors.16
Some indices have a
relatively narrow sectoral or thematic focus, e.g. on alternative energy or clean technology and innovation.
Others span the typical range of green activities, also including energy efficiency environmental
management and similar. Others again concentrate on just one factor, most prominently carbon emissions.
The oldest indices tend to be broader responsible or ESG indices that include environmental as important
but not sole factors. Details on the indices can be found in Appendix 1.
Table 3. Green equity indices - Overview
RI / SRI / ESG/ SI Green thematic Sectors Carbon related
FTSE FTSE4Good Series FTSE Environmental
Market FTSE CDP Carbon Strategy
Dow Jones DJ Sustainability
S&P S&P Eco S&P Clean Energy,
Alternative Energy S&P Carbon Efficient
MSCI MSCI ESG / SRI MSCI Climate;
Environmental
HSBC HSBC Climate Change
Bloomberg Bloomberg Clean Energy
Wilderhill Wilderhill New Energy
Innovation (NEX)
NASDAQ NASDAQ OMX
Green Economy
Markit Markit Carbon Disclosure
The preferences for indices differ across countries and investors. In Japan, there is a focus on
environmentally themed indices. Technology and social aspects (e.g. community investing) are popular in
the USA, whilst in Europe the interest has been generally broad across all responsible investment (RI)
approaches. Indices see rising demand for different strands and by all investor groups, driven also by
changes in legislation, regulation and government initiatives (e.g. „green ISAs‟ in the UK). (UKSIF 2010)
Indices also differ in terms of their approaches to selecting and weighting of the index constituents.
There are 3 basic approaches by index providers17
(Table 4):
1. screening: create a green / ESG / SRI subset of a broader market index
2. best-of-class: e.g. top 20% within sector or industry (sometimes with neutral sector or country
weightings)
3. re-weighting: adjust the weightings of stocks in a standard market index according to a green
(carbon) factor (usually keep sector weightings neutral to minimize tracking error).
15
It should be noted that green indices have been almost exclusively restrained to public equities. There are hardly
any green indices available for other asset classes, confirming how much more advanced market practices
are in equities. 16
The selection of indices is not exhaustive but does represent a broad range of common approaches. The description
of indices refers to the latest available information. For an earlier comparison of SRI indices, see Statman
(2006) who finds some variation in the emphasis on environmental themes across SRI indices.
17 Such approaches are, of course, not only used by index providers but are also applied by analysts to develop their
lists of preferred companies within investment houses (e.g. the peer group leaders in the GS Sustain focus
lists).
23
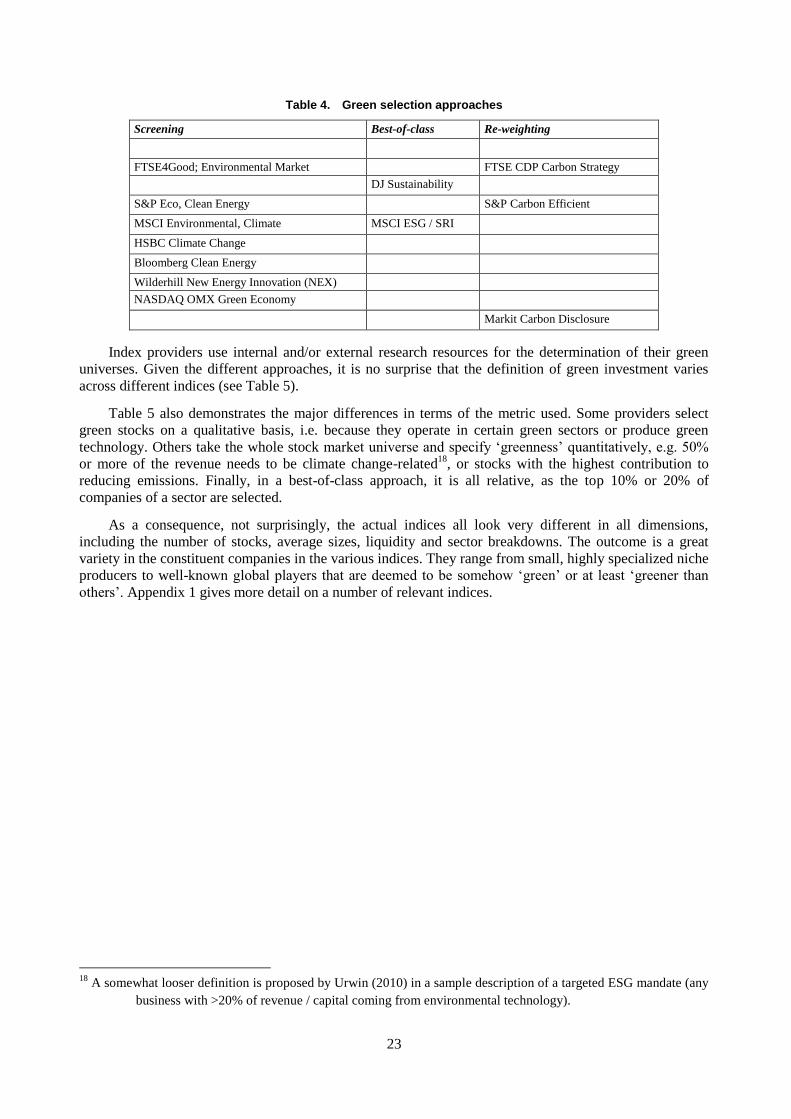
Table 4. Green selection approaches
Screening Best-of-class Re-weighting
FTSE4Good; Environmental Market FTSE CDP Carbon Strategy
DJ Sustainability
S&P Eco, Clean Energy S&P Carbon Efficient
MSCI Environmental, Climate MSCI ESG / SRI
HSBC Climate Change
Bloomberg Clean Energy
Wilderhill New Energy Innovation (NEX)
NASDAQ OMX Green Economy
Markit Carbon Disclosure
Index providers use internal and/or external research resources for the determination of their green
universes. Given the different approaches, it is no surprise that the definition of green investment varies
across different indices (see Table 5).
Table 5 also demonstrates the major differences in terms of the metric used. Some providers select
green stocks on a qualitative basis, i.e. because they operate in certain green sectors or produce green
technology. Others take the whole stock market universe and specify „greenness‟ quantitatively, e.g. 50%
or more of the revenue needs to be climate change-related18
, or stocks with the highest contribution to
reducing emissions. Finally, in a best-of-class approach, it is all relative, as the top 10% or 20% of
companies of a sector are selected.
As a consequence, not surprisingly, the actual indices all look very different in all dimensions,
including the number of stocks, average sizes, liquidity and sector breakdowns. The outcome is a great
variety in the constituent companies in the various indices. They range from small, highly specialized niche
producers to well-known global players that are deemed to be somehow „green‟ or at least „greener than
others‟. Appendix 1 gives more detail on a number of relevant indices.
18
A somewhat looser definition is proposed by Urwin (2010) in a sample description of a targeted ESG mandate (any
business with >20% of revenue / capital coming from environmental technology).

24
Table 5. Green equity indices: definitions and constituents
Provider Index Partner Green Definition
Number of
stocks
Market capitalization
(US$) 3 largest holdings Dow Jones DJ Sustainability World SAM top 10% in each sector, of the largest 2,500 companies in the base index based on
long-term economic, environmental and social criteria 342 9800bn IBM, GE, Nestle
FTSE FTSE4Good Eiris including environmental and climate change factors 730 (global) 12900bn Apple, Microsoft, Nestle
Environmental Opportunities Impax environmental business activities, incl. renewable & alternative energy, energy
efficiency, water technology, waste & pollution control
475 1593bn
Environmental Technology Impax green technology, renewable & alternative energy, energy efficiency, water
technology and waste & pollution control
50 100bn Novozymes, Stericycle, Pall Corp
CDP Carbon Strategy 350 (UK) CDP, ENDS
Carbon
track base index but reduce exposure to carbon risk <350 Similar to FTSE 350 BP, National Grid, Anglo American
MSCI MSCI World ESG Index MSCI /
RiskMetrics
best-of-class approach relative to sector peers 790 11700bn IBM, Procter & Gamble, J & J
MSCI Global Environmental KLD companies derive over 50% of their revenues from products and services in of
five environmental themes: alternative energy, clean technology, sustainable water, green building, and pollution prevention.
167 413bn ABB, Emerson Electric, Schneider
Electric
MSCI Global Climate KLD 100 leaders in mitigating the causes or the impact of climate change (Renewable
Energy, Future Fuels, and Clean Technology & Efficiency); equally weighted
100 2.4bn Int. Power, Clean Energy Fuels, Owens
Corning
S&P Global Eco clean energy; water; environmental services/waste management 40 178bn Waste Management, Danaher, Geberit
Clean Energy clean energy producers; clean energy technology & equipment providers 30 60bn
S&P U.S. Carbon Efficient Trucost track base index whilst reducing exposure to carbon emissions by up to 50% <375 Similar to S&P 500 Apple, Chevron, Procter&Gamble
S&P IFCI Carbon Efficient Trucost track base index whilst considerably reducing exposure to carbon emissions >500 Similar to S&P/IFCI
LargeMidCap
Samsung, Itau Unibanco, Vale
BNEF Wilderhill New Energy Global Innovation
WilderHill innovative technologies and services focus on the generation and use of cleaner energy, conservation, efficiency and the advancement of renewable energy in
general
97 187bn Contact Energy, Verbund, Ormat
HSBC HSBC Global Climate Change Benchmark
generate revenues, on a supply chain basis, from the provision of goods, products and services directly linked to the industrial shift towards a low carbon economy
342 682bn Siemens, ABB, Honeywell
HSBC Investable Climate Change climate change related revenue is more than 50 per cent of the total revenue of
the company
50 147bn Waste Management, Fortum, EDF
Markit Markit Carbon Disclosure Leadership CDP tracks the performance of companies according to the CDP annual scores 569 (global) Similar to FTSE All World Exxon Mobil, Microsoft, J&J
NASDAQ NASDAQ OMX Green Economy Index
SustainableBusiness.com
13 'green economy' sectors (US) 417 1271bn Cisco, EMC. ABB

25
There are limitations and weaknesses of green indices. Biases frequently found include (they do not
necessarily apply to all indices):
sector biases (e.g. overweight in technology, TMT, financials, pharma)
country biases (e.g. underweight in Japan, Emerging Markets)
size bias (overweight in larger stocks, or small stocks, depending on the index approach)
cyclicality.
More generally, there are other issues with green indices (again, they do not necessarily apply to all):
• data quality and transparency (e.g. Sinclair 2012)
• poor company reporting on ESG or green factors
• lack of disclosure, e.g. from SME, emerging markets
• debates over performance and risk compared to standard indices
• tracking error relative to general market indices (e.g., how much should green indices deviate from
main-stream market indices?).
In conclusion, the analysis of green and responsible equity indices reveals major differences across
indices on the market. There are different dimension to this. One is the investment focus of indices. Some
indices have a relatively narrow sectoral or thematic focus while others span the typical range of green
activities. Another category concentrates on just one factor, most prominently carbon emission. The oldest
indices tend to be broader responsible or ESG indices that include environmental as important but not sole
factors.
Indices can also be grouped by their selection approach, i.e. screening, best-of-class or re-weighting
of stocks. There are also major differences in terms of the metric used. Some providers select green stocks
on a qualitative basis while others try to specify „greenness‟ using some quantitative measurement. Some
indices stress the absolute values, in others it is all relative to peer companies.
As a consequence, there is great variety in the number and nature of the stock components of the
various indices, ranging from specialist niche producers to the big multinational companies.
There are merits and shortcomings to all the different approaches that are subject to debate. Defining
„greenness‟ appears to be as much an art as a science. For example, what is the appropriate cut-off point for
environmentally-related revenues: 20%, 50% or 100%?
26
Green equity funds
Institutional investing in green equities is, of course, not constrained to index investing. In active fund
managements, similar approaches to the analysis, selection and investment in green equities are common,
with great variations in specific definitions.
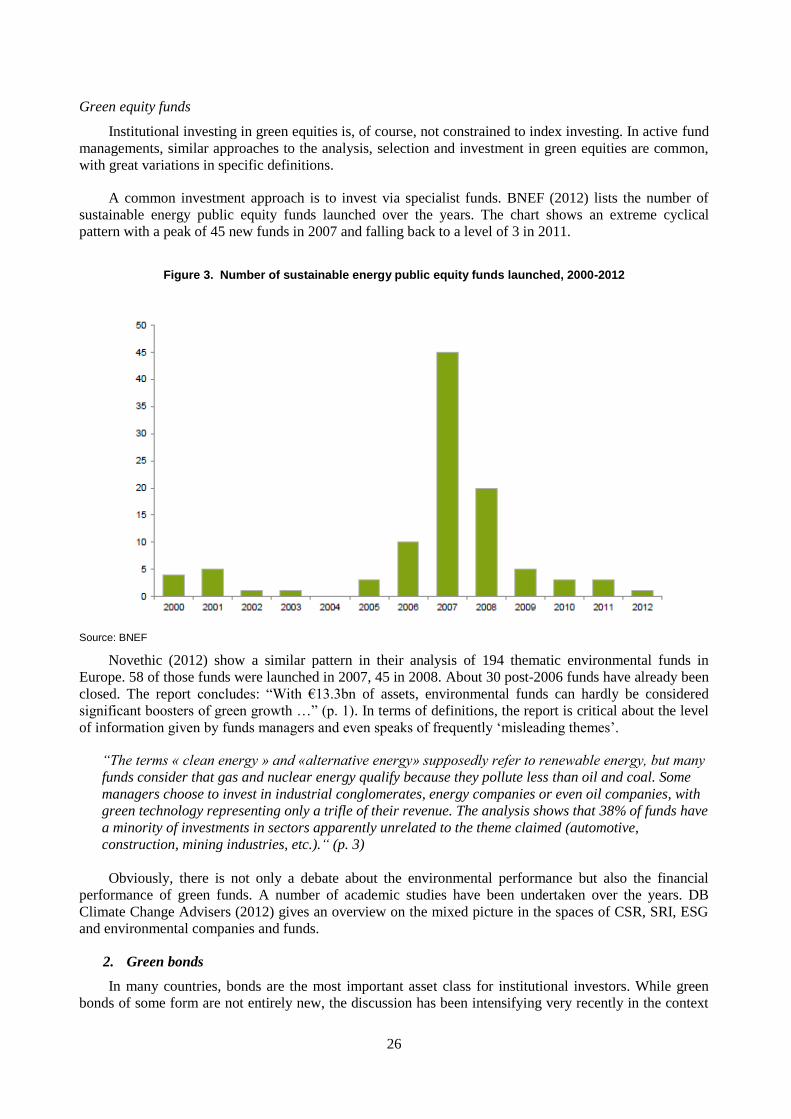
A common investment approach is to invest via specialist funds. BNEF (2012) lists the number of
sustainable energy public equity funds launched over the years. The chart shows an extreme cyclical
pattern with a peak of 45 new funds in 2007 and falling back to a level of 3 in 2011.
F SUSTAINABLE ENERGY PUBLIC EQUITY
Figure 3. Number of sustainable energy public equity funds launched, 2000-2012
UNDS LAUNCHED, 2000-2012
Source: BNEF
Novethic (2012) show a similar pattern in their analysis of 194 thematic environmental funds in
Europe. 58 of those funds were launched in 2007, 45 in 2008. About 30 post-2006 funds have already been
closed. The report concludes: “With €13.3bn of assets, environmental funds can hardly be considered
significant boosters of green growth …” (p. 1). In terms of definitions, the report is critical about the level
of information given by funds managers and even speaks of frequently „misleading themes‟.
“The terms « clean energy » and «alternative energy» supposedly refer to renewable energy, but many
funds consider that gas and nuclear energy qualify because they pollute less than oil and coal. Some
managers choose to invest in industrial conglomerates, energy companies or even oil companies, with
green technology representing only a trifle of their revenue. The analysis shows that 38% of funds have
a minority of investments in sectors apparently unrelated to the theme claimed (automotive,
construction, mining industries, etc.).“ (p. 3)
Obviously, there is not only a debate about the environmental performance but also the financial
performance of green funds. A number of academic studies have been undertaken over the years. DB
Climate Change Advisers (2012) gives an overview on the mixed picture in the spaces of CSR, SRI, ESG
and environmental companies and funds.
2. Green bonds
In many countries, bonds are the most important asset class for institutional investors. While green
bonds of some form are not entirely new, the discussion has been intensifying very recently in the context
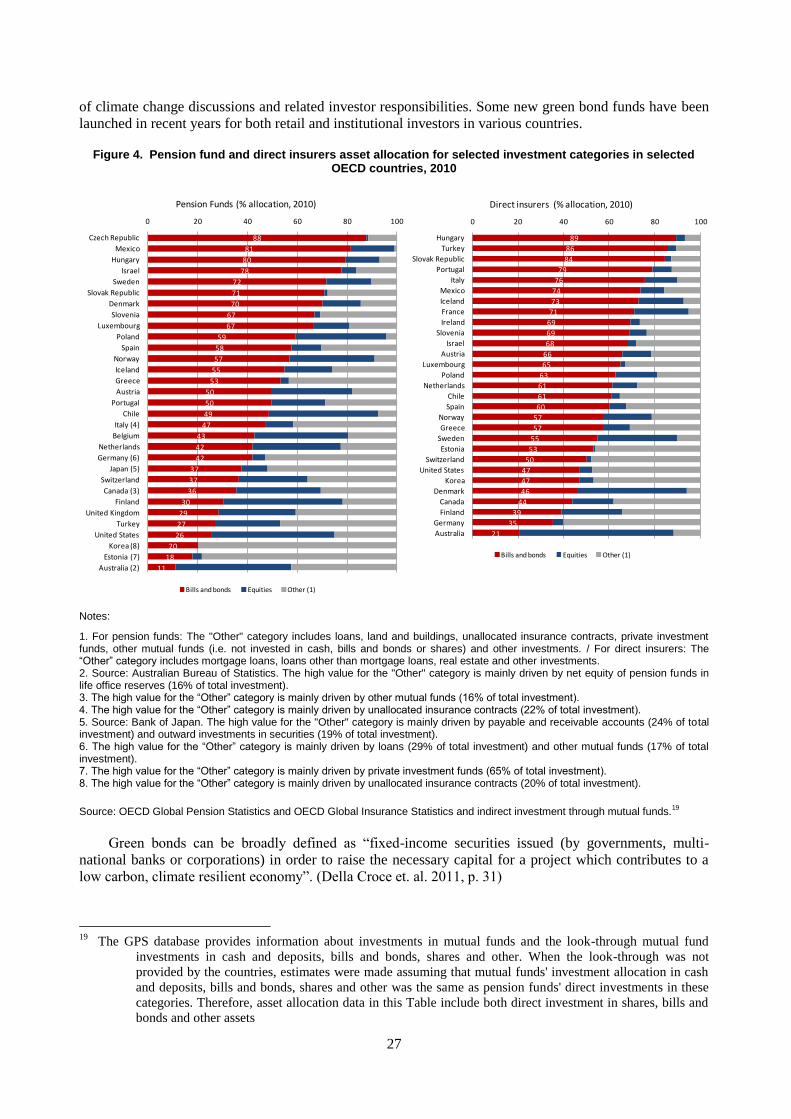
27
of climate change discussions and related investor responsibilities. Some new green bond funds have been
launched in recent years for both retail and institutional investors in various countries.
Figure 4. Pension fund and direct insurers asset allocation for selected investment categories in selected OECD countries, 2010
88
81
80
78
72
71
70
67
67
59
58
57
55
53
50
50
49
47
43
42
42
37
37
36
30
29
27
26
20
18
11
0 20 40 60 80 100
Czech Republic
Mexico
Hungary
Israel
Sweden
Slovak Republic
Denmark
Slovenia
Luxembourg
Poland
Spain
Norway
Iceland
Greece
Austria
Portugal
Chile
Italy (4)
Belgium
Netherlands
Germany (6)
Japan (5)
Switzerland
Canada (3)
Finland
United Kingdom
Turkey
United States
Korea (8)
Estonia (7)
Australia (2)
Pension Funds (% allocation, 2010)
Bills and bonds Equities Other (1)
89
86
84
79
76
74
73
71
69
69
68
66
65
63
61
61
60
57
57
55
53
50
47
47
46
44
39
35
21
0 20 40 60 80 100
Hungary
Turkey
Slovak Republic
Portugal
Italy
Mexico
Iceland
France
Ireland
Slovenia
Israel
Austria
Luxembourg
Poland
Netherlands
Chile
Spain
Norway
Greece
Sweden
Estonia
Switzerland
United States
Korea
Denmark
Canada
Finland
Germany
Australia
Direct insurers (% allocation, 2010)
Bills and bonds Equities Other (1)
Notes:
1. For pension funds: The "Other" category includes loans, land and buildings, unallocated insurance contracts, private investment funds, other mutual funds (i.e. not invested in cash, bills and bonds or shares) and other investments. / For direct insurers: The “Other” category includes mortgage loans, loans other than mortgage loans, real estate and other investments. 2. Source: Australian Bureau of Statistics. The high value for the "Other" category is mainly driven by net equity of pension funds in life office reserves (16% of total investment). 3. The high value for the “Other” category is mainly driven by other mutual funds (16% of total investment). 4. The high value for the “Other” category is mainly driven by unallocated insurance contracts (22% of total investment). 5. Source: Bank of Japan. The high value for the "Other" category is mainly driven by payable and receivable accounts (24% of total investment) and outward investments in securities (19% of total investment). 6. The high value for the “Other” category is mainly driven by loans (29% of total investment) and other mutual funds (17% of total investment). 7. The high value for the “Other” category is mainly driven by private investment funds (65% of total investment). 8. The high value for the “Other” category is mainly driven by unallocated insurance contracts (20% of total investment).
Source: OECD Global Pension Statistics and OECD Global Insurance Statistics and indirect investment through mutual funds.19
Green bonds can be broadly defined as “fixed-income securities issued (by governments, multi-
national banks or corporations) in order to raise the necessary capital for a project which contributes to a
low carbon, climate resilient economy”. (Della Croce et. al. 2011, p. 31)
19
The GPS database provides information about investments in mutual funds and the look-through mutual fund
investments in cash and deposits, bills and bonds, shares and other. When the look-through was not
provided by the countries, estimates were made assuming that mutual funds' investment allocation in cash
and deposits, bills and bonds, shares and other was the same as pension funds' direct investments in these
categories. Therefore, asset allocation data in this Table include both direct investment in shares, bills and
bonds and other assets
28
They share the typical characteristics of bonds. The main categories are:
asset backed (tied to specific green projects, e.g. infrastructure project)
corporate bonds (issued by a green company)
bonds issued by a (development, international, other) financial institution to raise capital for green
projects. Examples include bonds issued by the World Bank, ADB, EIB, EBRD, IFC, etc.
sovereign or municipal bonds (e.g. US Clean Renewable Energy Bonds - CREBs)
Some bond issuance is driven by specific government incentives, e.g. US Government CREBs. Green
bonds can be structured in different ways, e.g. with a link to inflation or a green index.20
Definitional Debates and Initiatives
In a positioning paper, Institutional Investors Group on Climate Change (IIGCC 2011) raised a
number of issues with green bonds for institutional investors, in particular the small size, low liquidity and
short tenors. While there is a preference for investing in sustainable long-term assets, it is unlikely that they
would apply any premium to the “green” label.
In relation to the UK Green Investment Bank proposals, questions relate to specific bond
characteristics (cash flows, covenants, size, duration etc.) but: “Will the bonds finance projects with clear
and transparent environmental benefits?”
“Hence a green bond would need to conform to either a liquid, government (or government guaranteed) bond
class or the higher returns of a well-rated corporate bond class. Inflation-linked bonds provide liability matching
and the best alignment and are always well received.”
Wood and Grace (2011) observe there are no clear standards for what constitutes a green bond. As a
result of interviews undertaken by the Initiative for Responsible Investment at Harvard University, it is felt
that investors have not demanded specific standards for green bonds. Some issuers may choose projects
based on their contribution to emissions mitigation. Others may wish to go beyond and include issues such
as conservation and sustainable agriculture.
The Climate Bonds Initiative is an international NGO aimed at financing the rapid transition to a low-
carbon economy. Climate Bonds are issued in order to raise finance for climate change solutions, i.e.
mitigation or adaptation related projects or programs.
The most obvious climate bonds are those where the proceeds are clearly designated for specified
climate-related programs or assets. Existing examples include green-labelled bonds issued by international
financial institutions for climate change projects, wind or solar farm project bonds, or corporate bonds
from clean energy companies. In collaboration with HSBC Climate Change Centre of Excellence, the
Climate Bonds Initiative found that as of February 2012, there were US$ 174bn outstanding from what
could be classified as climate-themed bonds. The vast majority are in the form of corporate bonds (82%),
the rest are municipal, financial institution and project bonds. Their largest sectors of the total of US$
174bn are transport (almost entirely railway bonds) at US$ 119bn, clean energy at $29bn and climate
finance at US$ 22bn.
In November 2011, a Climate Bond Standard (CBS) was presented. A Climate Bond Standards Board,
a group of institutional investors and environmental NGOs, provides a certification program for Climate
Bonds. The Certification Scheme allows investors, governments and other stakeholders to prioritise „low
carbon‟ investments with confidence that the funds are being used to deliver a low-carbon economy. The
CBS defines a low-carbon economy as one operating within the limits of a 2 degree global average
temperature increase above pre-industrial levels.
Bonds will therefore be eligible for Certification if they directly contribute to:
20
See Della Croce et. al. (2011) for examples of structured green products.
29
developing „low carbon‟ industries, technologies and practices that achieve resource efficiency
consistent with avoiding dangerous climate change;
essential adaptation to the consequences of climate change.
The CBS is starting from areas of high consensus. In its current first version, only wind energy
investments are eligible; but an expansion to solar energy and other renewable energy investments is
underway, using broad-based technical working groups to drive the process. The CBS plans to develop
eligibility criteria across the full gamut of investments required for the transition to a low-carbon economy,
from sustainable agriculture to broadband.
“Wind Energy Generation – that is, activities to generate energy from wind, specifically:
• The development and construction of wind farms
• Operational production or manufacturing facilities wholly dedicated to wind energy development
• Wholly dedicated transmission infrastructure for wind farms.”
Three types of bonds are eligible: corporate (including development bank) bonds, project
development bonds and portfolio bonds21
. Corporate bonds need to be verifiably linked to eligible assets
with procedures in place to ensure the bond principal is directed towards those assets. This arrangement
follows the practice of green bonds from international financial institutions and allows for corporates such
as commercial banks or utilities to issue certified climate bonds with the same financial risk/reward
characteristics as their normal bonds.
In addition to the US$ 174bn of climate-themed bonds, the Climate Bonds Initiative and HSBC
(2012) estimate that another US$ 204bn are “strongly aligned”22
to the climate economy. This includes
US$ 130bn from electricity utilities with large hydro, nuclear, wind or solar portfolios.
These figures are still small compared to the total global bond universe. For example, the Merrill
Lynch Global Broad Market Index tracks over US$ 40tr of investment grade bonds. Bloomberg‟s Tier 1 is
only 0.03% in size of that figure, Tier 2 is 0.5% and the Climate Bond estimate of eligible bonds of US$
174bn is less than 1%. To put things in context, General Electric has US$ 317bn in outstanding corporate
debt.
Bloomberg (BNEF 2011) proposes a definition of green bonds, consisting of 2 tiers. Tier 1 (which at
USD 13.9 billion adds us to a similar market size to OECD estimates) includes
US Municipal bonds issued under the US Build America Bonds‟ Clean Renewable Energy bonds
and Qualified Energy Conservation bond programmes (US$ 0.8bn)
Project bonds (mostly asset-backed, clear energy projects) (US$ 6.5bn)
IFI bonds (to fund loan programs for clean energy, climate change or energy efficiency) (US$
6.6bn)
Tier 2 uses a wider definition, creating a larger universe of corporate debt issued by companies that
operate in the renewable energy or energy efficiency sectors. The Tier 2 companies are divided into 2
groups:
A1 with >50% exposure to clean energy (US$ 78.7bn)
A2 with <50% but >25% exposure (US$ 137.4bn)
21
Only portfolio bonds “issued by securitization vehicles comprised of individual loans to finance physical assets or
equity investments in physical assets”.
22 “Fully aligned” climate-themed bonds are wholly dedicated to climate-related activities. “Strongly aligned” are
bonds from issuers that have revenues or other relevant metrics greater than 50% dedicated to climate-related
activities.
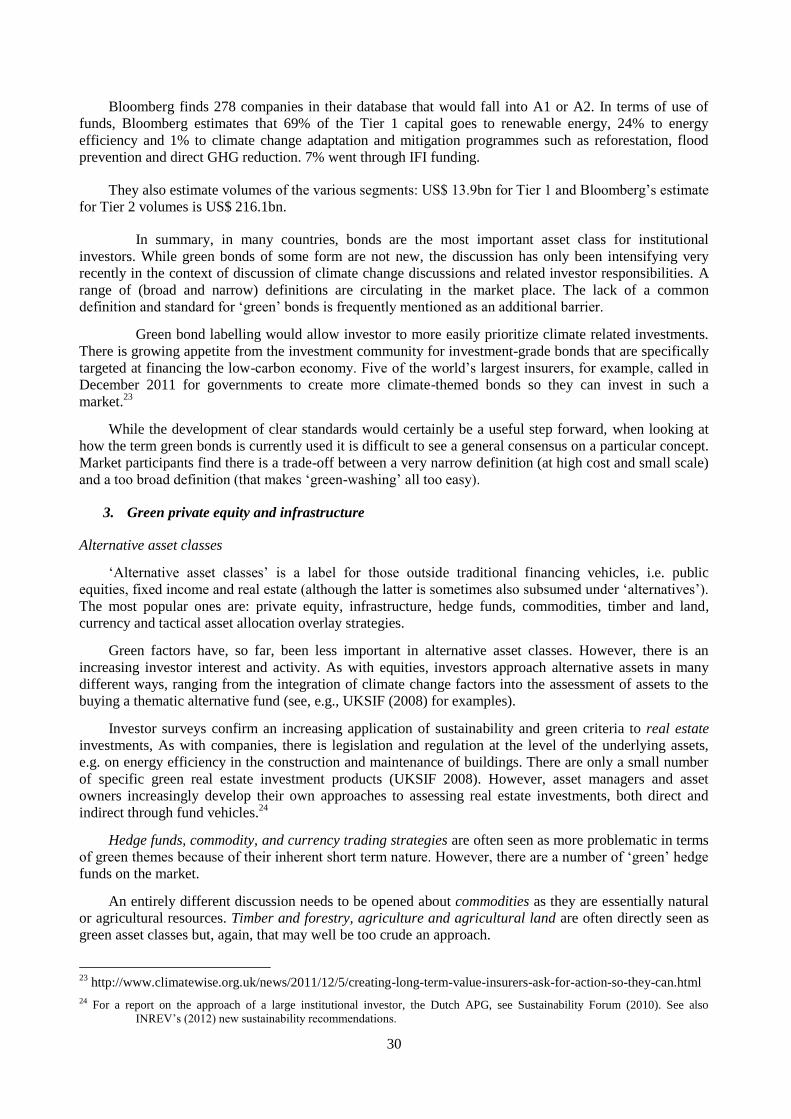
30
Bloomberg finds 278 companies in their database that would fall into A1 or A2. In terms of use of
funds, Bloomberg estimates that 69% of the Tier 1 capital goes to renewable energy, 24% to energy
efficiency and 1% to climate change adaptation and mitigation programmes such as reforestation, flood
prevention and direct GHG reduction. 7% went through IFI funding.
They also estimate volumes of the various segments: US$ 13.9bn for Tier 1 and Bloomberg‟s estimate
for Tier 2 volumes is US$ 216.1bn.
In summary, in many countries, bonds are the most important asset class for institutional
investors. While green bonds of some form are not new, the discussion has only been intensifying very
recently in the context of discussion of climate change discussions and related investor responsibilities. A
range of (broad and narrow) definitions are circulating in the market place. The lack of a common
definition and standard for „green‟ bonds is frequently mentioned as an additional barrier.
Green bond labelling would allow investor to more easily prioritize climate related investments.
There is growing appetite from the investment community for investment-grade bonds that are specifically
targeted at financing the low-carbon economy. Five of the world‟s largest insurers, for example, called in
December 2011 for governments to create more climate-themed bonds so they can invest in such a
market.23
While the development of clear standards would certainly be a useful step forward, when looking at
how the term green bonds is currently used it is difficult to see a general consensus on a particular concept.
Market participants find there is a trade-off between a very narrow definition (at high cost and small scale)
and a too broad definition (that makes „green-washing‟ all too easy).
3. Green private equity and infrastructure
Alternative asset classes
„Alternative asset classes‟ is a label for those outside traditional financing vehicles, i.e. public
equities, fixed income and real estate (although the latter is sometimes also subsumed under „alternatives‟).
The most popular ones are: private equity, infrastructure, hedge funds, commodities, timber and land,
currency and tactical asset allocation overlay strategies.
Green factors have, so far, been less important in alternative asset classes. However, there is an
increasing investor interest and activity. As with equities, investors approach alternative assets in many
different ways, ranging from the integration of climate change factors into the assessment of assets to the
buying a thematic alternative fund (see, e.g., UKSIF (2008) for examples).
Investor surveys confirm an increasing application of sustainability and green criteria to real estate
investments, As with companies, there is legislation and regulation at the level of the underlying assets,
e.g. on energy efficiency in the construction and maintenance of buildings. There are only a small number
of specific green real estate investment products (UKSIF 2008). However, asset managers and asset
owners increasingly develop their own approaches to assessing real estate investments, both direct and
indirect through fund vehicles.24
Hedge funds, commodity, and currency trading strategies are often seen as more problematic in terms
of green themes because of their inherent short term nature. However, there are a number of „green‟ hedge
funds on the market.
An entirely different discussion needs to be opened about commodities as they are essentially natural
or agricultural resources. Timber and forestry, agriculture and agricultural land are often directly seen as
green asset classes but, again, that may well be too crude an approach.
23
http://www.climatewise.org.uk/news/2011/12/5/creating-long-term-value-insurers-ask-for-action-so-they-can.html
24 For a report on the approach of a large institutional investor, the Dutch APG, see Sustainability Forum (2010). See also
INREV‟s (2012) new sustainability recommendations.
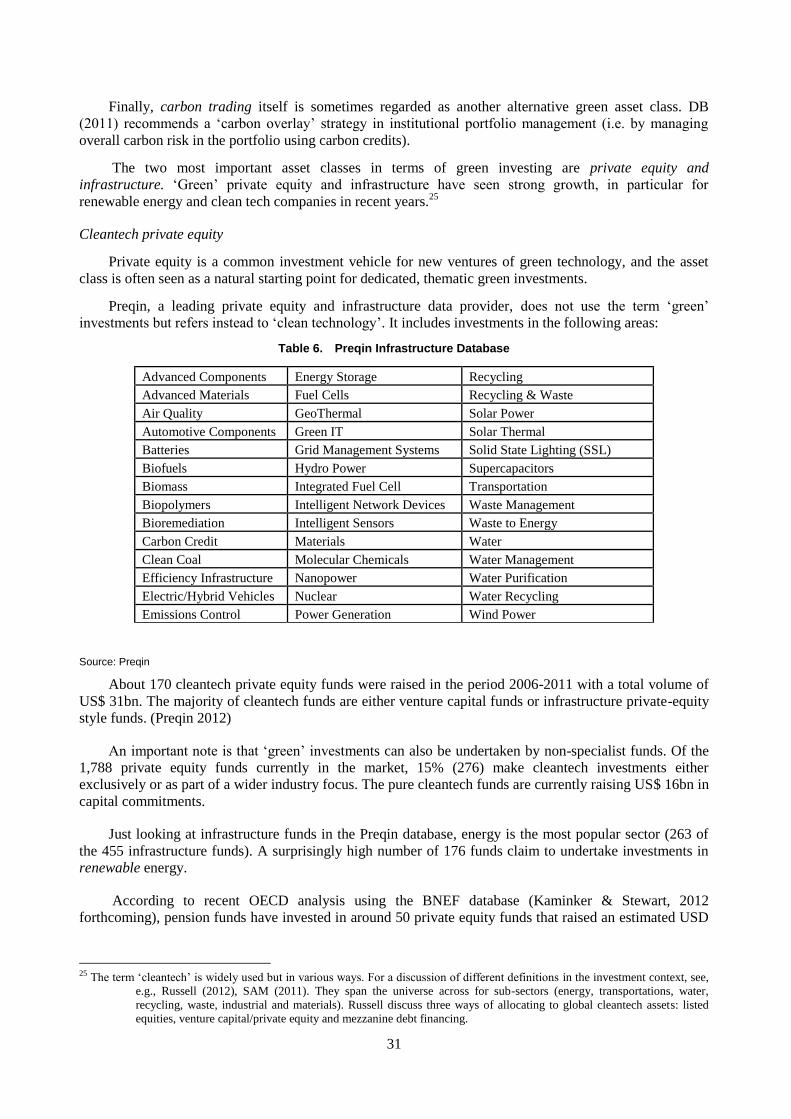
31
Finally, carbon trading itself is sometimes regarded as another alternative green asset class. DB
(2011) recommends a „carbon overlay‟ strategy in institutional portfolio management (i.e. by managing
overall carbon risk in the portfolio using carbon credits).
The two most important asset classes in terms of green investing are private equity and
infrastructure. „Green‟ private equity and infrastructure have seen strong growth, in particular for
renewable energy and clean tech companies in recent years.25
Cleantech private equity
Private equity is a common investment vehicle for new ventures of green technology, and the asset
class is often seen as a natural starting point for dedicated, thematic green investments.
Preqin, a leading private equity and infrastructure data provider, does not use the term „green‟
investments but refers instead to „clean technology‟. It includes investments in the following areas:
Table 6. Preqin Infrastructure Database
Advanced Components Energy Storage Recycling
Advanced Materials Fuel Cells Recycling & Waste
Air Quality GeoThermal Solar Power
Automotive Components Green IT Solar Thermal
Batteries Grid Management Systems Solid State Lighting (SSL)
Biofuels Hydro Power Supercapacitors
Biomass Integrated Fuel Cell Transportation
Biopolymers Intelligent Network Devices Waste Management
Bioremediation Intelligent Sensors Waste to Energy
Carbon Credit Materials Water
Clean Coal Molecular Chemicals Water Management
Efficiency Infrastructure Nanopower Water Purification
Electric/Hybrid Vehicles Nuclear Water Recycling
Emissions Control Power Generation Wind Power
Source: Preqin
About 170 cleantech private equity funds were raised in the period 2006-2011 with a total volume of
US$ 31bn. The majority of cleantech funds are either venture capital funds or infrastructure private-equity
style funds. (Preqin 2012)
An important note is that „green‟ investments can also be undertaken by non-specialist funds. Of the
1,788 private equity funds currently in the market, 15% (276) make cleantech investments either
exclusively or as part of a wider industry focus. The pure cleantech funds are currently raising US$ 16bn in
capital commitments.
Just looking at infrastructure funds in the Preqin database, energy is the most popular sector (263 of
the 455 infrastructure funds). A surprisingly high number of 176 funds claim to undertake investments in
renewable energy.
According to recent OECD analysis using the BNEF database (Kaminker & Stewart, 2012
forthcoming), pension funds have invested in around 50 private equity funds that raised an estimated USD
25 The term „cleantech‟ is widely used but in various ways. For a discussion of different definitions in the investment context, see,
e.g., Russell (2012), SAM (2011). They span the universe across for sub-sectors (energy, transportations, water,
recycling, waste, industrial and materials). Russell discuss three ways of allocating to global cleantech assets: listed
equities, venture capital/private equity and mezzanine debt financing.
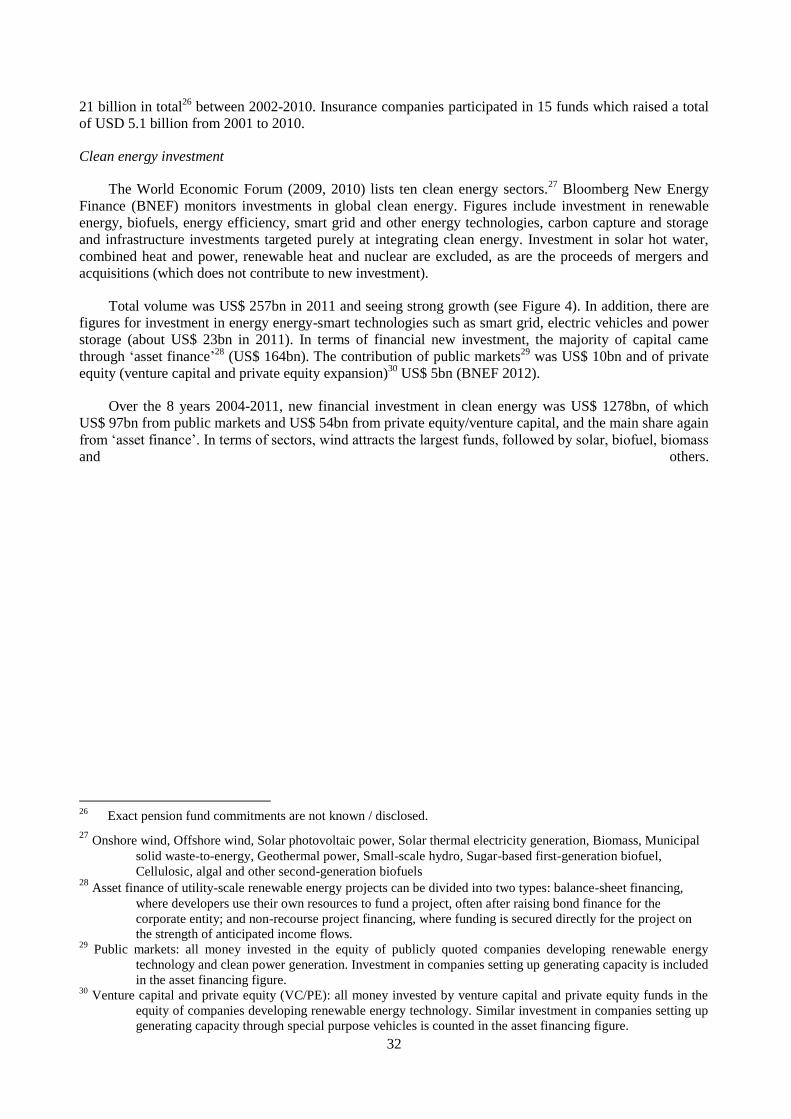
32
21 billion in total26
between 2002-2010. Insurance companies participated in 15 funds which raised a total
of USD 5.1 billion from 2001 to 2010.
Clean energy investment
The World Economic Forum (2009, 2010) lists ten clean energy sectors.27
Bloomberg New Energy
Finance (BNEF) monitors investments in global clean energy. Figures include investment in renewable
energy, biofuels, energy efficiency, smart grid and other energy technologies, carbon capture and storage
and infrastructure investments targeted purely at integrating clean energy. Investment in solar hot water,
combined heat and power, renewable heat and nuclear are excluded, as are the proceeds of mergers and
acquisitions (which does not contribute to new investment).
Total volume was US$ 257bn in 2011 and seeing strong growth (see Figure 4). In addition, there are
figures for investment in energy energy-smart technologies such as smart grid, electric vehicles and power
storage (about US$ 23bn in 2011). In terms of financial new investment, the majority of capital came
through „asset finance‟28
(US$ 164bn). The contribution of public markets29
was US$ 10bn and of private
equity (venture capital and private equity expansion)30
US$ 5bn (BNEF 2012).
Over the 8 years 2004-2011, new financial investment in clean energy was US$ 1278bn, of which
US$ 97bn from public markets and US$ 54bn from private equity/venture capital, and the main share again
from „asset finance‟. In terms of sectors, wind attracts the largest funds, followed by solar, biofuel, biomass
and others.
26
Exact pension fund commitments are not known / disclosed.
27 Onshore wind, Offshore wind, Solar photovoltaic power, Solar thermal electricity generation, Biomass, Municipal
solid waste-to-energy, Geothermal power, Small-scale hydro, Sugar-based first-generation biofuel,
Cellulosic, algal and other second-generation biofuels 28
Asset finance of utility-scale renewable energy projects can be divided into two types: balance-sheet financing,
where developers use their own resources to fund a project, often after raising bond finance for the
corporate entity; and non-recourse project financing, where funding is secured directly for the project on
the strength of anticipated income flows. 29
Public markets: all money invested in the equity of publicly quoted companies developing renewable energy
technology and clean power generation. Investment in companies setting up generating capacity is included
in the asset financing figure. 30
Venture capital and private equity (VC/PE): all money invested by venture capital and private equity funds in the
equity of companies developing renewable energy technology. Similar investment in companies setting up
generating capacity through special purpose vehicles is counted in the asset financing figure.
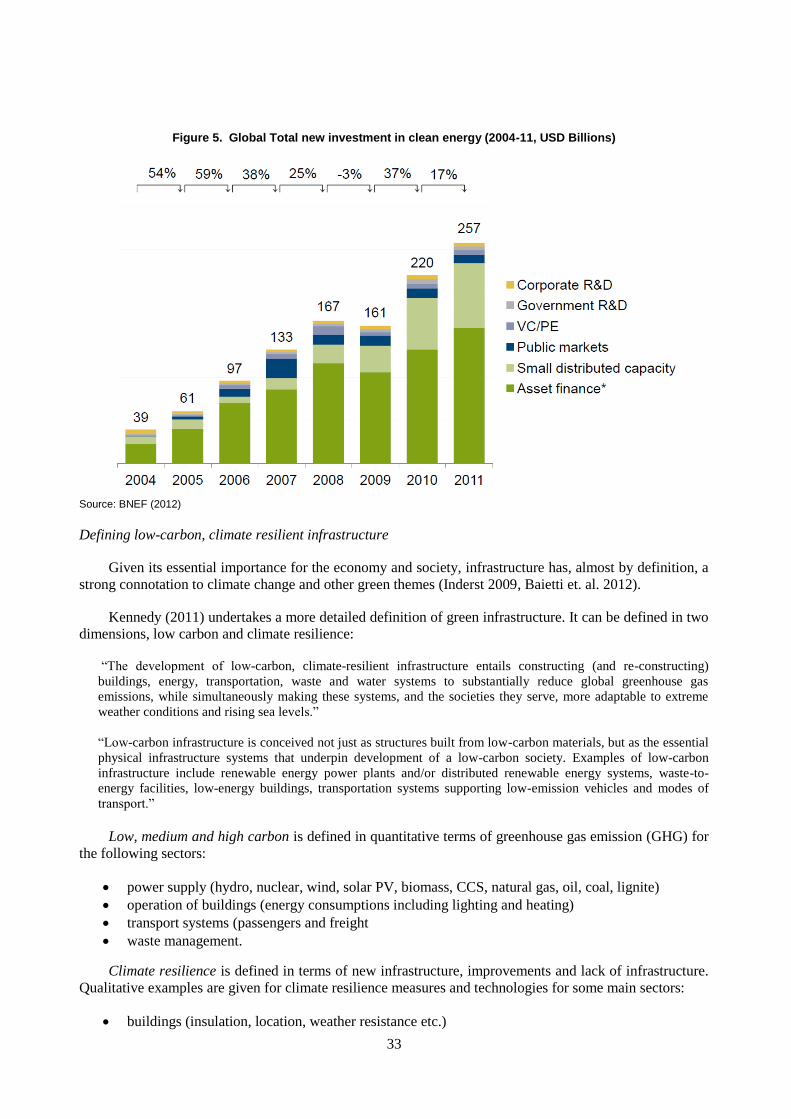
33
Figure 5. Global Total new investment in clean energy (2004-11, USD Billions)
Source: BNEF (2012)
Defining low-carbon, climate resilient infrastructure
Given its essential importance for the economy and society, infrastructure has, almost by definition, a
strong connotation to climate change and other green themes (Inderst 2009, Baietti et. al. 2012).
Kennedy (2011) undertakes a more detailed definition of green infrastructure. It can be defined in two
dimensions, low carbon and climate resilience:
“The development of low-carbon, climate-resilient infrastructure entails constructing (and re-constructing)
buildings, energy, transportation, waste and water systems to substantially reduce global greenhouse gas
emissions, while simultaneously making these systems, and the societies they serve, more adaptable to extreme
weather conditions and rising sea levels.”
“Low-carbon infrastructure is conceived not just as structures built from low-carbon materials, but as the essential
physical infrastructure systems that underpin development of a low-carbon society. Examples of low-carbon
infrastructure include renewable energy power plants and/or distributed renewable energy systems, waste-to-
energy facilities, low-energy buildings, transportation systems supporting low-emission vehicles and modes of
transport.”
Low, medium and high carbon is defined in quantitative terms of greenhouse gas emission (GHG) for
the following sectors:
power supply (hydro, nuclear, wind, solar PV, biomass, CCS, natural gas, oil, coal, lignite)
operation of buildings (energy consumptions including lighting and heating)
transport systems (passengers and freight
waste management.
Climate resilience is defined in terms of new infrastructure, improvements and lack of infrastructure.
Qualitative examples are given for climate resilience measures and technologies for some main sectors:
buildings (insulation, location, weather resistance etc.)
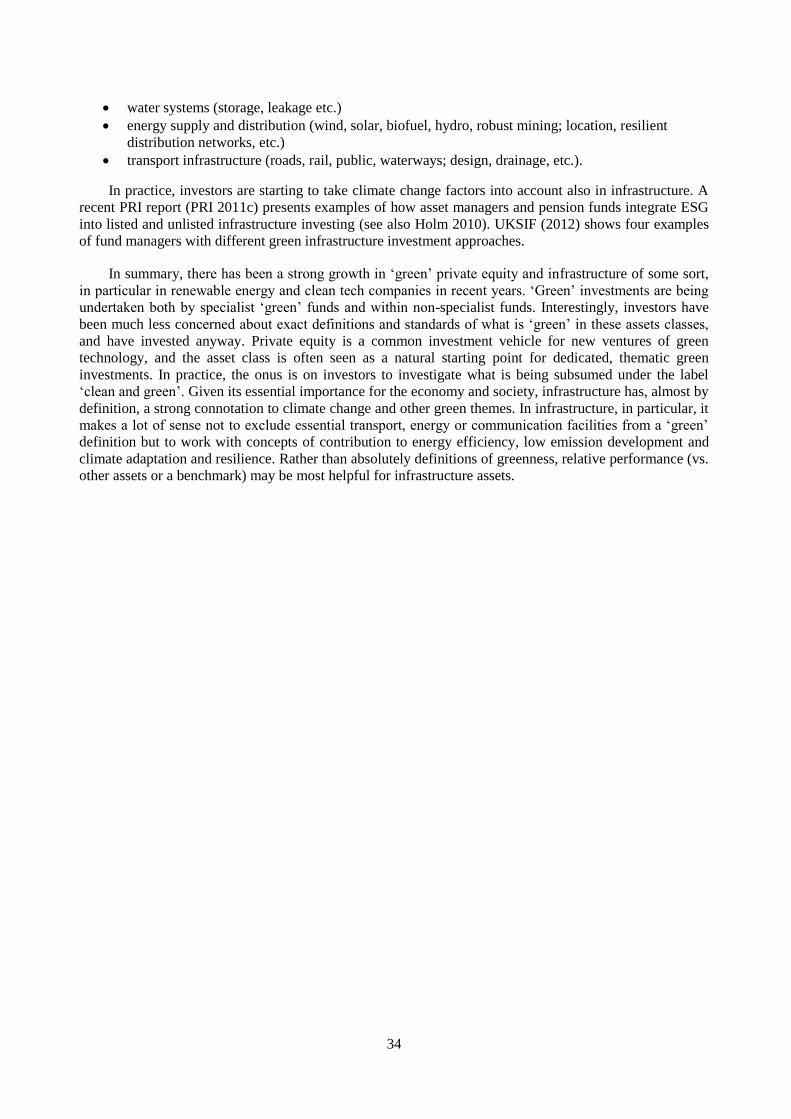
34
water systems (storage, leakage etc.)
energy supply and distribution (wind, solar, biofuel, hydro, robust mining; location, resilient
distribution networks, etc.)
transport infrastructure (roads, rail, public, waterways; design, drainage, etc.).
In practice, investors are starting to take climate change factors into account also in infrastructure. A
recent PRI report (PRI 2011c) presents examples of how asset managers and pension funds integrate ESG
into listed and unlisted infrastructure investing (see also Holm 2010). UKSIF (2012) shows four examples
of fund managers with different green infrastructure investment approaches.
In summary, there has been a strong growth in „green‟ private equity and infrastructure of some sort,
in particular in renewable energy and clean tech companies in recent years. „Green‟ investments are being
undertaken both by specialist „green‟ funds and within non-specialist funds. Interestingly, investors have
been much less concerned about exact definitions and standards of what is „green‟ in these assets classes,
and have invested anyway. Private equity is a common investment vehicle for new ventures of green
technology, and the asset class is often seen as a natural starting point for dedicated, thematic green
investments. In practice, the onus is on investors to investigate what is being subsumed under the label
„clean and green‟. Given its essential importance for the economy and society, infrastructure has, almost by
definition, a strong connotation to climate change and other green themes. In infrastructure, in particular, it
makes a lot of sense not to exclude essential transport, energy or communication facilities from a „green‟
definition but to work with concepts of contribution to energy efficiency, low emission development and
climate adaptation and resilience. Rather than absolutely definitions of greenness, relative performance (vs.
other assets or a benchmark) may be most helpful for infrastructure assets.

35
IV. Measuring Institutional Investors’ Green Investment
As can be seen from the discussions above, definitions of what constitutes „green investment‟ differ
widely – which naturally has a major impact when it comes to trying to measure performance of these
investments. For example, if „green‟ is defined in absolute or output based terms the amount of investment
will naturally be smaller than if relative or sectoral definitions are used. The measurement and comparison
of green investment flows is still at an early stage.
Investment consultants find that integration of ESG / SRI elements in institutional investment policy
has been rising but specific strategic guidance and mandates are still relatively few in number and small in
terms of asset size. Mercer, the investment consultant, reports that approximately 10% of global investment
managers have begun to integrate ESG issues into their investment process. Urwin (2010) finds that while
ESG has attracted increasing attention, target allocations to sustainable funds are shown to be only 1-3%
even among the more committed big pension funds (see Table 7). Stylized sustainability mandates could
have up to 50% or 75% of assets allocated to integrated ESG, and up to 4% or 8% to targeted ESG
investments.
Table 7. Examples of Sustainable Strategies among Funds
Fund ESG Integration and active ownership Sustainable mandates
PGGM
(Netherlands)
Integrates ESG into research on most asset classes
Voting and engagement done directly and through
outsourced approach
Responsible equity, microfinance,
forestry, renewable energy
infrastructure, clean-tech PE
Allocation target of around 3%
Pension Fund -
Global
(Norway)
Integrates ESG consideratsions into listed equity and
real estate portfolois
Voting and enagement
Environmental investment programme
launched 2009, yet to be invested.
Allocation target of around 1%
CaIPERS
(US)
Voting and enagement
Activism approaches
Activist funds (corportae governance)
Clean-tech
Allocation target of around 2%
Sources: Fund web-sites
For example, Eurosif estimates global SRI assets under management to be € 7.6tr, with Europe
contribution about two thirds to the figure. The € 1.2tr in core SRI in 2009 represent about 10% of the asset
management industry in Europe, the € 3.8tr in broad SRI about one third.
Meanwhile, US SIF currently estimates the volume of broad-based SRI investing in the USA to
encompass an estimated $3.07 trillion out of $25.2 trillion in the U.S. investment marketplace, i.e. roughly
12%. According to SIF-Japan, „the volume of Japanese SRI markets is still a few hundred billion yen,
which is extremely smaller than the US (more than two hundred trillion yen) and European (a few ten
trillion yen) SRI market‟. The PRI (2011b) report provides figures on the SRI assets managed by PRI
signatories in absolute terms and as a percentage of total market size. Overall, SRI assets are US$ 6.8tr
against a market size of US$ 122tr, i.e. 6%. Coverage is highest in listed real estate (24%) and corporate
bonds (19%) and lowest in infrastructure (0%) and hedge funds (2%).
In summary, Table 8 gives a rough overview on available estimates of market volumes in green and
ESG assets. It is interesting to compare the indicative market volumes for ESG/SRI assets with „pure‟
green assets. It is clear that assets with some sort of responsible and sustainable criteria are a multitude of
pure green assets. SRI/ESG assets are estimated at over US$ 10tn globally while „pure‟ green assets are
estimated to be in the tens or hundreds of billions, depending on the definition.
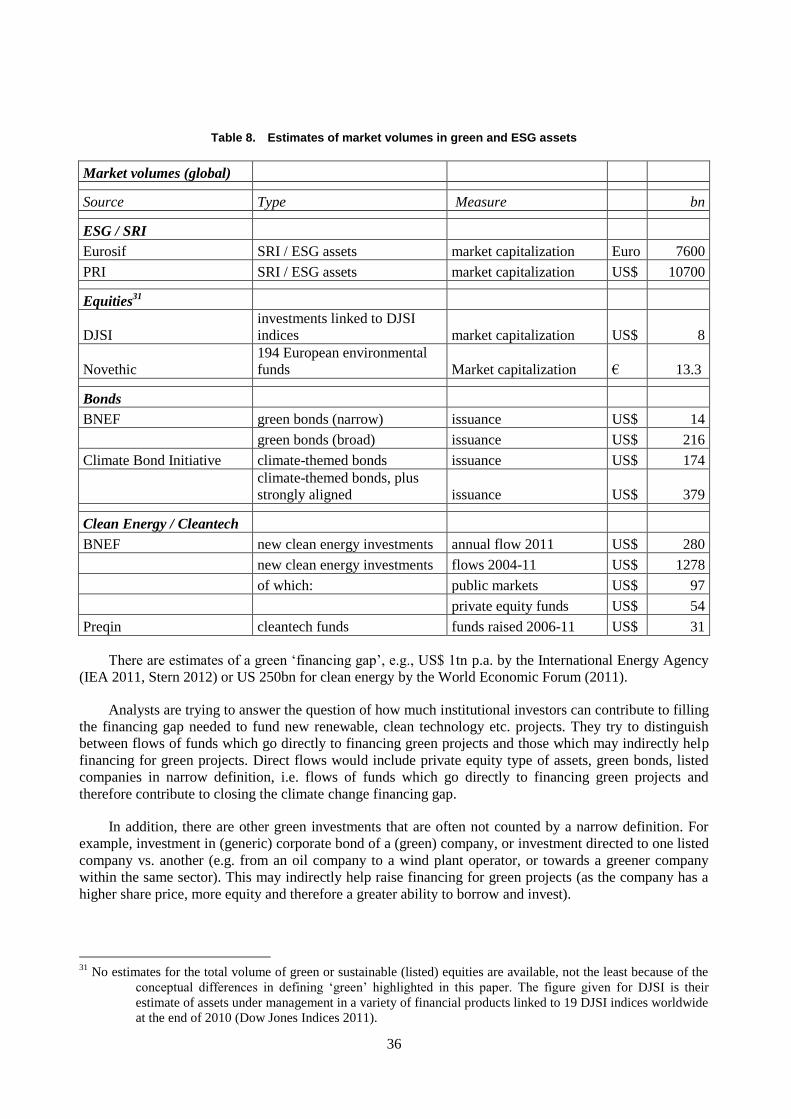
36
Table 8. Estimates of market volumes in green and ESG assets
Market volumes (global)
Source Type Measure bn
ESG / SRI
Eurosif SRI / ESG assets market capitalization Euro 7600
PRI SRI / ESG assets market capitalization US$ 10700
Equities31
DJSI
investments linked to DJSI
indices market capitalization US$ 8
Novethic
194 European environmental
funds Market capitalization € 13.3
Bonds
BNEF green bonds (narrow) issuance US$ 14
green bonds (broad) issuance US$ 216
Climate Bond Initiative climate-themed bonds issuance US$ 174
climate-themed bonds, plus
strongly aligned issuance US$ 379
Clean Energy / Cleantech
BNEF new clean energy investments annual flow 2011 US$ 280
new clean energy investments flows 2004-11 US$ 1278
of which: public markets US$ 97
private equity funds US$ 54
Preqin cleantech funds funds raised 2006-11 US$ 31
There are estimates of a green „financing gap‟, e.g., US$ 1tn p.a. by the International Energy Agency
(IEA 2011, Stern 2012) or US 250bn for clean energy by the World Economic Forum (2011).
Analysts are trying to answer the question of how much institutional investors can contribute to filling
the financing gap needed to fund new renewable, clean technology etc. projects. They try to distinguish
between flows of funds which go directly to financing green projects and those which may indirectly help
financing for green projects. Direct flows would include private equity type of assets, green bonds, listed
companies in narrow definition, i.e. flows of funds which go directly to financing green projects and
therefore contribute to closing the climate change financing gap.
In addition, there are other green investments that are often not counted by a narrow definition. For
example, investment in (generic) corporate bond of a (green) company, or investment directed to one listed
company vs. another (e.g. from an oil company to a wind plant operator, or towards a greener company
within the same sector). This may indirectly help raise financing for green projects (as the company has a
higher share price, more equity and therefore a greater ability to borrow and invest).
31
No estimates for the total volume of green or sustainable (listed) equities are available, not the least because of the
conceptual differences in defining „green‟ highlighted in this paper. The figure given for DJSI is their
estimate of assets under management in a variety of financial products linked to 19 DJSI indices worldwide
at the end of 2010 (Dow Jones Indices 2011).
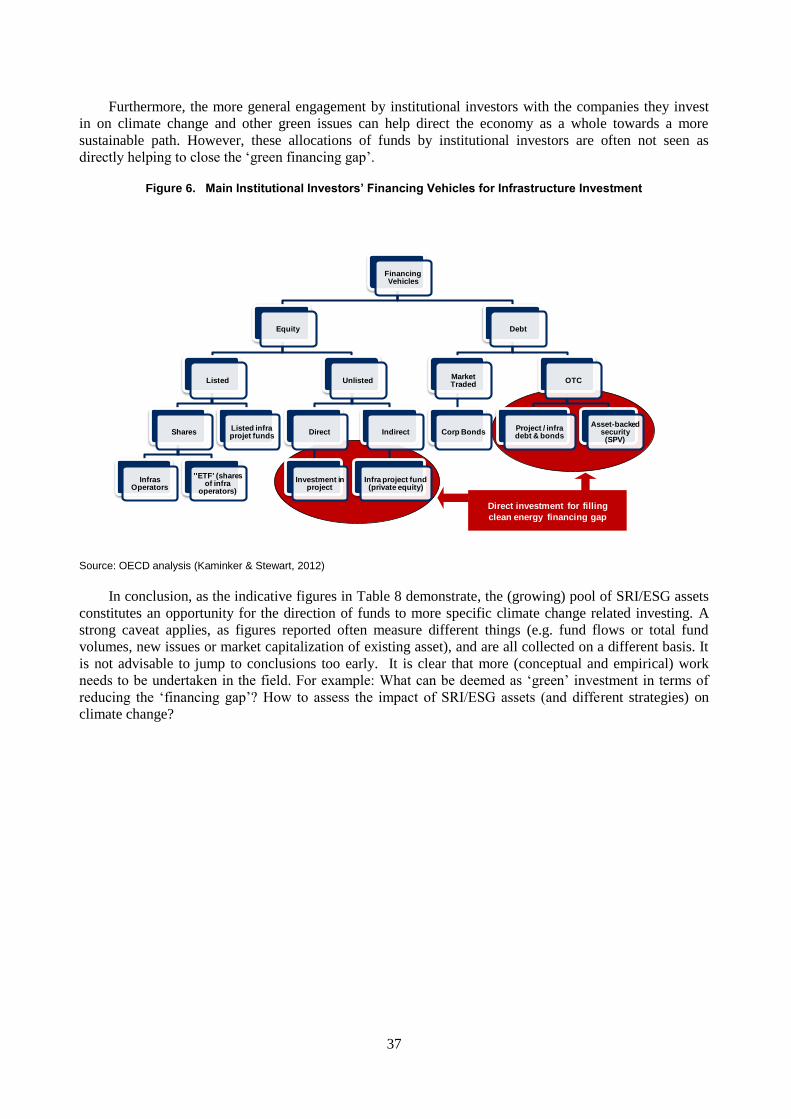
37
Furthermore, the more general engagement by institutional investors with the companies they invest
in on climate change and other green issues can help direct the economy as a whole towards a more
sustainable path. However, these allocations of funds by institutional investors are often not seen as
directly helping to close the „green financing gap‟.
Figure 6. Main Institutional Investors’ Financing Vehicles for Infrastructure Investment
Source: OECD analysis (Kaminker & Stewart, 2012)
In conclusion, as the indicative figures in Table 8 demonstrate, the (growing) pool of SRI/ESG assets
constitutes an opportunity for the direction of funds to more specific climate change related investing. A
strong caveat applies, as figures reported often measure different things (e.g. fund flows or total fund
volumes, new issues or market capitalization of existing asset), and are all collected on a different basis. It
is not advisable to jump to conclusions too early. It is clear that more (conceptual and empirical) work
needs to be undertaken in the field. For example: What can be deemed as „green‟ investment in terms of
reducing the „financing gap‟? How to assess the impact of SRI/ESG assets (and different strategies) on
climate change?
Direct investment for filling
clean energy financing gap
Financing Vehicles
Equity
Listed
Shares
InfrasOperators
''ETF' (shares of infra
operators)
Listed infra projet funds
Unlisted
Direct
Investment in project
Indirect
Infra project fund (private equity)
Debt
Market Traded
Corp Bonds
OTC
Project / infra debt & bonds
Asset-backed security (SPV)

38
V. Conclusions
This paper reviews the concepts and definitions related to „green‟ investments (e.g. „clean‟,
„sustainable‟, „climate change‟ investments) which are currently used in the market place. It investigates
two questions:
Is there a broad consensus around the definitions or is the term used in different ways by different
investors and in different contexts?
Can a proposal be constructed for a broad definition of „green investment‟ and possibly a „green
standard‟ or check list?
Although the questions and conclusions are applicable to a broad range of investments and investors,
the investment approach of institutional investors (such as pension funds and insurance companies) has
been examined to look for evidence of how these terms are currently being applied.
In terms of the first question regarding a consensus on definitions, there is already a rich history of
green, responsible, sustainable or similar investing in the market place. Institutional investors use a
multitude of approaches both at the macro and micro level of decision-making. It is therefore unlikely to
find agreement on a meaningful, exact operational definition of „green or climate change investment‟.
It is important to scrutinize both elements, what is meant by „green‟ and „investment‟. In terms of
„green‟, some definitions are very broad and generic, others are more technical and specific. „Green‟ can
be postulated in absolute terms (e.g. a technology is green, or not) and relative terms (e.g. relative to other
companies or assets). There are qualitative and quantitative definitions (e.g. bases on some measure of
greenness like carbon emission or scoring points in a green assessment). Does „greenness‟ relate to the past
or the future of an asset?
Nonetheless, there is also some sort of common understanding of the main issues and there are some
common core elements that find pretty broad consensus. There is a sizeable common intersection of the
various definitions in terms of sectors (e.g. renewable energy), goods (e.g. lead-free fuel), services (e.g.
water and waste management), technologies and processes (e.g. to enhance energy efficiency).
There are some areas of major controversy (e.g. nuclear), dissenting opinions (e.g. biofuel, biomass,
shale gas), ambiguity and uncertainty (e.g. „green‟ agriculture, IT, financial services). Further, some areas
are not always taken into account (e.g. reforestation) while other seem to be difficult to include in an
investment concept (e.g. biodiversity, conservation). To the extent possible, definitions should be
deductive from relevant science.
In the areas of broad agreement, the devil is still in the detail on what exactly is included and what
not. Nor is there clarity about the appropriate metric for „greenness‟ at the grass roots.
Green investment is a very wide term, and it is being referred to at all levels: the investment in
underlying technology and projects but also to green companies and financial products that invest in those,
or even to entire asset classes. Green‟ investment can be stand-alone, a sub-set of a broader investment
theme or closely related to other investment approaches such as RI/SRI (socially responsible investing),
ESG (environmental, social and governance investing), sustainable, long-term investing and others.
It is important to note that green investment has been traditionally mostly embedded in a broader
approach of SRI or ESG investing. There are two sides to that. When „green investing‟ comes through the
door of SRI or ESG, it may not be particularly focused on green or climate change investments. First, there
are other factors at play. Second, SRI/ESG is most popular as an „overlay‟ process to standard investment
policies without targeting particular green assets. Third, it can easily degenerate in some sort of „box-
ticking‟ exercise for compliance or marketing reasons. On the other hand, by somehow working with an
ESG policy, investors may be more sensitive towards green issues and be inclined to dedicate more capital,
and faster, to climate change-related assets in future.
39
Investors‟ attention to climate change, and green issues in general, has been rising in recent years and
investor initiatives in this respect are growing in support. The paper presents some key findings of investor
surveys on their actions and motivations Although not concretely affecting definitions, there some
fundamentally different investment approaches used by investors. Some investors have some form of ESG
or green „overlay‟ in the general investment process while others allocate a certain percentage of assets to a
specific green product or manager.
Green investment policies are not equally applied to all asset classes. Sustainable investing has been
most advanced in equities. An analysis of equity indices reveals great differences in the „green‟
methodology applied on the market place. Different approaches to selecting green investments have
evolved over the years, in particular (negative or positive) screening, green thematic investing and
engagement with companies. Some indices have a relatively narrow sectoral or thematic focus, others span
the typical range of green activities. A third group concentrates on just one factor, most prominently
carbon emissions.
There are also major differences in terms of the metric used. Some providers select green stocks on a
qualitative basis. Others specify „greenness‟ quantitatively, e.g. 20% or 50% of the revenue needs to be
climate change-related, or stocks with the highest contribution to reducing emissions. Finally, in a best-of-
class approach, it is all relative, as the top 10% or 20% of companies of a sector are selected. As a
consequence, there is great variety in the constituent companies in the various indices. This is less a matter
of conflict than a recognition that there are layers of relative „greenness‟. Largely because of liquidity
needs, fund managers are looking to „light‟ green definitions initially. For example, Axa IM, in developing
its proposed green bond fund, states that they expect to start with light green, ratcheting up to a darker
green portfolio as a bigger universe of such product becomes available.
In effect, some approaches favour investment in specialist green companies while others are designed
to filter out the best companies within a sector, or to persuade „heavy polluters‟ to change.
Green bonds are a relatively new development, and some (broad and narrow) definitions have been
proposed in the market place. A „Climate Bonds Standard‟ has been set up. There is a trade-off between a
very narrow definition (small scale) and a too broad definition (that makes „green-washing‟ all too easy).
In real estate, the focus is traditionally on the regulation underlying assets, e.g. on the energy efficiency of
buildings.
Green factors have, so far, been less important in alternative asset classes. Nonetheless, green
investments have been growing in recent times, mostly in renewable energy or some form of cleantech
companies, often via green private equity and infrastructure funds. Generally, the underlying definitions
tend to be very broad. Interestingly, investors have been less concerned about exact standards of what is
„green‟ in alternative assets classes, and have invested anyway.
The paper gives some indications on the market volumes of green investments. It is important to note
that the current investment volumes in ESG / SRI assets, estimated at over US$ 10tn, are a multiple of
those in‟ pure‟ green investments (estimated in the tens or hundreds of billions, depending on the
definition). This constitutes an opportunity for the direction of funds to more specific climate change
related investing.
In terms of the second question, whether a broad definition or standard can be established, one
strategy could be to focus on the agreed commonalties, and to try to find a broad enough consensus to
come up with a basic definition. The risk to this approach is two-fold: either the definition would be too
broad and therefore meaningless; or the definition would be too narrow and may well be perceived as too
restrictive and constrain capital flows unnecessarily. There is also a risk of „too much money chasing the
same assets‟, overvaluation and subsequent disappointment.
40
Imposing a certain definition and particular standards also carry the risk of perverse incentives.32
For
example, is it better to invest in a new green technology venture, give more capital to a company that has a
good record on energy efficiency or engage with a bad polluter of global scale in order to shift its attitude?
The latter may fail under all „green standards‟ but may actually have the biggest impact on climate change.
It is important to note that energy efficiency represents a significant largely untapped opportunity for
meeting the dual goals of risk-adjusted financial return and environmental protection. Institutional
investors are interested in energy efficiency as a cost-effective opportunity to reduce the carbon emissions
of investee companies.33
It may be more productive for the cause of green growth and climate change policy to take an open
and dynamic approach to definitions and standards. Science and the general understanding of the
environment and climate change are evolving. Markets are moving fast. Policy priorities and incentives
(e.g. subsidies and taxation) change over time. Companies and consumers adjust their (more or less)
responsible behaviour. Any green definitions, standards and codes will need to be adjusted over time.
A „competition of definition and standards‟ has the benefit of making productive use of the full
breadth of knowledge available. It may beneficial for climate change-related investing across the full range
of opportunities, ranging from for new funds for innovative ventures to moving the traditional economy
into a greener direction.
An open, dynamic strategy could be to monitor and provide transparency about the various definitions
that are in use and encourage the development of internationally harmonised green standards in the market
place. This is largely because the depth of understanding of investmemts required for the low-carbon
transition is still in development, and because the science is evolving rapidly. International institutions and
governments could take a „governance approach to green investment‟. This would mean an extension of
the existing governance frameworks of policy recommendations on corporate governance of companies,
investments, pension funds, infrastructure investments. It would involve providing „prudential guidance‟
on the topic, as opposed to specific standards.
This review suggests specific recommendations, where additional elements of a governance structure
for “green investing” could include, for example:
Integration: encourage consideration of green and ESG standards for all levels of the investment
decision-process (asset owners, investment managers, underlying investee companies, assets and
projects)34
and integrate consideration of climate change into the risk management processes (again
at all levels).Clarification and guidance on fiduciary duties in climate change and ESG matters
would also be of assistanceIntegration: encourage consideration of green and ESG standards for
all levels of the investment decision-process (asset owners, investment managers, underlying
investee companies, assets and projects)35
and integrate consideration of climate change into the
risk management processes (again at all levels).Clarification and guidance on fiduciary duties in
climate change and ESG matters would also be of assistance
Transparency: higher transparency in „green matters‟ (e.g. is climate change incorporated in
investment analysis and decision-making process; reporting on what definitions and standards are
followed, and what they include and exclude) and strengthen disclosure to consumers and
investors (e.g. on green investment approach, carbon footprint, voting records in green matters).
32
For a discussion of pros and cons of regulatory standards see, e.g., Brinkman (2009).
33 For example, the Carbon Disclosure Project Carbon Action Initiative (see Appendix 2).
34 Some guidance for institutional investors is already available, see e.g. IIGCC (2010), Railpen et. al. (2009),
Institute of Responsible Investment (2007).
35 Some guidance for institutional investors is already available, see e.g. IIGCC (2010), Railpen et. al. (2009),
Institute of Responsible Investment (2007).
41
Ensure compliance with environmental legal and regulatory standards in different sectors and asset
classes would also be required.
Capacity building: encourage capacity building and development of „internal „green expertise‟
and/or use of external expertise; consideration of „green advisory committees‟ as well as raising
„green‟ knowledge, education and understanding as part of the competence requirements for
directors, trustees, managers etc.; and promote communication and cooperation about climate
change matters among investors, and between investors, governments (and ministries within
governments) and experts (i.e. through collaborative networks or club arrangements). Develop
impact assessments and monitoring effectiveness of decisions / actions.
Data collection: support independent data collection, standardised information provision on green
performance features and transparency; encourage further research to develop better „green‟
quantitative tools and benchmarks (global scale to allow for international comparison)
Regulation: removal of investment and other regulatory barriers to “green” assets, e.g. in assets of
low liquidity; encourage long-term investing.
Whether a broad or a narrow definition is needed for green investment will depend upon the policy
goal. There could be two main reasons for an „official‟ definition of green investment: first „passive‟
monitoring of green initiatives (e.g. to check delivery of political commitments and environmental
performance); second, „active‟ consumer protection regulation to avoid „mis-selling‟ green investments to
investors. Financial regulators will need to consider these goals and weigh the implications they have for
next steps in moving forward guidance and action on next steps to support green investing.
As this paper shows, the definition and measurement of green investments is an evolving topic which
clearly deserves further analysis. The OECD hopes to create a dialogue between the institutional investor
community, and financial regulators to develop further understanding on this and broader long-term
investing and green growth issues.36
36
For details of OECD project on long-term investing see www.oecd.org/finance/lti. For details of the OECD work
on green growth see www.oecd.org/greengrowth.

42
REFERENCES
Baietti, A., Shlyakhtenko, A., La Rocca, R., Pater, U. (2012), Green Infrastructure Finance. Leading
Initiatives and Research. World Bank.
BNEF (2011), Bond, green bond – licensed to thrill investors? BNEF, Clean Energy Research Note, 2 Dec
2011.
BNEF (2012), Global Trends in Renewable Energy Investment 2012.
Brinkman, M. (2009), Incentivizing Private Investment in Climate Change Mitigation. In: Climate Finance.
Ed. By R. Stewart, B. Kingsbury and B Rudyk. New York University Press.
Clapp, C, J. Ellis, J. Benn, J. Corfee-Morlot (2012), “Tracking Climate Finance: What and How?”, OECD-
IEA, May 2012.
Clearpath (2011), Environmental, Social & Governance Investing. November 2011.
Climate Bonds Initiative and HSBC (2012), Bonds and Climate Change. The State of the Market in 2012.
June 2012
DB Climate Change Advisors (2011), Investing in Climate Change 2011.
DB Climate Change Advisors (2012), Sustainable Investing. Establishing Long-Term Value and
Performance. June 2012.
Della Croce, R. D., C. Kaminker and F. Stewart (2011), “The Role of Pension Funds in Financing Green
Growth Initiatives”, OECD Working Papers on Finance, Insurance and Private Pensions, No. 10, OECD
Publishing. http://dx.doi.org/10.1787/5kg58j1lwdjd-en
Dow Jones Indices (2011), Dow Jones Sustainability Indices.
EDHEC (2010), Adoption of Green Investing by Institutional Investors: A European Survey.
Eurosif (2011a), European SRI Study 2010. Methodologies and Working Papers.
Eurosif (2011b), Corporate Pension Funds & Sustainable Investment Study.
Eurstat (2009), The environmental goods and services sector.
Eyraud, L., Wane, A., Zhang, Ch., Clements, B. (2011), Who‟s Going Green and Why? Trends and
Determinants of Green Investment. IMF Working Paper WP/11/296
Freshfields (2005), A Legal Framework for the Integration of Environmental, Social and Governance
Issues in Institutional Investing. Freshfields Bruckhaus Deringer.
Golub, S., Kauffmann, C., Yeres, Ph. (2011), “Defining and Measuring Green FDI: An Exploratory
Review of Existing Work and Evidence", OECD Working Papers on International Investment, No. 2011/2,
OECD Investment Division.
Holm, A. (2010), Infrastructures in the Face of Climate Change: What implications for the long-term
investor? CDC Climat Research, no. 22, May 2010.
IEA (2011), World Energy Outlook. International Energy Agency.
IIGCC (2010), A Guide on Climate Change for Private Equity Investors.
IIGCC (2011), IIGCC Positioning Paper on Green Bonds.
IIGCC/INCR/IGCC (2011), Global Investor Survey on Climate Change 2010.

43
Inderst, G. (2009), "Pension Fund Investment in Infrastructure", OECD Working Papers on
Insurance and Private Pensions, No. 32, OECD publishing
INREV (2012), Sustainability Reporting Recommendations. January 2012.
Institute of Responsible Investment (2007), Handbook on Climate-related Investing across Asset Classes.
Boston College.
IPE (2011), European Institutional Asset Management Survey. Investment & Pensions Europe.
Kaminker, C. and Stewart, F. (2012 forthcoming), “The Role of Institutional Investors in Financing Clean
Energy, OECD Publishing, Paris.
Kennedy, Ch. (2011), OECD work on defined low carbon, climate resilience infrastructure, OECD, 1 Dec
2011
McKinsey (2011), Resource Revolution: Meeting the world‟s energy, materials, food and water needs.
Mercer (2011), Climate Change Scenarios – Implications for Strategic Asset Allocation.
Mercer (2012a), Through the Looking Glass: How Investors are Applying the Results of the Climate
Change Scenarios Study.
Mercer (2012b), Mercer‟s ESG ratings update. 13 February 2012. http://www.mercer.com/articles/ESG-
ratings-update
Novethic (2011), 2011 Survey, European Asset Owners‟ ESG Perceptions and Integration Practices.
Novethic (2012), Green Funds. A sluggish Market. April 2012
OECD (2011a), Towards a Policy Framework for Low-Carbon, Climate Resistant Infrastructure
Investment”. Staff consultation draft, 1 Dec 2011.
OECD (2011b), Financing Climate Change Action, OECD Policy Brief, 1 Dec 2011.
OECD (2011c), Indicator of Environmental Technologies (ENV-Tech Indicator)
http://www.oecd.org/document/55/0,3746,en_2649_34289_43383927_1_1_1_1,00.html
OECD (2012 – forthcoming), Policy Framework for Low Carbon Climate Resilient Investment.
Preqin (2012), 2012 Preqin Global Private Equity Report.
PRI (2011a), Universal Ownership. Why environmental externalities matter to institutional investors. PRI
and Trucost.
PRI (2011b), Report on Progress 2011.
PRI (2011c), Responsible Investment in infrastructure. A compendium of case studies.
Railpen, HSBC, Linklaters (2009), Climate Change Audit. An Asset Owner‟s Toolkit.
Richardson, B., (2011), Sovereign Wealth Funds and the Quest for Sustainability: Insights from Norway
and New Zealand. Nordic Journal of Commercial Law, Issue 2011(2).
Russell (2012), Global Cleantech. Quantifying its place in your portfolio. Russell Research.
SAM (2011), Clean Tech Private Equity. Past, Present and Future.
Salo, J. (2012), Environmental Metrics. In: Evolutions in Sustainable Investing. Strategies, Funds and
Thought Leadershop. Ed. By C. Krosinsky.Wiley, Hoboken, New Jersey.
Scholtens, B., The sustainability of green funds. Natural Resources Forum 35 (2011), p. 223-232.
Sinclair, G. (2012), Indexes. In: Evolutions in Sustainable Investing. Strategies, Funds and Thought
Leadershop. Ed. By C. Krosinsky.Wiley, Hoboken, New Jersey.
Statman, M. (2006), Socially responsible indices: Composition and performance. The Journal of Portfolio
Management, Spring 2006, Vol. 32, No. 3: pp. 100-109.
44
Staub-Bisang (Ed.), Sustainable Investing for Institutional Investors: Risk, Regulations and Strategies.
Wiley
Stern, N. (2006), The Economics of Climate Change.
Stern, N. (2012), Climate Change and the New Industrial Revolution. Presentation LSE, Lionel Robbins
Memorial Lecture Series, Feb 2012
Sullivan, R. (2011), Investment-grade Climate Change Policy: Financing the Transition to the Low-carbon
Economy. IIGCC, INCR, IGCC, UNEP FI.
Sustainability Forum (2010), Financing the Transformation to a Low-Carbon Economy. Rüschlikon, CH,
28.10.2010
UKSIF (2008), Sustainable Alternatives. Sustainable Investment Opportunities for Pension Funds in
Alternative Asset Classes.
UKSIF (2010), The Future of Investment: Sustainable Index Investing.
UKSIF (2012), The Future of Investment: Green Infrastructure. June 2012.
UNEP FI (2009), Fiduciary Responsibility. Legal and Practical Aspects of Integrating Environmental,
Social and Governance Issues into Institutional Investment. United Nations Environment Programme
Finance Initiative.
Urwin, R. (2010), Allocations to Sustainable Investing (May 1, 2010). Towers Watson Technical Paper
No. 1656955. Available at SSRN: http://ssrn.com/abstract=1656955 or doi:10.2139/ssrn.1656955
Urwin, R. (2011), Pension Funds as Universal Owners: Opportunity Beckons and Leadership Calls.
Rotman International Journal of Pension Management, Vol. 4(1), Spring 2011.
Wood, D. and Grace, K. (2011), A Brief Note on the Global Green Bond Market. Initiative for Responsible
Investment at Harvard University.
Woods, C. (2009), Funding Climate Change: how pension fund fiduciary duty masks trustee inertia and
short-termism. University of Oxford: School of Geography and the Environment, 2009. (Working Papers
in Employment, Work and Finance: WPG09-13).
World Economic Forum (2009), Green Investing. Towards a Clean Energy Infrastructure.
World Economic Forum (2010), Green Investing. Policy Mechanisms to Bridge the Financing Gap.
World Economic Forum (2011), Green Investing 2011. Reducing the Cost of Financing.
45
APPENDIX 1: EXAMPLES OF GREEN EQUITY INDICES
Dow Jones
Dow Jones started Sustainability Indices in 1999. It contains “sustainability leaders as identified by SAM,
an investment boutique, through a corporate sustainability assessment”. The „green‟ assessment criteria
include environmental reporting and industry-specific criteria such as such as climate change strategies,
energy consumption and eco-efficiency, environmental management systems, biodiversity and product
stewardship.
There is a range of world, regional and country indices. The approach is „best-of-class‟ in each sector. For
example, the World Index includes the top 10% of the total universe of 2500 companies. The regional
European, Asian and North American indices select the top 20% out of smaller universes. Sector
weightings remain constant while the country weightings differ from the standard Dow Jones indices.
At the end of 2010, over US$ 8bn were linked to the DJSI in all sorts of financial products.
FTSE
FTSE has three categories of „responsible investment‟ (RI) indices:
1. FTSE4Good Series
2. FTSE Environmental Market Series (a family of 18 indices covering, e.g. water and waste, energy
efficiency, renewable and alternative energy)
3. FTSE CDP Carbon Strategy Index Series
The first 2 series select companies via screening technique while the third uses a re-weighting approach.
FTSE works with independent research providers and independent expert committees.
FTSE4Good is a RI index established in 2001 that screens companies for their corporate social
responsibility, including environmental and climate change factors. Research is provided by Eiris and its
network.
FTSE Environmental Market is an index of companies with significant involvement in green technology,
renewable & alternative energy, energy efficiency, water technology and waste & pollution control.
Companies are identified by Impax Asset Management.
The FTSE CDP Carbon Strategy Index Series are carbon-risk-tilted versions of FTSE‟s established
benchmark indices. Companies are reweight on exposure to carbon risk with neutral sector weightings. The
aim is to track the established indices closely, except for the carbon element that may (or may not) affect
performance. FTSE cooperates with CDP and ENDS Carbon, a carbon performance and risk analysis
agency.
FTSE Environmental Markets Index
Global environmental technology companies are identified by Impax Asset Management as those businesses whose
activities provide value-added solutions to environmental problems, falling into one of the three categories below:
• Alternative Energy & Energy Efficiency e.g. wind turbine and solar manufacturers
• Water Technologies & Pollution Control e.g. filtration, purification & separation technology companies
• Waste Technologies & Resource Management e.g. production using recycled material
Impax Asset Management‟s selections are then approved by FTSE‟s Environmental Technology Advisory
Committee. Impax Asset Management then conduct further analysis on each of the selected companies, considering
each of the following parameters:
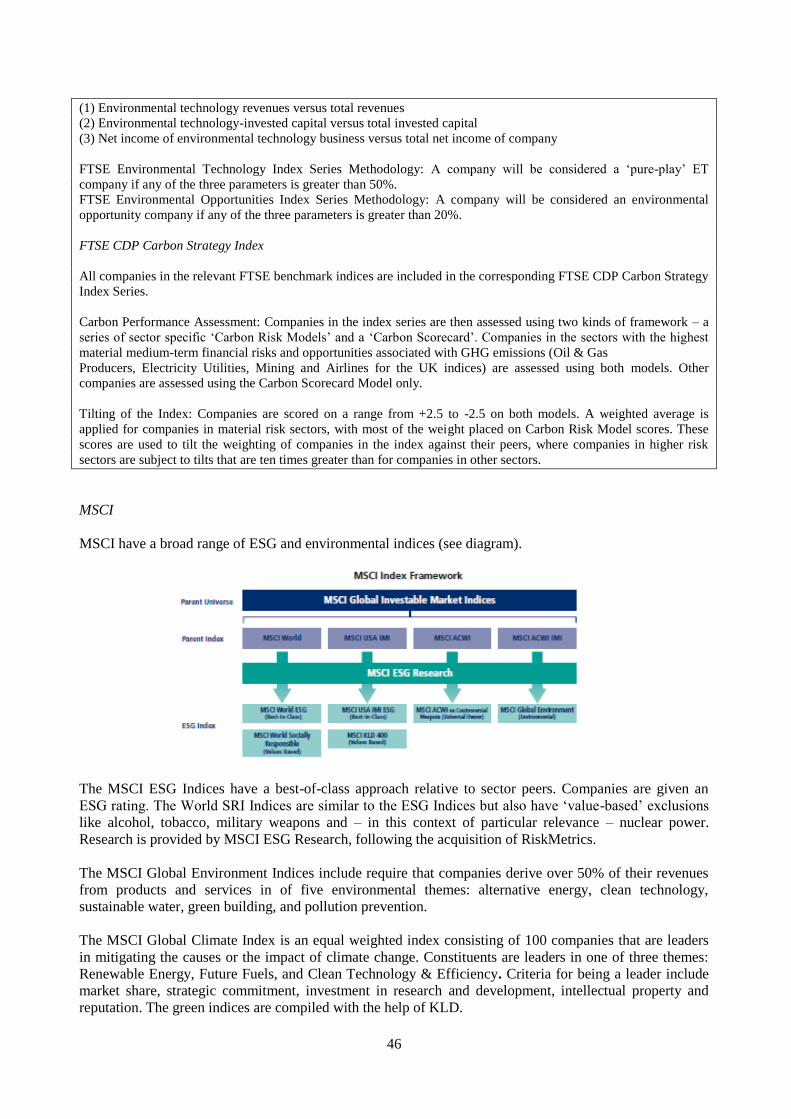
46
(1) Environmental technology revenues versus total revenues
(2) Environmental technology-invested capital versus total invested capital
(3) Net income of environmental technology business versus total net income of company
FTSE Environmental Technology Index Series Methodology: A company will be considered a „pure-play‟ ET
company if any of the three parameters is greater than 50%.
FTSE Environmental Opportunities Index Series Methodology: A company will be considered an environmental
opportunity company if any of the three parameters is greater than 20%.
FTSE CDP Carbon Strategy Index
All companies in the relevant FTSE benchmark indices are included in the corresponding FTSE CDP Carbon Strategy
Index Series.
Carbon Performance Assessment: Companies in the index series are then assessed using two kinds of framework – a
series of sector specific „Carbon Risk Models‟ and a „Carbon Scorecard‟. Companies in the sectors with the highest
material medium-term financial risks and opportunities associated with GHG emissions (Oil & Gas
Producers, Electricity Utilities, Mining and Airlines for the UK indices) are assessed using both models. Other
companies are assessed using the Carbon Scorecard Model only.
Tilting of the Index: Companies are scored on a range from +2.5 to -2.5 on both models. A weighted average is
applied for companies in material risk sectors, with most of the weight placed on Carbon Risk Model scores. These
scores are used to tilt the weighting of companies in the index against their peers, where companies in higher risk
sectors are subject to tilts that are ten times greater than for companies in other sectors.
MSCI
MSCI have a broad range of ESG and environmental indices (see diagram).
The MSCI ESG Indices have a best-of-class approach relative to sector peers. Companies are given an
ESG rating. The World SRI Indices are similar to the ESG Indices but also have „value-based‟ exclusions
like alcohol, tobacco, military weapons and – in this context of particular relevance – nuclear power.
Research is provided by MSCI ESG Research, following the acquisition of RiskMetrics.
The MSCI Global Environment Indices include require that companies derive over 50% of their revenues
from products and services in of five environmental themes: alternative energy, clean technology,
sustainable water, green building, and pollution prevention.
The MSCI Global Climate Index is an equal weighted index consisting of 100 companies that are leaders
in mitigating the causes or the impact of climate change. Constituents are leaders in one of three themes:
Renewable Energy, Future Fuels, and Clean Technology & Efficiency. Criteria for being a leader include
market share, strategic commitment, investment in research and development, intellectual property and
reputation. The green indices are compiled with the help of KLD.
47
MSCI Global Climate Index
The MSCI Global Climate Index is constructed to provide exposure to climate change themes such as:
• Renewable Energy
• Clean Technology and Efficiency
• Future Fuels
A brief description of each of these themes is included below.
Renewable Energy (RE)
RE includes companies whose products or practices involve renewable energy sources, which include solar, wind,
geothermal, hydroelectric, and tidal or wave power
• Develop technologies for generating energy from renewable sources;
• Generate electricity from renewable energy sources; or
• Consume energy generated from renewable sources.
This category may also include companies that supply materials, specific-use parts, and services to original
equipment manufacturers and generators of power from renewable energy sources.
Clean Technology and Efficiency (CTE)
CTE includes companies (other than RE companies) whose products or practices reduce greenhouse gas emissions
through:
• Technologies for producers or consumers that make more efficient use of fossil fuels;
• Products that make more efficient use of current fossil-fuel technologies; or
• Practices and policies that reduce the demand for fossil fuels.
Such clean technologies include hybrid (gas-electric) vehicles, cogeneration, energy-efficient (“green”) building
materials and buildings and cleaner-burning boiler technologies, among others. Practices and policies include
emissions credit trading, noteworthy consumer education, demand management services (utilities), advanced
metering, fleet management, innovative environmental management systems, and transportation (commuter, flying)
decisions.
Future Fuels (FF)
FF includes companies that develop, promote, or use any energy alternatives to coal, crude oil, and gasoline not
among the renewable energy sources, including biofuels, biomass, hydrogen fuel cells and fuel-cell-related
technology and infrastructure.
FF also includes companies engaged in the production and use of natural gas. Natural gas is considered to be a
“transitional” fuel because it is the cleanest burning of the fossil fuels and is expected to play a critical role in
reducing GHGs in the transition to a post-petroleum economy. Types of natural gas companies eligible for the GC100
include:
• Exploration and production companies whose primary business is in natural gas
• Natural gas pipeline and distribution companies; or
• Utilities that supply natural gas or generate a high proportion of their power from natural gasfired plants.
This category may also include companies that develop and market beneficial fuels such as:
• Bio-fuels (i.e. liquid fuels derived from biomass) such as biodiesel and ethanol;
• Gas to liquids (GTL);
• Compressed natural gas (CNG), liquefied natural gas (LNG), natural gas liquids (NGL) and other by-products of
natural gas production;
• Clean-burning synthetic fuels; or
• Landfill methane.
48
S&P
S&P‟s range of thematic indices includes Global and/or regional Eco indices, Water indices, Clean or
Alternative Energy indices. S&P also has a range of „Carbon efficient‟ and ESG indices.
As an example, the S&P Global Eco Index is comprised of the 40 largest publicly traded companies in
„ecology related industries‟. There are 3 ecology clusters: clean energy (15 stocks), water (15 stocks) and
environmental services (including waste management) (10 stocks). Companies are rated with exposure
scores between 0 and 1.
As an example of a regional index, there is the S&P Japan Eco Index with the 25 largest stocks in ecology
related sectors. In contrast to the global equivalent, there is a broader „alternative energy‟ cluster that
includes nuclear in addition to renewable energy.
The S&P Global Alternative Energy Index is a combination of the Clean Energy (30 stocks) and Nuclear
Index (24 stocks). The Clean Energy index is index contains the 30 largest publicly traded companies in
two clean energy clusters: producers and technology & equipment providers.
Standard and Poor's works with Trucost to build a range of carbon efficient indices. The S&P U.S. Carbon
Efficient Index seeks to replicate the returns of the S&P500 whilst reducing exposure to carbon emissions
by up to 50%. The S&P IFCI Carbon Efficient Index closely tracks the returns of the S&P IFCI Emerging
Markets whilst again considerably reducing exposure to carbon emissions. There is also a Japanese S&P
Topix 150 Carbon Efficient Index.
Trucost
Trucost specialises in low-carbon or carbon-optimized tracker indices. They have built a standardised
database, of 4500 companies globally, of the environmental impacts of companies (including carbon,
water, waste, metals and chemicals).
These indices have the same constituents as the parent benchmarks and are sector neutral, but companies
are re-weighted according to their carbon efficiency (relative to their sector). The aggregate carbon
emissions of the resulting indices are typically 25-50% lower than the parent indices, but because the
sector weights are neutral and the constituents identical, tracking error is very low.
The Carbon Footprint is calculated by Trucost Plc and is defined by the company‟s annual greenhouse gas
(GHG) emissions assessment, expressed as tons of carbon dioxide equivalent (CO2e) divided by annual
revenues.
“Trucost measures a company‟s environmental performance in quantitative terms. This data can then be used in
portfolio and index construction in just the same way as any mainstream analyst would use traditional metrics
such as P/E ratios or dividend cover. It can be used as a factor to screen a universe of stocks or when deciding
what weight to give a holding.”
Trucost Methodology
Trucost Plc (“Trucost”) has analyzed the environmental performance of over 4,200 companies worldwide. Trucost
has the world‟s largest bank of standardized greenhouse gas (“GHG”) emissions data, which provides a proxy for
carbon performance. To calculate the carbon intensity of any company included in the S&P U.S. Carbon Efficient
Index (“Index”), Trucost reviewed company annual reports and accounts, environmental/sustainability reports, public
disclosures and corporate Web sites.
However many companies do not disclose their environmental or carbon impacts. Where there was no public
disclosure, Trucost employed its environmental profiling system. This proprietary Input-Output model maps the GHG
impacts of business activities in 464 sectors. Trucost‟s broad coverage seeks to ensure that all non-disclosing
companies are considered for Index eligibility, not just those that disclose environmental information.

49
Six greenhouse gases (GHGs) are included in the analysis; these are all the GHGs regulated under the Kyoto protocol.
Each gas has a different capacity to cause global warming. Although carbon dioxide (“CO2”) is the least potent of the
GHGs, it is one of the most prevalent in terms of man-made emissions. The GHGs have been calculated for each
company and converted into tons of carbon dioxide equivalents based on the appropriate Global Warming Potential
factors. The Global Warming Potential (“GWP”) index, published by the Intergovernmental Panel on Climate Change
(“IPCC”), assesses the effect of the emissions of different gases over a 100-year time period, relative to the emission
of an equal mass of CO2. GWP enables all the GHGs to be expressed in terms of CO
2 equivalents, or CO
2e, and has
been used as the basis for the analysis for the index calculation.
Quantities of greenhouse gas emissions are, then, normalized by sales to calculate the company‟s carbon footprint, or
“carbon intensity”. The smaller the carbon footprint, the less investments contribute to climate change and the lower
the Index‟s exposure to the rising costs of emitting carbon dioxide.
Source: Standard & Poor‟s: S&P U.S. Carbon Efficient Index Methodology, Sep 2010
Bloomberg New Energy Finance / WilderHill
Bloomberg New Energy Finance is a provider of independent analysis, data and news in the clean energy
and carbon markets. They currently also calculate three regional clean energy stock indices for the
Americas, Europe/Middle East/Africa and Asia/Oceania.
The Wilderhill New Energy Global Innovation Index (NEX) is a global index of 97 companies listed on 25
exchanges in 22 countries whose innovative technologies and services focus on the generation and use of
cleaner energy, conservation, efficiency and the advancement of renewable energy in general. The NEX
Universe includes companies worldwide active in 7 sectors: wind, solar, biofuels, other
renewables, energy conversion, power storage, energy efficiency (not nuclear energy).
HSBC
HSBC launched an HSBC Climate Change Index in 2007. HSBC Global Climate Change Benchmark
index covers stocks which generate revenues, on a supply chain basis, from the provision of goods,
products and services directly linked to the industrial shift towards a low carbon economy. It comprises
four investment sectors: Low Carbon Energy Production (53%); Energy Efficiency & Energy Management
33%); Water, Waste & Pollution Control (15%) and Climate Finance (0.1%, i.e. only 3 companies).
The HSBC Climate Investable index covers the 50 largest and most liquid pure play constituents, i.e.,
where the climate change related revenue is more than 50 per cent of the total revenue of the company.
“Climate change related activities” includes 19 distinct industry sub-sectors: solar; wind; geothermal/hydro; gas;
biofuels; nuclear; integrated power; diversified renewable; agrochemicals; carbon trading; investment companies
(investment funds or other investment vehicles whose investment strategy states an emphasis on one of the other
18 sectors); fuel efficiency autos (including companies involved in the mining or processing of platinum, which is
used in certain technologies which aim to improve fuel efficiency); energy efficient solutions; building insulation;
fuel cells; power storage; water; waste and pollution control.”
Markit
The Market Carbon Disclosure Leadership Index tracks the performance of companies according to the
Carbon Disclosure Project (CDP) annual scores. It takes a sector neutral approach against major traditional
indices.
NASDAQ
The NASDAQ OMX Green Economy Index is designed to cover the entire „green economy‟. The Index
acts as a benchmark for the performance of stocks in the 13 sectors: advanced materials; biofuels; energy
efficiency; financial; green building; healthy living; natural resources; pollution mitigation; recycling;
renewable energy generation; lighting; transportation and water. It is comprised of over 350 securities.
Companies are selected by SustainableBusiness.com, LLC.
50
APPENDIX 2: INVESTOR INITIATIVES
There is a range of investor initiatives and networks, globally and nationally, in relation to responsible,
sustainable, long-term, green and climate change investing. Here are some prominent examples.
UN PRI
The United Nations-backed Principles for Responsible Investment Initiative (PRI) is an investor initiative
in partnership with UNEP Finance Initiative and the UN Global Compact. Currently, there are 979
signatories, of which 246 asset owners, 572 investment managers and 161 professional service partners. In
total, they manage assets over US$ 30tr. They phrased six Principles for Responsible Investment.
“As institutional investors, we have a duty to act in the best long-term interests of our beneficiaries. In
this fiduciary role, we believe that environmental, social, and corporate governance (ESG) issues can
affect the performance of investment portfolios (to varying degrees across companies, sectors, regions,
asset classes and through time).”
However, the UN PRI does not give a specific definition or set specific standards.
Principle 1 asks for the incorporation of ESG issues into investment analysis and decision-making process,
either in the form of ESG integration or screening.
Principle 3 demands appropriate disclosure on ESG issues by the entities invested in.
The main channels used by investors to collect ESG data are (PRI 2011b): 71% integrated financial
reports, 66% standalone CSR reports, 56% CDP. The rest are tailored surveys and other reports. 44% of
signatories suggest to companies the reporting framework of the GRI 44%, 13% the Global Framework for
Climate Risk Disclosure, and 28% other reporting frameworks.
Sustainable Investment Forums (SIFs)
The UK Sustainable Investment Forum (UKSIF) is a network for sustainable and responsible financial
services, founded in 1991. In 2000, SRI disclosure regulation became law in the UK.
Eurosif is a partnership of eight national Sustainable Investment Forums in Europe. Founded in 2001, it
now represents over € 1tr of assets. It aims to act as a voice for the SRI/ESG community.
The European SRI Study (Eurosif 2011a) uses a broad definition of SRI:
“a generic term covering any type of investment process that combines investors‟ financial objectives
with their concerns about Environmental, Social and Governance (ESG) issues.” (p. 7)
51
Such a definition would also subsume the common understanding of responsible (SRI) and impact
investing. Interestingly, just following SRI legislation does not count as „SRI should always be one step
ahead‟. Eurosif now segments the SRI market into core and broad SRI but expects categories to evolve
further over time:
Core SRI:
● Norms- and values/ethical-based exclusions (three or more criteria)
● Positive screening, including Best-in-Class and SRI thematic funds
Broad SRI:
● Simple screening (one or two exclusion criteria, norms-based or values/ethical based)
● Engagement
● Integration
Similar sustainable investment forums exist also in other regions, including US SIF, Social Investment
Organization (SIO) in Canada, Social Investment Forum Japan (SIF-Japan), Association for Sustainable &
Responsible Investment in Asia (ASrIA), Responsible Investment Association Australasia (RIAA) and
AfricaSIF.org.
IIGCC, INCR, IGCC, AIGCC, Ceres
The Institutional Investors Group on Climate Change (IIGCC) represents 75 European institutional
investors with over €7.5trn of assets under management who collectively recognise both the threat of
climate risk to their investments and the investment opportunities being created by a low-carbon economy.
The IIGCC brings investors together to use their significant collective influence to engage in dialogues
with policymakers, investors and companies to accelerate the shift to a low carbon economy.
The Investor Network on Climate Risk (INCR) is a similar, US based network. It has 100 members
managing assets of nearly US$ 10tr. It emerged within Ceres. Ceres is a non-profit organization founded in
1989 with over 130 member organizations (investors, environmental organizations etc.) to engage with
corporations to promote a sustainable economy.
The Australian and New Zealand based Investor Group on Climate Change (IGCC) represents over 60
investors with assets of $700bn. The Asia Investor Group on Climate Change (AIGCC) is being
established by ASrIA with support from financial institutions across the region. The launch is scheduled
for March 2012.
Equator Principles
The voluntary Equator Principles (EP) are a credit risk management framework for determining, assessing
and managing environmental and social risk in project finance transaction. They are based on the IFC
Performance Standards on social and environmental sustainability and on the World Bank Group
Environmental, Health and Safety Guidelines. Currently, there are 73 adopting financial institutions in 27
countries.
52
Among others, the EP demand an environmental review and impact assessment. Projects are categorized
into 3 groups:
Category A – Projects with potential significant adverse social or environmental impacts that are
diverse, irreversible or unprecedented;
Category B – Projects with potential limited adverse social or environmental impacts that are few in
number, generally site-specific, largely reversible and readily addressed through mitigation measures;
and
Category C – Projects with minimal or no social or environmental impacts.
The illustrative list of issues includes the following „environmental‟ points:
a) assessment of the baseline social and environmental conditions
b) consideration of feasible environmentally and socially preferable alternatives
c) requirements under host country laws and regulations, applicable international treaties and
agreements
f) protection and conservation of biodiversity, including endangered species and sensitive ecosystems in
modified, natural and critical habitats, and identification of legally protected areas
g) sustainable management and use of renewable natural resources (including sustainable resource
management through appropriate independent certification systems)
h) use and management of dangerous substances
i) major hazards assessment and management
r) efficient production, delivery and use of energy
s) pollution prevention and waste minimisation, pollution controls (liquid effluents and air emissions)
and solid and chemical waste management.
ClimateWise
ClimateWise is the global insurance industry‟s leadership group on climate change, focused on reducing
the risks of climate change. There are 41 members with several hundreds of thousands of employees in
total.
The 6 ClimateWise principles provide a framework for insurance companies worldwide to set out how they
will build climate change into their business operations. Principles 4, „Incorporate climate change into our
investment strategies‟, calls for the following actions:
Consider the implications of climate change for company performance and shareholder value, and
incorporate this information into our investment decision-making process
• Encourage appropriate disclosure on climate change from the companies in which we invest
• Encourage improvements in the energy-efficiency and climate resilience of our investment
property portfolio
• Communicate our investment beliefs and strategy on climate change to our customers and
shareholders
• Share our assessment of the impacts of climate change with our pension fund trustees.
Long-term Investors Club, P8
The Long-term Investor Club aims to bring together major worldwide institutions including sovereign
wealth funds, public sector retirement funds, private sector pension funds, economists, financial policy
makers, and regulators to assert their common identity as long-term investors (defined as having low
short/medium-term obligations). It was founded by four European investment banks and has now 14
members globally, including 2 pension funds.
The P8 Group consists of 12 of the world‟s leading pension funds and SWFs collectively managing USD 3
trillion. Members are made up of 4 funds from the United States, 4 from Europe, 3 from Asia and 1 from
53
Australia. The P8 Group (http://en.wikipedia.org/wiki/P8_Group - cite_note-0) aims to develop actions
relating to global issues and particularly climate change.
Carbon Disclosure Project
The Carbon Disclosure Project (CDP) is an independent not-for-profit organization working to drive
greenhouse gas emissions reduction and sustainable water use by business and cities. CDP signatories are
the banks, pension funds, asset managers, insurance companies and foundations that endorse the annual
climate change and water questionnaires which are sent to the world‟s largest listed companies. It currently
covers 655 institutional investors representing in excess of US$78 trillion in assets.
The Carbon Disclosure Project Carbon Action Initiative (see www.cdproject.net), represents 92 pension
funds, asset managers, insurers and banks, and makes annual requests to the largest, most carbon intensive
companies in the world to take cost effective measures to improve their energy efficiency. This action is
followed up via shareholder engagement with senior management in companies to challenge inaction and
making the case for improvement.
Asset Owners Disclosure Project
The new Asset Owners Disclosure Project is an independent global not-for-profit organisation whose
objective is to protect members' retirement savings from the risks posed by climate change. It aima to do
this by helping funds to redress the huge imbalance in their investments between high-carbon assets (50-
60% of a portfolio) and low-carbon assets (typically less than 2%) and realigning the investment chain to
adopt long-term investment practices.Activities include investor surveys, benchmarking of asset owners
and best practice reporting. It is expanding globally in 2012 from an Australian pilot project.
Global Reporting Initiative
The Global Reporting Initiative (GRI) is a non-profit organization that promotes economic, environmental
and social sustainability. GRI provides all companies and organizations with a comprehensive
sustainability reporting framework that is widely used around the world. 1859 organizations from over 60
countries reported in 2010 using the GRI Guidelines.
54
WORKING PAPERS PUBLISHED TO DATE
The full series is listed below in chronological order. Prior to March 2010, the series was named
OECD Working Papers on Insurance and Private Pensions. All working papers can be accessed online at:
www.oecd.org/daf/fin/wp.
2012
WP 22: Financial Education, Savings and Investments
WP 19: Annual DC Pension Statements and the Communications Challenge
WP 18: Lessons from National Pensions Communication Campaigns
WP17: Review of the Swedish National Pension Funds
WP16: Current Status of National Strategies for Financial Education: A Comparative Analysis and
Relevant Practices
WP15: Measuring Financial Literacy: Results of the OECD INFE Pilot Study
WP14: Empowering Women Through Financial Awareness and Education
2011
WP13: Pension Funds Investment in Infrastructure: Policy Actions
WP12: Designing Optimal Risk Mitigation and Risk Transfer Mechanisms to Improve the Management of
Earthquake Risk in Chile
WP11: The Role of Guarantees in Defined Contribution Pensions
WP10: The Role of Pension Funds in Financing Green Growth Initiatives
WP9: Catastrophe Financing for Governments
WP8: Funding in Public Sector Pension Plans - International Evidence
WP7: Reform on Pension Fund Governance and Management: The 1998 Reform of Korea National
Pension Fund
2010
WP6: Options to improve the governance and investment of Japan‟s Government Pension Investment Fund
WP5: The New IAS 19 Exposure Draft
WP4: The EU Stress Test and Sovereign Debt Exposures
WP3: The Impact of the Financial Crisis on Defined Benefit Plans and the Need for Counter-Cyclical
Funding Regulations
WP2: Assessing Default Investment Strategies in Defined Contribution Pension Plans
WP1: Framework for the development of financial literacy baseline surveys: A first international
comparative analysis
OECD Working Papers on Insurance and Private Pensions
WP41: Policy Action in Private Occupational Pensions in Japan since the Economic Crisis of the 1990s
WP40: Pension Funds‟ Risk-management Framework: Regulation and Supervisory Oversight
WP38: Managing investment risk in defined benefit pension funds
55
2009
WP37: Investment Regulations and Defined Contribution Pensions
WP36: Private Pensions and Policy Responses to the Financial and Economic Crisis
WP35: Defined-contribution (DC) arrangements in Anglo-Saxon Countries
WP34: Evaluating the Design of Private Pension Plans: Costs and Benefits of Risk-Sharing
WP33: Licensing Regulation and the Supervisory Structure of Private Pensions: International Experience
and Implications for China
WP32: Pension Fund Investment in Infrastructure
WP31: Pension Coverage and Informal Sector Workers: International Experiences
WP30: Pensions in Africa
2008
WP29: Ageing and the Payout Phase of Pensions, Annuities and Financial Markets
WP27: Fees in Individual Account Pension Systems: A Cross-Country Comparison
WP26: Forms of Benefit Payment at Retirement
WP25: Policy Options for the Payout Phase
WP24: National Annuity Markets: Features and Implications
WP23: Accounting for Defined Benefit Plans: An International Comparison of Exchange-Listed
Companies
WP22: Description of Private Pension Systems
WP21: Comparing Aggregate Investment Returns in Privately Managed Pension Funds: an initial
assessment
WP20: Pension Fund Performance
WP19: Coverage of Funded Pension Plans
WP18: Pension Fund Governance: Challenges and Potential Solutions
WP17: Funding Regulations and Risk Sharing
WP16: Evaluating the Impact of Risk Based Funding Requirements on Pension Funds
WP15: Governance and Investment of Public Pension Reserve Funds in Selected OECD Countries
WP14: Reforming the Valuation and Funding of Pension Promises: Are Occupational Pension Plans Safer?
2007
WP13: Pension Fund Investment in Hedge Funds
WP11: Implications of Behavioural Economics for Mandatory Individual Account Pension Systems
WP10: Portfolio Investment in an Intertemporal Setting: Assessment of the Literature and Policy
Implications for Latin American Pension Systems
WP9: Collective Pension Funds: International Evidence and Implications for China's Enterprise Annuities
Reform
WP8: Pension Fund Regulation and Risk Management
WP7: Survey of Investment Choice by Pension Fund Members
WP6: Benefit Protection: Priority Creditor Rights for Pension Funds
WP5: Benefit Security Pension Fund Guarantee Schemes
WP4: Governments and the Market for Longevity-Indexed Bonds
WP3: Longevity Risk and Private Pensions
WP2: Policy Issues for Developing Annuities Markets
2006
WP1: Funding Rules and Actuarial Methods