Embed Size (px)
Citation preview
DEFECT ANALYSIS ON CASTING BY SIX SIGMA - QC TECHNIQUES TO MINIMIZE THE DEFECTS AND IMPROVE THE PRODUCTIVITY IN OIL PUMP
CASTING
SUNDAR SINGH SIVAM S.P1*, .SARAVANAN2, N. PRADEEP2, S.RAJENDRAKUMAR1, AND K. SATHIYAMOORTHY1
1Department of Mechanical Engineering, SRM University, Kancheepuram District, Kattankulathur- 603203, Tamil Nadu, India.
2Department of Mechatronics Engineering, SRM University, Kancheepuram District, Kattankulathur- 603203, Tamil Nadu, India.
(Received 25 May, 2017; accepted 22 December, 2017)
Key words: Defects, Casting, Blow holes, Productivity, Quality, Six sigma
Jr. of Industrial Pollution Control 33(2)(2017) pp 1714-1725www.icontrolpollution.comResearch Article
*Corresponding authors email: [email protected]
INTRODUCTION In today’s market of economic process and competition, Indian industries are required to adopt advanced breakthrough quality improvement strategy like Six sigma and alternative continuous quality improvement techniques. Quality and productivity are an integral component of organisations’ operational ways (Juran, 1988). within the globalization of markets and operations, concentrate on quality and productivity is of utmost importance (Feigenbaum, 1991; Elshennawy, et al., 1991). Quality improvement in operations and
production has been one among the foremost important influences for organisation to achieve success (Pande, et al., 2000). company consistently strives to create quality into their products based on client needs (In today’s market of economic process and competition, Indian industries are required to adopt advanced breakthrough quality improvement strategy like Six sigma and alternative continuous quality improvement techniques. Quality and productivity are an integral component of organisations’ operational ways (Juran, 1988). within the globalization of markets and operations,
ABSTRACT
The quick ever-changing economic conditions like global competition, client demand for top quality product, product selection and reduced interval, declining margin of profit etc. had a significant impact on producing industries. Six sigma is statistical and scientific strategies to reduce the defect rates and achieve improved quality. A case study carried out for a casting producing business. the target of the study is to reduce blow hole rejections by a) Improved cooling system in die b) Separate cooling line for OCV hole core pin c) Parameter setting changes d) Implementation of squeeze system to reduce internal porosity. Six sigma methodologies are used for the part in oil pump Casting. The key tools employed in this work are the project charter, process map and cause-and-effect diagram. To determine mathematically the correlation of defects with the mould hardness, green strength, and pouring rate additionally to seek out their optimum values needed to reduce or eliminate the defects. The experimental results were statistically analyzed and modelled through Taguchi analysis. based on the findings, improved cooling system in die. Separate cooling line for OCV hole core pin, Parameter setting changes, Implementation of squeeze system to reduce internal porosity. The optimized method parameters are taken for experiment and better performance obtained in the production process was confirmed. The comparison between the existing and the projected method has been tried during this paper and also the results are mentioned thoroughly.
1715 SIVAM ET AL.
concentrate on quality and productivity is of utmost importance (Feigenbaum, 1991; Elshennawy, et al., 1991). Quality improvement in operations and production has been one among the foremost important influences for organisation to achieve success (Pande, et al., 2000). company consistently strives to create quality into their products based on client needs (Juran, 1988). For manufacturing quality products, continuous improvement (CI) methodologies are developed to induce higher productivity of the operations (Hobbs, 2004; Nave, 2002). throughout the past 20 years, the standard progress has provided a broad collection of CI methods to accelerate the method of rising quality and productivity that supports the business growth (Cox, et al., 2003). Six sigma is one of the recent CI approaches that are applied within the best-in-class firms (Bessant and Francis, 1999). Six sigma could be a highly structured process improvement framework that uses each applied math and non-statistical tools and techniques to eliminate method variation and thereby improve method performance and capability (Antony and Banuelas, 2002). Minimising defects to the amount of 3.4 defects per Million opportunities (DPMO) is at the guts of this technique (Harry, 1998; McAdam and Lafferty, 2004). to realize target, this approach seeks to identify and eliminate defects, mistakes or failures in business processes by focusing on process performance characteristics (Snee, 2004). Six sigma approach are found to be vital profit drivers in a style of industries (Caulcutt, 2001), highlighting the economic dimension of quality improvement. By using DMAIC methodology, most of the Six sigma efforts are centered on taking variability out of the existing processes (Park, 2003; Bhote, 2002). DMAIC is anagram of the most important phases at intervals the methodology particularly, outline measure, analyse, improve and management (Breyfogle, 1999a). The outline part entails the definition of the matter and critical-to-quality (CTQ) characteristic. The measure phase selects most applicable quality characteristic to be improved and establishes metrics. In analysis part, the foundation causes of defect are analysed. In improve part, simple however powerful statistical tools/techniques are accustomed reduce the defect or method variations. in control part, the approach of sustaining the advance is developed and place effective (Pyzdek, 2001; Montgomery, 1998). The DMAIC frame work utilises numerous tools and techniques like management charts, quality perform preparation (QFD), failure mode and impact analysis (FMEA), style of experiments (DoE) and statistical method control (SPC) for variation management to drive out defects in
operations. Among the offered collection of tools and techniques, application of DoE is at the guts of DMAIC cycle (Breyfogle, 1999a). Casting is that the opening move within the manufacture of metallic component in which the material is liquefied by heating and poured into previous ready mould cavity wherever it's allowed to solidify. Removing the solidified component from the mould cavity and cleansed to form. In casting method there are several defects occur, these defects reduced by different researchers as (Bhupinder, 2014) in a manufactory business. The business make submersible pumps elements like higher housing Motor pulley, higher housing, mini Chaff cutter wheel in large scale and rejection comes within the type of slag inclusions in forged iron casting. These parameters were chosen for complete analysis. to minimize the rejection use DMAIC approach. the idea of six letter (Satish, 2014) which is disciplined, data-driven methodology that was developed to boost producing quality, company profit and business method. several organizations have tried to use Six-Sigma DMAIC approach and its tools to induce optimized structure achievements. The producing business is explores the amount of issue and level of usage of various tools of DMAIC approach. (Abidakun, et al., 2014) paper explains Six sigma DMAIC analysis in an aluminium mill in order to identify sources and causes of waste with offer veritable solutions. DMAIC approaches are justified (Vikas, et al., 2015) and minimize sand casting defects once root reason behind defect isn't traceable. Business strategy accustomed improve (Virender, et al., 2014) business and potency to satisfy client desires and expectations. The sand castings management the varied parameters with DMAIC technique. The results show that the sand casting rejection due has been reduced from 6.98% to 3.10 try to the defects because of Blow holes were reduced from 2.74% to 0.11% by increasing the permeability and reducing the moisture of sand. (Suraj, et al., 2015) Use of design of experiments (DOE) and analysis of variance (ANOVA) techniques each square measure combined to see statistically the correlation of defects with the inexperienced strength, mould hardness, and running rate conjointly to search out their optimum values required to reduce the defects. Indian manufactory rejection rate (Binu and Anilkumar, 2013) is one among major issues, thus cut back this rejection by modifying methodology and style the tool to offers higher forgeding quality and increase the production cast. (Kumaravadivel, et al., 2011; Sundar, et al., 2015; Sundar, et al., 2015; Sundar, et al., 2016; Sundar, et al., 2016) implement the DMAIC primarily based Six letter Approach so
1716
DEFECT ANALYSIS ON CASTING BY SIX SIGMA - QC TECHNIQUES TO MINIMIZE THE DEFECTS AND IMPROVE THE PRODUCTIVITY IN OIL PUMP CASTING
as to attenuate the prevalence of defects and increase the letter level of sand casting method. In today’s challenging market, each organization is trying to realize higher quality and productivity. this may be simply achieved if you concentrate on the reduction in numerous defects that inflicting rejection of the elements. this is often the foremost viable strategy and it'll conjointly lead the organization towards effectiveness in competitive market. the first objective of this Study is concentrated on Rejection Reduction in case oil pump Blow Hole Rejection through Six sigma – QC Techniques. The objectives here are improved cooling system in die, Separate cooling line for OCV hole core pin, Parameter setting changes, Implementation of squeeze system to reduce internal porosity.
MATERIALS AND METHODSPareto chart
The diagram is a graphical representation of the law. The various categories are listed across the bottom of a graph, then the cumulative totals are plotted as percentages. Starting with the largest number to the left, the diagram is formed. It is clearly seen that a small portion of activities are more important and contribute most towards the objective. A large proportion is trivial in their contribution. It can be shown quickly which category is clearly more important. Thus, the chart helps to identify the ‘Vital Few from Trivial Many’ and to concentrate on the vital few for improvement. Six-pack charts include different six different packs and are provided in the format of one diagram.
Control charts
Among seven SPC tools, control diagram is the most important part. Control chart based upon measurements of quality characteristics such as Squeeze Time, Weld Time, Hold Time and Pressure are called as control charts for variables. The process variations are controlled using control diagrams, and defective products are avoided by some preventive actions. Here, it means controls diagrams R, and X are the most popular control charts.
Control charts R, X
X charts control the process average whereas R charts control the process dispersion or variability. If X1, X2 … Xn is a sample with n members for given quantitative attributes, and then the mean for these samples are as follows:
1 2 3 .....x x x xn Xn
+ + + +=
According to the central limit theorem, selecting appropriate sample size, distribution X tends to normal distribution. Thus, 99.72% of data is placed within the following control limits.
3x xucl µ σ= +
xcl µ=
3x xlcl µ σ= −
Hence, control limits for X diagram can be determined, having the mean and standard deviation for Xs society [14].
Statistical principles for R (range) control charts
R is applied as an estimate for standard deviation. The process variability are controlled, depicting R values on the control diagram. This control diagram is called R diagram. Limits calculations for these diagrams are performed as easily as X diagram calculations, assuming that Ri refer to variations between the maximum and minimum data in i-th sample. When the control limits of diagrams are calculated using initial samples, it is necessary to depict the mean and range oversamples on X , R Diagrams and connect the points to each other on diagrams for studying them. If the points on diagrams show an out of control state or a non-random pattern, causes must be studied. Other on diagrams for studying them. If the points on diagrams show an out of control state or a non-random pattern, causes must be studied.
Dispersion chart
Clearly, sampling must be performed during various periods with few numbers so that data would have the most important attribute for comprehensiveness. Random sampling in long period of time is required to obtain better results. It is recommended that the number of data in each group not to exceed from five. Dispersion diagram shows data by the format of its group as well as the data in each group which is in vertical line. Dispersion diagram indicates the quantitative level of data in each group. It also shows how far data is quantitatively close to each other. It allows us to compare different groups with each other to identify the relationships among them in terms of their component numbers. Finally, it helps to compare process performance during various periods and evaluate it implicitly.
Histogram
Histogram represents variation in sets of data graphically. Histograms are bar graph display i.e., vertical rectangles drawn side by side. The most generally used graph for showing frequency distributions, in a set of data occurs. Many data
1717 SIVAM ET AL.
are categorized in a specific format in order that the problem can be understood and analysed more simply. It is obvious that data grouping and graphic display help us significantly to decide logically and effectively. It provides an image for data, by which three following attributes can be understood and observed more simply: a) Form of data frequency distribution b) Location with central tendency for distribution c) Dispersion by distribution development. Usually, in the best situation, a common pattern is the bell-shaped curve known as the “normal distribution.” In a normal distribution, points are as likely to occur on one side of the average as on the other [15].
Cp, Cpk indices (process capability indices)
Process capability is one amongst the necessary things in production associated with Casting. A method is also controlled statistically, however its product might not be within the vary being thought of by the client. Victimisation method capability indices, a selected production vary is decided for a part as a fraction of its tolerance varies. Production method capabilities are often known victimisation Cp index:
6pusl lslC
σ−
=
Is an estimate of standard deviation for the society of production process. It is given by:
2[ ( )]1x
n x xnn
σ σ −= =
−
Different values calculated for Cp index indicate method state as follows:
1. Cp>1 has method capability for manufacturing a part within the vary being thought of by the attachment Quality.
2. Cp=1 has method capability for manufacturing a part within the vary being thought of by the attachment Quality with the likelihood of manufacturing a defective part.
3. Cp<1 has not method capability for manufacturing a part within the vary being thought of by the attachment Quality and a defective part is definitely made by this method [16].
Considering Cp formula, decreasing the vary of production method is one amongst the factors effective on rising Cp index. Thus, the smaller method dispersion or is, the upper production method capability is. Cp index, freelance of production method vary is placed during which a part of tolerance vary, will have numbers larger
than one, i.e., it should be Cp>1 whereas all made parts square measure outside of the tolerance vary. Because of this defect in Cp, another index is introduced to contemplate the assembly method dispersion, likewise on appraise the method location to tolerance vary. This issue, called Cpk, is displayed as follows:
min{( ), ( )}3pk
usl x x lslCσ
− −=
In the above relation, is that the variance for production method, also being used in Cp formula. If the production mean is found within the middle of tolerance vary, Cp= Cpk; otherwise, Cp>Cpk. Cpk shows method capability for manufacturing a given attribute additional exactly than Cp [16].
Process Capability Analysis
According to Montgomery (2000) the subsequent crucial assumptions are created and valid before estimating the method capability for Spot attachment operation. The assumptions here square measure one. The process should be in state of applied math management. 2. The standard characteristic incorporates a distribution. 3. Within the case of 2 sided specifications, the method mean is targeted between the lower and higher specification limits.4. Observations should be random and independent of every alternative.
CASE STUDYThe Company
A case study has been carried out in a small-scale business that is manufacturing numerous Casting for the Die Casting Machine. This company is AN ISO 9001:2008 certified and comprising well equipped machine tools. Their core ability lies within the production of big selection of product like casting numerous styles of Die Casting Machines. This company is producing their numerous products with 1st process as pressure die casting administered on cold chamber pressure die casting machines and that they face the matter of rejection and make over in their numerous products. supported sales worth of assorted product, product named pump is chosen for reducing rejection/rework.
Rejection Data (Before taking action)
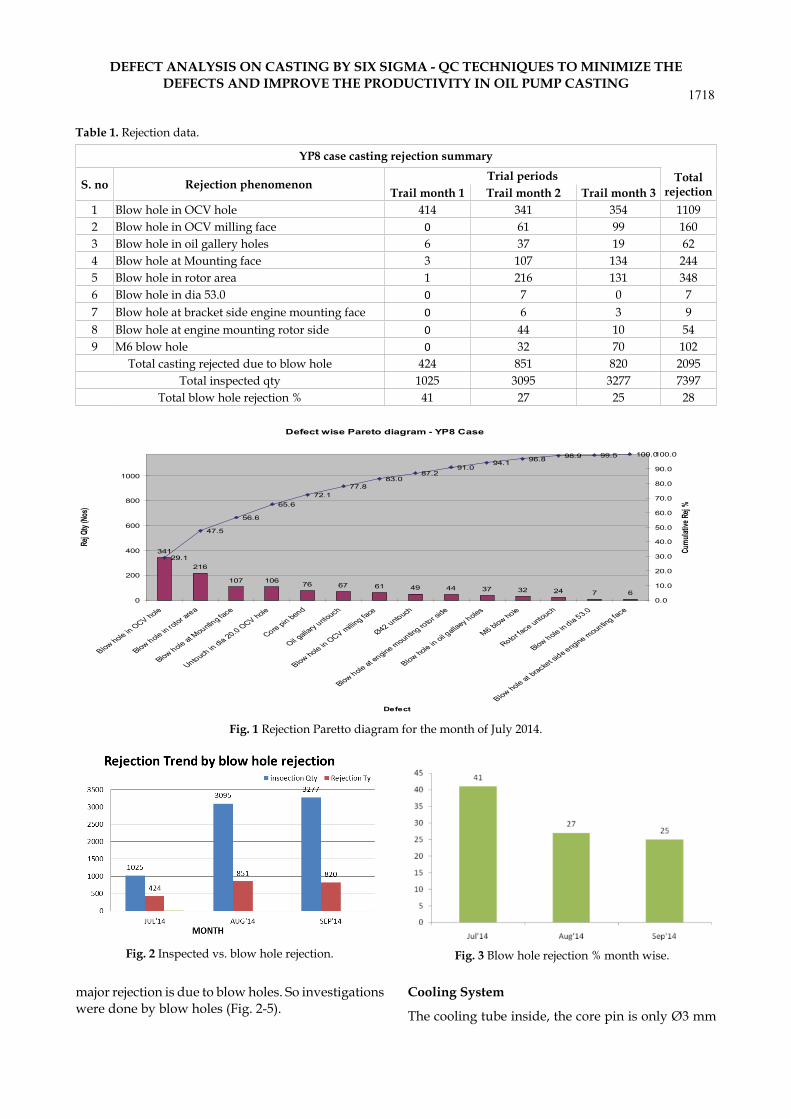
The various experimental methods and techniques followed in the present investigations are described in this section (Table 1).
Rejection Paretto Diagram for the Month of Trial Month 1
From the above (Fig. 1), paretto diagram shows the
1718
DEFECT ANALYSIS ON CASTING BY SIX SIGMA - QC TECHNIQUES TO MINIMIZE THE DEFECTS AND IMPROVE THE PRODUCTIVITY IN OIL PUMP CASTING
major rejection is due to blow holes. So investigations were done by blow holes (Fig. 2-5).
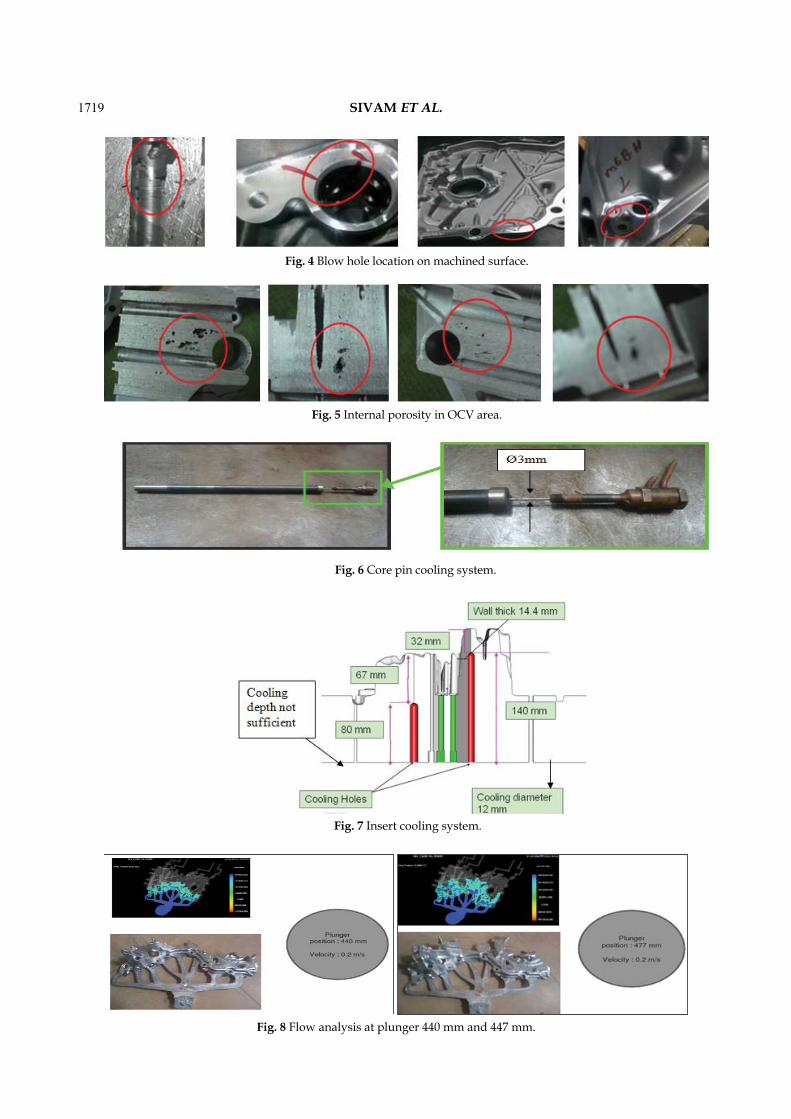
Cooling System
The cooling tube inside, the core pin is only Ø3 mm
Defect wise Pareto diagram - YP8 Case
341
216
107 106 76 67 61 49 44 37 32 24 7 6
29.1
47.5
56.6
65.672.1
77.883.0
87.291.0
94.1 96.8 98.9 99.5 100.0
0
200
400
600
800
1000
Blow hole in OCV hole
Blow hole in rotor area
Blow hole at Mounting face
Untouch in dia 20.0 OCV hole
Core pin bend
Oil gallary untouch
Blow hole in OCV milling face
Ø42 untouch
Blow hole at engine mounting rotor side
Blow hole in oil gallaey holes
M6 blow hole
Rotor face untouch
Blow hole in dia 53.0
Blow hole at bracket side engine mounting face
Defect
Rej Q
ty (N
os)
0.0
10.0
20.0
30.0
40.0
50.0
60.0
70.0
80.0
90.0
100.0
Cumu
lative
Rej
%
Fig. 1 Rejection Paretto diagram for the month of July 2014.
Fig. 2 Inspected vs. blow hole rejection.
YP8 case casting rejection summary
S. no Rejection phenomenonTrial periods Total
rejectionTrail month 1 Trail month 2 Trail month 31 Blow hole in OCV hole 414 341 354 11092 Blow hole in OCV milling face 0 61 99 1603 Blow hole in oil gallery holes 6 37 19 624 Blow hole at Mounting face 3 107 134 2445 Blow hole in rotor area 1 216 131 3486 Blow hole in dia 53.0 0 7 0 77 Blow hole at bracket side engine mounting face 0 6 3 98 Blow hole at engine mounting rotor side 0 44 10 549 M6 blow hole 0 32 70 102
Total casting rejected due to blow hole 424 851 820 2095Total inspected qty 1025 3095 3277 7397
Total blow hole rejection % 41 27 25 28
Table 1. Rejection data.
Fig. 3 Blow hole rejection % month wise.
1719 SIVAM ET AL.
Fig. 4 Blow hole location on machined surface.
Fig. 5 Internal porosity in OCV area.
Fig. 6 Core pin cooling system.
Fig. 7 Insert cooling system.
Fig. 8 Flow analysis at plunger 440 mm and 447 mm.
1720
DEFECT ANALYSIS ON CASTING BY SIX SIGMA - QC TECHNIQUES TO MINIMIZE THE DEFECTS AND IMPROVE THE PRODUCTIVITY IN OIL PUMP CASTING
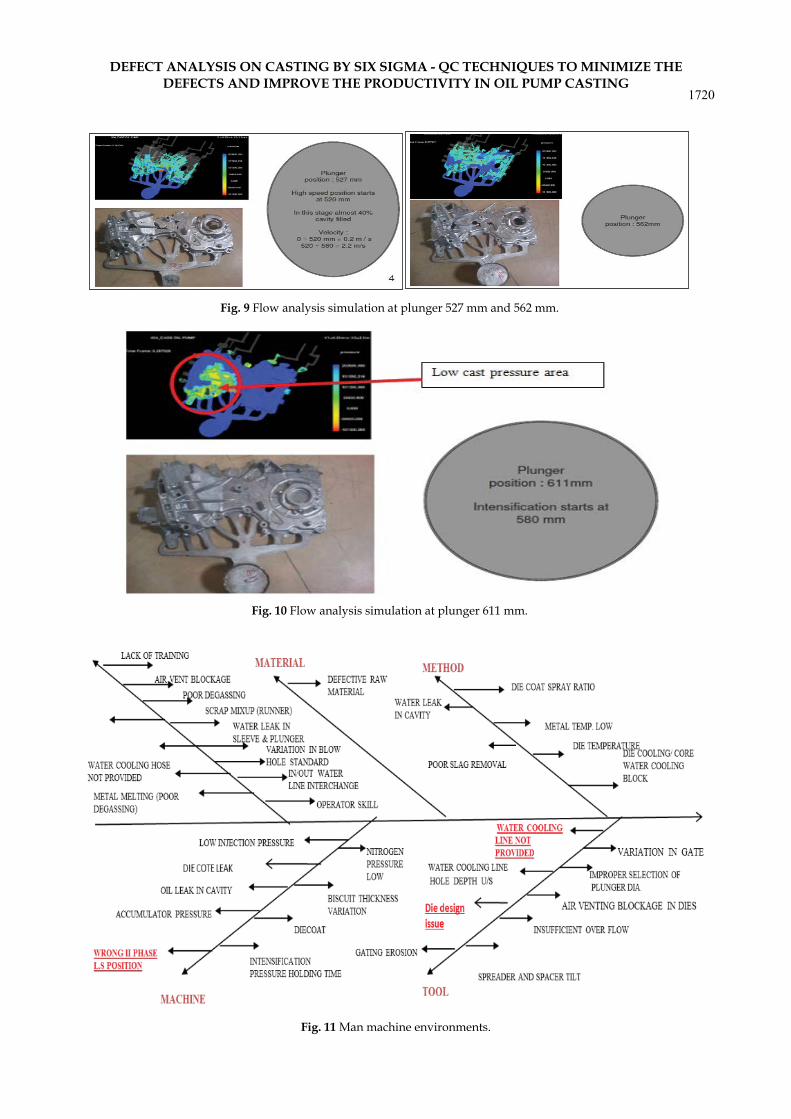
Fig. 9 Flow analysis simulation at plunger 527 mm and 562 mm.
Fig. 10 Flow analysis simulation at plunger 611 mm.
Fig. 11 Man machine environments.
1721 SIVAM ET AL.
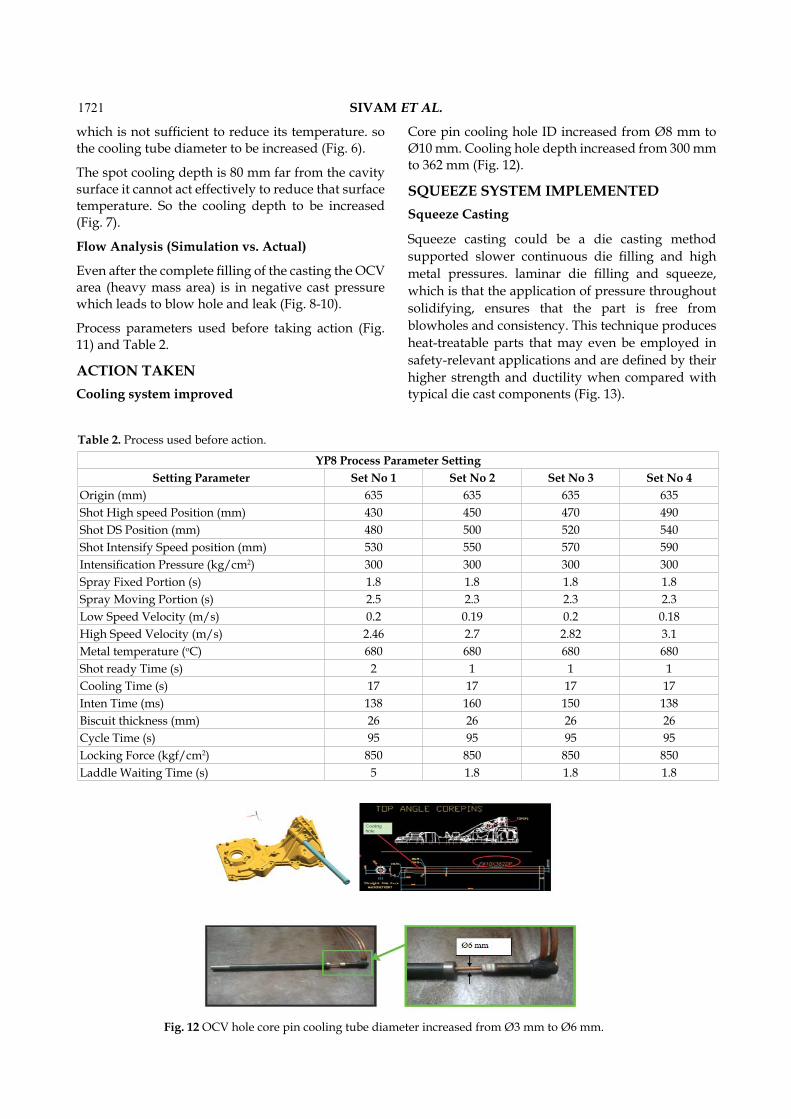
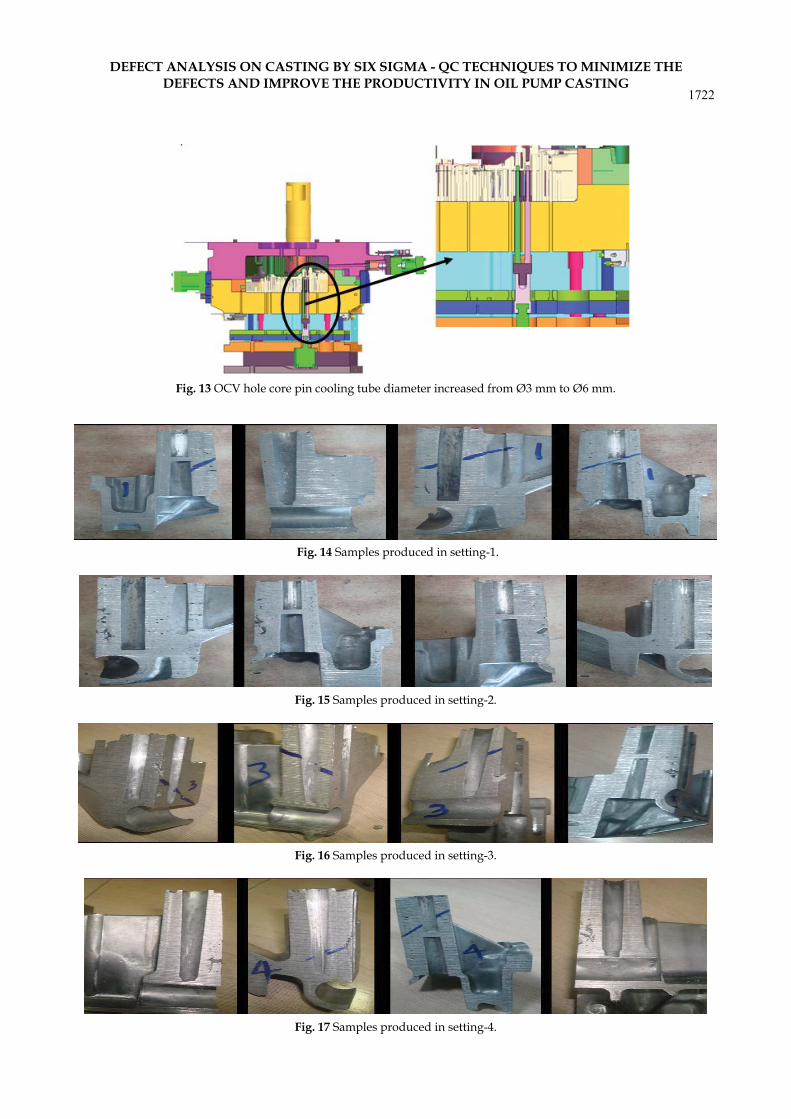
Fig. 12 OCV hole core pin cooling tube diameter increased from Ø3 mm to Ø6 mm.
YP8 Process Parameter SettingSetting Parameter Set No 1 Set No 2 Set No 3 Set No 4
Origin (mm) 635 635 635 635Shot High speed Position (mm) 430 450 470 490Shot DS Position (mm) 480 500 520 540Shot Intensify Speed position (mm) 530 550 570 590Intensification Pressure (kg/cm2) 300 300 300 300Spray Fixed Portion (s) 1.8 1.8 1.8 1.8Spray Moving Portion (s) 2.5 2.3 2.3 2.3Low Speed Velocity (m/s) 0.2 0.19 0.2 0.18High Speed Velocity (m/s) 2.46 2.7 2.82 3.1Metal temperature (oC) 680 680 680 680Shot ready Time (s) 2 1 1 1Cooling Time (s) 17 17 17 17Inten Time (ms) 138 160 150 138Biscuit thickness (mm) 26 26 26 26Cycle Time (s) 95 95 95 95Locking Force (kgf/cm2) 850 850 850 850Laddle Waiting Time (s) 5 1.8 1.8 1.8
Table 2. Process used before action.
which is not sufficient to reduce its temperature. so the cooling tube diameter to be increased (Fig. 6).
The spot cooling depth is 80 mm far from the cavity surface it cannot act effectively to reduce that surface temperature. So the cooling depth to be increased (Fig. 7).
Flow Analysis (Simulation vs. Actual)
Even after the complete filling of the casting the OCV area (heavy mass area) is in negative cast pressure which leads to blow hole and leak (Fig. 8-10).
Process parameters used before taking action (Fig. 11) and Table 2.
ACTION TAKENCooling system improved
Core pin cooling hole ID increased from Ø8 mm to Ø10 mm. Cooling hole depth increased from 300 mm to 362 mm (Fig. 12).
SQUEEZE SYSTEM IMPLEMENTEDSqueeze Casting
Squeeze casting could be a die casting method supported slower continuous die filling and high metal pressures. laminar die filling and squeeze, which is that the application of pressure throughout solidifying, ensures that the part is free from blowholes and consistency. This technique produces heat-treatable parts that may even be employed in safety-relevant applications and are defined by their higher strength and ductility when compared with typical die cast components (Fig. 13).
1722
DEFECT ANALYSIS ON CASTING BY SIX SIGMA - QC TECHNIQUES TO MINIMIZE THE DEFECTS AND IMPROVE THE PRODUCTIVITY IN OIL PUMP CASTING
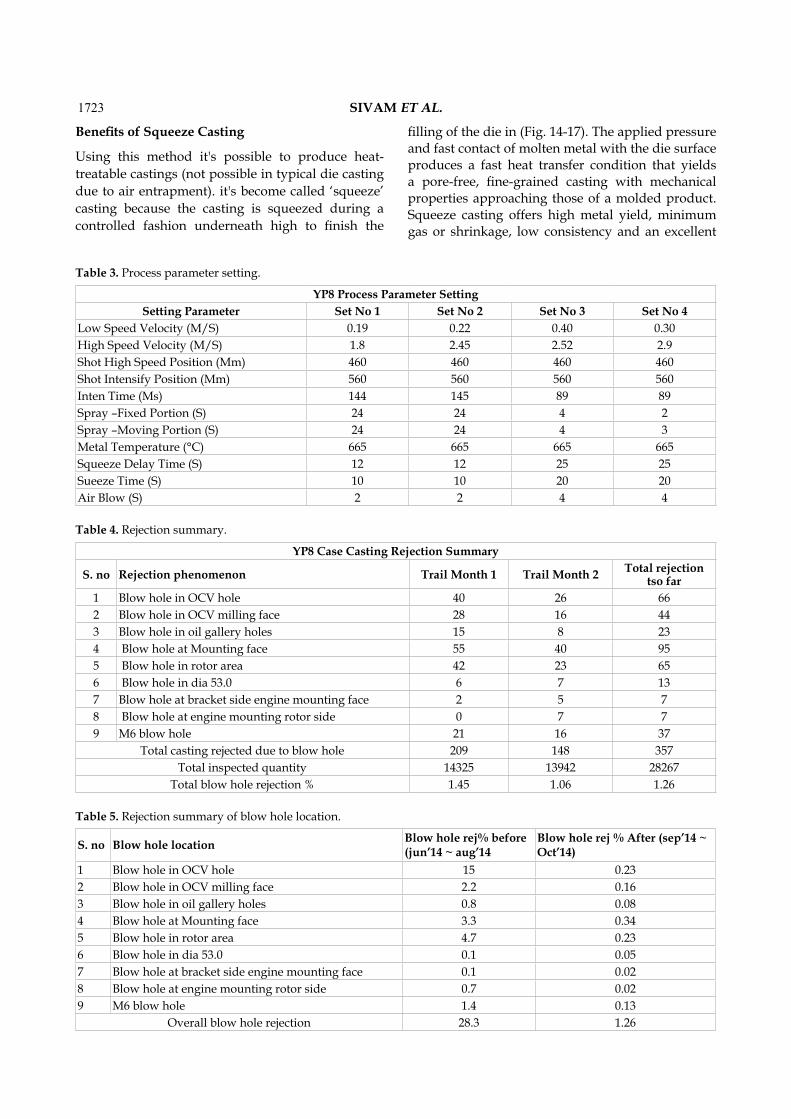
Fig. 14 Samples produced in setting-1.
Fig. 15 Samples produced in setting-2.
Fig. 16 Samples produced in setting-3.
Fig. 17 Samples produced in setting-4.
Fig. 13 OCV hole core pin cooling tube diameter increased from Ø3 mm to Ø6 mm.
1723 SIVAM ET AL.
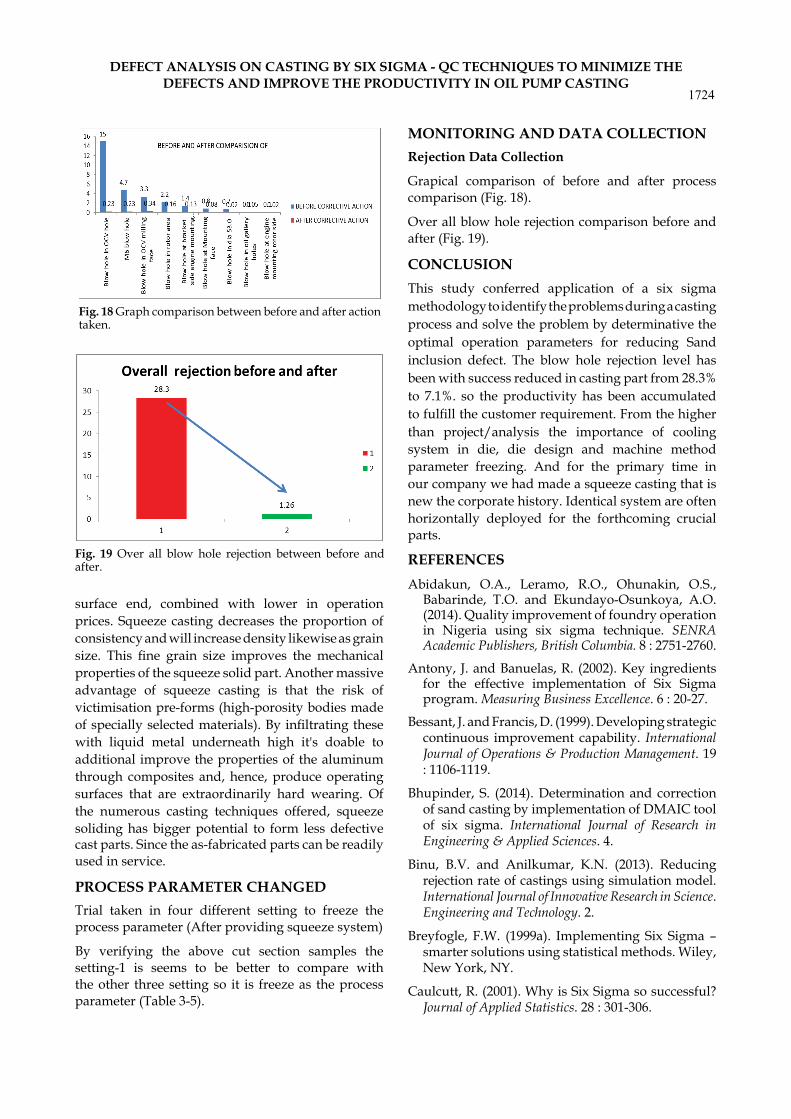
YP8 Process Parameter SettingSetting Parameter Set No 1 Set No 2 Set No 3 Set No 4
Low Speed Velocity (M/S) 0.19 0.22 0.40 0.30High Speed Velocity (M/S) 1.8 2.45 2.52 2.9Shot High Speed Position (Mm) 460 460 460 460Shot Intensify Position (Mm) 560 560 560 560Inten Time (Ms) 144 145 89 89Spray –Fixed Portion (S) 24 24 4 2Spray –Moving Portion (S) 24 24 4 3Metal Temperature (°C) 665 665 665 665Squeeze Delay Time (S) 12 12 25 25Sueeze Time (S) 10 10 20 20Air Blow (S) 2 2 4 4
Table 3. Process parameter setting.
YP8 Case Casting Rejection Summary
S. no Rejection phenomenon Trail Month 1 Trail Month 2 Total rejection tso far
1 Blow hole in OCV hole 40 26 662 Blow hole in OCV milling face 28 16 443 Blow hole in oil gallery holes 15 8 234 Blow hole at Mounting face 55 40 955 Blow hole in rotor area 42 23 656 Blow hole in dia 53.0 6 7 137 Blow hole at bracket side engine mounting face 2 5 78 Blow hole at engine mounting rotor side 0 7 79 M6 blow hole 21 16 37
Total casting rejected due to blow hole 209 148 357Total inspected quantity 14325 13942 28267
Total blow hole rejection % 1.45 1.06 1.26
Table 4. Rejection summary.
S. no Blow hole location Blow hole rej% before (jun’14 ~ aug’14
Blow hole rej % After (sep’14 ~ Oct’14)
1 Blow hole in OCV hole 15 0.232 Blow hole in OCV milling face 2.2 0.163 Blow hole in oil gallery holes 0.8 0.084 Blow hole at Mounting face 3.3 0.345 Blow hole in rotor area 4.7 0.236 Blow hole in dia 53.0 0.1 0.057 Blow hole at bracket side engine mounting face 0.1 0.028 Blow hole at engine mounting rotor side 0.7 0.029 M6 blow hole 1.4 0.13
Overall blow hole rejection 28.3 1.26
Table 5. Rejection summary of blow hole location.
Benefits of Squeeze Casting
Using this method it's possible to produce heat-treatable castings (not possible in typical die casting due to air entrapment). it's become called ‘squeeze’ casting because the casting is squeezed during a controlled fashion underneath high to finish the
filling of the die in (Fig. 14-17). The applied pressure and fast contact of molten metal with the die surface produces a fast heat transfer condition that yields a pore-free, fine-grained casting with mechanical properties approaching those of a molded product. Squeeze casting offers high metal yield, minimum gas or shrinkage, low consistency and an excellent
1724
DEFECT ANALYSIS ON CASTING BY SIX SIGMA - QC TECHNIQUES TO MINIMIZE THE DEFECTS AND IMPROVE THE PRODUCTIVITY IN OIL PUMP CASTING
surface end, combined with lower in operation prices. Squeeze casting decreases the proportion of consistency and will increase density likewise as grain size. This fine grain size improves the mechanical properties of the squeeze solid part. Another massive advantage of squeeze casting is that the risk of victimisation pre-forms (high-porosity bodies made of specially selected materials). By infiltrating these with liquid metal underneath high it's doable to additional improve the properties of the aluminum through composites and, hence, produce operating surfaces that are extraordinarily hard wearing. Of the numerous casting techniques offered, squeeze soliding has bigger potential to form less defective cast parts. Since the as-fabricated parts can be readily used in service.
PROCESS PARAMETER CHANGEDTrial taken in four different setting to freeze the process parameter (After providing squeeze system)
By verifying the above cut section samples the setting-1 is seems to be better to compare with the other three setting so it is freeze as the process parameter (Table 3-5).
MONITORING AND DATA COLLECTIONRejection Data Collection
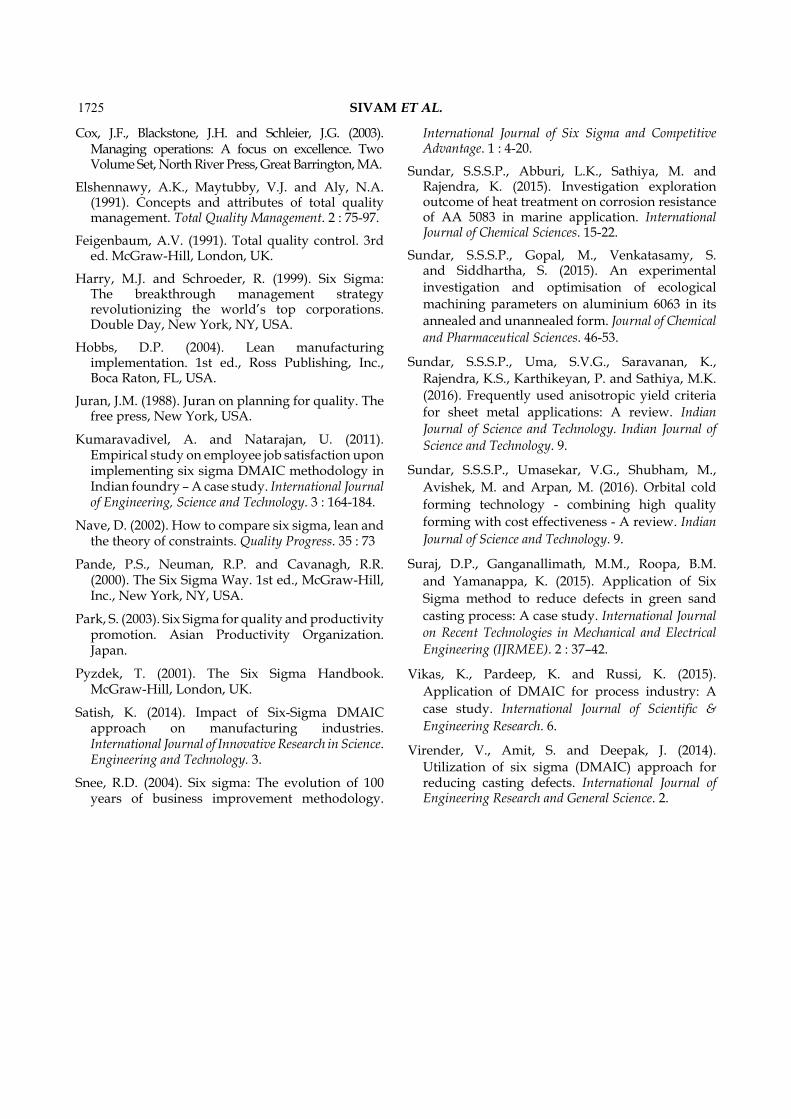
Grapical comparison of before and after process comparison (Fig. 18).
Over all blow hole rejection comparison before and after (Fig. 19).
CONCLUSIONThis study conferred application of a six sigma methodology to identify the problems during a casting process and solve the problem by determinative the optimal operation parameters for reducing Sand inclusion defect. The blow hole rejection level has been with success reduced in casting part from 28.3% to 7.1%. so the productivity has been accumulated to fulfill the customer requirement. From the higher than project/analysis the importance of cooling system in die, die design and machine method parameter freezing. And for the primary time in our company we had made a squeeze casting that is new the corporate history. Identical system are often horizontally deployed for the forthcoming crucial parts.
REFERENCESAbidakun, O.A., Leramo, R.O., Ohunakin, O.S.,
Babarinde, T.O. and Ekundayo-Osunkoya, A.O. (2014). Quality improvement of foundry operation in Nigeria using six sigma technique. SENRA Academic Publishers, British Columbia. 8 : 2751-2760.
Antony, J. and Banuelas, R. (2002). Key ingredients for the effective implementation of Six Sigma program. Measuring Business Excellence. 6 : 20-27.
Bessant, J. and Francis, D. (1999). Developing strategic continuous improvement capability. International Journal of Operations & Production Management. 19 : 1106-1119.
Bhupinder, S. (2014). Determination and correction of sand casting by implementation of DMAIC tool of six sigma. International Journal of Research in Engineering & Applied Sciences. 4.
Binu, B.V. and Anilkumar, K.N. (2013). Reducing rejection rate of castings using simulation model. International Journal of Innovative Research in Science. Engineering and Technology. 2.
Breyfogle, F.W. (1999a). Implementing Six Sigma – smarter solutions using statistical methods. Wiley, New York, NY.
Caulcutt, R. (2001). Why is Six Sigma so successful? Journal of Applied Statistics. 28 : 301-306.
Fig. 18 Graph comparison between before and after action taken.
Fig. 19 Over all blow hole rejection between before and after.
1725 SIVAM ET AL.
Cox, J.F., Blackstone, J.H. and Schleier, J.G. (2003). Managing operations: A focus on excellence. Two Volume Set, North River Press, Great Barrington, MA.
Elshennawy, A.K., Maytubby, V.J. and Aly, N.A. (1991). Concepts and attributes of total quality management. Total Quality Management. 2 : 75-97.
Feigenbaum, A.V. (1991). Total quality control. 3rd ed. McGraw-Hill, London, UK.
Harry, M.J. and Schroeder, R. (1999). Six Sigma: The breakthrough management strategy revolutionizing the world’s top corporations. Double Day, New York, NY, USA.
Hobbs, D.P. (2004). Lean manufacturing implementation. 1st ed., Ross Publishing, Inc., Boca Raton, FL, USA.
Juran, J.M. (1988). Juran on planning for quality. The free press, New York, USA.
Kumaravadivel, A. and Natarajan, U. (2011). Empirical study on employee job satisfaction upon implementing six sigma DMAIC methodology in Indian foundry – A case study. International Journal of Engineering, Science and Technology. 3 : 164-184.
Nave, D. (2002). How to compare six sigma, lean and the theory of constraints. Quality Progress. 35 : 73
Pande, P.S., Neuman, R.P. and Cavanagh, R.R. (2000). The Six Sigma Way. 1st ed., McGraw-Hill, Inc., New York, NY, USA.
Park, S. (2003). Six Sigma for quality and productivity promotion. Asian Productivity Organization. Japan.
Pyzdek, T. (2001). The Six Sigma Handbook. McGraw-Hill, London, UK.
Satish, K. (2014). Impact of Six-Sigma DMAIC approach on manufacturing industries. International Journal of Innovative Research in Science. Engineering and Technology. 3.
Snee, R.D. (2004). Six sigma: The evolution of 100 years of business improvement methodology.
International Journal of Six Sigma and Competitive Advantage. 1 : 4-20.
Sundar, S.S.S.P., Abburi, L.K., Sathiya, M. and Rajendra, K. (2015). Investigation exploration outcome of heat treatment on corrosion resistance of AA 5083 in marine application. International Journal of Chemical Sciences. 15-22.
Sundar, S.S.S.P., Gopal, M., Venkatasamy, S. and Siddhartha, S. (2015). An experimental investigation and optimisation of ecological machining parameters on aluminium 6063 in its annealed and unannealed form. Journal of Chemical and Pharmaceutical Sciences. 46-53.
Sundar, S.S.S.P., Uma, S.V.G., Saravanan, K., Rajendra, K.S., Karthikeyan, P. and Sathiya, M.K. (2016). Frequently used anisotropic yield criteria for sheet metal applications: A review. Indian Journal of Science and Technology. Indian Journal of Science and Technology. 9.
Sundar, S.S.S.P., Umasekar, V.G., Shubham, M., Avishek, M. and Arpan, M. (2016). Orbital cold forming technology - combining high quality forming with cost effectiveness - A review. Indian Journal of Science and Technology. 9.
Suraj, D.P., Ganganallimath, M.M., Roopa, B.M. and Yamanappa, K. (2015). Application of Six Sigma method to reduce defects in green sand casting process: A case study. International Journal on Recent Technologies in Mechanical and Electrical Engineering (IJRMEE). 2 : 37–42.
Vikas, K., Pardeep, K. and Russi, K. (2015). Application of DMAIC for process industry: A case study. International Journal of Scientific & Engineering Research. 6.
Virender, V., Amit, S. and Deepak, J. (2014). Utilization of six sigma (DMAIC) approach for reducing casting defects. International Journal of Engineering Research and General Science. 2.