Embed Size (px)
Citation preview

1520-9210 (c) 2019 IEEE. Personal use is permitted, but republication/redistribution requires IEEE permission. See http://www.ieee.org/publications_standards/publications/rights/index.html for more information.
This article has been accepted for publication in a future issue of this journal, but has not been fully edited. Content may change prior to final publication. Citation information: DOI 10.1109/TMM.2020.2972125, IEEETransactions on Multimedia
> REPLACE THIS LINE WITH YOUR PAPER IDENTIFICATION NUMBER (DOUBLE-CLICK HERE TO EDIT) <
1
Abstract—Person re-identification (Re-ID) is a challenging task
in the field of computer vision and focuses on matching people
across images from different cameras. The extraction of robust
feature representations from pedestrian images through CNNs
with a single deterministic pooling operation is problematic as the
features in real pedestrian images are complex and diverse. To
address this problem, we propose a novel center-triplet (CT)
model that combines the learning of robust feature representation
and the optimization of metric loss function. Firstly, we design a
fusion feature learning network (FFLN) with a novel fusion
strategy consisting of max pooling and average pooling. Instead of
adopting a single deterministic pooling operation, the FFLN
combines two pooling operations that can learn high response
values, bright features, and low response values, discriminative
features simultaneously. Our model obtains more discriminative
fusion features by adaptively learning the weights of the features
learned by the corresponding pooling operations. In addition, we
design a hard mining center-triplet loss (HCTL), a novel
improved triplet loss, which effectively optimizes the
intra/inter-class distance and reduces the cost of computing and
mining hard training samples simultaneously, thereby enhancing
the learning of robust feature representation. Finally, we proved
our method can learn robust and discriminative feature
representations for complex pedestrian images in real scenes. The
experimental results also illustrate that our method achieves an
81.8% mAP and a 93.8% rank-1 accuracy on Market1501, a 68.2%
mAP and an 83.3% rank-1 accuracy on DukeMTMC-ReID, and a
43.6% mAP and a 74.3% rank-1 accuracy on MSMT17,
outperforming most state-of-the-art methods and achieving better
performance for person re-identification.
Index Terms—Person re-identification, center-triplet model,
fusion feature representation, hard mining center-triplet loss.
This work was supported by the National Natural Science Foundation of
China (NSFC) under Grant Nos. 61673299, 61203247, 61573259, and
61573255. This work was also supported by the Fundamental Research Funds for the Central Universities and the Open Project Program of the National
Laboratory of Pattern Recognition (NLPR).
* The authors contribute equally to this work. Corresponding author. Cairong Zhao, Xinbi Lv, Jun Wu and Duoqian Miao are with the
Department of Computer Science and Technology, Tongji University,
Shanghai, China, E-mail: [email protected] . Zhang Zhang is with the CRIPAC and NLPR, Institute of Automation,
Chinese Academy of Sciences, Beijing 100190, China, and also with UCAS,
Beijing 100049, China. E-mail: zzhang @nlpr.ia.ac.cn.
Wangmeng Zuo is with the School of Computer Science and Technology,
Harbin Institute of Technology, Harbin, China. E-mail: cswmzuo @gmail.com.
I. INTRODUCTION
ERSON Re-Identification (Re-ID) aims to match two
pedestrian images from non-overlapping camera views.
Due to the large visual variations in illumination, posture,
viewpoint, misalignment, and background occlusions, person
re-identification is a difficult task; some challenging examples
are shown in Fig. 1.
With the development of deep convolution neural networks
(CNNs), an increasing number of works on Re-ID are seeking
to design and train an end-to-end model directly to learn robust
feature representation from pedestrian images. There are two
key areas that comprise CNN-based work, the design of
convolution neural networks and the design of the metric loss
function.
In the process of designing a CNN, most previous methods
use self-designed CNN architectures to learn feature
representation, such as the filter pairing neural network (FPNN)
[1], the fusion feature net (FFN) [2], PersonNet [3], Spindle Net
[4], the multi-scale context-aware network (MS-CAN) [5], the
pedestrian alignment network (PAN) [6], etc. It is generally
accepted that deeper networks can enrich the granularity of
features and bring significant performance improvements. Thus,
an increasing number of methods apply the classic pretrained
model (VGGNet [7], GoogLeNet [8], ResNet [9]) to learn more
discriminative deep features considering their deeper network
structures and competitive performance, such as TriNet [10],
AlignedReID [11], attribute-person recognition network (APN)
[12], pose-sensitive embedding (PSE) [13], the harmonious
attention network (HA-CNN) [14], and the
Deep Fusion Feature Representation Learning
with Hard Mining Center-Triplet Loss for Person
Re-Identification
Cairong Zhao, Xinbi Lv*, Zhang Zhang, Wangmeng Zuo, Jun Wu, Duoqian Miao
P
(a) (b) (c) (d) (e)
Fig. 1. Some image pairs from the Market1501 [36] dataset. The upper and
lower adjacent images have the same identity: (a) variations in illumination,
(b) variations in posture, (c) variations in viewpoint, (d) variations in
misalignment, (e) variations in background occlusion.
Authorized licensed use limited to: TONGJI UNIVERSITY. Downloaded on February 21,2020 at 03:54:28 UTC from IEEE Xplore. Restrictions apply.
1520-9210 (c) 2019 IEEE. Personal use is permitted, but republication/redistribution requires IEEE permission. See http://www.ieee.org/publications_standards/publications/rights/index.html for more information.
This article has been accepted for publication in a future issue of this journal, but has not been fully edited. Content may change prior to final publication. Citation information: DOI 10.1109/TMM.2020.2972125, IEEETransactions on Multimedia
> REPLACE THIS LINE WITH YOUR PAPER IDENTIFICATION NUMBER (DOUBLE-CLICK HERE TO EDIT) <
2
global-local-alignment descriptor (GLAD) [15]. The pretrained
models extract deep features of images with deeper convolution
layers. To avoid generating deep features with a higher
dimensionality, the pooling layer is usually needed to reduce
the resolution of the features and transform the deep feature
representation into a more usable one that preserves
discriminative information while discarding redundant details
[16], [17], so as to overcome variations in illumination, posture,
viewpoint, misalignment, and background occlusion. Average
pooling and max pooling are two popular methods adopted for
computational efficiency. For example, the original ResNet50
adopts a global average pooling to transform a deeper feature
representation into a simple 2048-d feature vector. However, it
has some limitations in extracting a more robust feature
representation. As Yu et al. argued in [17], both the average
pooling and max pooling operators have their own drawbacks.
Sometimes, they will produce unacceptable results. For
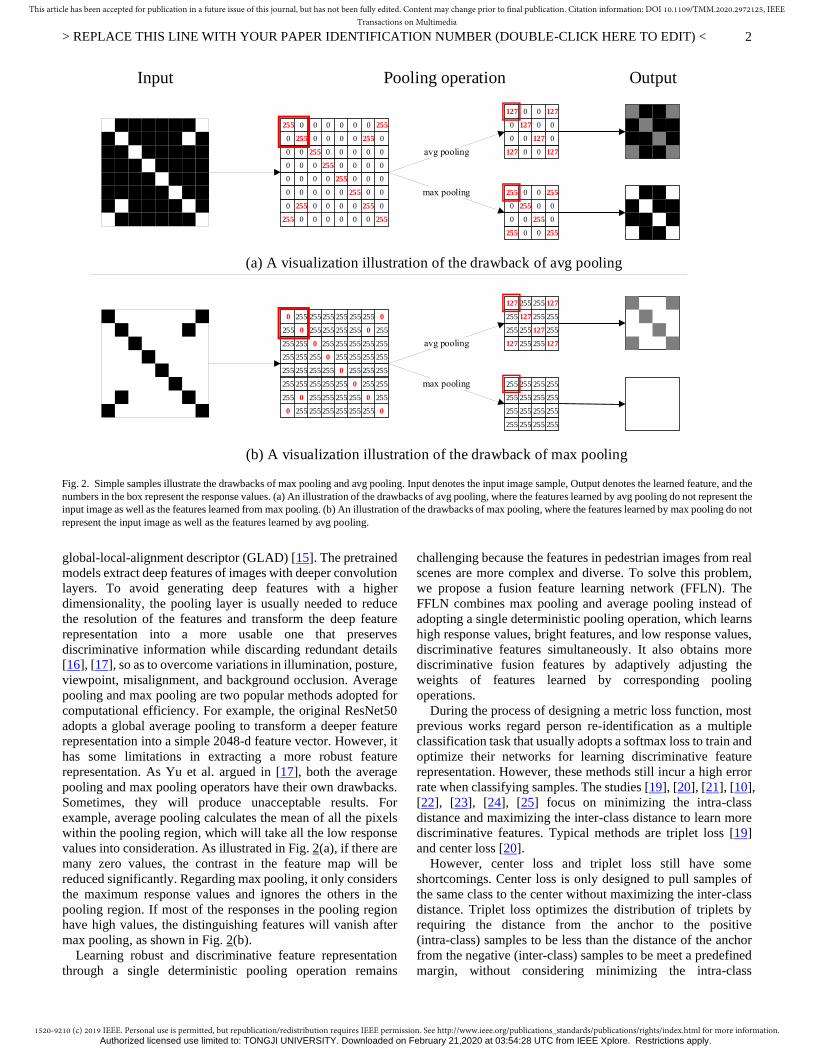
example, average pooling calculates the mean of all the pixels
within the pooling region, which will take all the low response
values into consideration. As illustrated in Fig. 2(a), if there are
many zero values, the contrast in the feature map will be
reduced significantly. Regarding max pooling, it only considers
the maximum response values and ignores the others in the
pooling region. If most of the responses in the pooling region
have high values, the distinguishing features will vanish after
max pooling, as shown in Fig. 2(b).
Learning robust and discriminative feature representation
through a single deterministic pooling operation remains
challenging because the features in pedestrian images from real
scenes are more complex and diverse. To solve this problem,
we propose a fusion feature learning network (FFLN). The
FFLN combines max pooling and average pooling instead of
adopting a single deterministic pooling operation, which learns
high response values, bright features, and low response values,
discriminative features simultaneously. It also obtains more
discriminative fusion features by adaptively adjusting the
weights of features learned by corresponding pooling
operations.
During the process of designing a metric loss function, most
previous works regard person re-identification as a multiple
classification task that usually adopts a softmax loss to train and
optimize their networks for learning discriminative feature
representation. However, these methods still incur a high error
rate when classifying samples. The studies [19], [20], [21], [10],
[22], [23], [24], [25] focus on minimizing the intra-class
distance and maximizing the inter-class distance to learn more
discriminative features. Typical methods are triplet loss [19]
and center loss [20].
However, center loss and triplet loss still have some
shortcomings. Center loss is only designed to pull samples of
the same class to the center without maximizing the inter-class
distance. Triplet loss optimizes the distribution of triplets by
requiring the distance from the anchor to the positive
(intra-class) samples to be less than the distance of the anchor
from the negative (inter-class) samples to be meet a predefined
margin, without considering minimizing the intra-class
(b) A visualization illustration of the drawback of max pooling
(a) A visualization illustration of the drawback of avg pooling
0 0 0 0 0 0 255255
0 255 0 0 0 0 00
0 0 255 0 0 0 00
0 0 0 255 0 0 00
0 0 0 0 255 0 00
255 0 0 0 0 2550 0
255 0 0 0 0 255 00
0 0 0 0 0 0 255255
255 255 255 255 255 00
255 0 255 255 255 255 255255
255 255 0 255 255 255 255255
255 255 255 0 255 255 255255
255 255 255 255 0 255 255255
0 255 255 255 255 0255 255
0 255 255 255 255 0 255255
255 255 255 255 255 255 00
255
0255 2550
2550 00
00 0255
0255 2550
0127 1270
1270 00
00 0127
0127 1270
255127 127255
127255 255255
255255 255127
255127 127255
255255 255255
255255 255255
255255 255255
255255 255255
Input OutputPooling operation
Fig. 2. Simple samples illustrate the drawbacks of max pooling and avg pooling. Input denotes the input image sample, Output denotes the learned feature, and the
numbers in the box represent the response values. (a) An illustration of the drawbacks of avg pooling, where the features learned by avg pooling do not represent the
input image as well as the features learned from max pooling. (b) An illustration of the drawbacks of max pooling, where the features learned by max pooling do not
represent the input image as well as the features learned by avg pooling.
Authorized licensed use limited to: TONGJI UNIVERSITY. Downloaded on February 21,2020 at 03:54:28 UTC from IEEE Xplore. Restrictions apply.
1520-9210 (c) 2019 IEEE. Personal use is permitted, but republication/redistribution requires IEEE permission. See http://www.ieee.org/publications_standards/publications/rights/index.html for more information.
This article has been accepted for publication in a future issue of this journal, but has not been fully edited. Content may change prior to final publication. Citation information: DOI 10.1109/TMM.2020.2972125, IEEETransactions on Multimedia
> REPLACE THIS LINE WITH YOUR PAPER IDENTIFICATION NUMBER (DOUBLE-CLICK HERE TO EDIT) <
3
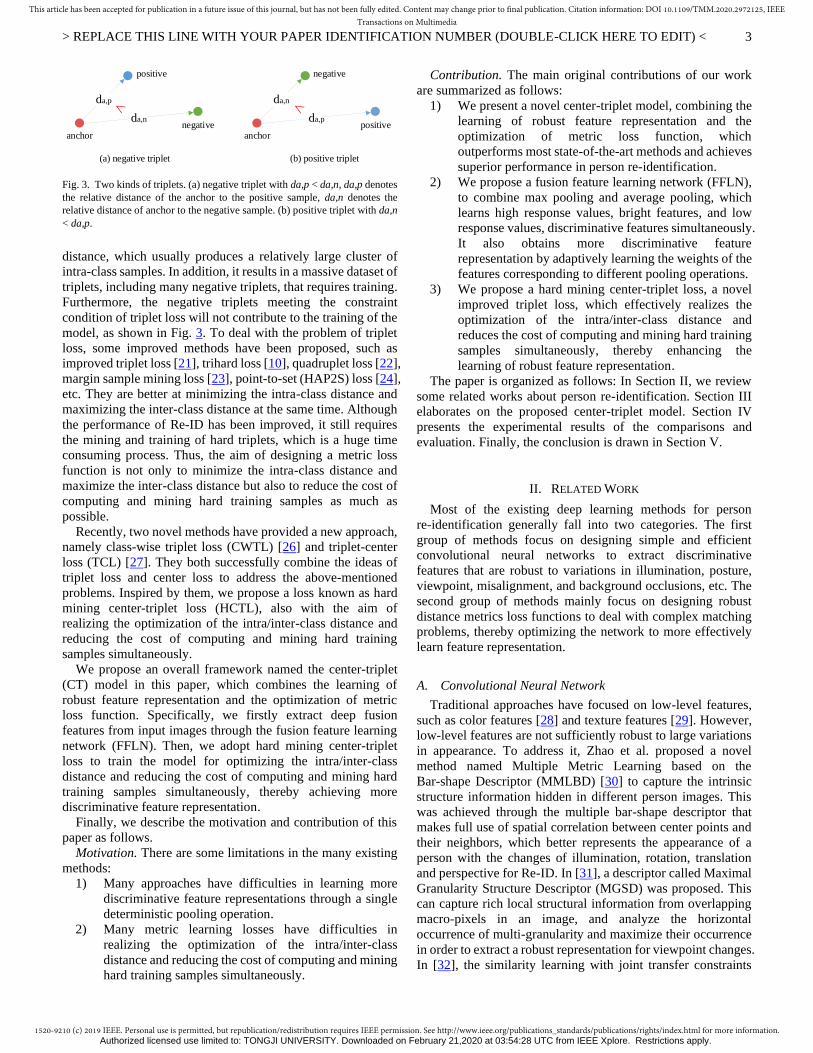
distance, which usually produces a relatively large cluster of
intra-class samples. In addition, it results in a massive dataset of
triplets, including many negative triplets, that requires training.
Furthermore, the negative triplets meeting the constraint
condition of triplet loss will not contribute to the training of the
model, as shown in Fig. 3. To deal with the problem of triplet
loss, some improved methods have been proposed, such as
improved triplet loss [21], trihard loss [10], quadruplet loss [22],
margin sample mining loss [23], point-to-set (HAP2S) loss [24],
etc. They are better at minimizing the intra-class distance and
maximizing the inter-class distance at the same time. Although
the performance of Re-ID has been improved, it still requires
the mining and training of hard triplets, which is a huge time
consuming process. Thus, the aim of designing a metric loss
function is not only to minimize the intra-class distance and
maximize the inter-class distance but also to reduce the cost of
computing and mining hard training samples as much as
possible.
Recently, two novel methods have provided a new approach,
namely class-wise triplet loss (CWTL) [26] and triplet-center
loss (TCL) [27]. They both successfully combine the ideas of
triplet loss and center loss to address the above-mentioned
problems. Inspired by them, we propose a loss known as hard
mining center-triplet loss (HCTL), also with the aim of
realizing the optimization of the intra/inter-class distance and
reducing the cost of computing and mining hard training
samples simultaneously.
We propose an overall framework named the center-triplet
(CT) model in this paper, which combines the learning of
robust feature representation and the optimization of metric
loss function. Specifically, we firstly extract deep fusion
features from input images through the fusion feature learning
network (FFLN). Then, we adopt hard mining center-triplet
loss to train the model for optimizing the intra/inter-class
distance and reducing the cost of computing and mining hard
training samples simultaneously, thereby achieving more
discriminative feature representation.
Finally, we describe the motivation and contribution of this
paper as follows.
Motivation. There are some limitations in the many existing
methods:
1) Many approaches have difficulties in learning more
discriminative feature representations through a single
deterministic pooling operation.
2) Many metric learning losses have difficulties in
realizing the optimization of the intra/inter-class
distance and reducing the cost of computing and mining
hard training samples simultaneously.
Contribution. The main original contributions of our work
are summarized as follows:
1) We present a novel center-triplet model, combining the
learning of robust feature representation and the
optimization of metric loss function, which
outperforms most state-of-the-art methods and achieves
superior performance in person re-identification.
2) We propose a fusion feature learning network (FFLN),
to combine max pooling and average pooling, which
learns high response values, bright features, and low
response values, discriminative features simultaneously.
It also obtains more discriminative feature
representation by adaptively learning the weights of the
features corresponding to different pooling operations.
3) We propose a hard mining center-triplet loss, a novel
improved triplet loss, which effectively realizes the
optimization of the intra/inter-class distance and
reduces the cost of computing and mining hard training
samples simultaneously, thereby enhancing the
learning of robust feature representation.
The paper is organized as follows: In Section II, we review
some related works about person re-identification. Section III
elaborates on the proposed center-triplet model. Section IV
presents the experimental results of the comparisons and
evaluation. Finally, the conclusion is drawn in Section V.
II. RELATED WORK
Most of the existing deep learning methods for person
re-identification generally fall into two categories. The first
group of methods focus on designing simple and efficient
convolutional neural networks to extract discriminative
features that are robust to variations in illumination, posture,
viewpoint, misalignment, and background occlusions, etc. The
second group of methods mainly focus on designing robust
distance metrics loss functions to deal with complex matching
problems, thereby optimizing the network to more effectively
learn feature representation.
A. Convolutional Neural Network
Traditional approaches have focused on low-level features,
such as color features [28] and texture features [29]. However,
low-level features are not sufficiently robust to large variations
in appearance. To address it, Zhao et al. proposed a novel
method named Multiple Metric Learning based on the
Bar-shape Descriptor (MMLBD) [30] to capture the intrinsic
structure information hidden in different person images. This
was achieved through the multiple bar-shape descriptor that
makes full use of spatial correlation between center points and
their neighbors, which better represents the appearance of a
person with the changes of illumination, rotation, translation
and perspective for Re-ID. In [31], a descriptor called Maximal
Granularity Structure Descriptor (MGSD) was proposed. This
can capture rich local structural information from overlapping
macro-pixels in an image, and analyze the horizontal
occurrence of multi-granularity and maximize their occurrence
in order to extract a robust representation for viewpoint changes.
In [32], the similarity learning with joint transfer constraints
anchor
da,p
da,n
positive
negative
(a) negative triplet
anchor
da,n
da,p
negative
positive
(b) positive triplet
Fig. 3. Two kinds of triplets. (a) negative triplet with da,p < da,n, da,p denotes
the relative distance of the anchor to the positive sample, da,n denotes the
relative distance of anchor to the negative sample. (b) positive triplet with da,n
< da,p.
Authorized licensed use limited to: TONGJI UNIVERSITY. Downloaded on February 21,2020 at 03:54:28 UTC from IEEE Xplore. Restrictions apply.

1520-9210 (c) 2019 IEEE. Personal use is permitted, but republication/redistribution requires IEEE permission. See http://www.ieee.org/publications_standards/publications/rights/index.html for more information.
This article has been accepted for publication in a future issue of this journal, but has not been fully edited. Content may change prior to final publication. Citation information: DOI 10.1109/TMM.2020.2972125, IEEETransactions on Multimedia
> REPLACE THIS LINE WITH YOUR PAPER IDENTIFICATION NUMBER (DOUBLE-CLICK HERE TO EDIT) <
4
model was proposed to alleviate the inconsistency of data
distributions in terms of viewpoint changes and illumination
variations. With the development of deep learning, researchers
began to explore how to make a model to learn robust deep
features automatically instead of the traditional hand-designed
features. For example, in [1], Li et al. first proposed a deep filter
pairing neural network (FPNN) that jointly optimizes feature
learning, photometric transforms, geometric transforms,
misalignment, occlusions, and classification within a unified
deep architecture. It was the first work to employ deep learning
to person re-identification problems. In [2], the feature fusion
net (FFN) was proposed to learn robust fusion features by
jointly utilizing CNN features and hand-crafted features. In
[54], the multilevel triplet deep learning model (MT-net) was
proposed to combine fine, shallow layer information with
coarse, deeper layer information to learn a better feature
representation. Zhao et al. proposed SpindleNet [4], which
firstly extracted features from several body regions and then
merged them to learn more discriminative fusion features. In
[15], Wei et al. proposed the GLAD framework, which
explicitly leverages the local and global cues in the human body
to generate a discriminative and robust representation. There
are also some methods [5], [11] learning powerful features by
jointing global features with local body-part features.
However, it remains very challenging to learn robust features
which are discriminative, reliable, and invariant to the large
variations in illumination, posture, viewpoint, misalignment,
and background occlusion, etc. In order to solve this problem,
we propose a fusion feature learning network (FFLN) for
learning discriminative feature representation.
B. Metric loss function
Traditional deep metric learning methods regard person
re-identification as a multiple classification task and adopt
softmax loss to train and optimize their networks. However,
these methods usually produce large clusters in intra-class and
heavy overlaps in inter-class, thereby having a high error rate.
As illustrated in Fig. 4(a), 1, 2, and 3 represent the overlapping
areas of different classes.
To better address complex matching problems in image pairs,
many improved deep metric learning models have been
proposed. Wen et al. [20] firstly presented the center loss, by
learning a center for the same class samples to pull them to their
centers, which has been successfully used for face recognition.
In [18], Ding et al. proposed a feature affinity-based pseudo
labeling (FAPL) approach, which also adopted softmax loss
joint with center loss to train the network to ensure
discriminative feature representation learning. Specifically, the
center loss can be formulated as:
𝐿𝑐 =1
2∑ ‖𝑓𝑖 − 𝑐𝑦𝑖‖
2
2𝑃×𝐾𝑖=1 , (1)
where P denotes the number of classes in a mini-batch, K
denotes the number of samples in each class, the 𝑐𝑦𝑖 denotes
the deep features of 𝑦𝑖th class center, which is computed by
averaging the features of the corresponding classes of the
mini-batch, and 𝑓𝑖 denotes the deep features of ith sample.
Since the centers are used within each mini-batch instead of
the whole training set, their updates are very unstable. It must
be completed under the joint supervision of softmax loss during
the training process, which provides good guidance in seeking
better class centers. However, center loss does not consider
how to enlarge the inter-class distance, and it still contains a
few overlaps in the inter-class, as shown in Fig. 4(b).
The successful application of facenet in face recognition has
led researchers to focus on how to efficiently select triplets to
train the end-to-end network for Re-ID. Ding et al. [19] made
the first attempt to use a triplet framework to extract the
features of samples and then calculate triplet loss to optimize
the network learning process. Triplet loss aims at ensuring the
intra-class distance is less than the inter-class distance by a
predefined margin m, which can be computed as:
𝐿𝑡𝑟𝑖 = ∑ 𝑚𝑎𝑥(𝑑𝑎,𝑝 − 𝑑𝑎,𝑛 + 𝑚, 0)𝑎,𝑝,𝑛𝑦𝑎=𝑦𝑝≠𝑦𝑛
, (2)
where a, p, n denote the anchor, positive sample, and negative
sample in each triplet, respectively, 𝑑𝑎,𝑝 denotes the relative
distance of the positive sample to the anchor, 𝑑𝑎,𝑛 denotes the
relative distance of the negative sample to the anchor, and m is
the margin that is enforced between positive and negative pairs.
The classic triplet loss has two problems. One is the
clustering effect of the model is not significant because the loss
does not consider how to minimize the intra-class distance.
Another is that a sharply increasing number of triplets including
many negative triplets with the explosive increasing of dataset,
and the use of a large and unbalanced number of negative
triplets could also produce poor results. Some improved
methods are proposed based on triplet loss to solve the above
problems.
To deal with the problems of triplet loss, some improved
methods have been proposed. Cheng et al. [21] optimized the
training process of the triplet framework by adopting an
improved triplet loss function, which requires reducing the
distance between pairs from the same class to less than a margin
α (α is much less than m). Hermans et al. [10] proposed the
trihard loss (triplet loss with hard sample mining), which aims
at selecting the hardest triplets for training. Yu et al. [24]
proposed the hard-aware point-to-set (HAP2S) loss with an
adaptive hard mining scheme, which aims at assigning higher
weights to the hard samples to compute triplet loss. But the cost
Samples of Class1Samples of Class2Samples of Class3
Center of Class1Center of Class2Center of Class3
Pull
Push
The boundary of class
(a) (b) (c)
1
2
3
(d) (e)
Fig. 4. An illustration of the distributions of deeply-learned features by (a)
softmax loss, (b) softmax loss + center loss, (c) softmax loss + class-wise triplet loss, and (e) softmax loss + triplet-center loss. (d) describes the idea of the
triplet-center loss with hard sample mining. Randomly selected identities from
the testing set of Market1501[36]. The points with different colors denote
features from different identities. The pentagrams denote the centers of classes.
Authorized licensed use limited to: TONGJI UNIVERSITY. Downloaded on February 21,2020 at 03:54:28 UTC from IEEE Xplore. Restrictions apply.

1520-9210 (c) 2019 IEEE. Personal use is permitted, but republication/redistribution requires IEEE permission. See http://www.ieee.org/publications_standards/publications/rights/index.html for more information.
This article has been accepted for publication in a future issue of this journal, but has not been fully edited. Content may change prior to final publication. Citation information: DOI 10.1109/TMM.2020.2972125, IEEETransactions on Multimedia
> REPLACE THIS LINE WITH YOUR PAPER IDENTIFICATION NUMBER (DOUBLE-CLICK HERE TO EDIT) <
5
of computing and mining the hard triplets is enormous. In
addition, Ali et al. [25] proposed a nullspace kernel maximum
margin metric learning (NK3ML) framework, which efficiently
minimizes the intra-class distance and maximizes the
inter-class distance. We do not discuss it here because it
addressed the small sample size (SSS) problem.
In summary, it is not optimal to only consider the
optimization of the intra/inter-class distance. Optimization to
reduce the cost of computing and mining hard samples is also
important when training the model. Recently, two novel studies
have attracted attention.
Ming et al. [26] proposed the class-wise triplet loss (CWTL)
for face recognition. Different from classic triplet loss, it aims
to decrease the distance between the anchors and the intra-class
centers and enlarge the distance of the anchors from the
inter-class centers by learning the centers of the classes of
samples and using them instead of individual samples as the
positives and negatives to form the triplets, which can
significantly reduce the number of triplets involved in training
the model, thereby reducing the cost of calculation loss. The
CWTL can be formulated as follows:
𝐿𝑐𝑤𝑡 = ∑ ∑ 𝑚𝑎𝑥(𝐷(𝑓𝑖 , 𝑐𝑦𝑖) − 𝐷(𝑓𝑖 , 𝑐𝑙) + 𝑚, 0)𝑃𝑙=1,𝑙≠𝑦𝑖
𝑃×𝐾𝑖=1 ,
(3)
where 𝐷(𝑓𝑖 , 𝑐𝑦𝑖) represents the squared Euclidean distance
function denoted as follows:
𝐷(𝑓𝑖 , 𝑐𝑦𝑖) = ‖𝑓𝑖 − 𝑐𝑦𝑖‖2
2 , (4)
As illustrated in Fig. 4(c), the CWTL effectively solves the
problems of large clusters within the intra-class and overlaps
within the inter-class.
Another is the work by He et al. [27], which proposed a novel
loss function named triplet-center loss (TCL) for Multi-View
3D Object Retrieval. They argued that center loss still results in
small overlaps within the inter-class samples because it only
aims at minimizing the intra-class distance, as illustrated in Fig.
4(b). Specifically, the proposed TCL can ensure the distance
between the samples and their corresponding center 𝑐𝑦𝑖 is less
than the distance between the samples and their nearest
negative center 𝑐𝑙 by a margin m. The TCL could be computed
as follows:
𝐿𝑡𝑐 = ∑ max (𝐷(𝑓𝑖,𝑐𝑦𝑖) − min𝑙≠𝑦𝑖
𝐷(𝑓𝑖 , 𝑐𝑙) + 𝑚, 0)𝑃×𝐾𝑖=1 , (5)
An illustration of the distributions of samples learned by
TCL can be seen in Fig. 4(d)-(e).
Inspired by CWTL and TCL, we design a hard mining
center-triplet loss, a novel improved strategy of triplet loss that
mines novel hard triplets for training. Finally, our loss
effectively optimizes the intra/inter-class distance and reduces
the cost of computing and mining hard training samples
simultaneously.
In general, we put forward a novel center-triplet (CT) model
for person re-identification, which combines the learning of
robust feature representation and the optimization of metric
loss function. In the next section, we will present our method in
detail.
III. PROPOSED CENTER-TRIPLET MODEL
Our center-triplet model is designed based on the classic
triplet framework. The overall framework of our model is
shown in Fig. 5. It is composed of two parts, the learning of
fusion feature representation and the optimization of metric
loss function. We first describe the overall framework of our
method in Section III-A. Then, we elaborate on the design of
the fusion feature learning network (FFLN) in Section III-B and
the design of our metric loss function in Section III-C. In
Section III-D, we compare the proposed model with similar
methods for Re-ID. Finally, the processes of training and
optimizing our model are introduced in Section III-E.
A. The overall framework
As illustrated in Fig. 5, our model uses mini-batch images to
P×K
imagesFFLN
...
...
...
P×K×[1,2048]
Center
feature
K
K
K
...
...
...
hard sample
mining
...
fusion
feature
Avg
Avg
Avg
a(Cen)p n
pull push
pull push
pull push
...
a(Cen)
p
P
1
2
n
a(Cen)
n
p
a(Cen)
p
n
Fig. 5. The overall framework of the proposed Center-Triplet model, where P denotes the number of classes in a mini-batch, K denotes the number of samples in
each class, a(cen) denotes the center feature of each class samples, p denotes the hardest positive sample that is farthest to the a(cen) with the same class label, and
n denotes the hardest negative sample that is closest to the a(cen) with the different class label, Avg denotes getting the center feature by the averaging operation.
Specifically, P×K images are fed to the FFLN to get the 2048-d deep fusion features. Then, the HCTL will learn the center features of classes of these fusion features
and mine the hardest triplets to train and optimize the model for learning discriminative features, which could pull the intra-class samples closer and push the
inter-class samples further away.
Authorized licensed use limited to: TONGJI UNIVERSITY. Downloaded on February 21,2020 at 03:54:28 UTC from IEEE Xplore. Restrictions apply.

1520-9210 (c) 2019 IEEE. Personal use is permitted, but republication/redistribution requires IEEE permission. See http://www.ieee.org/publications_standards/publications/rights/index.html for more information.
This article has been accepted for publication in a future issue of this journal, but has not been fully edited. Content may change prior to final publication. Citation information: DOI 10.1109/TMM.2020.2972125, IEEETransactions on Multimedia
> REPLACE THIS LINE WITH YOUR PAPER IDENTIFICATION NUMBER (DOUBLE-CLICK HERE TO EDIT) <
6
train the network. In each mini-batch, images are resized into
256 × 128 pixels as inputs, and the 2048-d deep fusion features
are extracted through the FFLN. Then, the model will learn the
centers of classes of these fusion features and mine novel hard
triplets to calculate loss by the proposed hard mining
center-triplet loss (HCTL). The HCTL is better at minimizing
intra-class distance and maximizing inter-class distance,
thereby optimizing the network to learn more robust feature
representation. Finally, the model provides a significant
performance improvement for Re-ID.
B. The fusion feature learning network (FFLN)
The proposed fusion feature learning network is modified
based on the original ResNet50. As shown in Fig. 6, the FFLN
mainly consists of the following distinct layers: convolution
layer, mixed pooling layer, and fusion layer. Next, we introduce
each of these layers in detail.
Convolution layer. We employ the convolution layers of
ResNet50 as basic convolution layers. However, considering
that higher spatial resolution may enrich the granularity of
features and result in significant performance improvements,
we try to set the last stride (last spatial down-sample operation)
in the Conv5 layer from 2 (the last stride of the original
ResNet50) to 1 to obtain a larger feature map (16 x 8) than the
original size (8 x 4).
Mixed pooling layer. Convolution layers followed by the
mixed pooling layer consist of two parts, the max pooling layer
and the average pooling layer. We deal with the output of the
Conv5 layer with max pooling and average pooling at the same
time instead of using a single deterministic pooling operation.
Then, these two sub-part features are linked together to form a
high dimensional feature vector of 4096-d for learning deep
fusion features in the following fusion layer.
Fusion layer. In the fusion layer, we mainly append a
fully-connected layer followed by Batch Normalization (BN)
and a Rectified Linear Unit (ReLU). The fully-connected layer
obtains more discriminative fusion features by adaptively
learning the weights of features, which are learned by pooling
operations. In addition, we apply dropout [33] on the
fully-connected layer to effectively avoid overfitting and gain
considerable performance improvements. Finally, the network
will output a 2048-d fusion feature for training.
Instead of selecting a single deterministic pooling operation,
the FFLN combines max pooling and average pooling. It,
therefore, learns appropriate weight parameters for the
corresponding pooled features through the fusion layer
(fully-connected layer), which can learn high response values,
bright features, and low response values, discriminative
features simultaneously. It also obtains more robust features to
ultimately represent complex pedestrian images in real scenes.
In Section IV-D, we elaborate on the advantages of FFLN in
feature representation.
C. Hard Mining Center-Triplet Loss Function (HCTL)
Inspired by CWTL and TCL, we propose a metric loss
function named hard mining center-triplet loss (HCTL), a novel
improved strategy of triplet loss. As shown in Fig. 7, it aims to
learn the centers of the classes of samples and use them instead
of individual samples as the anchors to form the hard triplets.
Specifically, we firstly regard the centers of all classes in the
mini-batch as the anchors. For each center, we select the
hardest positive sample which has the farthest distance to it
with the same class label and the hardest negative sample which
has the closest distance to it with a different class label. Then,
we use them to form the hard triplet for computing the triplet
loss. The HCTL will control the distance between the center 𝑐𝑝
and its farthest positive sample less than the distance between
the center 𝑐𝑝 and its nearest negative sample by a predefined
margin m.
In summary, the hard mining center-triplet loss is defined as
follows:
𝐿ℎ𝑐𝑡 = 1
𝑃∑ 𝑚𝑎𝑥 (𝑚𝑎𝑥
1≤𝑖≤𝐾(𝐷(𝑐𝑝 , 𝑓(𝑝𝑖))) −𝑃
𝑝=1
𝑚𝑖𝑛𝑙≠𝑝,1≤𝑙≤𝑃,
1≤𝑗≤𝐾
(𝐷(𝑐𝑝 , 𝑓(𝑙𝑗))) + 𝑚, 0) , (6)
where 𝑐𝑝 denotes the deep features of pth class center and
𝑓(𝑝𝑖) denotes the deep features of the ith sample in pth class.
As the update of centers of the classes could be unstable in a
mini-batch with the HCTL, we combine it with softmax loss for
training. To improve the guidance provided by softmax in
seeking better class centers, we use label-smoothing
regularization (LSR) [34] to optimize the calculation of
softmax loss. Thus, HCTL and softmax loss is divided into two
parts and calculated separately. For the former, the features of
centers of classes of training samples are learned by averaging
the features of the corresponding classes, and then the hard
triplets will be mined to compute HCTL by using a hard sample
Input
Conv
1
Conv
2_x
Conv
3_x
Conv
4_x
Conv
5_x
avg
pooling
max
pooling
last stride = 1
[1,2048]
fusion feature
dropout=0.5
[1,2048]
Convolution Layer Fusion LayerMixed Pooling Layer
[1,2048][1,4096]
fully
connectedconcat
Fig. 6. Proposed Fusion Feature Learning Network (FFLN).
HCTL
P×K
imagesFFLN
...
...
...
P×K×[1,2048]
Center
feature
K
K
K
...
...
...
hard sample
mining
Triplet
loss 2
...
Softmax layer
+Total
loss
Softmax loss+ label smoothing
Triplet
loss P
fusion
feature
...
Avg
Avg
Avg
1
2
P
p
a(Cen)
n
p
a(Cen)
n
Triplet
loss 1
p
a(Cen)
n
Fig. 7. Proposed metric loss function, hard mining center-triplet loss (HCTL).
The HCTL joints with softmax loss to optimize the overall model.
Authorized licensed use limited to: TONGJI UNIVERSITY. Downloaded on February 21,2020 at 03:54:28 UTC from IEEE Xplore. Restrictions apply.
1520-9210 (c) 2019 IEEE. Personal use is permitted, but republication/redistribution requires IEEE permission. See http://www.ieee.org/publications_standards/publications/rights/index.html for more information.
This article has been accepted for publication in a future issue of this journal, but has not been fully edited. Content may change prior to final publication. Citation information: DOI 10.1109/TMM.2020.2972125, IEEETransactions on Multimedia
> REPLACE THIS LINE WITH YOUR PAPER IDENTIFICATION NUMBER (DOUBLE-CLICK HERE TO EDIT) <
7
mining strategy. For the latter, the deep fusion features, the
output of FFLN will be calculated using the softmax loss
through an added softmax layer. Finally, we need a
hyper-parameter 𝜆 to balance our loss and softmax loss to
calculate the total loss, which can be formulated as follows:
𝐿 = 𝐿𝑐𝑙𝑠 + 𝜆𝐿ℎ𝑐𝑡 , (7)
where 𝐿𝑐𝑙𝑠 denotes the softmax loss, 𝐿ℎ𝑐𝑡 denotes the HCTL,
and 𝜆 is the weight used to balance the HCTL and softmax loss.
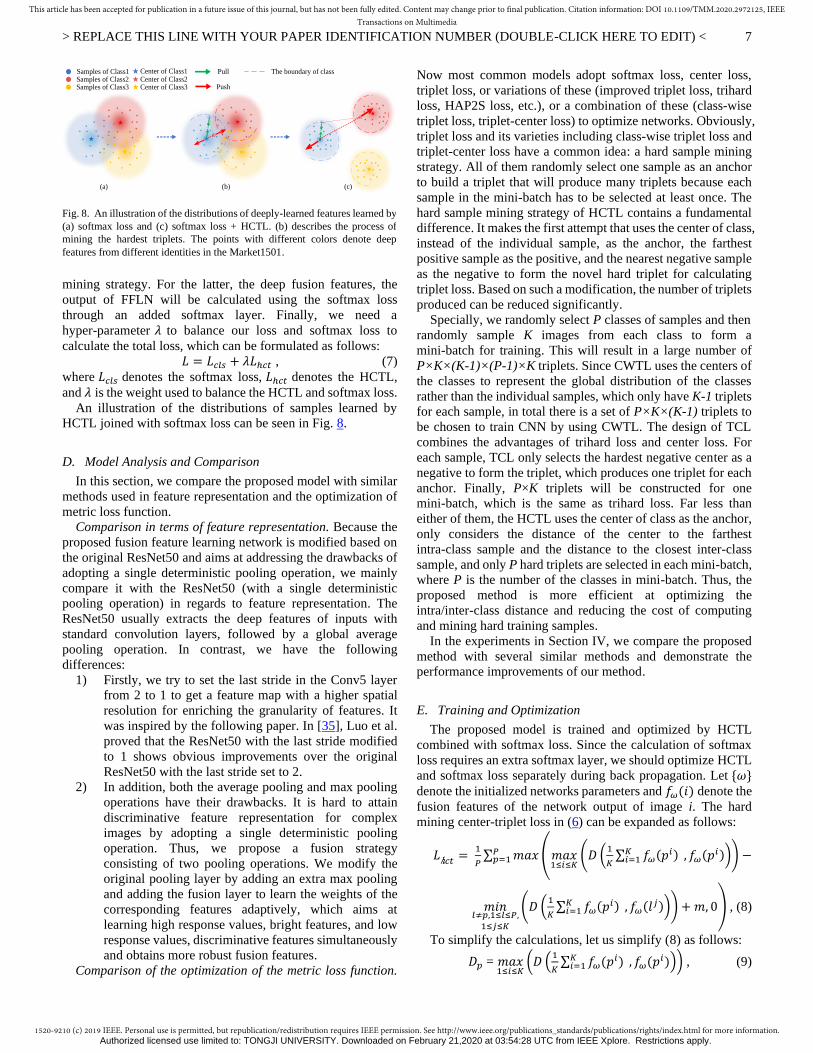
An illustration of the distributions of samples learned by
HCTL joined with softmax loss can be seen in Fig. 8.
D. Model Analysis and Comparison
In this section, we compare the proposed model with similar
methods used in feature representation and the optimization of
metric loss function.
Comparison in terms of feature representation. Because the
proposed fusion feature learning network is modified based on
the original ResNet50 and aims at addressing the drawbacks of
adopting a single deterministic pooling operation, we mainly
compare it with the ResNet50 (with a single deterministic
pooling operation) in regards to feature representation. The
ResNet50 usually extracts the deep features of inputs with
standard convolution layers, followed by a global average
pooling operation. In contrast, we have the following
differences:
1) Firstly, we try to set the last stride in the Conv5 layer
from 2 to 1 to get a feature map with a higher spatial
resolution for enriching the granularity of features. It
was inspired by the following paper. In [35], Luo et al.
proved that the ResNet50 with the last stride modified
to 1 shows obvious improvements over the original
ResNet50 with the last stride set to 2.
2) In addition, both the average pooling and max pooling
operations have their drawbacks. It is hard to attain
discriminative feature representation for complex
images by adopting a single deterministic pooling
operation. Thus, we propose a fusion strategy
consisting of two pooling operations. We modify the
original pooling layer by adding an extra max pooling
and adding the fusion layer to learn the weights of the
corresponding features adaptively, which aims at
learning high response values, bright features, and low
response values, discriminative features simultaneously
and obtains more robust fusion features.
Comparison of the optimization of the metric loss function.
Now most common models adopt softmax loss, center loss,
triplet loss, or variations of these (improved triplet loss, trihard
loss, HAP2S loss, etc.), or a combination of these (class-wise
triplet loss, triplet-center loss) to optimize networks. Obviously,
triplet loss and its varieties including class-wise triplet loss and
triplet-center loss have a common idea: a hard sample mining
strategy. All of them randomly select one sample as an anchor
to build a triplet that will produce many triplets because each
sample in the mini-batch has to be selected at least once. The
hard sample mining strategy of HCTL contains a fundamental
difference. It makes the first attempt that uses the center of class,
instead of the individual sample, as the anchor, the farthest
positive sample as the positive, and the nearest negative sample
as the negative to form the novel hard triplet for calculating
triplet loss. Based on such a modification, the number of triplets
produced can be reduced significantly.
Specially, we randomly select P classes of samples and then
randomly sample K images from each class to form a
mini-batch for training. This will result in a large number of
P×K×(K-1)×(P-1)×K triplets. Since CWTL uses the centers of
the classes to represent the global distribution of the classes
rather than the individual samples, which only have K-1 triplets
for each sample, in total there is a set of P×K×(K-1) triplets to
be chosen to train CNN by using CWTL. The design of TCL
combines the advantages of trihard loss and center loss. For
each sample, TCL only selects the hardest negative center as a
negative to form the triplet, which produces one triplet for each
anchor. Finally, P×K triplets will be constructed for one
mini-batch, which is the same as trihard loss. Far less than
either of them, the HCTL uses the center of class as the anchor,
only considers the distance of the center to the farthest
intra-class sample and the distance to the closest inter-class
sample, and only P hard triplets are selected in each mini-batch,
where P is the number of the classes in mini-batch. Thus, the
proposed method is more efficient at optimizing the
intra/inter-class distance and reducing the cost of computing
and mining hard training samples.
In the experiments in Section IV, we compare the proposed
method with several similar methods and demonstrate the
performance improvements of our method.
E. Training and Optimization
The proposed model is trained and optimized by HCTL
combined with softmax loss. Since the calculation of softmax
loss requires an extra softmax layer, we should optimize HCTL
and softmax loss separately during back propagation. Let {𝜔}
denote the initialized networks parameters and 𝑓𝜔(𝑖) denote the
fusion features of the network output of image i. The hard
mining center-triplet loss in (6) can be expanded as follows:
𝐿ℎ𝑐𝑡 = 1
𝑃∑ 𝑚𝑎𝑥 (𝑚𝑎𝑥
1≤𝑖≤𝐾(𝐷 (
1
𝐾∑ 𝑓𝜔(𝑝𝑖)𝐾
𝑖=1 , 𝑓𝜔(𝑝𝑖))) −𝑃𝑝=1
𝑚𝑖𝑛𝑙≠𝑝,1≤𝑙≤𝑃,
1≤𝑗≤𝐾
(𝐷 (1
𝐾∑ 𝑓𝜔(𝑝𝑖)𝐾
𝑖=1 , 𝑓𝜔(𝑙𝑗))) + 𝑚, 0) , (8)
To simplify the calculations, let us simplify (8) as follows:
𝐷𝑝 = 𝑚𝑎𝑥1≤𝑖≤𝐾
(𝐷 (1
𝐾∑ 𝑓𝜔(𝑝𝑖)𝐾
𝑖=1 , 𝑓𝜔(𝑝𝑖))) , (9)
Samples of Class1Samples of Class2Samples of Class3
Center of Class1Center of Class2Center of Class3
Pull
Push
The boundary of class
(a) (b) (c)
Fig. 8. An illustration of the distributions of deeply-learned features learned by
(a) softmax loss and (c) softmax loss + HCTL. (b) describes the process of
mining the hardest triplets. The points with different colors denote deep
features from different identities in the Market1501.
Authorized licensed use limited to: TONGJI UNIVERSITY. Downloaded on February 21,2020 at 03:54:28 UTC from IEEE Xplore. Restrictions apply.

1520-9210 (c) 2019 IEEE. Personal use is permitted, but republication/redistribution requires IEEE permission. See http://www.ieee.org/publications_standards/publications/rights/index.html for more information.
This article has been accepted for publication in a future issue of this journal, but has not been fully edited. Content may change prior to final publication. Citation information: DOI 10.1109/TMM.2020.2972125, IEEETransactions on Multimedia
> REPLACE THIS LINE WITH YOUR PAPER IDENTIFICATION NUMBER (DOUBLE-CLICK HERE TO EDIT) <
8
𝐷𝑛 = 𝑚𝑖𝑛𝑙≠𝑝,1≤𝑙≤𝑃,
1≤𝑗≤𝐾
(𝐷 (1
𝐾∑ 𝑓𝜔(𝑝𝑖)𝐾
𝑖=1 , 𝑓𝜔(𝑙𝑗))) , (10)
𝐿ℎ𝑐𝑡 = 1
𝑃∑ 𝑚𝑎𝑥(𝐷𝑝 − 𝐷𝑛 + 𝑚, 0)𝑃
𝑝=1 , (11)
According to the chain rule, the derivatives of the hard
mining center-triplet loss can be computed as follows:
∂𝐿ℎ𝑐𝑡
∂ω = {
𝜕𝐷𝑝
𝜕𝜔 −
𝜕𝐷𝑛
𝜕𝜔 𝐷𝑝 − 𝐷𝑛 + 𝑚 > 0
0 𝐷𝑝 − 𝐷𝑛 + 𝑚 ≤ 0 , (12)
𝜕𝐷𝑝
𝜕𝜔 = 𝑚𝑎𝑥
1≤𝑖≤𝐾(2(
1
𝐾∑ 𝑓𝜔(𝑝𝑖)𝐾
𝑖=1 − 𝑓𝜔(𝑝𝑖)) ∙
(1
𝐾∑
𝜕𝑓𝜔(𝑝𝑖)
𝜕𝜔
𝐾𝑖=1 −
𝜕𝑓𝜔(𝑝𝑖)
𝜕𝜔)) , (13)
𝜕𝐷𝑛
𝜕𝜔 = 𝑚𝑖𝑛
𝑙≠𝑝,1≤𝑙≤𝑃,1≤𝑗≤𝐾
(2(1
𝐾∑ 𝑓𝜔(𝑝𝑖)𝐾
𝑖=1 − 𝑓𝜔(𝑙𝑗)) ∙
(1
𝐾∑
𝜕𝑓𝜔(𝑝𝑖)
𝜕𝜔
𝐾𝑖=1 −
𝜕𝑓𝜔(𝑙𝑗)
𝜕𝜔)) , (14)
Finally, algorithm 1 shows the main training procedure
followed by our method.
IV. EXPERIMENTS
In this section, we report on experiments to evaluate our
method and compare the obtained results with state-of-the-art
methods.
A. Datasets
We conduct experiments on three representative large-scale
datasets, Market1501, DukeMTMC-ReID, and MSMT17,
respectively.
Market1501 [36] is one of the largest benchmark datasets for
person re-identification, and it contains 32,668 images of 1,501
identities from 6 camera views. Each identity is captured by at
most six cameras. There are 751 identities in the training set
and 750 identities in the testing set. Fig. 9 shows some example
images from this dataset.
DukeMTMC-ReID [37] is a subset of the DukeMTMC [38]
tracking dataset, which contains 36,411 images with 1,812
identities captured from 8 different viewpoints. Specifically,
there are 16,522 images with 702 identities for training, 17,661
images with 1,110 identities in the gallery, and another 2,228
images with 702 identities in the gallery for query. Fig. 10
shows some example images from this dataset.
MSMT17 [52] is the current largest public Re-ID dataset,
which is collected with different weather conditions during 3
time slots (morning, noon, afternoon). It contains 126,441
images of 4,101 identities captured from 12 outdoor cameras
and 3 indoor cameras. The MSMT17 is also significantly more
challenging than Market1501 and DukeMTMC-ReID due to
more complex scenes. We follow the same training-testing split
of [52]. Fig. 11 shows some example images from this dataset.
B. Implementation Details
We conduct experiments based on Torchreid [53], a
Fig. 11. Example images from MSMT17 [52] dataset.
Fig. 10. Example images from DukeMTMC-ReID [37] dataset.
Fig. 9. Example images from Market1501 [36] dataset.
Algorithm 1. Hard Mining Center-Triplet Loss Training Algorithm
Input: Training samples { 𝐼𝑖 }. Initialized networks parameters{ 𝜔 }.
Initialized softmax layer parameters { 𝜗 } of softmax loss.
Hyperparameter λ and learning rate 𝜇. The number of iteration t ←
0.
Output: The networks parameters {𝜔}.
1: while 𝑡 ≤ 𝑇 do
2: 𝑡 ← 𝑡 + 1;
3: Calculate fusion features of samples 𝑓𝑝𝑘 by forward propagation;
4: Calculate the distance
𝑚𝑎𝑥1≤𝑖≤𝐾
(𝐷(𝑐𝑝, 𝑓𝜔(𝑝𝑖))) , min𝑙≠𝑝,1≤𝑙≤𝑃,
1≤𝑗≤𝐾
(𝐷(𝑐𝑝 , 𝑓𝜔(𝑙𝑗)))
5: Calculate the total loss 𝐿 = 𝐿𝑐𝑙𝑠 + 𝜆𝐿ℎ𝑐𝑡
6: Calculate the ∂𝐿𝑐𝑙𝑠
∂ω ,
∂𝐿ℎ𝑐𝑡
∂ω by back propagation
7: Update the softmax layer parameters {𝜗} of softmax loss
𝜗𝑡+1 =𝜗𝑡 - 𝜇𝑡 ∙∂𝐿𝑐𝑙𝑠
∂𝜗𝑡
8: Update the networks parameters 𝜔𝑡+1 =𝜔𝑡 - 𝜇𝑡 ∙∂𝐿
∂𝜔𝑡
= 𝜔𝑡- 𝜇𝑡(∂𝐿𝑐𝑙𝑠
∂ω+ 𝜆 ∙
𝜕𝐿ℎ𝑐𝑡
𝜕𝜔)
9: end while
Authorized licensed use limited to: TONGJI UNIVERSITY. Downloaded on February 21,2020 at 03:54:28 UTC from IEEE Xplore. Restrictions apply.

1520-9210 (c) 2019 IEEE. Personal use is permitted, but republication/redistribution requires IEEE permission. See http://www.ieee.org/publications_standards/publications/rights/index.html for more information.
This article has been accepted for publication in a future issue of this journal, but has not been fully edited. Content may change prior to final publication. Citation information: DOI 10.1109/TMM.2020.2972125, IEEETransactions on Multimedia
> REPLACE THIS LINE WITH YOUR PAPER IDENTIFICATION NUMBER (DOUBLE-CLICK HERE TO EDIT) <
9
mainstream library for deep-learning person re-identification in
PyTorch. In the experiments, every 32 images are randomly
selected to form a mini-batch for training, which contains 8
identities, and each identity has 4 images. For feature extraction,
we set the last stride in the Conv5 layer to 1 to get deep features
with a larger spatial area. We also set the dropout ratio to 0.5 to
avoid overfitting in the last fully connected layer. For
optimization, the standard AMSGrad [39] algorithm is adopted
for faster and more robust back propagation and loss
convergence. The initial learning rate of softmax loss and the
initial learning rate of HCTL are both set to 3e-4.
C. Parameter influence
In the training process, the model will be trained and
optimized by the total loss, as defined by (7). Thus, the margin
parameter m and the weight parameter λ may affect the final
performance of Re-ID. Specifically, m can affect the relative
distance between the center to its farthest positive sample and
to its nearest negative sample, while λ controls the trade-off
between HCTL and softmax loss. To study the impact of the
two hyper parameters, we conducted experiments on the
Market1501 dataset and evaluated the performances with
rank-1 accuracies.
To study the impact of weight parameter λ, we firstly fixed
margin m as 0.5, and then set λ as 1e-5, 1e-4, 0.001, 0.01, and 0,
respectively. The experimental results are presented in Fig. 12.
If the model is only trained by softmax loss (λ = 0), the
performance can achieve 92.0% rank-1 accuracy. But with
HCTL, we can get the highest improvement of 1.8% in terms of
rank-1 when λ is set to 1e-4. This is because once the model
trained by softmax loss has converged, the appropriate weight
of HCTL can further enforce the clustering of features of
samples and attain a better performance. For weight λ, too large
or too small values may lead to inferior results. When it is too
small, the contribution of HCTL is weakened, while too large
values may affect the convergence of softmax loss, thereby
producing poorer results.
To study the influence of m, we fixed λ as 1e-4 and then set m
from 0.1 to 1. The experimental results are presented in Fig. 13.
For margin m, we can also see that too large and too small
values both lead to inferior performances. Too small values
may weaken the effect of clustering with HCTL, while too large
values may cause overfitting of the model. The best
performance gains a rank-1 accuracy of 93.8% by setting m to
0.5.
The experimental results demonstrate that our model
achieves the best performance on Market1501 when λ is 1e-4
and m is 0.5. In addition, we also conduct the same experiments
on the DukeMTMC-ReID and MSMT17 datasets to find the
optimal parameters. Finally, we set m and λ as 0.5 and 1e-4 as
the default setting for all the following experimental
evaluations on Market1501 and MSMT17, and set m and λ as
0.3 and 1e-4 on DukeMTMC-ReID.
D. Experimental Results and Analysis
1) Comparison with state-of-the-art methods
We conduct experiments with other state-of-the-art methods,
including LOMO+XQDA [40], BoW+Kissme [36], Spindle
Net [4], SVDNet [41], TriNet [10], AlignedReID [11],
HAP2S_E [24], MLFN [42], HA-CNN [14], PCB [43], etc.
Then, we evaluate them with rank-1, 5, 10 accuracies and mAP
to illustrate the superiority of our proposed model. The results
on three datasets are shown in Table I, II, III and Fig. 14-16.
Results analysis on Market1501 dataset. To evaluate the
performance of our proposed model, we firstly compare our
method with existing state-of-the-art methods on Market1501.
As shown in Table I, our method (with the last stride set to 1) is
superior to all state of-the-art methods and has the highest
scores on rank-1 and mAP. Specifically, it achieves a 93.8%
rank-1 accuracy and an 81.8% mAP, which outperforms the
Deep-Person by 1.5% (93.8-92.3) in rank-1 and 2.2%
(81.8-79.6) in mAP.
Results analysis on DukeMTMC-ReID dataset. We also
evaluated our method with other state-of-the-art methods on
DukeMTMC-ReID dataset. Table II shows that our method
again outperforms all compared state-of-the-arts methods with
significant improvements on rank-1 and mAP, exceeding the
PCB by 1.7% (83.3-81.6) in rank-1 and 1.8% (68.2-66.4) in
mAP. Specifically, our method attains an 83.3% rank-1
accuracy and a 68.2% mAP.
Results analysis on MSMT17 dataset. We further evaluated
our proposed method with other state-of-the-art methods on
Fig. 13. The influence of margin parameter m evaluated by a score of rank-1
accuracy.
Fig. 12. The influence of weight parameter λ evaluated by a score of rank-1 accuracy.
Authorized licensed use limited to: TONGJI UNIVERSITY. Downloaded on February 21,2020 at 03:54:28 UTC from IEEE Xplore. Restrictions apply.

1520-9210 (c) 2019 IEEE. Personal use is permitted, but republication/redistribution requires IEEE permission. See http://www.ieee.org/publications_standards/publications/rights/index.html for more information.
This article has been accepted for publication in a future issue of this journal, but has not been fully edited. Content may change prior to final publication. Citation information: DOI 10.1109/TMM.2020.2972125, IEEETransactions on Multimedia
> REPLACE THIS LINE WITH YOUR PAPER IDENTIFICATION NUMBER (DOUBLE-CLICK HERE TO EDIT) <
10
MSMT17, and the results are shown in Table III. The number
of methods that report on this dataset is limited since it was only
recently released. Our method is still superior to most state-
of-the-art methods and attains the highest scores on rank-1 and
mAP. Specifically, it achieves a 74.3% rank-1 accuracy and a
43.6% mAP, which outperforms the PCB by 6.1% (74.3-68.2)
in rank-1 and 2.5% (43.6-41.1) in mAP.
As we can see, the experimental results on three large-scale
benchmarks, including Market1501, DukeMTMC-ReID, and
MSMT17, demonstrate that our method outperforms most
existing state-of-the-art methods and sufficiently show the
robustness and efficiency of our method for Re-ID.
2) Further Ablation Analysis and Discussion
We further evaluated the performance of each part of our
center-triplet model on Market1501 and DukeMTMC-ReID:
the fusion feature learning network (FFLN) and hard mining
center-triplet loss (HCTL).
Effect of the fusion feature learning network. We conducted
experiments with different pooling operations on the standard
Fig. 14. The CMC curves and rank-1 accuracy on Market1501.
TABLE I COMPARISON WITH STATE-OF-THE-ART METHODS ON MARKET1501 DATASET.
1ST/2ND BEST IN RED/BLUE.
Method mAP Rank-1 Rank-5 Rank-10
LOMO+XQDA [40] 22.2 43.8 -- --
BoW+Kissme [36] 20.8 44.4 63.9 72.2
Spindle Net [4] -- 76.9 91.5 94.6
SVDNet [41] 62.1 82.3 -- --
OIM [44] 62.5 83.0 93.1 95.2
PAN [6] 63.4 82.8 93.5 --
FAPL[18] 63.8 83.6 -- --
GAN [37] 66.1 84.0 -- --
APR [12] 64.7 84.3 93.2 95.2
TriNet [10] 69.0 84.7 94.2 96.2
MSML [23] 69.6 85.2 93.7 --
HAP2S_E [24] 69.8 84.2 -- --
DPFL [46] 73.1 88.9 -- --
AlignedReID [11] 75.9 88.8 95.6 97.4
GLAD [15] 73.9 89.9 -- --
MLFN [42] 74.5 90.2 95.9 97.4
ResNet50-mid [47] 76.1 90.2 96.4 97.9
Mask Re-ID [48] 75.4 90.4 -- --
HA-CNN [14] 75.6 90.9 96.4 97.8
PCB [43] 77.3 92.3 96.9 98.2
Deep-Person [49] 79.6 92.3 -- --
Ours (last stride=2) 80.0 92.6 97.2 98.5
Ours (last stride=1) 81.8 93.8 97.8 98.6
TABLE II
COMPARISON WITH STATE-OF-THE-ART METHODS ON DUKEMTMC-REID
DATASET. 1ST/2ND BEST IN RED/BLUE.
Method mAP Rank-1 Rank-5 Rank-10
LOMO+XQDA [40] 17.0 30.8 -- --
BoW+Kissme [36] 12.2 25.1 -- --
GAN [37] 47.1 67.7 -- --
APR [12] 51.9 70.7 -- --
PAN [6] 51.5 71.6 83.9 --
FAPL[18] 53.9 72.9 -- --
OIM [44] 54.6 73.1 85.9 91.5
TriNet [10] 57.7 74.5 86.4 89.5
SVDNet [41] 56.8 76.7 -- --
HAP2S_E [24] 59.6 76.1 -- --
Mask Re-ID [48] 61.9 78.9 -- --
DPFL [46] 60.6 79.2 -- --
HA-CNN [14] 63.2 80.1 89.6 92.1
Deep-Person [49] 64.8 80.9 -- --
MLFN [42] 63.2 81.1 90.3 92.6
AlignedReID [11] 66.7 81.6 90.4 93.1
ResNet50-mid [47] 64.0 81.6 90.0 93.0
PCB [43] 66.4 81.6 91.1 93.3
Ours (last stride=2) 67.9 82.9 91.3 93.6
Ours (last stride=1) 68.2 83.3 91.7 93.8
Fig. 15. The CMC curves and rank-1 accuracy on DukeMTMC-ReID.
Authorized licensed use limited to: TONGJI UNIVERSITY. Downloaded on February 21,2020 at 03:54:28 UTC from IEEE Xplore. Restrictions apply.

1520-9210 (c) 2019 IEEE. Personal use is permitted, but republication/redistribution requires IEEE permission. See http://www.ieee.org/publications_standards/publications/rights/index.html for more information.
This article has been accepted for publication in a future issue of this journal, but has not been fully edited. Content may change prior to final publication. Citation information: DOI 10.1109/TMM.2020.2972125, IEEETransactions on Multimedia
> REPLACE THIS LINE WITH YOUR PAPER IDENTIFICATION NUMBER (DOUBLE-CLICK HERE TO EDIT) <
11
ResNet50 and evaluated them with rank-1, 5, 10 accuracies and
mAP to illustrate the robustness of the FFLN, which learns
fusion features by combining max pooling and average pooling.
We also conducted additional comparative experiments to
verify the effect of the last stride after the Conv5 layer and the
dropout in the fusion layer. The results for two datasets are
shown in Table IV, V and Fig. 17-18. Avg stands for the
ResNet50 with average pooling operation, Max stands for the
ResNet50 with max pooling operation, Avg+Max stands for the
FFLN (combining two pooling operations), +S1 stands for
setting the last stride to 1, +S2 stands for setting the last stride to
2, and +Dropout stands for using dropout to avoid overfitting.
All of them are optimized by softmax uniformly.
What we need to note the results is that learned features with
a higher spatial resolution that improve performance do not
apply to all Re-ID models. This applies to our model, although
the effect is not very obvious. Applying dropout can also lead to
a small improvement. The main contribution of FFLN is the
fusion strategy of max pooling and average pooling. The FFLN
with dropout and the last stride set to 1 can produce higher
scores in rank-1 accuracy and mAP.
On Market1501, the model of ResNet50 with average
pooling achieves an 82.0% rank-1 accuracy and a 63.6% mAP,
which is similar to adopting a max pooling operation. By
contrast, our FFLN (combine average pooling with a max
pooling operation) achieves a 92.0% rank-1 accuracy and a
78.1% mAP, exceeding it by 10.0% and 14.5%. Compared with
an efficient Re-ID model, such as PCB and HA-CNN, the
FFLN still attains the highest scores in mAP, rank-5, and
rank-10 accuracy and attains the second best rank-1.
On DukeMTMC-ReID, the rank-1 and mAP are further
improved to 82.3% and 64.7% in the FFLN, outperforming the
original ResNet50 with average pooling by 13.4% and 16.2%,
respectively. Likewise, compared with an efficient Re-ID
model, such as PCB and HA-CNN, the FFLN attains the
highest scores in rank-1 accuracy and the second-best mAP.
In order to further illustrate the superiority of the FFLN in
robust feature learning, we output the visual retrieval results, as
shown in Fig. 19. The first row shows the results for the method
using ResNet50 with an average pooling operation. According
TABLE III
COMPARISON WITH STATE-OF-THE-ART METHODS ON MSMT17 DATASET. 1ST/2ND BEST IN RED/BLUE.
Method mAP Rank-1 Rank-5 Rank-10
TriNet [10] 26.9 56.9 72.7 78.4
HA-CNN [14] 25.5 48.8 65.7 72.2
MLFN [42] 27.7 52.5 69.2 75.6
GLAD[15] 34.0 61.4 76.8 81.6
ResNet50-mid [47] 37.7 68.7 80.9 84.8
PCB [43] 41.1 68.2 81.3 85.6
Ours (last stride=2) 40.9 71.3 82.8 86.4
Ours (last stride=1) 43.6 74.3 84.7 87.9
TABLE IV COMPARISON WITH MODELS ON MAEKER1501 DATASET.
1ST/2ND BEST IN RED/BLUE.
Model mAP Rank-1 Rank-5 Rank-10
Avg+S2 63.6 82.0 92.8 95.2
Max+S2 58.7 82.3 92.2 94.4
Avg+S1 61.4 81.5 92.6 95.3
Max+S1 55.3 80.0 90.9 94.1
Avg+Max+S2 74.9 90.8 96.5 97.8
Avg+Max+S2+
Dropout 78.0 91.2 96.9 98.1
Avg+Max+S1 75.1 91.4 97.0 98.0
Avg+Max+S1+
Dropout 78.1 92.0 97.3 98.2
TriNet [10] 69.0 84.7 94.2 96.2
MLFN [42] 74.5 90.2 95.9 97.4
ResNet50-mid [47] 76.1 90.2 96.4 97.9
HA-CNN [14] 75.6 90.9 96.4 97.8
PCB [43] 77.3 92.3 96.9 98.2
Fig. 16. The CMC curves and rank-1 accuracy on MSMT17.
Fig. 17. Comparisons with different pooling operations on Market1501.
Authorized licensed use limited to: TONGJI UNIVERSITY. Downloaded on February 21,2020 at 03:54:28 UTC from IEEE Xplore. Restrictions apply.

1520-9210 (c) 2019 IEEE. Personal use is permitted, but republication/redistribution requires IEEE permission. See http://www.ieee.org/publications_standards/publications/rights/index.html for more information.
This article has been accepted for publication in a future issue of this journal, but has not been fully edited. Content may change prior to final publication. Citation information: DOI 10.1109/TMM.2020.2972125, IEEETransactions on Multimedia
> REPLACE THIS LINE WITH YOUR PAPER IDENTIFICATION NUMBER (DOUBLE-CLICK HERE TO EDIT) <
12
to the retrieval results, 3 false matches in the top 8 nearest
images were all dark in contrast and brightness, which proves
that average pooling takes low response features into
consideration, thereby reducing the contrast in the feature map.
Regarding max pooling, 2 false matches in the top 4 nearest
images both show bright color characteristics and contrast,
especially the first false match. It shows that max pooling is
sensitive to high response features and ignores the low response
values, discriminative features. Both of them have difficulties
in learning robust feature representation. In contrast, the FFLN
combines the advantages of max pooling and average pooling,
which can learn high response values, bright features, and low
response values, discriminative features simultaneously,
thereby enhancing the contrast in the feature map. It can also be
seen from the matching results that the top 8 nearest images in
the third row are all correctly matched with distinctive features.
In addition, we visualize the final output feature maps learned
by different pooling operations, as shown in Fig. 20. We notice
that the feature maps from the ResNet50 with average pooling
and ResNet50 with max pooling both produce poor
representations. By contrast, the FFLN can force the network to
focus more on the person region.
Compared with adopting a single deterministic pooling
operation, the experimental results show the superiority of the
FFLN in learning robust feature representation, which obtains
deep fusion features by adjusting the weights of features
learned by the two pooling operations.
Effect of the hard mining center-triplet loss. We also conduct
experiments with different loss functions on ResNet50 to
illustrate the robustness of the proposed HCTL. The results on
the two datasets are shown in Table VI, VII and Fig. 21-22.
Classic Triplet stands for the classic triplet loss [19],
TABLE V
COMPARISON WITH MODELS ON DUKEMTMC-REID DATASET.
1ST/2ND BEST IN RED/BLUE.
Model mAP Rank-1 Rank-5 Rank-10
Avg+S2 48.5 68.9 82.4 86.6
Max+S2 47.6 69.6 82.1 86.4
Avg+S1 46.9 66.6 80.2 85.7
Max+S1 47.7 70.3 82.0 86.0
Avg+Max+S2 64.2 81.7 90.4 93.2
Avg+Max+S2+ Dropout
64.4 82.2 90.8 93.2
Avg+Max+S1 64.3 82.0 90.4 92.9
Avg+Max+S1+
Dropout 64.7 82.3 90.9 93.6
TriNet [10] 57.7 74.5 86.4 89.5
HA-CNN [14] 63.2 80.1 89.6 92.1
MLFN [42] 63.2 81.1 90.3 92.6
ResNet50-mid [47] 64.0 81.7 90.0 93.0
PCB [43] 66.4 81.6 91.1 93.3
Fig. 18. Comparisons with different pooling operations on DukeMTMC-ReID.
Query Top 8 nearest images
Fig. 19. Visual retrieval results with different pooling operations. The green
rectangle represents correct matches, and the red dash rectangle represents false
matches. For the query sample, the first, second, and third rows show the
results for the methods of ResNet50 with an average pooling operation, ResNet50 with a max pooling operation, and the FFLN, respectively.
(i) (ii) (iii) (i) (ii) (iii) (i) (ii) (iii)
Fig. 20. Visualization of the Conv5 feature maps learned by different pooling
operations. The first, second, and third rows show the results for the methods of ResNet50 with an average pooling operation, ResNet50 with a max pooling
operation, and the FFLN, respectively. From left to right, (i) Original images,
(ii) Activation map, and (iii) Overlapped image. In the heat map, the response
increases from blue to red.
Authorized licensed use limited to: TONGJI UNIVERSITY. Downloaded on February 21,2020 at 03:54:28 UTC from IEEE Xplore. Restrictions apply.

1520-9210 (c) 2019 IEEE. Personal use is permitted, but republication/redistribution requires IEEE permission. See http://www.ieee.org/publications_standards/publications/rights/index.html for more information.
This article has been accepted for publication in a future issue of this journal, but has not been fully edited. Content may change prior to final publication. Citation information: DOI 10.1109/TMM.2020.2972125, IEEETransactions on Multimedia
> REPLACE THIS LINE WITH YOUR PAPER IDENTIFICATION NUMBER (DOUBLE-CLICK HERE TO EDIT) <
13
Quadruplet stands for quadruplet loss [22], OIM stands for
Online Instance Matching Loss [44], Cluster loss stands for
cluster loss [45], Trihard stands for the trihard loss [10], and
Softmax stands for softmax loss with LSR. We also combine
ring loss [50], center loss [20], range loss [51], class-wise triplet
loss (CWTL) [26], triplet-center loss (TCL) [27], and our hard
mining center-triplet loss (HCTL) with Softmax.
On Market1501, as clearly seen in Table VI, the HCTL gets a
73.8% mAP and an 88.4% rank-1 accuracy, which outperforms
all compared losses, exceeding the second-best TCL by 2.1%
(88.4-86.3) in rank-1 and 4% (73.8-69.8) in mAP. Compared
with softmax loss, adding HCTL can increase the accuracy by
6.4% on rank-1 and by 10.2% on mAP.
On DukeMTMC-ReID, the HCTL also attains the highest
rank-1 accuracy and the second-best mAP. Although
performance does not improve much compared with trihard
loss, fewer hard triplets are mined for training with our HCTL.
The significantly reduces the computing and mining
requirements of hard training samples. Compared with softmax
loss, adding HCTL can increase the rank-1 accuracy and mAP
by 6.3% and 7.3%.
Compared with similar loss functions overall, our loss is
more efficient in training networks and optimizing the
intra/inter-class distance and reducing the computing and
mining requirements of hard training samples simultaneously.
In summary, it can be seen that the FFLN contributes more
than HCTL, but they are both important to the overall model.
Once the FFLN trained by softmax loss has converged, the
HCTL can further encourage the clustering of features of
samples and achieve superior performance.
A comparison of visual retrieval results on the two datasets
between our method and the ResNet50 with softmax (baseline)
is shown in Fig. 23-24. Both FFLN and HCTL have made great
contributions to the center-triplet model. Finally, our method
significantly improved the Re-ID in comparison to the baseline,
which also outperforms most state-of-the-art methods.
TABLE VI
SCORES OF DIFFERENT LOSS FUNCTIONS FOR RE-ID ON MARKET1501
DATASET. THE BEST SCORES ARE IN RED.
Method mAP Rank-1 Rank-5 Rank-10
Classic Triplet 54.8 75.9 89.6 --
Quadruplet 61.1 80.0 91.8 --
Softmax 63.6 82.0 92.8 95.2
OIM 62.5 83.0 93.1 95.2
Softmax+Ring loss 66.9 83.4 93.5 95.7
Softmax+Center loss 66.4 84.1 94.2 96.3
Softmax+Range loss 66.2 84.4 94.0 96.1
Softmax+CWTL 68.0 85.2 93.6 96.0
Trihard 69.0 84.7 94.2 96.2
Cluster loss 71.5 86.1 95.0 --
Softmax+TCL 69.8 86.3 94.2 96.3
Softmax+HCTL(Our) 73.8 88.4 95.5 97.3
Fig. 21. Comparisons with different loss functions on Market1501.
TABLE VII SCORES OF DIFFERENT LOSS FUNCTIONS FOR RE-ID ON DUKEMTMC-REID
DATASET. THE BEST SCORES ARE IN RED.
Method mAP Rank-1 Rank-5 Rank-10
Softmax 48.5 68.9 82.4 86.6
Softmax+Center loss 50.0 70.0 83.3 87.6
Softmax+Ring loss 51.3 70.7 83.5 87.0
Softmax+CWTL 52.0 72.2 84.2 88.0
Softmax+TCL 53.2 72.1 84.4 88.6
Softmax+Range loss 54.1 73.3 85.5 89.0
OIM loss 54.6 73.1 85.9 91.5
Trihard loss 57.7 74.5 86.4 89.5
Softmax+HCTL(Our) 55.8 75.2 87.0 90.4
Fig. 22. Comparisons with different loss functions on DukeMTMC-ReID.
Authorized licensed use limited to: TONGJI UNIVERSITY. Downloaded on February 21,2020 at 03:54:28 UTC from IEEE Xplore. Restrictions apply.

1520-9210 (c) 2019 IEEE. Personal use is permitted, but republication/redistribution requires IEEE permission. See http://www.ieee.org/publications_standards/publications/rights/index.html for more information.
This article has been accepted for publication in a future issue of this journal, but has not been fully edited. Content may change prior to final publication. Citation information: DOI 10.1109/TMM.2020.2972125, IEEETransactions on Multimedia
> REPLACE THIS LINE WITH YOUR PAPER IDENTIFICATION NUMBER (DOUBLE-CLICK HERE TO EDIT) <
14
V. CONCLUSION
In this paper, we proposed a novel center-triplet model for
person re-identification. Firstly, we designed a fusion feature
learning network. It was shown to learn high response values,
bright features, and low response values, discriminative
features simultaneously and obtains more discriminative fusion
features by adaptively learning the weights of the features using
max pooling and average pooling. In addition, we designed a
hard mining center-triplet loss, a novel improved triplet loss,
which builds the most challenging triplets for computing loss. It
is shown to effectively optimize the intra/inter-class distance
and reduce the computing and mining requirements of training
hard samples simultaneously, thereby enhancing feature
representation learning. Finally, the results show the robustness
and efficiency of the proposed method. The model achieves a
93.8% rank-1 accuracy on Market1501, an 83.3% rank-1
accuracy on DukeMTMC-ReID, and a 74.3% rank-1 accuracy
on MSMT17, outperforming most state-of-the-art methods for
person re-identification. In the future, we would like to verify
the robustness of our method on more datasets.
ACKNOWLEDGMENT
The authors would like to thank the anonymous reviewers for
their critical and constructive comments and suggestions.
REFERENCES
[1]. Li W, Zhao R, Xiao T, et al. Deepreid: Deep filter pairing neural network
for person re-identification. Proceedings of the IEEE Conference on Computer Vision and Pattern Recognition. 2014: 152-159.
[2]. Wu S, Chen Y C, Li X, et al. An enhanced deep feature representation for
person re-identification.2016 IEEE winter conference on applications of computer vision. IEEE, 2016: 1-8.
[3]. Wu L, Shen C, Hengel A. Personnet: Person re-identification with deep
convolutional neural networks. arXiv preprint arXiv:1601.07255, 2016. [4]. Zhao H, Tian M, Sun S, et al. Spindle net: Person re-identification with
human body region guided feature decomposition and fusion.
Proceedings of the IEEE Conference on Computer Vision and Pattern Recognition. 2017: 1077-1085.
[5]. Li D, Chen X, Zhang Z, et al. Learning deep context-aware features over
body and latent parts for person re-identification. Proceedings of the IEEE Conference on Computer Vision and Pattern Recognition. 2017: 384-393.
[6]. Zheng Z, Zheng L, Yang Y. Pedestrian alignment network for large-scale
person re-identification. IEEE Transactions on Circuits and Systems for Video Technology, 2018.
[7]. Simonyan K, Zisserman A. Very deep convolutional networks for
large-scale image recognition. arXiv preprint arXiv:1409.1556, 2014. [8]. Szegedy C, Liu W, Jia Y, et al. Going deeper with convolutions.
Proceedings of the IEEE Conference on Computer Vision and Pattern
Recognition. 2015: 1-9. [9]. He K, Zhang X, Ren S, et al. Deep residual learning for image recognition.
Proceedings of the IEEE Conference on Computer Vision and Pattern
Recognition. 2016: 770-778.
[10]. Hermans A, Beyer L, Leibe B. In defense of the triplet loss for person
re-identification. arXiv preprint arXiv:1703.07737, 2017.
[11]. Zhang X, Luo H, Fan X, et al. Alignedreid: Surpassing human-level performance in person re-identification. arXiv preprint arXiv:1711.08184,
2017.
[12]. Lin Y, Zheng L, Zheng Z, et al. Improving person re-identification by attribute and identity learning. arXiv preprint arXiv:1703.07220, 2017.
[13]. Saquib Sarfraz M, Schumann A, Eberle A, et al. A pose-sensitive
embedding for person re-identification with expanded cross neighborhood re-ranking. Proceedings of the IEEE Conference on
Computer Vision and Pattern Recognition. 2018: 420-429.
[14]. Li W, Zhu X, Gong S. Harmonious attention network for person re-identification. Proceedings of the IEEE Conference on Computer
Vision and Pattern Recognition. 2018: 2285-2294. [15]. Wei L, Zhang S, Yao H, et al. GLAD: Global–Local-Alignment
Descriptor for Scalable Person Re-Identification. IEEE Transactions on
Multimedia, 2018, 21(4): 986-999. [16]. Boureau Y L, Ponce J, LeCun Y. A theoretical analysis of feature pooling
in visual recognition. Proceedings of the 27th international conference on
machine learning. 2010: 111-118.
Query Top 8 nearest images
Fig. 23. Visual retrieval results on Market1501. The green rectangle represents
correct matches, and the red dash rectangle represents false matches. For each sample, the first, second, third, and fourth rows show the results for the
methods of ResNet50+Softmax, ResNet50+Softmax+HCTL, FFLN+Softmax and FFLN+Softmax+HCTL, respectively.
Query Top 8 nearest images
Fig. 24. Visual retrieval results on DukeMTMC-ReID. The green rectangle
represents correct matches, and the red dash rectangle represents false matches. For each samples, the first, second, third, and fourth rows show the results for
the methods of ResNet50+Softmax, ResNet50+Softmax+HCTL, FFLN+Softmax and FFLN++Softmax+HCTL, respectively.
Authorized licensed use limited to: TONGJI UNIVERSITY. Downloaded on February 21,2020 at 03:54:28 UTC from IEEE Xplore. Restrictions apply.

1520-9210 (c) 2019 IEEE. Personal use is permitted, but republication/redistribution requires IEEE permission. See http://www.ieee.org/publications_standards/publications/rights/index.html for more information.
This article has been accepted for publication in a future issue of this journal, but has not been fully edited. Content may change prior to final publication. Citation information: DOI 10.1109/TMM.2020.2972125, IEEETransactions on Multimedia
> REPLACE THIS LINE WITH YOUR PAPER IDENTIFICATION NUMBER (DOUBLE-CLICK HERE TO EDIT) <
15
[17]. Yu D, Wang H, Chen P, et al. Mixed pooling for convolutional neural
networks. International Conference on Rough Sets and Knowledge Technology. Springer, Cham, 2014: 364-375.
[18]. Ding G, Zhang S, Khan S, et al. Feature Affinity based Pseudo Labeling
for Semi-supervised Person Re-identification. IEEE Transactions on Multimedia, 2019.
[19]. Ding S, Lin L, Wang G, et al. Deep feature learning with relative distance
comparison for person re-identification. Pattern Recognition, 2015, 48(10): 2993-3003.
[20]. Wen Y, Zhang K, Li Z, et al. A discriminative feature learning approach
for deep face recognition. European conference on computer vision. Springer, Cham, 2016: 499-515.
[21]. Cheng D, Gong Y, Zhou S, et al. Person re-identification by
multi-channel parts-based cnn with improved triplet loss function. Proceedings of the IEEE Conference on Computer Vision and Pattern
Recognition. 2016: 1335-1344.
[22]. Chen W, Chen X, Zhang J, et al. Beyond triplet loss: a deep quadruplet network for person re-identification. Proceedings of the IEEE Conference
on Computer Vision and Pattern Recognition. 2017: 403-412.
[23]. Xiao Q, Luo H, Zhang C. Margin sample mining loss: A deep learning
based method for person re-identification. arXiv preprint
arXiv:1710.00478, 2017.
[24]. Yu R, Dou Z, Bai S, et al. Hard-aware point-to-set deep metric for person re-identification. Proceedings of the European Conference on Computer
Vision. 2018: 188-204.
[25]. T Ali M F, Chaudhuri S. Maximum margin metric learning over discriminative nullspace for person re-identification. Proceedings of the
European Conference on Computer Vision. 2018: 122-138.
[26]. Ming Z, Chazalon J, Luqman M M, et al. Simple triplet loss based on intra/inter-class metric learning for face verification.2017 IEEE
International Conference on Computer Vision Workshops. IEEE, 2017:
1656-1664. [27]. He X, Zhou Y, Zhou Z, et al. Triplet-center loss for multi-view 3D object
retrieval. Proceedings of the IEEE Conference on Computer Vision and
Pattern Recognition. 2018: 1945-1954. [28]. C. Patruno, R. Marani, G. Cicirelli, E. Stella, and T. D'Orazio. People
re-identification using skeleton standard posture and color descriptors
from RGB-D data. Pattern Recognition, 2019, 89: 77-90. [29]. Y. Guo, G. Zhao, and M. PietikäInen. Discriminative features for texture
description. Pattern Recognition, 2012, 45(10): 3834-3843. [30]. Zhao C, Wang X, Wong W K, et al. Multiple metric learning based on
bar-shape descriptor for person re-identification. Pattern Recognition,
2017, 71: 218-234. [31]. Zhao C, Wang X, Miao D, et al. Maximal granularity structure and
generalized multi-view discriminant analysis for person re-identification.
Pattern Recognition, 2018, 79: 79-96. [32]. Zhao C, Wang X, Zuo W, et al. Similarity learning with joint transfer
constraints for person re-identification. Pattern Recognition, 2020, 97:
107014. [33]. Srivastava N, Hinton G, Krizhevsky A, et al. Dropout: a simple way to
prevent neural networks from overfitting. The Journal of Machine
Learning Research, 2014, 15(1): 1929-1958. [34]. Szegedy C, Vanhoucke V, Ioffe S, et al. Rethinking the inception
architecture for computer vision. Proceedings of the IEEE Conference on
Computer Vision and Pattern Recognition. 2016: 2818-2826.
[35]. Luo H, Gu Y, Liao X, et al. Bags of Tricks and A Strong Baseline for
Deep Person Re-identification. arXiv preprint arXiv:1903.07071, 2019.
[36]. Zheng L, Shen L, Tian L, et al. Scalable person re-identification: A benchmark. Proceedings of the IEEE International Conference on
Computer Vision. 2015: 1116-1124.
[37]. Zheng Z, Zheng L, Yang Y. Unlabeled samples generated by gan improve the person re-identification baseline in vitro. Proceedings of the IEEE
International Conference on Computer Vision. 2017: 3754-3762.
[38]. Ristani E, Solera F, Zou R, et al. Performance measures and a data set for multi-target, multi-camera tracking. European Conference on Computer
Vision. Springer, Cham, 2016: 17-35.
[39]. Reddi S J, Kale S, Kumar S. On the convergence of adam and beyond. arXiv preprint arXiv:1904.09237, 2019.
[40]. Liao S, Hu Y, Zhu X, et al. Person re-identification by local maximal
occurrence representation and metric learning. Proceedings of the IEEE Conference on Computer Vision and Pattern Recognition. 2015:
2197-2206.
[41]. Sun Y, Zheng L, Deng W, et al. Svdnet for pedestrian retrieval.
Proceedings of the IEEE International Conference on Computer Vision. 2017: 3800-3808.
[42]. Chang X, Hospedales T M, Xiang T. Multi-level factorisation net for
person re-identification. Proceedings of the IEEE Conference on Computer Vision and Pattern Recognition. 2018: 2109-2118.
[43]. Sun Y, Zheng L, Yang Y, et al. Beyond part models: Person retrieval with
refined part pooling (and a strong convolutional baseline). Proceedings of the European Conference on Computer Vision. 2018: 480-496.
[44]. Xiao T, Li S, Wang B, et al. Joint detection and identification feature
learning for person search. Proceedings of the IEEE Conference on Computer Vision and Pattern Recognition. 2017: 3415-3424.
[45]. Alex D, Sami Z, Banerjee S, et al. Cluster Loss for Person
Re-Identification. arXiv preprint arXiv:1812.10325, 2018. [46]. Chen Y, Zhu X, Gong S. Person re-identification by deep learning
multi-scale representations. Proceedings of the IEEE International
Conference on Computer Vision. 2017: 2590-2600. [47]. Yu Q, Chang X, Song Y Z, et al. The devil is in the middle: Exploiting
mid-level representations for cross-domain instance matching. arXiv
preprint arXiv:1711.08106, 2017.
[48]. Qi L, Huo J, Wang L, et al. Maskreid: A mask based deep ranking neural
network for person re-identification. arXiv preprint arXiv:1804.03864,
2018. [49]. Bai X, Yang M, Huang T, et al. Deep-person: Learning discriminative
deep features for person re-identification. arXiv preprint
arXiv:1711.10658, 2017. [50]. Zheng Y, Pal D K, Savvides M. Ring loss: Convex feature normalization
for face recognition. Proceedings of the IEEE Conference on Computer
Vision and Pattern Recognition. 2018: 5089-5097. [51]. Zhang X, Fang Z, Wen Y, et al. Range loss for deep face recognition with
long-tailed training data. Proceedings of the IEEE International
Conference on Computer Vision. 2017: 5409-5418. [52]. Wei L, Zhang S, Gao W, et al. Person transfer gan to bridge domain gap
for person re-identification. Proceedings of the IEEE Conference on
Computer Vision and Pattern Recognition. 2018: 79-88. [53]. Zhou K, Xiang T. Torchreid: A Library for Deep Learning Person
Re-Identification in Pytorch. arXiv preprint arXiv:1910.10093, 2019.
[54]. Zhao C, Chen K, Wei Z, et al. Multilevel triplet deep learning model for person re-identification. Pattern Recognition Letters, 2019, 117: 161-168.
Cairong Zhao is currently an
associate professor at Tongji
University. He received a PhD degree
from Nanjing University of Science
and Technology, an MSc degree from
Changchun Institute of Optics, Fine
Mechanics and Physics, Chinese
Academy of Sciences, and a BSc
degree from Jilin University, in 2011,
2006, and 2003, respectively. He is
the author of more than 30 scientific
papers in pattern recognition,
computer vision, and related areas. His research interests
include computer vision, pattern recognition, and visual
surveillance.
Authorized licensed use limited to: TONGJI UNIVERSITY. Downloaded on February 21,2020 at 03:54:28 UTC from IEEE Xplore. Restrictions apply.

1520-9210 (c) 2019 IEEE. Personal use is permitted, but republication/redistribution requires IEEE permission. See http://www.ieee.org/publications_standards/publications/rights/index.html for more information.
This article has been accepted for publication in a future issue of this journal, but has not been fully edited. Content may change prior to final publication. Citation information: DOI 10.1109/TMM.2020.2972125, IEEETransactions on Multimedia
> REPLACE THIS LINE WITH YOUR PAPER IDENTIFICATION NUMBER (DOUBLE-CLICK HERE TO EDIT) <
16
Xinbi Lv is currently a master
candidate at the College of
Electronics and Information
Engineering, Tongji University. His
research interests include computer
vision, deep learning, and person
search, in particular, focusing on
person re-identification and person
search for visual surveillance.
Zhang Zhang received the BSc
degree in Computer Science and
Technology from Hebei University of
Technology, Tianjin, China, in 2002,
and a PhD degree in Pattern
Recognition and Intelligent Systems
from the National Laboratory of
Pattern Recognition, Institute of
Automation, Chinese Academy of
Sciences, Beijing, China, in 2008.
Currently, he is an associate professor
at the National Laboratory of Pattern
Recognition, Institute of Automation, Chinese Academy of
Sciences. His research interests include human attribute
recognition, person re-identification, and activity recognition.
He has published a number of papers at top venues, including
the IEEE Transactions on Pattern Analysis and Machine
Intelligence, CVPR, and ECCV.
Wangmeng Zuo (M'09, SM'14)
received a PhD degree in Computer
Application Technology from the
Harbin Institute of Technology,
China in 2007. From 2004 to 2006,
he was a research assistant with the
Department of Computing, The Hong
Kong Polytechnic University. From
2009 to 2010, he was a visiting
professor with Microsoft Research
Asia. He is currently a professor with
the School of Computer Science and
Technology, Harbin Institute of Technology. He has published
over 90 papers in top-tier academic journals and conferences.
His current research interests include image enhancement and
restoration, image generation and editing, visual tracking,
object detection, and image classification. He served as a
Tutorial Organizer in ECCV 2016, he was an Associate Editor
of the IET Biometrics and the Guest Editor of Neurocomputing,
Pattern Recognition, IEEE Transactions on Circuits and
Systems for Video Technology, and IEEE Transactions on
Neural Networks and Learning Systems.
Jun Wu (M’05–SM’14) is a
professor with the Computer Science
and Technology Department, Tongji
University, Shanghai, China. He
received his BSc degree in
Information Engineering and MSc
degree in Communication and
Electronic Systems from XIDIAN
University in 1993 and 1996,
respectively. He received his PhD
degrees in Signal and Information
Processing from the Beijing
University of Posts and
Telecommunications in 1999. Wu joined Tongji University as a
professor in 2010. He was a Principal Scientist at Huawei and
Broadcom before he joined Tongji. His research interests
include Wireless Communication, Information Theory,
Machine Learning, and Signal Processing.
Duoqian Miao was born in 1964. He
is a professor and a PhD tutor at the
College of Electronics and
Information Engineering of Tongji
University, and he serves as Vice
President of the International Rough
Set Society (IRSS), Executive
Manager of the Chinese Association
for Artificial Intelligence (CAAI),
Chair of the CAAI Granular
Computing Knowledge Discovery
Technical Committee, a distinguished member of Chinese
Computer Federation (CCF), Vice President of the Shanghai
Computer Federation, and Vice President of the Shanghai
Association for Artificial Intelligence. He serves as Associate
Editor for the International Journal of Approximate Reasoning
and Editor of the Journal of Computer Research and
Development (in Chinese). His interests includes machine
learning, data mining, big data analysis, granular computing,
artificial intelligence, and text image processing. He has
published more than 200 papers in IEEE Transactions on
Cybernetics、 IEEE Transactions on Information Forensics and
Security、 IEEE Transactions on Knowledge and Data Mining、
IEEE Transactions on Fuzzy Systems、 Pattern Recognition、
Information Sciences、 Knowledge-Based Systems, Chinese
Journal of Computers, Journal of Software (in Chinese),
Journal of Computer Research and Development (in Chinese),
Automatica Sinica (in Chinese), and ACTA Electronica Sinica
(in Chinese). He won the second prize at Wuwenjun AI Science
and Technology (2018).
Authorized licensed use limited to: TONGJI UNIVERSITY. Downloaded on February 21,2020 at 03:54:28 UTC from IEEE Xplore. Restrictions apply.


![Motivation Knowledge Transfer Experiments · • Stanford-UAV dataset [28]: 21 video, 6 physical areas, 15 different scenes, multi-class (we use pedestrian and cyclist), 10 scene](https://img.dokumen.tips/doc/110x75/5fcc6292aefcbb5a1f01b867/motivation-knowledge-transfer-a-stanford-uav-dataset-28-21-video-6-physical.jpg)