Embed Size (px)
Citation preview

Decreases in bone mineral density at cortical and trabecular sites in the tibia and
femur during the first year of spinal cord injury
Sylvie Coupaud*1,2, Alan N. McLean2, Mariel Purcell2, Matthew H. Fraser2, David B. Allan2
Abstract
Background: Disuse osteoporosis occurs in response to long-term immobilisation. Spinal cord injury
(SCI) leads to a form of disuse osteoporosis that only affects the paralysed limbs. High rates of
bone resorption after injury are evident from decreases in bone mineral content (BMC), which in the
past have been attributed in the main to loss of trabecular bone in the epiphyses and cortical
thinning in the shaft through endocortical resorption.
Methods: Patients with motor-complete SCI recruited from the Queen Elizabeth National Spinal
Injuries Unit (Glasgow, UK) were scanned within 5 weeks of injury (Baseline) using peripheral
Quantitative Computed Tomography (pQCT). Unilateral scans of the tibia, femur and radius
provided separate estimates of trabecular and cortical bone parameters in the epiphyses and
diaphyses, respectively. Using repeat pQCT scans at 4, 8 and 12 months post-injury, changes in
bone mineral content (BMC), bone mineral density (BMD) and cross-sectional area (CSA) of the
bone were quantified.
Results: Twenty-six subjects (5 female, 21 male) with SCI (12 paraplegic, 14 tetraplegic), ranging
from 16 to 76 years old, were enrolled onto the study. Repeated-measures analyses showed a
significant effect of time since injury on key bone parameters at the epiphyses of the tibia and femur
(BMC, total BMD, trabecular BMD) and their diaphyses (BMC, cortical BMD, cortical CSA). There
was no significant effect of gender or age on key outcome measures, but there was a tendency for
the female subjects to experience greater decreases in cortical BMD. The decreases in cortical
BMD in the tibia and femur were found to be statistically significant in both men and women.
Conclusions: By carrying out repeat pQCT scans at four-monthly intervals, this study provides a
uniquely detailed description of the cortical bone changes that occur alongside trabecular bone
changes in the first year of complete SCI. Significant decreases in BMD were recorded in both the
cortical and trabecular bone compartments of the tibia and femur throughout the first year of injury.
This study provides evidence for the need for targeted early intervention to preserve bone mass
within this patient group.
Keywords: bone mineral density (BMD); cortical; osteoporosis; peripheral Quantitative Computed
Tomography (pQCT); spinal cord injury (SCI); trabecular
* Correspondence: Dr Sylvie Coupaud, Bioengineering Unit, Department of Biomedical Engineering, University of
Strathclyde, Glasgow G4 0NW, U.K. Email: [email protected]; 1. Department of Biomedical Engineering,
School of Engineering, University of Glasgow, Glasgow G12 8QQ; 2. Scottish Centre for Innovation in Spinal Cord Injury,
Queen Elizabeth National Spinal Injuries Unit, Southern General Hospital, Glasgow G51 4TF

Abbreviations: spinal cord injury (SCI), peripheral Quantitative Computed Tomography (pQCT), time
since injury (TSI)
1. Introduction
There has been mounting evidence of fragility fractures or “osteoporotic fractures” being more
common after spinal cord injury (SCI) than in the general population [1-3]. This is one of the long-
term health complications of SCI that remains to be resolved, since the establishment of SCI care
units has led to an increase in life expectancy in this patient group. The elevated fracture risk has
been attributed to the extensive paralysis of muscles of the lower limbs (in paraplegia) or of all four
limbs (in tetraplegia) leading to disuse osteoporosis below the level of injury [4,5]. Higher rates of
bone resorption, compared to bone formation, in the long bones cause an imbalance in bone
turnover in the early phases of SCI [6]. Bone resorption reaches up to ten times normal levels at
peak activity (at 10-16 weeks post-SCI), and the net bone loss eventually manifests itself through
densitometric imaging as a decrease in the bone mineral content (BMC) in the lower limbs [6,7].
Studies involving measurements of calcium excretion and activity levels of biochemical markers of
bone formation and resorption have provided valuable detailed descriptions of bone turnover activity
following immobilisation (e.g. SCI) or bedrest [6,8]. These biochemical studies have quantified
overall rates of bone loss accurately in the acute phases of SCI, much earlier than can be achieved
with bone densitometry. Some studies have identified gender effects, and variations in the rate of
bone turnover (between different age groups and/or in tetraplegia versus paraplegia) through the
use of blood and urine samples taken weekly in newly-injured patients. Maynard et al. (1986)
showed that young men with tetraplegia suffered from hypercalcemia more frequently than other
SCI subgroups [9]. Marked increases in bone resorption with only modest changes in bone
formation were recorded, with greater bone resorption in tetraplegia compared to paraplegia during
the first 6 months of SCI [6]. This may be explained by the greater extent of paralysis in tetraplegia,
affecting both the upper and lower limbs [4]. Higher levels of biochemical markers of bone
resorption would result from concurrent bone losses in the radius, ulna, and humerus, as well as in
the long bones of the legs (femur, tibia and fibula), compared to bone loss occurring only in the
latter in paraplegia.
One of the limitations of bone turnover studies is that the source of the measured bone loss is
difficult to localise, as the blood and urine samples represent cumulative bone turnover activity for

the whole body. To achieve some level of localisation of the bone loss, densitometry techniques
such as the clinical-standard dual energy X-ray absorptiometry (DXA) can be used to image
different sections of the body: forearm, spine, hip, and lower limb. Repeat DXA scans allow a gross
quantification of changes in BMC and projected areal bone mineral density (BMD) to highlight
differences between the healthy upper limbs and the paralysed lower limbs in paraplegia [10]. Even
so, the standard clinical DXA technique is inadequate for localising changes in the bone further. As
a two-dimensional imaging modality, it does not allow quantification of volumetric bone density in
the different bone compartments [11] and tends to underestimate bone loss in SCI [12].
A more appropriate densitometry technique is peripheral Quantitative Computed Tomography
(pQCT), which is volumetric and provides accurate and separate estimates of trabecular and
cortical bone parameters [11,13,14]. Data from a cross-sectional pQCT study describing the
differences in trabecular and cortical bone parameters in 99 subjects with SCI at different times
post-injury suggest that the shaft undergoes a thinning of the cortex rather than a decrease in
cortical BMD. Furthermore, cortical BMD values remain close to the lower limits of the normal range
even in chronic SCI [4]. Based on this dataset, the time course of cortical thinning appears to be
slower than the rapid fall in trabecular BMD described for the epiphyses of the long bones. Evidence
for cortical thinning after SCI, resulting from endocortical resorption, is provided by pQCT
measurements of periosteal circumference and endocortical circumference. The former remains
unchanged, but the latter appears to increase after SCI [4]. This pattern of cortical thinning and
trabecular bone loss is also seen in long periods of bedrest and spaceflight [15].
Sequential pQCT bone scans in newly injured patients would allow a more accurate description of
early changes in the different bone compartments in response to SCI, enabling the quantification of
any differences in patterns of change in cortical and trabecular bone. Maimoun (2011) summarises
our limited understanding of osteoporosis progression after SCI: “It is very difficult to clearly identify
the time needed to normalize bone remodelling post-injury because of the lack of long-term
longitudinal studies. Most data have been obtained from cross-sectional studies on heterogeneous
populations with several confounding factors” [16]. By carrying out repeat pQCT scans at four-
monthly intervals, in patients who have not undergone bone-loading interventions or bone-targeting
pharmacological treatments, this study provides a uniquely detailed description of cortical bone
changes that occur alongside trabecular bone changes in the first year of complete SCI.

2. Methods
2.1 Subject recruitment
Inpatients of the Queen Elizabeth National Spinal Injuries Unit (Southern General Hospital,
Glasgow, U.K.) with motor-complete SCI at neurological levels C4 and below were eligible to take
part. Twenty-nine subjects diagnosed with motor-complete SCI (grades A or B on the American
Spinal Injuries Association Impairment Scale (AIS) [17]) were recruited. Exclusion criteria were: (i)
age below 16 years, (ii) ventilator-dependency at 5 weeks post-injury, (iii) recent concurrent bilateral
fractures in bone(s) to be scanned (within the previous 10 years) (iv) inability to provide informed
consent, (v) previous diagnosis and/or pharmacological treatment for osteoporosis. Candidates who
agreed to take part in the study provided informed consent prior to participation. Ethical approval for
the study was obtained from the NHS Research Ethics Committee.
2.2 Scanning protocol
A single operator carried out all peripheral Quantitative Computed Tomography (pQCT) scans (XCT
3000, Stratec Medizintechnik, Pforzheim, Germany). Scans were carried out within 5 weeks post-
injury, and repeated at 4, 8 and 12 months post-injury. The dominant leg and contralateral arm were
scanned, unless the subject had experienced a recent fracture, in which case the opposite limb was
scanned. Bone length was measured using a tape measure, from the medial knee joint cleft to the
medial malleolus for the tibia and from the humero-radial joint cleft to the styloid process for the
radius. As an approximation, femur length was taken to be equal to the length of the tibia, as
described by Eser et al. 2004 [4]. Patients were transferred to a height-adjustable couch and
positioned with the leg lined up with the central axis of the scanner gantry, with the foot resting on a
support in a fixed position. The other leg rested on a custom-made limb support on the side. The
lower leg was scanned first, followed by the thigh. The patient was repositioned for the arm scan,
with the couch at 90 degrees to the scanner.
A quality control scan was carried out prior to each set of patient scans. Scout views were taken to
locate the standard reference positions for the distal tibia (endplate), the proximal tibia (medial
aspect of the tibial plateau), the distal femur (lateral condyle) and the distal radius (endplate). Scans
were performed unilaterally, (i) at two epiphyseal and two diaphyseal sites in the tibia (at 4%, 38%,
66% and 96%, relative to the distal end); (ii) at one epiphyseal and one diaphyseal site in the femur
(4%, 25% from the distal end); and (iii) at one epiphyseal and one diaphyseal site in the radius (4%,
66% from the distal end). Voxel size was set to 0.5mm for tibia and radius scans, and 0.3mm for

femur scans, in accordance with previous pQCT studies in SCI [4,5,18,19]. A higher resolution was
used for the distal femur due to the typically thin cortex at this site.
2.3 Image analysis
Scan image analyses were performed using the manufacturer‟s software (XCT550, Stratec
Medizintechnik, Pforzheim, Germany). The epiphyseal parameters calculated (at all 4% sites) were
BMC, total BMD, trabecular BMD, and total cross-sectional area (CSA). The diaphyseal parameters
calculated (at all other sites) were BMC, cortical BMD, total CSA and cortical bone CSA. In the
lower leg, diaphyseal BMC and bone CSA were calculated for the tibia and fibula combined, as the
fibula represents an important component of the weight-bearing structure in the healthy loaded limb.
To calculate the outcome measures at the standard 4% scan locations, the manufacturer‟s
guidelines were followed. A contour algorithm was used, with thresholds set at 180 mg/cm3 for the
distal tibia, and 150 mg/cm3 for the distal femur and radius. As described previously, a threshold of
130 mg/cm3 was used for the proximal tibia [20]. Imaging of the proximal tibia is less repeatable
than at other sites [21], and so is not imaged in many DXA or pQCT studies in SCI [22,5], but due to
its clinical relevance in this patient group, the proximal tibia scan site has been included in this and
other recent pQCT studies in SCI [23,20].
To calculate the trabecular BMD, a concentric peel was applied until the central 45% area of
trabecular bone remained. In cases where the concentric peel did not adequately delineate the
periosteal surface of the epiphysis (as determined by visual inspection), the algorithm was re-
applied with a lower threshold, reduced by 10 mg/cm3 increments until the peel was successful.
Similarly to bedrest studies in which thresholds for detection of the periosteal surface had to be
lowered, detection thresholds were kept constant for each time point for any individual subject,
although in some cases this threshold differed between subjects [21].
For diaphyseal sites (38% and 66% tibia, 25% femur and 66% radius), a contour algorithm was
selected to isolate cortical bone compartments for analysis, with a 710 mg/cm3 threshold to identify
cortical bone, and a 280 mg/cm3 threshold to identify the periosteal surface (according to the
manufacturer‟s guidelines). Cortical thickness in the diaphyses was estimated by assuming a
cylindrical geometry in the main shaft of the bone. Marrow area was calculated by subtracting
cortical bone cross sectional area (cortical CSA) from total bone cross sectional area (total CSA),
and by subtracting the marrow area from the whole bone area. The difference in radii between the
total bone and bone marrow was used as the estimate of cortical thickness. As cortical BMD
calculations are subject to partial volume effects, which are significant for cortical thicknesses below
1.6mm, cortical BMD values were to be excluded from further analysis if associated with a cortical
thickness <1.6mm [4].

2.4 Statistical analysis
Descriptive statistics were used to summarise patterns of change in key bone parameters. The
Shapiro-Wilk test was performed to assess Normality of the data. With the assumption of Normality
satisfied, parametric tests were performed to determine differences in bone parameters between
scan time-points, scan sites and SCI subgroups. Paired t-tests were used to compare the baseline
and the 12-month post-injury values for key bone parameters in both the lower and upper limb. 95%
confidence intervals (CI) for the differences in values between baseline and 12 months were
calculated (5% significance).
Mauchly‟s test of sphericity was performed prior to repeated-measures analysis, using a
Greenhouse-Geisser epsilon correction when the assumption of sphericity was not satisfied. To
investigate the possible effects of age and gender on the extent and time-course of key trabecular
and cortical bone parameter changes in the lower limbs, a repeated-measures generalised linear
model (GLM) was used. In the GLM, „time since injury‟ (TSI) was set as a four-level within-subjects
factor (levels: baseline, 4 months post-injury (PI), 8 months PI and 12 months PI), and „Age Group‟
and „Gender‟ as fixed between-subjects factors. Subjects were categorised into age groups: <25
years old (Age Group 1), 25-49 years old (Age Group 2), and 50 years or older (Age Group 3). For
the upper limb, changes in BMC, BMD and CSA in the radius were compared between the
paraplegic and tetraplegic subgroups to investigate possible between-subjects effect of level of
injury on upper-limb outcome measures. To minimise the potential Type II error effects of multiple
comparisons, post-hoc analyses (Bonferroni correction) were used where significant differences
between subgroups had been identified through the repeated-measures GLM analysis.
The statistical package SPSS (Version 19.0, IBM) was used for all statistical analyses.
3. Results
3.1 Subjects
Twenty-six subjects were enrolled on the study. Three additional candidates gave informed consent
but were unable to participate in the study due to medical complications during the acute phase of
injury, preventing the first scan from being performed within 5 weeks of injury (mean 1.01 +/- 0.16
months post-injury). The characteristics of the 26 subjects who underwent baseline scans are

provided in Table 1. Of the 26 subjects, 21 were male and 5 were female (4 peri- or post-
menopausal; 1 with a partial hysterectomy); mean age 38.7 (19.3) years old at the start of
participation; 12 had sustained a SCI leading to paraplegia, and 14 had a cervical SCI leading to
tetraplegia. Repeat scans were performed at 4.07 (0.17) months, 8.27 (0.53) months and 12.56
(0.99) months post-injury. Seven subjects scanned at baseline and 4 months post-injury did not
return for their 8 and/or 12-month scans, due to travel or health issues.
Subject
Gender
Age (years)
Neurological Level of SCI
Extent of paralysis
Height (cm)
Body mass (kg)
1 Male 49 C6 tetraplegia 162 100
2 Female 65 C6/7 tetraplegia 162 93
3 Male 44 T12 paraplegia 180 102
4 Male 17 C5 tetraplegia 185 71
5 Male 17 T3 paraplegia 170 50
6 Male 17 C4 tetraplegia 188 96
7 Male 67 C4/5 tetraplegia 170 88
8 Female 53 C6/7 tetraplegia 183 71
9 Male 27 C6/7 tetraplegia 175 82
10 Male 22 T12 paraplegia 183 57
11 Female 33 T9 paraplegia 170 53
12 Male 16 T6 paraplegia 178 79
13 Male 72 C4/5 tetraplegia 180 82
14 Male 29 T4 paraplegia 188 79
15 Male 47 T11 paraplegia 188 87
16 Male 37 L1 paraplegia 170 92
17 Male 21 T4 paraplegia 178 66
18 Female 52 C5 tetraplegia 170 81
19 Male 23 C5 tetraplegia 180 114
20 Male 19 T2 paraplegia 193 76
21 Male 47 C8/T1 tetraplegia 178 76
22 Male 47 C7 tetraplegia 175 81
23 Male 18 T9 paraplegia 185 102
24 Male 76 C6 tetraplegia 180 89
25 Male 25 C5 tetraplegia 180 63
26 Female 64 C5 tetraplegia 178 81
Table 1: Demographics and clinical characteristics of patients enrolled on the study. Height was self-reported, and body mass was as measured at end-of-study (or recorded at discharge, in cases where the patient was lost to follow-up).

3.2 Lower Limb
Missing data resulted from two scanning complications: (i) four sets of femoral shaft (25%) scans
not being performed because of insufficient hip abduction to achieve the required limb positioning
for the scan; and (ii) one 38% tibial shaft image, two 4% proximal tibia and four 25% femoral shaft
images being discarded due to excessive movement artefact from spasm.
The results of paired t-tests, based on data for subjects with complete 12-month datasets only
(ranging from n=19 in the distal epiphyses to n=14 in the femoral diaphysis) revealed that all key
parameters of trabecular and cortical bone in the tibia and femur decreased significantly from
Baseline to 12 months post-SCI (see Table 2). The decreases in BMC in the diaphyseal regions of
the tibia and femur are depicted in Figure 1. There is considerable inter-subject variability, but the
trends are apparent: the mean cortical BMC decreases between successive scan time-points.
Changes in cortical BMC were investigated further to determine the relative contributions of
changes in cortical BMD and cortical thickness to these changes in BMC (considering that BMC, in
g/cm, is a product of bone density and bone area). In both the tibia (38% & 66% sites) and the
femur (25%), clear and gradual decreases in cortical BMD are seen between successive scan time-
points whereas the changes in cortical thickness in the diaphyses in the first 12 months post-injury
are less pronounced, as can be seen in Figure 2.
Between-subjects analyses revealed no significant differences between male and female subjects,
between different age categories, or interactions between TSI and either Gender or Age Category,
for key epiphyseal and diaphyseal bone parameters of the lower limb. Overall, significant decreases
in cortical BMD occurred (as shown in Figure 2), with GLM analyses suggesting that these
decreases were more pronounced in female compared to male subjects. Gender differences in
cortical parameters would be expected (especially considering the menopausal status of 4 out of 5
of the female subjects) [24-26], but could not be confirmed statistically with this dataset due to the
small number of female participants.

BASELINE
12 months post-injury
Difference
95% confidence intervals
Sig. (2-tailed)
Scan site Parameter
n
Mean
SD
Mean
SD
Mean
Upper
Lower
p-value
Distal tibia 4% 19
BMC (g/cm2) 4.31 0.63 3.48 0.78 -0.82 -0.49 -1.16 <0.001
Total BMD (mg/cm3) 335.91 25.01 274.42 58.21 -61.49 -36.83 -86.16 <0.001
Trabecular BMD (mg/cm
3)
266.19 30.29 220.14 62.99 -46.06 -17.51 -74.61 0.003
Tibial shaft 38% 18
BMC (g/cm2) 4.28 0.54 4.13 0.56 -0.14 -0.10 -0.18 <0.001
Cortical CSA (mm2) 342.50 46.93 337.43 45.96 -5.07 -2.50 -7.65 0.001
Cortical BMD (mg/cm3) 1156.41 22.38 1127.66 25.01 -28.75 -18.45 -39.05 <0.001
Cortical thickness (mm) 5.80 0.65 5.70 0.64 -0.10 -0.05 -0.15 <0.001
Tibial shaft 66% 19
BMC (g/cm2) 4.74 0.56 4.54 0.56 -0.20 -0.12 -0.28 <0.001
Cortical CSA (mm2) 361.71 46.47 351.65 47.43 -10.07 -5.63 -14.50 <0.001
Cortical BMD (mg/cm3) 1103.13 27.35 1074.74 36.68 -28.39 -16.72 -40.06 <0.001
Cortical thickness (mm) 4.45 0.55 4.34 0.59 -0.12 -0.06 -0.18 0.001
Proximal tibia 96% 17
BMC (g/cm2) 7.39 1.29 5.67 1.16 -1.71 -1.16 -2.26 <0.001
Total BMD (mg/cm3) 251.16 32.94 185.23 43.47 -65.94 -45.78 -86.09 <0.001
Trabecular BMD (mg/cm
3)
175.34 39.13 136.50 37.96 -38.84 -18.51 -59.17 0.001
Distal femur 4% 19
BMC (g/cm2) 11.23 1.42 9.18 1.61 -2.05 -1.33 -2.76 <0.001
Total BMD (mg/cm3) 286.27 26.40 237.11 39.66 -49.16 -32.77 -65.54 <0.001
Trabecular BMD (mg/cm
3)
262.37 31.39 221.49 41.93 -40.88 -20.56 -61.21 0.001
Femoral shaft 25% 14
BMC (g/cm2) 4.82 0.53 4.39 0.61 -0.43 -0.24 -0.63 <0.001
Cortical CSA (mm2) 314.57 34.49 289.35 42.89 -25.22 -15.52 -34.93 <0.001
Cortical BMD (mg/cm3) 1104.49 31.57 1066.53 36.42 -37.95 -21.26 -54.64 <0.001
Cortical thickness (mm) 3.20 0.43 2.91 0.49 -0.30 -0.18 -0.41 <0.001
Table 2 – Descriptive statistics for lower limb bone parameters at all scan sites at Baseline and 12 months post-injury, and results from paired t-tests on the difference in the mean between the two time-points (12 months-Baseline), showing the 95% Confidence Intervals for these differences.
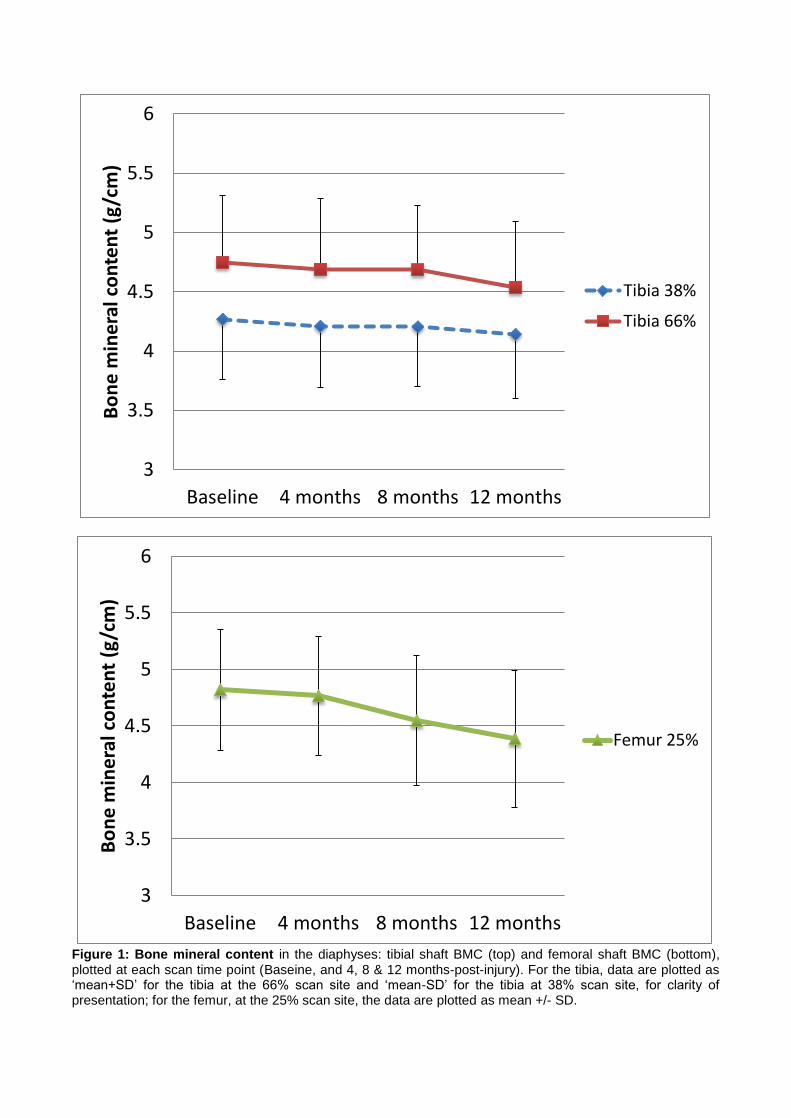
Figure 1: Bone mineral content in the diaphyses: tibial shaft BMC (top) and femoral shaft BMC (bottom), plotted at each scan time point (Baseine, and 4, 8 & 12 months-post-injury). For the tibia, data are plotted as „mean+SD‟ for the tibia at the 66% scan site and „mean-SD‟ for the tibia at 38% scan site, for clarity of presentation; for the femur, at the 25% scan site, the data are plotted as mean +/- SD.
3
3.5
4
4.5
5
5.5
6
Baseline 4 months 8 months 12 months
Bo
ne
min
era
l co
nte
nt
(g/c
m)
Tibia 38%
Tibia 66%
3
3.5
4
4.5
5
5.5
6
Baseline 4 months 8 months 12 months
Bo
ne
min
era
l co
nte
nt
(g/c
m)
Femur 25%

Figure 2: Changes in cortical bone in the diaphyses: cortical BMD (top) and cortical thickness (bottom) are plotted at each scan time point (Baseine, and 4, 8 & 12 months-post-injury) as mean +/- SD.
950
1000
1050
1100
1150
1200
Baseline 4 months 8 months 12 months
Co
rtic
al B
MD
(m
g/cm
3)
Tibia 38%
Tibia 66%
Femur 25%
0
1
2
3
4
5
6
7
Baseline 4 months 8 months 12 months
Co
rtic
al t
hic
kne
ss (
mm
)

For epiphyseal sites, within-subjects analyses (with simple contrasts) revealed a statistically-
significant effect of time since injury (TSI) on BMC, trabecular and total BMD in both the tibia and
femur (p-values: 0.002 to 0.043). For diaphyseal sites, a statistically-significant effect of TSI on key
parameters was also detected (for BMC, cortical BMD, cortical CSA).
3.3 Upper limb
For the upper limb pQCT investigation, seven sets of distal radius scans could not be performed at
baseline; the main issue was excessive pain in the shoulder and/or elbow, in tetraplegic patients
and one paraplegic patient. If the positioning for forearm scans could not be tolerated at baseline,
follow-up upper limb scans were not performed either, as there was no reference data to compare
to. In other subjects, the development of contractures of the elbow over the course of the first few
months post-injury prevented follow-up scans being carried out because the arm could no longer be
kept in the correct alignment for the radius scan set.
Descriptive statistics are provided for the distal radius at baseline and 12 months post-injury for the
paraplegia and tetraplegia subgroups separately (Table 3). Of the 12 subjects whose radius scans
at baseline and 12-month post-injury were included in the analysis, 3 had tetraplegia. Therefore, the
results of paired t-tests in Table 4 are shown for paraplegic subjects only (n=9).
BASELINE 12 months post-injury
PARAPLEGIA (9) TETRAPLEGIA (3) PARAPLEGIA (9) TETRAPLEGIA (3)
Distal RADIUS Mean SD Mean SD Mean SD Mean SD
BMC (g/cm2) 1.71 0.21 1.69 0.14 1.79 0.22 1.42 0.35
Total BMD (mg/cm
3)
359.78 25.18 364.35 4.62 354.86 36.11 310.41 79.28
Trabecular BMD (mg/cm
3)
232.99 17.05 248.13 9.03 240.01 23.66 224.87 52.64
Table 3 – Descriptive statistics for radius parameters at Baseline and 12 months post-injury, for paraplegic
subjects (n=9) and tetraplegic subjects (n=3), separately.
Difference between Baseline and 12 months
95% Confidence Intervals
Significance (2-tailed)
Distal RADIUS Mean SD Lower Upper p-value
BMC (g/cm2) 0.08 0.10 -0.15 0.00 0.053
Total BMD (mg/cm
3)
-4.92 29.43 -17.70 27.54 0.630
Trabecular BMD (mg/cm
3)
7.02 17.46 -20.45 6.40 0.262
Table 4 – Results from paired t-tests for paraplegic subjects only (n=9) for radius parameters, on the difference in the mean between the two time-points (Baseline and 12 months post-injury), and the 95% Confidence Intervals calculated for these differences.

In the forearm, differences in radius bone parameters would be expected between tetraplegic and
paraplegic subjects, with the former potentially losing bone in the radius due to paralysis of the arms
[4]. Paraplegic subjects show a tendency for higher trabecular BMD and BMC at the distal radius at
12 months post-injury, when compared to baseline.
4. Discussion
The data from this longitudinal study provide a uniquely detailed densitometry-based description of
changes in trabecular and cortical bone during the first year post-SCI. A focus on this early phase
of SCI is clinically-relevant because it represents a time window within which it is feasible to
intervene (pharmacologically and/or physically) in order to manage and ultimately attenuate
osteoporosis progression [27]. Potentially, early intervention could achieve a reduction in future
fracture risk in this patient group, considering that the majority of fractures typically occur two years
or more post-injury [28].
Clinically, the accurate localisation and quantification of different rates of bone loss is of particular
interest when considering common fracture locations after SCI. As in other studies, our data show
that the bone loss is confined to the paralysed limbs, with the upper limbs showing increases
instead of decreases in BMD and BMC [4]. The increase in bone parameters in the radius of
paraplegic subjects is attributable to greater use of the upper limbs during rehabilitation and for
mobility post-injury, as patients with paraplegia become full-time, self-propelling wheelchair users.
In contrast to fracture-studies in postmenopausal women, previously weight-bearing parts of the
skeleton, and especially the epiphyses of the tibia and femur, have been a focal point of many SCI
fracture studies, as these predominantly trabecular regions of the long bones of the legs coincide
with typical sites of fracture in chronic SCI [5]. Our data confirm significant early decreases in
trabecular BMD and epiphyseal BMC at these sites. In this longitudinal investigation, the proximal
tibia showed the most extensive bone loss of all the sites measured, coinciding with one of the most
common fracture sites in chronic SCI. Due to the lower repeatability of pQCT measurements at this
site compared to the distal tibia and femur [21], few densitometry studies include proximal tibia
epiphyseal measurements. This is due to the lack of standardisation for its measurement, irregular
shape, and its sensitivity to accurate re-positioning in the scanner compared to other scan sites [22].
However, as a fracture-prone site in SCI, it is of clinical interest to measure bone loss in the
proximal tibia region.

The diaphyses of the tibia and femur are considered less prone to fracture than the epiphyses after
SCI [3], and consequently have received less attention in studies suggesting pQCT-derived fracture
BMD thresholds for this patient group [5]. Cross-sectional or longitudinal data with long follow-up
scan times (of years rather than months) are perhaps misleading, as they would suggest that
changes in cortical BMD in the diaphyses are either negligible or occur at slower rates, when
compared to changes in trabecular bone in the epiphyses [4,18]. This phenomenon is often
explained in the literature by the fact that there is a smaller surface area to volume ratio available for
bone turnover activity compared to the trabecular networks in the epiphyses [21].
There has been growing interest in the effects of simulated microgravity on cortical bone, with
evidence from bedrest studies showing that significant changes occur early in cortical bone
compartments, within weeks of subjects being confined to bedrest [21,30]. Comparisons of the
findings of bedrest studies with those of this longitudinal study in the early phases of SCI are valid,
but limited due to important differences in study design. In addition to physiological differences
between simulated microgravity and trauma-induced SCI, subjects on bedrest studies tend to be
chosen within strict age and body mass index ranges, and are otherwise healthy and physically fit.
In contrast, subjects with SCI in this longitudinal study ranged from teenagers to the frail elderly,
and included both men and women, with a range of heights and body weights. These factors could
not be controlled easily in the study design, but could have contributed to inter-subject variability in
rates of bone loss. In addition, the possibility of genetic influences could not be ruled out, and may
be a common factor explaining significant inter-individual variability in rates of bone loss recorded in
astronauts and cosmonauts on long-term space missions [29] and those in this longitudinal study in
SCI patients.
In agreement with recent studies using pQCT to analyse both trabecular and cortical bone changes
in the case of simulated microgravity [21,30], our pQCT investigation provides evidence that
significant changes in cortical bone parameters, including cortical BMD, occur in parallel with those
in trabecular bone in the tibia and femur in the first 12 months after SCI. When described as
percentage changes, the decreases in cortical BMD over the course of the first year may appear
small (at 2.5% in the tibial shaft and 3% in the femoral shaft on average), especially in comparison
with the percentage changes recorded in trabecular BMD (mean decreases of 20% in the tibial
epiphyses and 15% at the distal femur). The absolute decreases recorded in our study in cortical
BMD (a mean of 28 mg/cm3 in the tibial shaft and of 38 mg/cm3 in the femoral shaft within the first
year) are comparable with those of trabecular BMD (a mean decrease of 42 mg/cm3 in the tibial
epiphyses and of 40 mg/cm3 in the distal femur). As with the decreases in trabecular BMD,
decreases in cortical BMD are significant, and show a gradual decline between each successive
scan time-point. Cortical bone makes up about 80% by volume of the peripheral skeleton [31] and

so 2-3% decreases in cortical BMD per year represents significant contribution to the total decrease
in BMC per year from SCI-induced disuse.
The importance of these early changes in cortical BMD is perhaps masked by the outcome that,
despite the significant decreases in cortical BMD recorded within the first year after SCI, the
absolute cortical BMD values remain within the normal physiological range for healthy adults. This is
in agreement with the literature [4,18], with the mean cortical BMD in our study ranging from 1066
mg/cm3 in the femoral shaft to 1127 mg/cm3 at the 38% distal shaft site by 12 months post-SCI.
Nevertheless, our longitudinal data clearly show that the decreases in cortical BMD contribute to the
decreases in BMC in the shaft of the tibia and femur to a greater extent than the decreases in
cortical CSA or cortical thickness. This is in contrast to claims from previous studies that suggest
that cortical thinning through endocortical resorption, rather than from a decrease in cortical BMD,
explains the decrease in BMC and weakening of the shaft of the long bones after SCI.
A number of study limitations are noted. Firstly, the small sample size, with a study cohort of SCI
subjects that included both men and women of a range of ages (16-76 years), limited the extent to
which factors affecting rates of bone loss in this population could be investigated. Ideally, a larger
study would be designed, with sufficient power to assess potential modulators of rates of bone loss
after SCI. These potential modulators include ageing, gender, nutrition, changes in body weight,
different levels of bone loading prior to injury, and changes in hormone levels. Another limitation of
the study is that there may have been some undetected bone loss prior to the baseline scan. The
earliest scans were performed for one subject at 22 days and another at 23 days, but typically for
other subjects at one month post-injury. However, the bone losses prior to this are likely to have
been relatively small, and, importantly, BMD was in the normal range for all subjects at baseline.
Considering that patients were still typically very unwell during the first few weeks following their
traumatic SCI, there were practical constraints to performing the baseline pQCT scans any earlier
than 30 days post-injury in this patient group.
Without continuing to monitor bone parameters further, the data presented here cannot be used to
challenge the hypothesis that any changes in cortical BMD recorded in the first year post-SCI could
be transient. In order to determine whether this decrease in cortical BMD progresses until the bone
parameters stabilise and a „steady-state‟ is reached, or whether it is transient during the early
phases of bone adaptation (including the period of observation in this study), the longitudinal
observation period would need to be extended beyond one year post-SCI. Relevant pQCT studies
in chronic SCI support the theory that the changes in cortical BMD are likely to be transient [4,18].
No other study in this patient group has achieved all three of the following aims: (i) describing early
changes in trabecular and cortical bone in the long-bones separately, using pQCT, (ii) repeating

scans at regular time-intervals within the first year of injury, and (iii) focusing on the homogeneous
group of motor-complete SCI patients only. This study is unique in having achieved all three aims
simultaneously. As an extension of this work, the longer-term aim would be to recruit more subjects
onto this longitudinal investigation and extend the observation period until there is conclusive
evidence that the steady-state has been reached in each patient.
5. Conclusions
Our findings challenge those of a number of published studies suggesting that significant bone loss
in the early stages of SCI occurs predominantly at epiphyseal sites of previously weight-bearing
bones, and that changes in the cortical bone are slower and less pronounced. Most studies
describing the time course and patterns of bone loss after SCI through longitudinal investigations
have either focused on the acute responses within weeks of injury, or long-term adaptation to
disuse, two or more years post-SCI. In contrast, this paper presents uniquely detailed longitudinal
data with adequate temporal and spatial resolution to describe the time course of diaphyseal bone
loss in patients with motor-complete SCI during the first year of injury. In this study, significant
changes in cortical bone clearly occurred alongside those in epiphyseal bone, and were manifested
as decreases in cortical BMD as well as cortical CSA. Our data show that decreases in cortical
BMD contributed to the significant decreases in BMC in the bone shaft to a greater extent than
changes in cortical thickness in the first year of SCI.
Acknowledgements
We thank all the participants in this study, and clinical and research colleagues for their help during
scanning sessions. We gratefully acknowledge the funding support of the Glasgow Research
Partnership in Engineering for this work.
Conflicts of Interest
The authors have no conflicts of interest to declare.

References
[1] Comarr AE, Hutchinson RH, Bors E. Extremity fractures of patients with spinal cord injuries. Am J
Surgery 1962, 103(6): 732–739.
[2] Vestergaard P, Krogh K, Reijnmark L, Mosekilde L. Fracture rates and risk factors for fractures in
patients with spinal cord injury. Spinal Cord 1998; 36: 790-796.
[3] Lazo MG, Shirazi P, Sam M, Giobbie-Hurder A, Blacconiere MJ, Muppidi M. Osteoporosis and risk of
fracture in men with spinal cord injury. Spinal Cord 2001; 39: 208-214.
[4] Eser P, Frotzler A, Zehnder Y, Wick L, Knecht H, Denoth J, et al. Relationship between the duration of
paralysis and bone structure: a pQCT study of spinal cord injured individuals. Bone 2004; 34(5): 869–
880.
[5] Eser P, Frotzler A, Zehnder Y, Denoth J, Fracture threshold in the femur and tibia of people with spinal
cord injury as determined by peripheral quantitative computed tomography. Arch Phys Med Rehabil
2005; 86(3): 498–504.
[6] Roberts D, Lee W, Cuneo RC, Wittmann CJ, Ward G, Flatman R, McWhinney B, Hickman PE.
Longitudinal study of bone turnover after acute spinal cord injury. J Clin Endocrin Metabol 1998; 83: 415-
422.
[7] Wilmet E, Ismail AA, Heilporn A, Welraeds D, Bergmann P. Longitudinal study of the bone mineral
content and of soft tissue composition after spinal cord section. Paraplegia 1995; 33: 674-677.
[8] Baecker N, Tomic A, Mika C, Gotzmann A, Platen P, Gerzer R, Heer M. Bone resorption is induced on
the second day of bed rest: results of a controlled crossover trial. J Appl Physiol 2003; 95: 977–982.
[9] Maynard FM, Immobilization hypercalcemia following spinal cord injury. Arch Phys Med Rehabil 1986;
67(1): 41-44.
[10] Sievanen H, Kannus P, Nieminen V, Heinonen A, Oja P, Vuori I. Estimation of various mechanical
characteristics of human bones using dual energy X-ray absorptiometry: methodology & precision. Bone
1996; 18 (S1): 17S-27S.
[11] Bolotin HH. Inaccuracies inherent in Dual-energy X-ray Absorptiometry in vivo bone mineral densitometry
may flaw osteopenic/osteoporotic interpretations and mislead assessment of antiresorptive therapy
effectiveness. Bone 2001; 28(5): 548-555.
[12] Bauman WA, Kirshblum S, Cirnigliaro C, Forrest GF, Spungen AM. Underestimation of bone loss of the
spine with posterior-anterior Dual-Energy X-Ray Absorptiometry in patients with Spinal Cord Injury. J
Spinal Cord Med 2010; 33(3): 214-220.
[13] Muller A, Ruesegger E and Ruesesseger P. Peripheral QCT: a low-risk procedure to identify women
predisposed to osteoporosis. Phys Med Biol 1989; 34(6): 741-749.
[14] Augat P, Gordon CL, Lang TF, Iida H, Genant HK. Accuracy of cortical and trabecular bone
measurements with peripheral quantitative computed tomography pQCT. Phys Med Biol. 1998; 43:
2873– 2883.
[15] Sievanen H. Immobilisation and bone structure in humans. Arch Biochem Biophys 2010; 503: 146-152.

[16] Maimoun L, Fattal C, Micallef J-P, Peruchon E, Rabischong P. Bone loss in spinal cord-injured patients:
from pathophysiology to therapy. Spinal Cord 2006; 44: 203-210.
[17] Maynard FM, Bracken MB, Creasey G, (Jr) JFD, Donovan WH, Ducker TB, et al. International Standards
for Neurological and Functional Classification of Spinal Cord Injury. Spinal Cord 1997; 35: 266–274.
[18] Frotzler A, Berger M, Knecht H, Eser P. Bone steady-state is established at reduced bone strength after
spinal cord injury: a longitudinal study using peripheral Quantitative Computed Tomography (pQCT).
Bone 2008; 43: 549-555.
[19] Coupaud S, McLean AN, Allan DB. Role of peripheral quantitative computed tomography in identifying
disuse osteoporosis in paraplegia. Skeletal Radiol 2009; 38(10): 989-995.
[20] Coupaud S, McLean AN, Lloyd S, Allan DB. Predicting patient-specific rates of bone loss at fracture-
prone sites after spinal cord injury. Disability & Rehabil 2012; 26(34): 2242-2250.
[21] Rittweger J, Simunic B, Bilancio G, de Santo NG, Cirillo M, Biolo G, Pisot R, Eiken O, Mekjavic IB, Narici
M. Bone loss in the lower leg during 35 days of bed rest is predominantly from the cortical compartment.
Bone 2009; 44: 612-618.
[22] Morse LR, Lazzari AA, Battaglino R, Stolzmann KL, Matthess KR, Gagnon DF, Davis SA, Garshick E.
Dual Energy X-Ray Absorptiometry of the distal femur may be more reliable than the proximal tibia in
spinal cord injury. Arch Phys Med Rehabil 2009; 90(5): 827-831.
[23] Dudley-Javaroski S and Shields RK. Regional cortical and trabecular bone loss after spinal cord injury. J
Rehab Res Dev 2012; 49(9): 1365-1376.
[24] Ferretti JL, Cointry GR, Capozza RF, Frost HM. Bone mass, bone strength, muscle-bone interactions,
osteopenias and osteoporosis. Mechanisms Ageing Dev 2003; 269-279.
[25] Capozza RF, Feldman S, Mortarino P, Reina PS, Schiessl H, Rittweger J, Ferretti JL, Cointry R.
Structural analysis of the human tibia by tomographic (pQCT) serial scans. J Anat, 2010; 216(4): 470-81.
[26] Lauretani F, Bandinelli S, Griswold ME, Maggio M, Semba R, Guralnik JM, Ferrucci L. Longitudinal
changes in BMD and bone geometry in a population-based study. J Bone Mineral Research 2008; 23(3):
400-408.
[27] Maimoun L, Fattal C, Sultan C. Bone remodelling and calcium homeostasis in patients with spinal cord
injury: a review. Metabol Clin Exp 2011; 60: 1655-1663.
[28] Gifre L, Vidal J, Carrasco J, Portell E, Puig J, Monegal A, Guanabens N, Peris P. Incidence of skeletal
fractures after traumatic spinal cord injury: a 10-year follow-up study. Clinical Rehabil 2014; 28(4): 361-
369.
[29] Vico L, Collet P, Guignandon A, Lafage-Proust M-H, Thomas T, Rehailia M, Alexandre C. Effects of long-
term microgravity exposure on cancellous and cortical weight-bearing bones of cosmonauts. The Lancet
2000; 355: 1607-1611.
[30] Cervinka T, Sievanen H, Hyttinen J, Rittweger J. Bone loss patterns in cortical, subcortical, and
trabecular compartments during simulated microgravity. J Appl Physiol 2014; 117: 80-88.
[31] Zebaze RM, Ghasem-Zadeh A, Bohte A, Iuliano-Burns S, Mirams M, Price RI, Mackie EJ, Seeman E.
Intracortical remodelling and porosity in the distal radius and post-mortem femurs of women: a cross-
sectional study. The Lancet 2010; 375: 1729-1736.