Embed Size (px)
Citation preview

- i -
Decoding and graphical
display of aviation weather maps
Tom English
BSc Computing
Session 2006/2007
The candidate confirms that the work submitted is their own and the appropriate
credit has been given where reference has been made to the work of others.
I understand that failure to attribute material which is obtained from another source
may be considered as plagiarism.
(Signature of student) _________________________
- ii -
Summary
METARs are weather reports accurate for use with aviation. Pilots notoriously find
these coded reports difficult to handle and visualise.
This project looks at different ways of displaying and understanding this information
and then suggests a solution that can help pilots to visualise the weather information in a
given geographical context.
- iii -
Contents
1 Project Background …………………………………………………….. 1
1.1 What is the problem ………………………………………………. 1
1.2 What is a METAR ………………………………………………... 2
1.3 Proposed solution ………………………………………………… 2
1.4 Current solutions …………………………………………………. 3
1.5 Objectives, minimum requirements and extensions ……………… 5
1.5.1 Objectives …………………………………………………... 5
1.5.2 Minimum requirements …………………………………….. 5
1.5.3 Deliverables ..……………………………………………….. 5
1.5.4 Enhancements ………………………………………………. 6
2 Background reading ……………………………………………………. 7
2.1 How pilots use the METAR ……………………………………… 7
2.2 Methodologies ……………………………………………………. 8
2.2.1 METAR decoding ………………………………………….. 8
2.2.2 Gathering of station information …………………………… 10
2.2.3 Design Methodology ……………………………………….. 11
2.2.3.1 Waterfall method …………………………………. 11
2.2.3.2 Agile methodology ……………………………….. 12
2.2.3.3 Chosen methodology ……………………………… 12
2.3 Graphical representations …………………………………………. 13
2.3.1 Depth of representation ……………………………………… 13
2.3.2 Choice of appropriate symbols ……………………………… 14
2.4 Appropriate technologies …………………………………………. 14
2.4.1 Visualisation choice ………………………………………… 15
2.4.2 Coding language choice ……………………………………. 16
3 Design and Implementation …………………………………………… 17
3.1 Schedule for design and implementation ………………………… 17
3.2 Java class design …………………………………………………. 17
3.3 METAR decoding algorithm …………………………………….. 19
3.4 KML generation algorithm ………………………………………. 21

- iv -
3.5 Symbol design …………………………………………………… 24
3.6 Interface design ………………………………………………….. 26
3.6.1 Command line interface …………………………………… 26
3.6.2 Graphical based interface …………………………………. 27
3.7 Changes to the design …………………………………………… 30
4 Evaluation ………………………………………………………………. 32
4.1 Code testing ……………………………………………………… 32
4.2 User evaluation ………………………………………………….. 33
4.2.1 Interface testing …………………………………………… 34
4.2.2 Representation testing ……………………………………… 35
4.2.3 Observations ……………………………………………….. 36
4.3 Development methodology ………………………………………. 37
4.3.1 Effectiveness ……………………………………………….. 37
4.3.2 Schedule ……………………………………………………. 38
4.4 Minimum requirements and extensions ……………….................. 38
4.5 Further extensions ……………………………………………….. 39
References ……………………………………………………………………….. 40
A Project reflection ………………………………………………………… 42

- 1 -
Chapter 1.
Project Background
1.1 What is the problem?
The way in which pilots receive weather information is a coded text string called
METAR. A METAR is an hourly updated observation of the weather at a reporting
station at or near an airport. Decoding of this information is challenging for new student
pilots, and even some experienced ones find it difficult. What is even more of a problem
is that it is very hard to visualise the textual METAR geographically. This can lead to
problems with operating an aircraft in difficult weather and so it would be better if there
was a way to display this information graphically. By graphically displaying the
weather information the pilot will be able to easily see where the wind is blowing from
and how strong, how high and how thick the cloud coverage is. The pilot can also get
information about the temperature and the visibility available. All of this information
placed over geographical information will increase the pilots situation awareness so that
they will be better prepared for the flight and in case of emergencies they will be aware
of which airport runways are suitable for use.
A greater understanding of the weather is extremely valuable as many accidents and
damage to aircraft happens when pilots are not fully briefed about the weather in which
they are operating their flights.

- 2 -
1.2 What is METAR?
METAR stands for Meteorological Aviation Report. It is a world wide standard code
that is also called FM 15-IX. The METAR code is a precise, formatted code which
provides a great deal of information. The code format is also used by most of the world
to provide pilots with trend forecast weather at air terminals to which they are flying.
This code has been adopted as the international code for reporting weather conditions
by all nations. This ensures that it is universally understandable for all languages
although all pilots use English while communicating to air traffic control.
A METAR is a coded representation of the current weather that is manually or
automatically generated by the reporting station. Reporting stations are generally
situated at airports but are also found at areas where there would be little coverage due
to the lack of an airport or areas where the weather fluctuations warrant a constant
observation.
Here is a sample of METAR code.
EGLL 261950Z 17011KT 9999 SCT017 BKN021 12/10 Q1013
The first 4 letters of METAR are always the station identifier. In this case the station is
EGLL which is London Heathrow.
Some METAR representations can be shorter and others can be much longer. Obviously
the length depends on the amount of weather information that the station needs to
report, so where the weather conditions are complex the code can become very long.
1.3 Proposed solution.
The solution that I propose to this problem is that a program should be used to decode
the METAR information for a reporting station. This decoded information should then
be used to select symbols for the representation of the weather. It will also be useful to
keep the decoded weather in plain English so that the pilots can simply read the

- 3 -
information if the representation isn’t able to display all of the weather systems. The
plain English can also be used to help the pilot understand the symbols used if their
meaning isn’t immediately obvious. All of this information needs to be overlaid on a
map of the area in question so that the weather situation can be better understood. A
greater understanding of the weather will be gained by the pilot if they are able to see
the lay of the land and so visualise the directions of weather systems and the hazards
that they represent.
1.4 Current solutions.
As far as I am aware there are no solutions for the graphical representation of METAR
reports. There are a few systems that can take a METAR and decode it into plain
English but these do not give geographical context and so are not any easier for the pilot
to picture the weather situation in which they will be flying.
One such textual solution is found online [11] and is by Manuel Heras. On his website
there is a simple applet that can take a METAR and decode it. This solution only
decodes the international standard of METAR codes and will not work with U.S. codes.
This solution only gives a textual description of the weather and after some
experimentation I have also discovered that it doesn’t decode all of the weather
conditions supplied to it. This solution is helpful to pilots flying outside of the U.S. only
and doesn’t give all of the detail required to make the tool good enough for a pilot’s
general use.

- 4 -
Another example is a MetarWeather v1.50 - METAR decoder software by Nir Sofer
[12]. This is a much more elegant solution than the example by Manual Heras [11] and
decodes all of the weather information within the system. It again only provides an
output in a textual form. It does however provide one symbol to show the prevailing
weather an example of which is in figure 1.1 below.
Figure 1.1. MetarWeather v1.50 by Nir Sofer [12]
Both of these solutions provide only a textual representation which in itself is useful to
an inexperienced pilot who cannot decode all of the METAR codes yet but it does
however not show any information that gives the weather context. By this I mean that if
the wind is blowing at 10 knots at 110 degrees does this mean that it is blowing across
the runway or down it? If the pilot cannot remember the direction and position of the
airport then this weather information has very little context.
This is a demonstration of the problem which the pilot will face in decoding and
visualising the weather within the context of the surrounding terrain and facilities in
which they will be flying.

- 5 -
1.5 Objectives, minimum requirements and extensions.
1.5.1 Objectives.
• To represent graphically the METAR weather information provided for pilots so
that they can better understand the weather for aerodromes that they will be
using.
• The representation must also include the METAR information as is supplied so
that pilots can compare the results and the code and therefore learn the METAR.
• The representation must be able to represent more than one aerodrome at a time.
Specifically the departure, destination and alternate aerodromes.
• The graphical representation must be as self explanatory as possible so that the
learning time required to use the system is minimised. This may be achieved by
using standard symbols found using other weather representation systems.
1.5.2 Minimum Requirements.
• Download/decode METAR weather data from the server.
• Convert the data to a visual representation.
• Overlay the data on a geographical chart.
1.5.3 Deliverables.
• Software to download the METAR weather data, decode it and arrange it for use
in with geographical data. The Software must also overlay aerodrome charts
with geographical data.
• The end of project report.

- 6 -
1.5.4 Enhancements.
• The ability for the program to show aeronautical facility charts with the weather
information.
• The ability for the program to print out graphical weather information.
• A graphical front end for the program.

- 7 -
Chapter 2.
Background Reading
First this section shows how the pilot would use a METAR currently and demonstrates
how this can be difficult for a student pilot. The section then looks at the methods for
decoding a METAR. The section then evaluates different design methodologies that can
be used for the design of the solution. After this the section evaluates different options
for the representation of the decoded METAR and evaluates them. Finally appropriate
technologies are contemplated together with the coding language that will be used.
2.1 How pilots use the METAR.
Before a pilot embarks on a flight they have to do lots of planning. One such part of this
planning process is taking a detailed look at the weather which the aircraft will
encounter to make sure that it is within the operational restrictions for safe flight and
that if it isn’t then it can be avoided. The pilot considers the weather at the departure and
destination airports along with any airport near the planned route so that in the event of
an emergency the pilot knows which airports are available for them to use.
METAR report information is useful in so many ways. It can tell a pilot if the runway
they intend to use is pointing into the wind or not. It also gives visibility information so
the pilot can plan to miss any traffic by making sure they know how far their vision is
limited. The METAR also gives the temperature of the air which is very important to jet
aircraft as the temperature can dramatically change the effectiveness of their engines.
Obviously if the temperature is low then the pilot also has to consider the danger of ice
building up on the engines and wings. If there is rain at an airport the pilot will need to
- 8 -
know how heavy it is as if the runway is very wet then there is a danger that the aircraft
can skid on landing. A wet runway will also reduce the effectiveness of brakes due to
reduced grip. This is especially important when landing with a heavy aircraft as there
may be little runway to stop the aircraft. There are also limits on the amount of water an
engine can ingest without stopping. If there is mist how badly does it prevent visibility
and if it is cold is there a chance of freezing mist building up on the aircraft.
2.2 Methodologies
The choice of methodologies is very important for the design of the solution.
Appropriate methodologies need to be sought as they can ease or hinder the
development of the solution.
2.2.1 METAR decoding
To decode a METAR it is first downloaded. The source for METAR weather
information is the NOAA [1] (National Oceanic and Atmospheric Administration) in
the U.S. The METAR information is freely available and can be downloaded within a
text file through HTTP. This information comes in the following form and is available
from there website [4] of which below is an example.
2006/11/26 19:50
EGLL 261950Z 17011KT 9999 SCT017 BKN021 12/10 Q1013
The first line is simply the date and time at which the NOAA received the METAR
from the reporting station. The second line is the METAR itself.
As the METAR line contains the time and date in a coded form there is no need for the
first line to be stored.
The METAR codes and there meaning were found at the Texas A&M University
department for atmospheric sciences website [2]. It contains all of the codes and also
lists the differences between the code used worldwide and the code used in the U.S.

- 9 -
This is important as the U.S. METAR reporting stations use a slightly different format
and code set that needs to be catered for in the solution.
To decode a METAR the line is broken up into smaller parts. The first two parts show
the stations identifier which in turn can be used to show where it is and the second part
shows the time and day of the month in which the report was made.
The next part of the METAR contains the weather information from the reporting
station. This is always shown with the wind first and then visibility. Following that the
present weather group is coded such as “RA” rain or “SN” snow. There are also
quantifiers such as “+RA” for heavy rain and “-RA” for light rain. The absence of a
quantifier shows moderate conditions.
The next part of the METAR shows the sky condition group. This is what the cloud
cover is. It is used to show the different cloud cover layers and their heights. If there is
no cloud then there will only be one code which is “CLR” meaning clear.
After the sky condition group is the temperature group. This is the air temperature and
dew point. The dew point is the temperature that the air needs to be to produce dew or
water. If the dew point is close to or lower than the temperature then there is a high risk
of ice build up on the aircraft. “10/08” is the way in which this information is displayed.
To demonstrate a negative number a M is placed before the number to show minus. A
minus sign – cannot be used as this is a quantifier for light which is not applicable for
temperature.
The final part of the METAR report is the pressure group. This is simply the barometric
pressure so that the pilots can set there altimeters to the local setting ensuring that all
aircraft keep separated by the correct height. “29.24” is an example of a barometric
pressure.
- 10 -
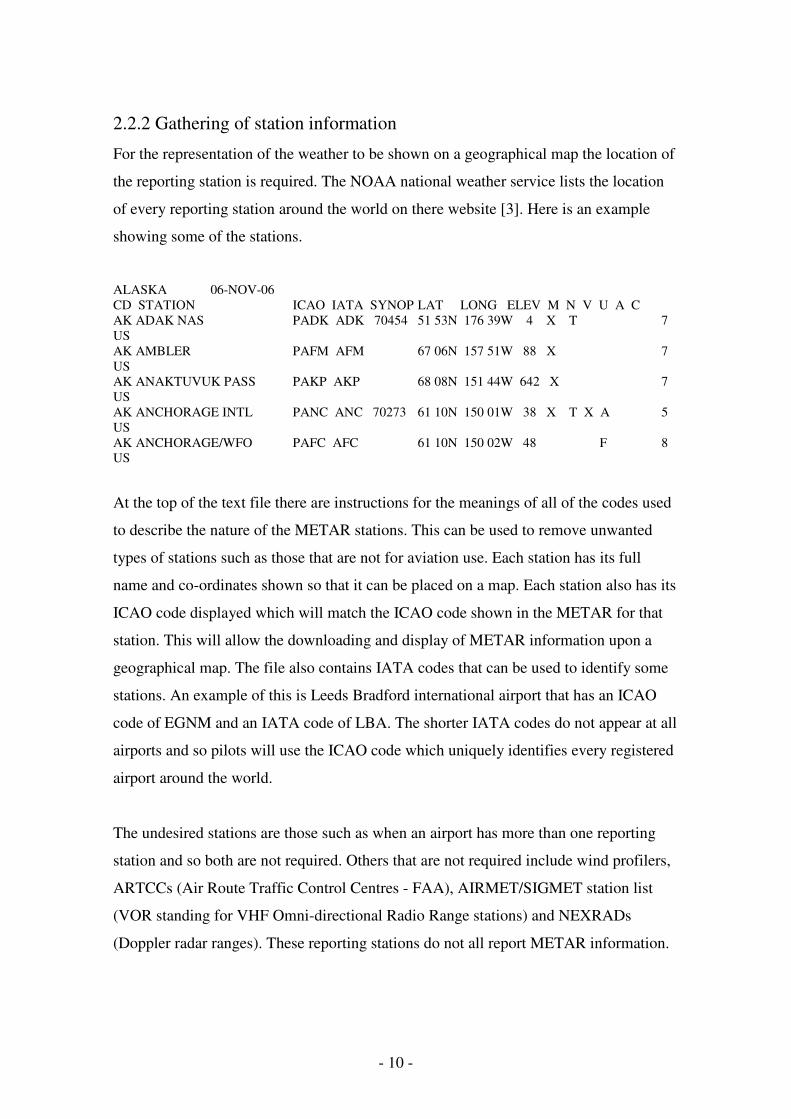
2.2.2 Gathering of station information
For the representation of the weather to be shown on a geographical map the location of
the reporting station is required. The NOAA national weather service lists the location
of every reporting station around the world on there website [3]. Here is an example
showing some of the stations.
ALASKA 06-NOV-06
CD STATION ICAO IATA SYNOP LAT LONG ELEV M N V U A C
AK ADAK NAS PADK ADK 70454 51 53N 176 39W 4 X T 7
US
AK AMBLER PAFM AFM 67 06N 157 51W 88 X 7
US
AK ANAKTUVUK PASS PAKP AKP 68 08N 151 44W 642 X 7
US
AK ANCHORAGE INTL PANC ANC 70273 61 10N 150 01W 38 X T X A 5
US
AK ANCHORAGE/WFO PAFC AFC 61 10N 150 02W 48 F 8
US
At the top of the text file there are instructions for the meanings of all of the codes used
to describe the nature of the METAR stations. This can be used to remove unwanted
types of stations such as those that are not for aviation use. Each station has its full
name and co-ordinates shown so that it can be placed on a map. Each station also has its
ICAO code displayed which will match the ICAO code shown in the METAR for that
station. This will allow the downloading and display of METAR information upon a
geographical map. The file also contains IATA codes that can be used to identify some
stations. An example of this is Leeds Bradford international airport that has an ICAO
code of EGNM and an IATA code of LBA. The shorter IATA codes do not appear at all
airports and so pilots will use the ICAO code which uniquely identifies every registered
airport around the world.
The undesired stations are those such as when an airport has more than one reporting
station and so both are not required. Others that are not required include wind profilers,
ARTCCs (Air Route Traffic Control Centres - FAA), AIRMET/SIGMET station list
(VOR standing for VHF Omni-directional Radio Range stations) and NEXRADs
(Doppler radar ranges). These reporting stations do not all report METAR information.

- 11 -
Some stations do but not all of the METAR codes and so the weather picture will be
incomplete.
2.2.3 Design methodologies
Before the design process it is necessary to choose a design methodology that is suitable
for use. Two main design methodologies were seriously considered as appropriate for
the design process. These were the Waterfall methodology and Agile software
development.
2.2.3.1 Waterfall method.
The waterfall model [13] contains seven steps. Each step influences the next step in the
design process. It isn’t very flexible for change as once a step has been left it isn’t easy
to make a change in it without compromising the steps that follow it. This however is
not a problem if the design is well thought out at the beginning and as such is quite
useful for smaller projects that do not require a lot of change.
The seven steps of the waterfall model are listed here:
1 Requirement specification.
Here all of the projects requirements are specified so that the designer can
clearly picture what the solution must be able to accomplish.
2 Design.
Here the designing of the solution takes place.
3 Construction.
The solution is made.
4 Integration.
Here the solution is put together from its components
5 Testing and debugging.
Here the solution is tested to make sure that it is working and doing everything it
is supposed to.
6 Installation.
The solution is presented to the end user as a completed solution.
- 12 -
7 Maintenance.
Here the solution is maintained, repairing any problems that arise within the
system.
Overall the waterfall model is not very flexible for changing requirements but due to the
relative small size of this project it is quite suitable. As long as each stage is planned
well enough the solution should be produced without too many problems.
2.2.3.2 Agile methodology
Agile methodologies [13] aren’t as rigid in there conception as the Waterfall method
and so are perhaps more suitable for the designing of the projects solution. They have
an iterative nature where a stage is re-worked until it matches the requirements that can
change throughout the projects designing.
The way that Agile designing will create a small subset of working parts or a less
capable complete solution every few weeks is not of any use for the purposes of this
project as the only deliverable is the software at the end and as the requirements are
unlikely to change this is not required. This is not too different to prototyping which is
useful where deliverables or demonstrations are required on a regular basis. This project
only has one deliverable point and so this is not a useful feature to the project.
Agile designing will also work well with a group of contributors as it easily
compartmentalises the different aspects of the work but as I am the only designer this is
also a benefit of Agile designing that is not needed.
2.2.3.3 Chosen methodology
Taking into consideration that the requirements are unlikely to change and that many
prototypes are not required for demonstrations the Agile approach is not warranted.
For the size of this project and its scope I believe that the Waterfall method of design
will be more suitable. The Waterfall method allows a clear path from start to end and is
- 13 -
better suited to work with one person whereas the Agile model obviously tends towards
collaborative designing.
2.3 Graphical representations
The decoded METAR weather data will be given a graphical representation over a
geographical map so that the pilot using the solution can clearly picture the weather in
the area they will be flying. The representations of the weather will need to be as self
evident as possible so that a new pilot will be able to intuitively know what each symbol
is depicting. Some of the symbols may not be as intuitive as they might have to depict
complicated weather information such as freezing rain or sandstorms.
2.3.1 Depth of representation
The amount of information that can be contained within a METAR is potentially very
detailed. The amount of information mustn’t overload the graphical representation
making it difficult for the pilot to understand. In some cases it might be better to only
display the most prevalent weather for a station. Some of the more complex weather
information may be best only displayed in a textual decoded form so that the symbols
used don’t need to be complicated or difficult to remember. Keeping the amount of
symbols used to a minimum is a must as this will help to keep the time a new pilot takes
to learn how to use the system lower.
A visualisation in 3D may be more of a hindrance than an advantage for this project.
Keeping the symbols on a 2D representation will reduce the workload that the pilot
needs to undertake when understanding the weather situation. A 3D representation may
be useful for the different cloud layers which are in 3D space in the real world but this
would compromise the visibility of symbols that fall underneath the higher cloud
symbols. This means that some of the important weather information might not get seen
by the pilot.

- 14 -
2.3.2 Choice of appropriate symbols
The most appropriate symbols are those that are easily recognised and remembered by
the greatest amount of people. This is why the choice of symbols is very important to
the success of this solution as a tool that pilots can use. Obviously the use of
complicated or difficult to read symbols must be avoided for this to happen. There are
already weather symbol systems in use that may be more popular for use as many
people might already know how to use them.
The BBC weather symbols [5] shown below in fig 2.1 are common in the UK and are of
most use to UK pilots. Alternatively the CNN weather symbols [6] shown below in fig
2.2 are common in the US and are more appropriate for US pilots.
Fig 2.1
Fig 2.2
Instead of trying to recreate a similar style to the BBC and CNN style symbols it is best
to use these as most pilots will be familiar with them and those that aren’t should find
understanding their meaning quite easy. As the BBC and CNN symbols are useful for
different pilots it will be useful to combine them. This will be done quite easily as they
are quite similar to each other.
2.4 Appropriate technologies
The solution needs to be built using an appropriate solution for the visualisation. The
language in which the solution is built must also be considered.

- 15 -
2.4.1 Visualisation choice
The weather symbols need to be depicted on geographical information so that the
increased context can help pilots plan their flight. The geographical information is best
obtained from a free source and must be easily manipulated by the solution program to
add the symbols to it. The geographical information must be detailed enough to enable
the pilots to gather useful information such as directions and heights.
One considered source for geographical information was the Ordnance Survey maps [7].
They provide a good level of detail and are available online. The method for retrieving
the maps online is not very easy for manipulating by a computer program and thus the
collection of map data would be difficult. This source for geographical information also
means that the maps would require downloading for the adding of the weather symbols
which is a breach of the copyright terms on the site. After they had been downloaded
and manipulated the maps would need displaying and this would require a capable map
displaying part to the solution which is unnecessarily complicated.
The second considered source for geographical information was Google Maps [8].
Google Maps is an online based source for mapping information that also allows subtle
manipulation of its map information through KML [9] which is Google Maps’ language
for describing these alterations. This is more ideal for adding the mapping information.
The online aspect would make it very useful for use by pilots across the world.
The final considered source for geographical information was Google Earth [10].
Google Earth is an application based tool for gathering and displaying mapping
information. This mapping information, like Google Maps, can be manipulated using
KML. The difference between Google Maps and Google Earth is that the later can be
manipulated a lot more. Google Earth can also hold a lot more manipulation than
Google Maps and so is more suited to displaying more complicated weather systems
and larger areas.
- 16 -
Overall the choice to use Google Earth has been made as it is the easier to manipulate
than Google Maps and contains its own mapping display which the Ordnance Survey
couldn’t. Google Earth is much better than the other two in that it can also have its
mapping information changed by the user while it is in use so that cluttered information
can be filtered out allowing the user to read and understand things in smaller pieces.
2.4.2 Coding language choice
Two coding languages were considered for the design of this system.
The first was C++ which is a powerful language and has many libraries for adding quick
and easy functionality to a program. C++ is a good language that can easily handle the
requirement of this project. It can use its libraries functions to download and manipulate
the weather information and also has library functions to manipulate XML style code
which is the syntax that the KML uses. C++ can be very complicated and I am not sure
that I have enough knowledge of it to use it for this project’s solution.
The second consideration was Java. Java is an equally powerful language to C++. Java
also contains large libraries that can easily add extra functionality to a program. I am
more familiar with Java than I am with C++ and don’t find Java as complicated.
The solution will be programmed in Java. This is mainly because I am most comfortable
programming in Java but also because Java has advantages over C++ and others when it
comes to graphical interfaces and the ease of using web sources.
The biggest advantage of Java is its widespread adoption and platform independence.
This will allow pilots to use it across the world and on virtually any machine.

- 17 -
Chapter 3
Design and implementation
3.1 Schedule for design and implementation
Task Deadline
Research of METAR server data formats and METAR data
formats.
5/11/06.
Research of Station server data formats and Station data formats 15/11/06
Research for weather symbols 25/11/06
Decision of weather symbols 07/12/06
Research for graphical representations 15/12/06
Decision for graphical representations 27/12/06
Research of KML coding. 13/01/07
Coding of KML generation algorithm. 30/01/07
Coding of METAR report decoding algorithm. 25/02/07
Coding of graphical front end. 15/03/07
Testing and evaluation of the solution 24/04/07
Final report write up 25/04/07
The above table is a reasonable schedule for the project. This has been adhered to as
much as possible. Alterations and changes to deadlines are discussed in the evaluation
section.
3.2 Java class design.
The program will best be distributed over 3 classes. A class to host the main program
and GUI elements called Metar. A second class to host the METAR report decoding
which will then pass back to the main class for the KML generation called Decode.
Finally the third class is simply a small class that contains methods for converting
between heights, latitudes and longitudes, temperatures and pressures called Convert.
- 18 -
This is so that all of the units displayed are the same and also the correct kind that
Google Earth [10] requires.
The main program will download and store to disc the 2 most recent METAR cycles
from the NOAA [1] so that there is a greater coverage of weather information and fewer
stations are left blank. The newer information overwrites the older weather information
so that it is always mostly up to date. Next the class downloads the METAR reporting
station information and stores that to disc. After the downloading is completed the class
will read in all of the station information into a large array. After the station information
is loaded the METAR information is read in from the disc and placed in the appropriate
location in the array. This allows all of the station information to be stored with the
METAR report information. This array is now queried so all of the information that the
algorithms require.
The class then starts to generate the KML file that is written to disc. This is done by
iterating through the array and decoding the METAR report information in the second
class called Decode. Decode will be described in detail later. Decode will pass back an
array containing all of the decoded METAR information. The main Metar class then
takes this array and iterates through it placing all of the appropriate symbols in the
correct places within the KML as described in 3.4.
After this is completed the next iteration begins. If the program comes across a
reporting station for which there isn’t any METAR information reported then it will
only add the stations marker within the KML [9] for Google Earth [10].
Once all stations have been iterated through the class saves the KML script and then
launches Google Earth [10] with the KML script which Google Earth will load
displaying a world wide view of all METAR reporting stations. The graphical interface
for this will be discussed later in 3.6.2.
The decode class is passed the METAR report from the Metar class. It will then return
all of the decoded information in the form of an array. The METAR decoding process is
shown in the section 3.3 METAR decoding algorithm.
- 19 -
The convert class is passed information for conversion from both the Metar class and
the Decode class. It contains methods for converting between feet and metres,
latitude/longitude values and degrees. There is also a method for converting between
wind speeds in metres per second and knots so that all wind speeds can be presented in
knots. This is most useful to pilots who would have to convert between these units
anyway.
This distribution of code is beneficial as it separates out all of the methods that will be
called many times in iterative algorithms such as the METAR decoding algorithm and
the conversion methods. As the KML is only generated once it can be kept in the main
class. This is the same as the GUI which is also kept in the main class.
3.3 METAR decoding algorithm
The solution for the METAR decoding algorithm is quite simple. It tokenizes the
METAR string as each token will be a different weather condition. Some of the more
difficult information such as wind strength and direction are trickier to decode than the
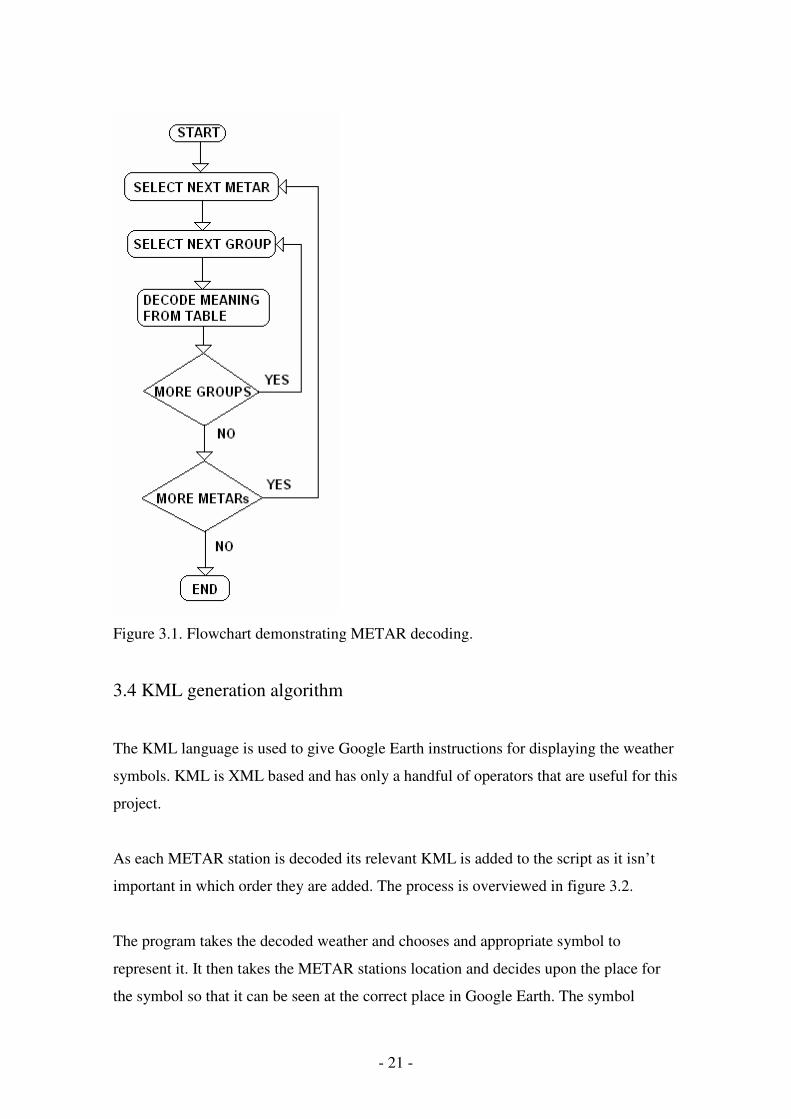
weather tokens and require more work. The decoding process is overviewed in figure
3.1.
The first part of a METAR is a four character ICAO designation code for that station.
This is easily spotted by the program.
The next part is the date and time signature for the METAR. This is also of a fixed
length and so easily spotted.
Once these first two pieces of METAR information have been dealt with they are
removed from the string. The remaining information will be the weather conditions. The
program then looks at each part of the METAR one at a time and decodes the
information. Some special codes appear that are significant such as the code “AUTO”
that allows the pilot to understand that the weather information has been automatically

- 20 -
generated and isn’t as accurate as a manual report. “CORR” is another code that shows
an automatically generated METAR has been corrected by human intervention.
Wind information such as “12040KT” is trickier as it can have many different lengths
and designators such as different speed units and extra codes for displaying gusting
winds such as “12020G30KT”. The algorithm looks for the unit codes to determine the
end of the wind section and then looks for the “G” symbol so that it knows whether to
look for a gusting wind speed or not.
The temperature codes are easily found as “12/10” or “02/M01”. The M is used to
designate minus. Here “12/10” depicts that the temperature is 12 degrees centigrade and
that the dew point is 10 degrees.
One of the hardest pieces of weather information is the visibility group. This is because
it can have variable lengths and use different units. It can also have different visibilities
for certain runways but by having the program look for the units used and
understanding the different runway codes it is possible to decode the visibility from the
METAR.
The different cloud groups such as “020OVR” and “040BKN” depict the cloud
coverage at the observation station. These two above show overcast clouds at 2000ft
and broken clouds at 4000ft. These are always in the same place within the METAR
and as there are only a few combinations of the same length they are easily decoded.
Finally the prevalent weather codes are decoded such as “+RN” and “-SHSN”. These
two depict heavy rain and light snow showers. Again as there are only a certain amount
of combinations and lengths they are easily spotted and decoded.
The further codes for weather phenomena are not of interest as they depicted by the
symbols and so the decoding of these is not required.
- 21 -
Figure 3.1. Flowchart demonstrating METAR decoding.
3.4 KML generation algorithm
The KML language is used to give Google Earth instructions for displaying the weather
symbols. KML is XML based and has only a handful of operators that are useful for this
project.
As each METAR station is decoded its relevant KML is added to the script as it isn’t
important in which order they are added. The process is overviewed in figure 3.2.
The program takes the decoded weather and chooses and appropriate symbol to
represent it. It then takes the METAR stations location and decides upon the place for
the symbol so that it can be seen at the correct place in Google Earth. The symbol
- 22 -
placing is decided by a common placing throughout the visualisation. From left to right
are the wind, temperature, visibility, barometric pressure, prevailing weather condition
and finally the cloud layers. This means that by using a particular offset from the
location of the METAR reporting station the symbols will always appear in the same
places relative to the METAR stations location.
Once this is done the process is iterated for all symbols at that station and the KML
script is generated. This whole process is repeated for all of the METAR stations as they
are decoded. The station information such as co-ordinates and names are taken from the
station information which is discussed in 2.2.2. The station information co-ordinates are
in latitude and longitude format which is not the format that Google Earth [10] requires
them in. For Google Earth to understand them they need to be in degrees. This is done
by passing a latitude and longitude value to the convert class of the program that returns
the degree values back.
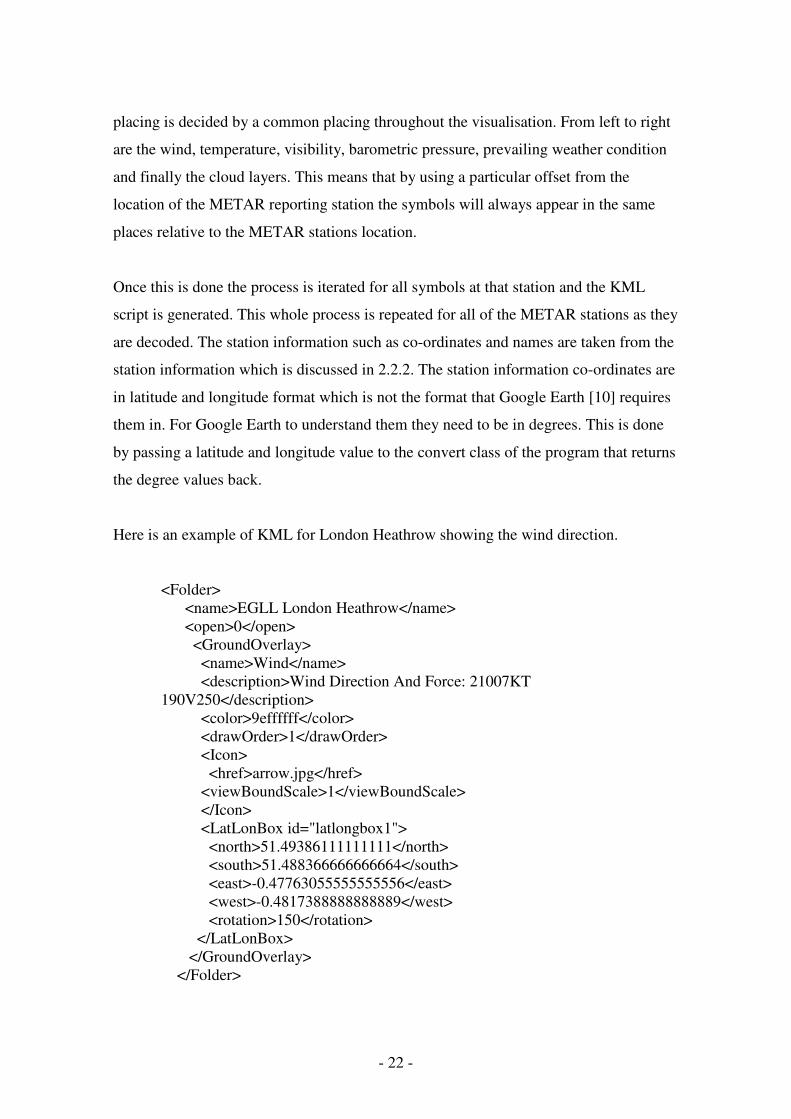
Here is an example of KML for London Heathrow showing the wind direction.
<Folder>
<name>EGLL London Heathrow</name>
<open>0</open>
<GroundOverlay>
<name>Wind</name>
<description>Wind Direction And Force: 21007KT
190V250</description>
<color>9effffff</color>
<drawOrder>1</drawOrder>
<Icon>
<href>arrow.jpg</href>
<viewBoundScale>1</viewBoundScale>
</Icon>
<LatLonBox id="latlongbox1">
<north>51.49386111111111</north>
<south>51.488366666666664</south>
<east>-0.47763055555555556</east>
<west>-0.4817388888888889</west>
<rotation>150</rotation>
</LatLonBox>
</GroundOverlay>
</Folder>

- 23 -
This code is typical for all symbols and descriptions. The only thing that will change is
the name of the airport or stations and the picture used for the symbol.
Figure 3.2. KML generation flowchart.
- 24 -
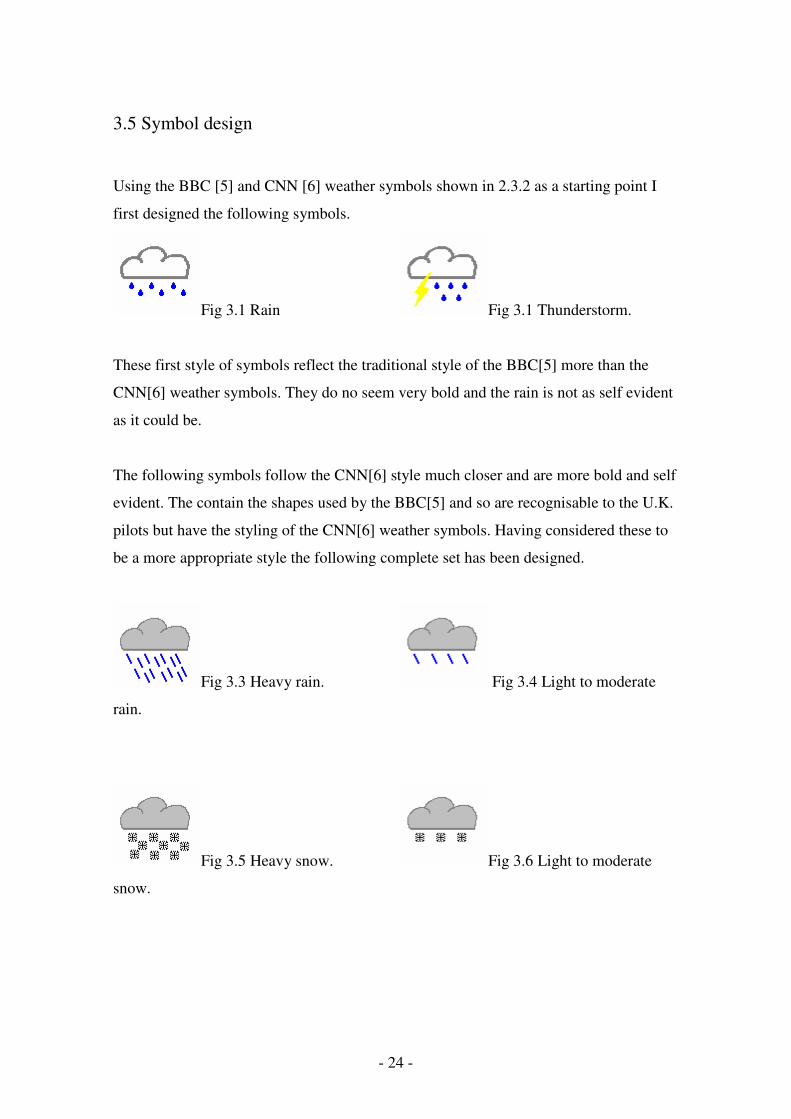
3.5 Symbol design
Using the BBC [5] and CNN [6] weather symbols shown in 2.3.2 as a starting point I
first designed the following symbols.
Fig 3.1 Rain Fig 3.1 Thunderstorm.
These first style of symbols reflect the traditional style of the BBC[5] more than the
CNN[6] weather symbols. They do no seem very bold and the rain is not as self evident
as it could be.
The following symbols follow the CNN[6] style much closer and are more bold and self
evident. The contain the shapes used by the BBC[5] and so are recognisable to the U.K.
pilots but have the styling of the CNN[6] weather symbols. Having considered these to
be a more appropriate style the following complete set has been designed.
Fig 3.3 Heavy rain. Fig 3.4 Light to moderate
rain.
Fig 3.5 Heavy snow. Fig 3.6 Light to moderate
snow.
- 25 -
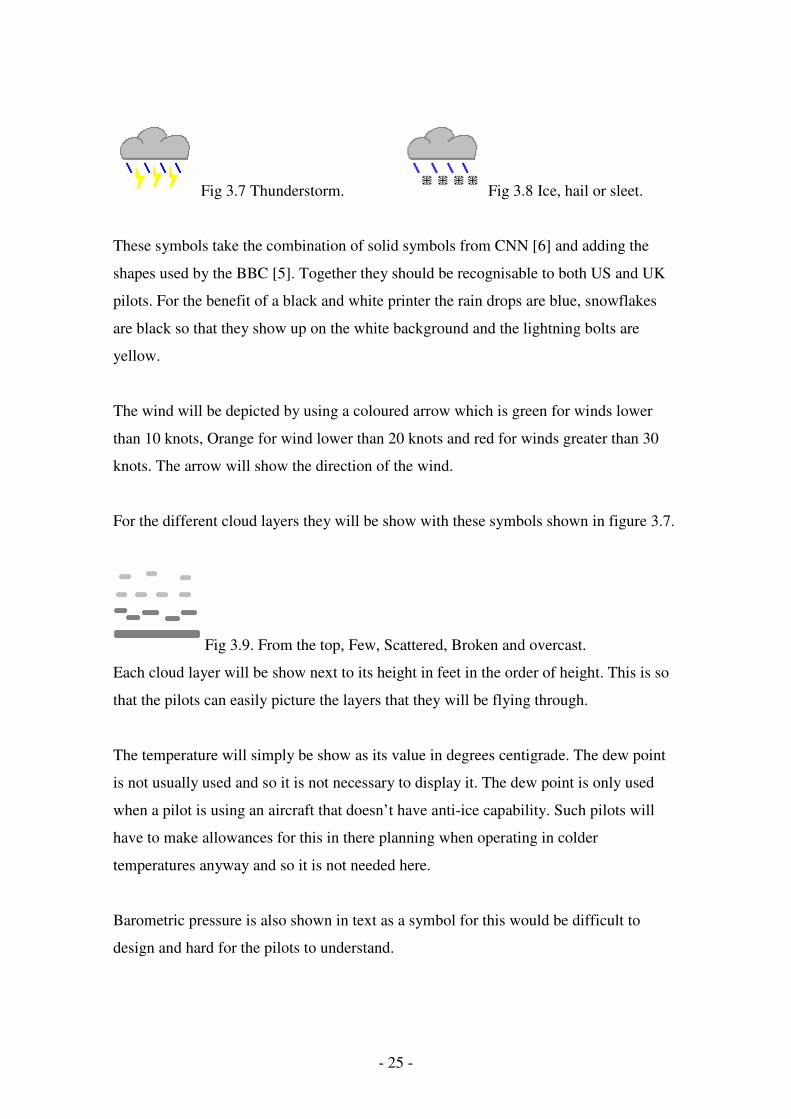
Fig 3.7 Thunderstorm. Fig 3.8 Ice, hail or sleet.
These symbols take the combination of solid symbols from CNN [6] and adding the
shapes used by the BBC [5]. Together they should be recognisable to both US and UK
pilots. For the benefit of a black and white printer the rain drops are blue, snowflakes
are black so that they show up on the white background and the lightning bolts are
yellow.
The wind will be depicted by using a coloured arrow which is green for winds lower
than 10 knots, Orange for wind lower than 20 knots and red for winds greater than 30
knots. The arrow will show the direction of the wind.
For the different cloud layers they will be show with these symbols shown in figure 3.7.
Fig 3.9. From the top, Few, Scattered, Broken and overcast.
Each cloud layer will be show next to its height in feet in the order of height. This is so
that the pilots can easily picture the layers that they will be flying through.
The temperature will simply be show as its value in degrees centigrade. The dew point
is not usually used and so it is not necessary to display it. The dew point is only used
when a pilot is using an aircraft that doesn’t have anti-ice capability. Such pilots will
have to make allowances for this in there planning when operating in colder
temperatures anyway and so it is not needed here.
Barometric pressure is also shown in text as a symbol for this would be difficult to
design and hard for the pilots to understand.

- 26 -
3.6 Interface design
The software is a professional solution and as such requires both a command line
interface for the user who is more experienced and graphical interface for those who are
not as experienced
3.6.1 Command line interface
The command line interface simply runs the program. There are two operators that tell
the program what to do. Using the /g operator starts the program without the graphical
interface and makes the program start the downloading process and the decoding
process immediately. Once this is done it will generate the KML and launch Google
Earth. Using the /k operator will start the program and allow it to start the downloading
and decoding process. It will also allow the KML generation to begin but it prevents the
program from launching Google Earth.
These two operators can be used on there own or together. If they are used together then
the order must be /g /k. They are added to the end of the program call such as this,
metarmap.exe /g /k.
The graphical interface inhibitor allows the program to run in a non intrusive way. This
means that the program can be used by an external program if necessary.
The KML generation inhibitor allows the program to do all of the processes up to
generate the KML and launch Google Earth. This is useful for testing and for external
programs to use the solution to download weather information.
If the solution is to be run without the graphical interface then it isn’t possible to set
some of the user options such as default viewing height and angles. In this case the
solution will revert to a default setting.

- 27 -
3.6.2 Graphical based interface
The graphical interface is quite simple as there are only a few options that are open to
change by the user.
One is the default viewing height. This sets the height at which the view point is set
when the user selects one of the METAR reporting stations within Google Earth. The
default is set to a reasonable height by the software depending on the height of the
METAR reporting station itself.
The second value is the viewing angles. The default is due north but this allows the user
to set a compass bearing in degrees to change the orientation of the default viewing
position.
Finally the interface has a button to start the downloading and decoding process. Once
this has happened the program will produce the KML script and launch it within Google
Earth [10].
The interface design is basic but meets all of the requirements. It is demonstrated below
in figure 3.10.
Figure 3.10. METAR map graphical interface.
After the program has downloaded, decoded and put the METAR information into the
KML it will launch Google Earth [10]. The information is shown in Google Earth [10]
is demonstrated in figure 3.11. It shows clearly the direction of the wind and the
prevailing weather condition which is light to moderate rain. It also shows the decoded

- 28 -
visibility, barometric pressure, and temperature. There is also a symbol indicating few
clouds with a caption showing them to be at 350 ft. It was captured on the 12th
of
February 2007 at 18:30 although the METAR report was for 18:20. The encoded
Figure 3.12 shows how extra cloud layers are shown. It also demonstrates different
values for the weather. Note that although the wind hasn’t changed direction the arrow
is now orange showing stronger winds and that the rain has increased in its intensity.
The pressure has dropped and as a result of the heavy rain the visibility has dropped to
1500 ft. The drop in pressure and drop in temperature are also indicated. This second
example was captured 6 hours later that night after the first example.
Fig 3.11 Google Earth showing weather symbols.

- 29 -
Fig 3.12 Google Earth showing further weather symbols.
The designed placement of symbols has been changed so that the textual information is
kept together. This was changed as some of the symbols cannot be placed in the same
positions every time as the METAR might not contain all of the information or even
have that kind of weather. An example of this would be if there were clear skies, thus
eliminating the layered cloud system and also the prevalent weather system group.
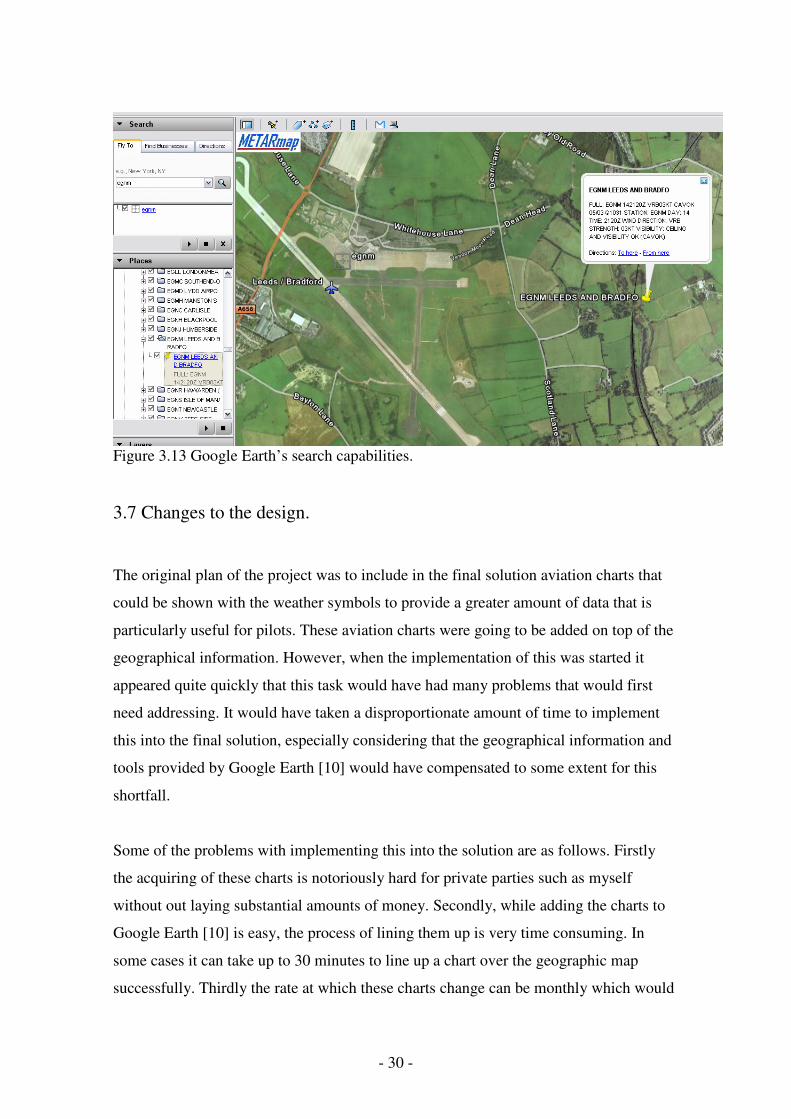
To find a particular airport in Google Earth [10] it is simpler to use its own search
system. It can search for ICAO codes or the airport name and so all airports that are
covered by a METAR reporting station can be reached. This is shown in figure 3.13
where Leeds Bradford international airport has been searched for using its ICAO code
of EGNM. To view its weather report the pilot can either click on the yellow pin
representing the weather report or can find the airport in the alphabetical list down the
left hand side and select its entry there.
Figure 3.13 also shows the decoded METAR information in plain English for Leeds
Bradford.
- 30 -
Figure 3.13 Google Earth’s search capabilities.
3.7 Changes to the design.
The original plan of the project was to include in the final solution aviation charts that
could be shown with the weather symbols to provide a greater amount of data that is
particularly useful for pilots. These aviation charts were going to be added on top of the
geographical information. However, when the implementation of this was started it
appeared quite quickly that this task would have had many problems that would first
need addressing. It would have taken a disproportionate amount of time to implement
this into the final solution, especially considering that the geographical information and
tools provided by Google Earth [10] would have compensated to some extent for this
shortfall.
Some of the problems with implementing this into the solution are as follows. Firstly
the acquiring of these charts is notoriously hard for private parties such as myself
without out laying substantial amounts of money. Secondly, while adding the charts to
Google Earth [10] is easy, the process of lining them up is very time consuming. In
some cases it can take up to 30 minutes to line up a chart over the geographic map
successfully. Thirdly the rate at which these charts change can be monthly which would

- 31 -
quickly leave quite a lot of the data contained in the charts obsolete. Finally the charts
are carried by a pilot for all of the airports in which they intend to fly and so repeating
them within the solution would be wasteful.
In designing the solution of the symbols it was decided that providing a choice of two
kinds of symbols, which was the original intension, was also not necessary as the
symbol sets would be similar to each other anyway. That is why the combination of
BBC [5] and CNN [6] symbols was used.
Both of these changes to the design were not ones that compromised the design or
objectives of the solution and the Waterfall model that was used to throughout the
solutions design coped with them well.

- 32 -
Chapter 4
Evaluation
The solution will be evaluated to see if it meets the minimum requirements and
objectives defined in 1.5.
The solution will also be considered whether it could be used for flight planning by
pilots in real situations to determine if the solution is a useable tool.
The solution will be deemed a success if it is found to be good enough to meet these
evaluation criteria.
4.1 Code testing
The code for the solution was tested as it was written to make sure that its development
was working towards a complete solution. This was done whenever a change to the
code was made that warranted a test. Such points for testing were whenever a new
weather group was added to the METAR report decoding algorithm.
The code was also tested once it was completed to make sure that the finished solution
work well. It was tested to make sure that it could cope with problems in the internet
connection such as if the web site containing the METAR weather reports was down.
The code was overall tested to make sure that it was of good quality, secure and correct
for its intended use.
Through testing the completed software there were numerous bugs uncovered in the
decoding of the METAR reports. Some of these errors were only slight such as “1 ½

- 33 -
SM” being understood by the program as ½ statute miles. These types of errors were
usually the result of miscounting string indexes and were easily fixed.
Some of the more serious bugs required a complete re-working of the METAR
decoding algorithm. This resulted in a delay in the completion of the METAR decoding
algorithm completion and is discussed later in 4.3.2. In one case it was discovered that
if the METAR line contained “-SHSN” meaning literally light shower snow (light snow
shower in plain English) was being understood as light shower rain (light rain shower in
plain English) because the algorithm hadn’t been written to expect the inclusion of the
shower descriptor in the case of snow but only in the case of rain.
This resulted in a re-design of the algorithm which moved away from comparing
completed METAR reports in larger chunks to an algorithm that compared only the
smallest weather groups that could be processed at one time and still retain meaning.
This led to “-SHSN” being perceived one part at a time such as the quantifier first
(light) then “SH” meaning shower and finally “SN” meaning snow. This was easier for
the program to recognise and once it had it was able to rearrange it into plain English of
light snow showers.
4.2 User evaluation
The finished solution was tested by myself and two of my friends who are pilots. These
are Daryl Shuttleworth [14] who resides in Canada and is a student pilot like myself and
Nigel Riven [15] who lives in the UK and was once employed by British Airways. Both
of these men have more experience flying than me especially Nigel who was a
commercial pilot for over 15 years. I am in contact with both of these men through
email and telephone. The software was sent to them through email with minimal
instructions for use. After a week I contacted them both by telephone to receive
informal feedback about the solution that I had produced.

- 34 -
4.2.1 Interface testing
The interface for the solution program itself is very simple. There are only two
changeable parameters and one button. Both Daryl and Nigel commented to some
degree that this really couldn’t be difficult for anyone to understand or miss use.
Daryl [14] mentioned in particular that “It would be impossible to get this wrong”.
The interface for Google Earth [10] is a little more complex and as it is used by my
solution I also asked Daryl and Nigel to comment on how easy they found it to navigate
around the environment and how easy it was to get to the information they were looking
for.
Nigel [15] said that even though he had never “used Google Earth for this kind of use
before” it was “quite simple and quick to pick up”. This is a good success as one of the
key objectives was that the system be as intuitive as possible so that new pilots wouldn’t
need to spend too much time trying to understand it. He did mention that “sometimes
the search wouldn’t find exactly the right place for the airports information” [15]. This
is a bit of a problem as the main way to find information in the interface is to use
Google Earths [10] in built search functions. Here the interface does fail slightly but it is
always quite close to the point of the information and so this is only a minor problem.
Daryl [14] gave similar comments to those of Nigel’s [15] and added that he found the
interface “very easy to changing the amount of detail he needed” in certain situations.
I would like to add that the interface within Google Earth [10] changed from version 3
to version 4 and that the position of the movement controls changed along with their
appearance. This did mean that the positioning of the solutions weather data symbols
might be jeopardised if this was to change to a position on the map where they would
overlap. I find the rest of the interface very easy to work with, however, it is worth
noting that I have been using Google Earth [10] extensively throughout this project and
so wouldn’t expect to find any problems with it.

- 35 -
4.2.2 Representation testing
Here the solution was tested by Daryl [14] and Nigel [15] to determine whether the
amount of weather detail was adequate for aviation use and also whether the symbols
were easy to understand and appropriate enough for pilots use.
It is also worth mentioning that I checked if Daryl had ever seen the BBC [5] weather
symbols before to which he said that he had not. This gave me a chance to see if the
combination of styles chosen for the weather symbols had been successful for those
people who had not seen both. Nigel [6] said that he had seen both types of weather
symbols before and so he couldn’t be used for this process as well as Daryl [14].
I started by asking Daryl [14] if he found the amount of detail contained within the
solution detailed enough for use with flight planning. Daryl [14] found “the level of
detail adequate for his type of flying” which is general aviation or light aircraft. The
detail of the information even “exceeded what he expected to find” [14] but he did not
say this as a negative point as he understood that the tool is for use with more
demanding pilots as well.
I then asked Nigel [15] the same questions about the amount of detail that is contained
in the solution and whether it was enough to allow flight planning. Nigel [15]
commented that the “amount of information is correct for an overview of weather at an
airport”. This shows that there was not too much information to overload the user.
Daryl [14] was asked about the choice and design of the symbols. As previously
mentioned Daryl lives in Canada and is familiar with the CNN[6] style weather symbols
but has never encountered the BBC[5] style weather symbols. When asked about the
meaning of the symbols Daryl [14] said “They are easy to read, especially on the white
background and are easily distinguished”. This shows that Daryl [14] found the symbols
to be adequate for the purpose of displaying the weather information.
- 36 -
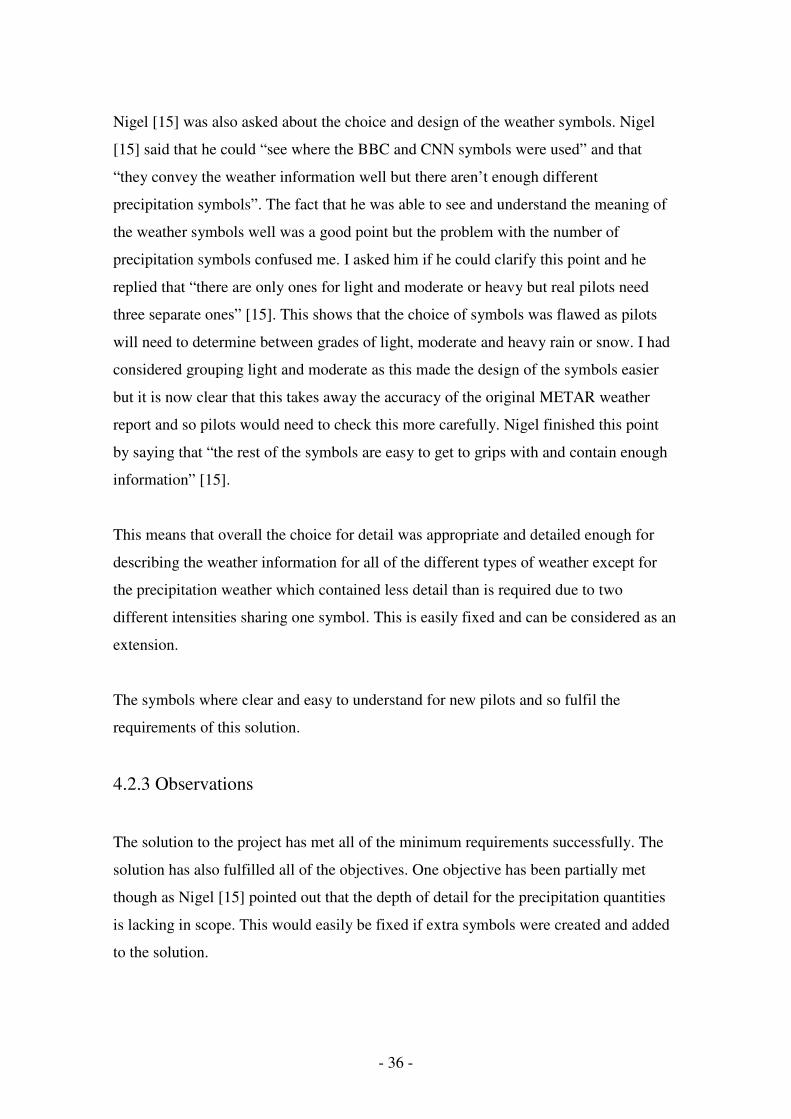
Nigel [15] was also asked about the choice and design of the weather symbols. Nigel
[15] said that he could “see where the BBC and CNN symbols were used” and that
“they convey the weather information well but there aren’t enough different
precipitation symbols”. The fact that he was able to see and understand the meaning of
the weather symbols well was a good point but the problem with the number of
precipitation symbols confused me. I asked him if he could clarify this point and he
replied that “there are only ones for light and moderate or heavy but real pilots need
three separate ones” [15]. This shows that the choice of symbols was flawed as pilots
will need to determine between grades of light, moderate and heavy rain or snow. I had
considered grouping light and moderate as this made the design of the symbols easier
but it is now clear that this takes away the accuracy of the original METAR weather
report and so pilots would need to check this more carefully. Nigel finished this point
by saying that “the rest of the symbols are easy to get to grips with and contain enough
information” [15].
This means that overall the choice for detail was appropriate and detailed enough for
describing the weather information for all of the different types of weather except for
the precipitation weather which contained less detail than is required due to two
different intensities sharing one symbol. This is easily fixed and can be considered as an
extension.
The symbols where clear and easy to understand for new pilots and so fulfil the
requirements of this solution.
4.2.3 Observations
The solution to the project has met all of the minimum requirements successfully. The
solution has also fulfilled all of the objectives. One objective has been partially met
though as Nigel [15] pointed out that the depth of detail for the precipitation quantities
is lacking in scope. This would easily be fixed if extra symbols were created and added
to the solution.

- 37 -
The problem of the search facility within Google Earth [10] not always positioning the
viewpoint over the weather symbol information is a problem. To fix this the positioning
of every METAR station would need to be individually evaluated to make sure that this
is not repeated. Due to the large amount of METAR stations (over 27000) this would be
a very time intensive task and so the automated retrieval of the station information
should be used, but changes made where it is found to be inappropriate.
4.3 Development methodology
The development methodology that was chosen will be evaluated here to determine its
suitability for producing the solution. This section also looks at the schedule with
comments and explanations for changes to deadlines.
4.3.1 Effectiveness
The Waterfall [13] discussed in section 2.2.3.1 was chosen as a methodology to
complete the solution from inception to completion. This was followed closely through
all of the 7 waterfall steps that are required to be followed in order. As each step is
dependant on the input from the previous step any changes to the project are very
difficult to undertake.
One such change was the decision to remove the aeronautical chart information from
the solutions representation. As this was simply removing something rather than adding
something it wasn’t as damaging as adding something might have been.
The Waterfall model helped to structure the work into the 7 steps and tasks were
completed in that order. This helped me to keep an idea of where the deadlines were and
how close I was to meeting them. When changing elements I did have to go back to the
step where the change was needed (usually the first step) and work through the
following steps slowly and carefully to make sure that the change was made throughout
the project. This was time consuming but overall wasn’t too difficult.

- 38 -
If an Agile [13] style of methodology had been used instead the tasks would have been
treated separately. This would have meant that the removal of a system part would not
have affected the rest of the project to the same extent as with the Waterfall [13] model.
In this case an Agile [13] approach may have been helpful.
The Waterfall [13] model was suitable for the completion of the task. This is because I
found that for the relative low complexity of this project fitted well with the waterfall
model. The use of an Agile [13] model for development would have been overly
complex and unnecessary.
4.3.2 Schedule
The schedule that is discussed in 3.1 was thought out carefully to allocate each task
enough time to complete it with enough detail that is required. The scheduled tasks were
to be carefully complete by the scheduled deadlines. Some of the tasks for various
reasons were not completed by the deadline.
The first of these was the coding for decoding the METAR reports. This was done 5
days later than the deadline on the 02/03/07. This was due to problems when testing the
decoding of weather data that included information about snow showers. This meant
that there was less time for the next task which was the coding for the graphical front
end and all of its interfacing with the program.
4.4 Minimum requirements and extensions
All of the minimum requirements were met well. This is as the solution downloads,
decodes and overlays the weather information over the geographical information. As
evaluated in 4.2 the solution performs these requirements well enough to be considered
a successful approach to solving the initial problem.
As an extension to the requirements a graphical front end to the program was added to
aid the user interaction with the program. As there is not much user interaction required

- 39 -
for the program this was done quite easily. The graphical front end provides an
alternative for non expert users to run the program which was initially only considered
to be a professional solution that was adequately used from the command line.
4.5 Further extensions
This project can be extended for use in further final year projects. One of these projects
might be to take this as a starting point and add functionality for predicting the weather
between in areas where there are no reporting stations. This was one of the extensions
that I did not have time to implement on my own but would be a reasonable amount of
work for a final year project. Such a project would have foundations in CS modules for
the algorithm design that would be needed and also further involvement in GI modules
for the representation.
- 40 -
References
[1] NOAA National Oceanic and Atmospheric Administration US. (2006)
NOAA national weather service.
http://www.nws.noaa.gov/ [20th April 2007]
[2] Department of Atmospheric Sciences, Texas A&M University (2005)
METAR observation code.
http://www.met.tamu.edu/class/METAR/metar.html [20th April 2007]
[3] NOAA Aviation Digital Data Service & Thompson, Greg (2006)
METAR reporting stations.
http://adds.aviationweather.gov/metars/stations.txt [20th April 2007]
[4] NOAA Internet Weather Source (2007)
METAR report cycles.
http://weather.noaa.gov/pub/data/observations/metar/cycles/ [20th April 2007]
[5] BBC (2006)
Understanding the symbols.
http://www.bbc.co.uk/weather/bbcweather/features/symbols.shtml
[20th April 2007]
[6] CNN (2005)
CNN weather
http://www.cnn.com/weather/ [20th April 2007]
[7] Ordnance Survey (2007)
Get-a-map
http://www.ordnancesurvey.co.uk/oswebsite/getamap [20th April 2007]

- 41 -
[8] Google (2007)
Google Maps.
http://maps.google.co.uk/ [20th April 2007]
[9] Google (2007)
KML v2.1
http://earth.google.com/kml/ [20th April 2007]
[10] Google (2007)
Google Earth v4
http://earth.google.com/ [20th April 2007]
[11] Heras, Manuel et al (2002-2007)
METAR-Decoder
http://heras-gilsanz.com/manuel/METAR-Decoder.html [20th April 2007]
[12] Sofer, Nir (2003-2006)
MetarWeather v1.50 - METAR decoder
http://www.nirsoft.net/utils/mweather.html [20th April 2007]
[13] Tsui, Frank F & Karam, Orlando, (2006),
Essentials of Software Engineering,
Jones and Bartlett Publishers
ISBN 076373537X
[14] Shuttleworth, Daryl (2007)
[15] Riven, Nigel (2007)
- 42 -
Appendix A
Project reflection.
I feel that overall the project was a success even though there are areas that could have
turned out better. These include the research for the inclusion of aviation charts which if
it had been done sooner may have lead to more realistic minimum requirements from
the beginning.
The lack of inclusion of the aviation charts is a disappointment to me as this would have
been very useful for giving the pilots the entire context that they need to plan a flight
well.
The workload was accomplished mainly before the Christmas break and halfway
through semester 2. Most of the project was done on time to the schedule but if work
had continued well through the Christmas period the deadlines may have been met
better. This is partly as the thought of “there is plenty of time left” is quite strong in
your mind when working on a project for over 6 months. If doing this again I would
have no hesitation in working harder at the beginning to make sure that the deadlines
were met.
I do regret not being able to do many of the enhancements which I feel has cost me
marks for this project. Given my time again I would have started more of these earlier
on in the implementation to at least attempt them properly.
When evaluating the solution I would much rather have had interaction with my two
friends who tested the program on a one to one basis rather than having to use the
telephone. I feel that I could have gauged there reactions better if it had been done on a
personal meeting basis.