Embed Size (px)
Citation preview
DECENTRALIZED SOCIALISM AND MACROECONOMIC STABILITY: LESSONS FROM CHINA
Gang Fan Institute of Economics
Chinese Academy of Social Sciences
and
Wing Thye Woo Economics Department
University of California at Davis
July 1992
We are grateful to the Ford Foundation and to the UNU World Institute for Development Economics Research (UNU/WIDER) for financial support. The UNU/WIDER support was as part of a larger project on the Transformation of Centrally Planned Economies, funded by the Finnish International Development Agency (FINNIDA) . We are also grateful to John Roemer, Jeffrey Sachs and Wu Jing Lina for helpful conversations, and to Hong Chen and Sam Lee for excellent research assistance.

July 1992
DECENTRALIZED SOCIALISM AND MACROECONOMIC STABILITY
LESSONS FROM CHINA
Gang Fan and Wing Thye Woo
Abstract
Using a survey of 300 state-owned enterprises (SOEs), we argue
that the acceleration of inflation in China after 1984 was caused by
the decentralization reforms in the state sector. These reforns
allowed the SOEs to realize their innate tendencies to over-consume
and over-invest. The evidence suggests that the increasing
government budget deficits were caused by an upward "wage drift"; and
that there has been a decline in production efficiency in the 1984-88
period. The latter implies that the efficiency improvements in SOEs
immediately after 1978 (found by earlier studies) was only a
temporary phenomenon; and that the higher aggregate growth rate of
1984-88 came from other sources.
Gang Fan Institute of Economics Chinese Academy of Social Sciences 2 Yuetan Beixiaojie Beijing 100836, CHINA Fax: 86-1-831-2473
Wing Thye Woo Department of Economics
University of California Davis, California 95616
U.S.A. Fax: 1-916-752-9382
JEL classification: 052, 121, 131, 134, 300

1
Section 1: Introduction
There are three dimensions to the economic reforms that China
has initiated since 1978: decentralization of the state sector;
diversification of ownership patterns1; and the opening of China to
international trade and investment. The result has been an
impressive acceleration of growth. National income2 grew at the
annual average of 7.0 percent in the 1975-79 period, 8.6 percent in
the 1980-84 period and 9.2 percent in the 1985-89 period, see Table
1.
The higher growth rates have come at the price of greater
macroeconomic instability, however. The annual average inflation
rare in 1985-89 was 12 percent compared with 4 percent in 1980-84 and
1 percent in 1975-79. The combination of fast growth and high
inflation caused China to suck in imports vigorously, turning the
current account surplus from 1.1 percent of GNP in 1980-84 to -1.7
percent in 1985-89. The government responded to the two
disconcerting trends of worsening inflation and deteriorating
external position by reducing credit expansion and budget deficits,
but it reversed policies whenever growth slowed down. The outcome
was a rather volatile pattern of output expansion.
The classic example of this stop-go posture of macroeconomic
management is the 1984-86 episode. The money supply (M2) grew 42
percent in 1984, and prices began rising quickly in 1985. The
1 This mainly refers to the development of non-state enterprises such as private and cooperative businesses in urban areas, and village and township enterprises in rural areas.
2 This is the only aggregate output measure that goes back beyond 1979. This is the standard socialist definition of national income not the international (IMF) definition.
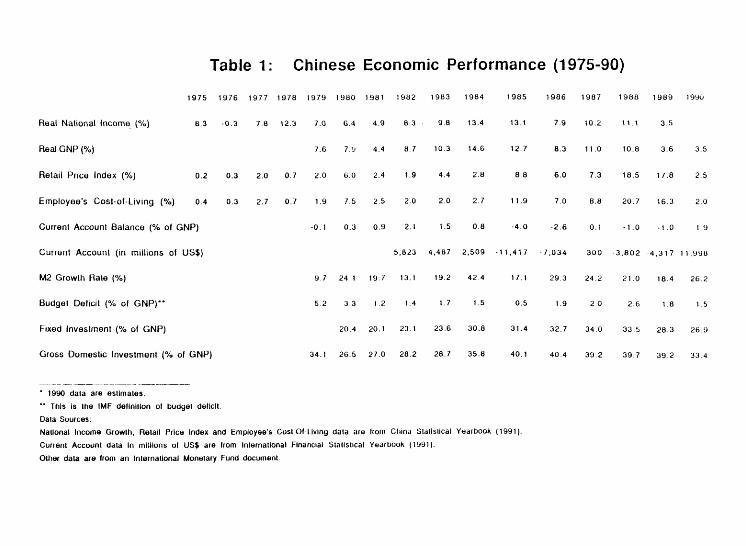
Table 1: Chinese Economic Performance (1975-90)
1975 1976 1977 1978 1979 1980 1981 1982 1983 1984 1985 1986 1987 1988 1989 1990
Real National Income (%) 8.3 -0.3 7.8 12.3 7.0 6.4 4.9 8.3 9.8 13.4 13.1 7.9 10.2 11.1 3.5
Real GNP (%) 7.6 7.9 4.4 8.7 10.3 14.6 12.7 8.3 11.0 10.8 3.6 3.5
Retail Price Index (%) 0.2 0.3 2.0 0.7 2.0 6.0 2.4 1.9 4.4 2.8 8.8 6.0 7.3 18.5 17.8 2.5
Employee's Cost-of-Living (%) 0.4 0.3 2.7 0.7 1.9 7.5 2.5 2.0 2 0 2.7 11.9 7.0 8.8 20.7 16 3 2 0
Current Account Balance (% of GNP) -0.1 0.3 0.9 2.1 1.5 0.8 -4.0 -2.6 0.1 -1.0 -1.0 1.9
Current Account (in mil l ions of US$) 5,823 4,487 2,509 -11,417 -7,034 300 -3,802 4,317 11,998
M2 Growth Rate (%) 9 7 24.1 19 7 13.1 19.2 42.4 17.1 29.3 24.2 21.0 18.4 26 2
Budget Deficit (% of GNP) ' * 5.2 3.3 1.2 1.4 1.7 1.5 0.5 1.9 2 0 2.6 1.8 1.5
Fixed Investment (% of GNP) 20.4 20.1 23.1 23.6 30.8 31.4 32.7 34.0 33.5 28.3 26.9
Gross Domestic Investment (% of GNP) 34.1 26.5 27.0 28.2 28.7 35.8 40.1 40.4 39.2 39.7 39.2 33.4
' 1990 data are estimates.
" This is the IMF definition of budget deficit.
Data Sources:
National Income Growth, Retail Price Index and Employee's Cost-Of-Living data are from China Statistical YearbooK (1991).
Current Account data In millions of US$ are from International Financial Statistical YearbooK (1991).
Other data are from an International Monetary Fund document

government reacted by slowing the money growth to 17 percent in 1985
and reduced the budget deficit to 0.5 percent of GNP from 1.5 percent
in 1984. The inflation rate dropped but it was accompanied by an
economic slowdown. The growth rate in 1986 was only 8 percent
compared with 13 percent in 1984 and 1985. The government then
relented on its tight macroeconomic policies, allowing the money
supply to grow by 29 percent and the budget deficit to widen to 2
percent of GNP. This loosening restored growth to 10.2 percent in
1987 but it also raised inflation to 7.3 percent, thus laying the
groundwork for the policy-induced economic crunches in 1989 and 1990.
We will argue in this paper that the observed stop-go phases of
the economy were neither the result of a deliberate stop-go style of
macroeconomic management nor the result of incompetent macroeconomic
management. Our explanation is that the institutional mechanisms
within the economic system created the go-phases, and that the stop-
phases occurred because these institutional mechanisms made it
difficult for contractionary economic policies to have a soft touch.
To paraphrase a well-known phrase among Chinese scholars and
policymakers,3 post-1979 China has found itself with the dilemma of
the economy leaping into chaos whenever macroeconomic control was
loosened, and plunging into deep recessions whenever macroeconomic
control was tightened.
We will trace the origin of this dilemma (and the rise in
inflation since 1978 and its acceleration after 1984) to the
decentralization reforms in the state sector. The brief for our case
3 "Yi zhua jiu si, yi fang jiu luan" — (the economy,) once gripped, is dead; and, once loosened, is unstable.
3
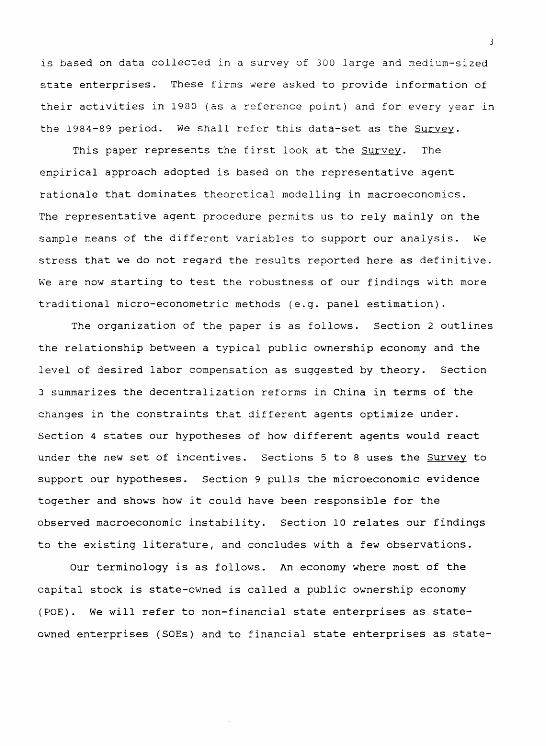
is based on data collected in a survey of 300 large and medium-sized
state enterprises. These firms were asked to provide information of
their activities in 1980 (as a reference point) and for every year in
the 1984-89 period. We shall refer this data-set as the Survey.
This paper represents the first look at the Survey. The
empirical approach adopted is based on the representative agent
rationale that dominates theoretical modelling in macroeconomics.
The representative agent procedure permits us to rely mainly on the
sample means of the different variables to support our analysis. We
stress that we do not regard the results reported here as definitive.
We are now starting to test the robustness of our findings with more
traditional micro-econometric methods (e.g. panel estimation).
The organization of the paper is as follows. Section 2 outlines
the relationship between a typical public ownership economy and the
level of desired labor compensation as suggested by theory. Section
3 summarizes the decentralization reforms in China in terms of the
changes in the constraints that different agents optimize under.
Section 4 states our hypotheses of how different agents would react
under the new set of incentives. Sections 5 to 8 uses the Survey to
support our hypotheses. Section 9 pulls the microeconomic evidence
together and shows how it could have been responsible for the
observed macroeconomic instability. Section 10 relates our findings
to the existing literature, and concludes with a few observations.
Our terminology is as follows. An economy where most of the
capital stock is state-owned is called a public ownership economy
(POE). We will refer to non-financial state enterprises as state-
owned enterprises (SOEs) and to financial state enterprises as state-

4
owned banks (SOBs).
Section 2: Public Ownership and Labor Compensation
In a pure POE, the national income (Y) is distributed as
personal income (W, wages and other payments to individuals) and
state revenue (T, taxes, profit remittances and the retained profits
of the state enterprises). Because of the institutional absence of a
capital market and the presence of a state-run social security
program, capital accumulation (I, investment) is the sole
responsibility of the state. For simplicity, we will limit our
theoretical discussion to the case where government consumption is
small and the state budget is balanced, i.e investment (I) equals
state revenue (T), and consumption (C) equals personal income (W).
One key characteristic of all existing forms of POE is that they
actively seek to minimize differences in the personal income of
workers in different firms. The result is that the effective rate of
taxation and the absolute amount of taxation differ vastly across
firms.4
Suppose that the state, acting as the Agent of Public Ownership,
solves the social welfare maximization problem and finds the optimal
I to be I* and the optimal C to be C*. We define
d* = I*/C* (the optimal distribution of expenditure)
= T*/W* (by assumption)
We recognize three reasons why managers and workers in a POE
will an investment-consumption ratio dc that is smaller than d*. The
4 Even after a decade of decentralization, the Chinese planning agency still set the wage standard for the whole country, and many regulations are in place to implement it.

first reason is that these individuals see investments as "public
goods" from which everyone would benefit but to which no one would
like to make contributions. This "free-rider" aspect of capital
accumulation is peculiar to a POE. It is only in such a setting that
an ordinary investment that generates no positive technological
externalities has the broad social benefit of a public good.
The second reason comes from the inequity felt by the big
contributors to state revenue. They correctly perceive that the
government will use the state revenue to benefit others (including
government officials), so they will attempt to consume as much of
their output as possible in order to minimize the profits that the
state can tax.5.
The third reason for the proclivity to over-consume comes
from the special institutional arrangements of a POE. In practice, a
portion of the personal income received by the individuals in the POE
comes from the return on capital.6 This capital income, however, is
not given to an individual as "returns on capital" (profits or
dividends), but lumped in as part of "returns on labor". As a
result, in the eyes of individuals, the return on labor is higher and
the return to capital lower than they are in fact. In other words,
individuals perceive a production function that differs from the true
one. This kind of distorted perception leads individuals to discount
the contribution of capital accumulation to growth and therefore to
5 As will be pointed out, this tendency would weaken with decentralization which allows an SOE to keep a larger portion of the return to capital.
6 This is entirely appropriate since all individuals are equal co-owners of the capital stock.
6
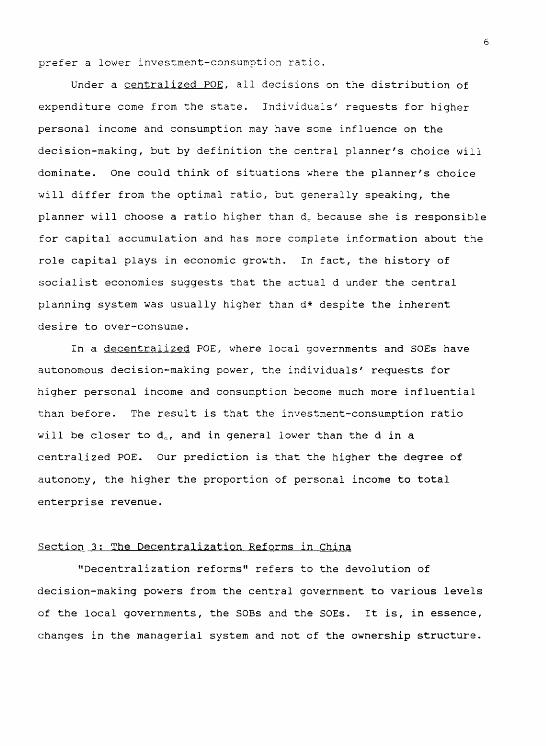
prefer a lower investment-consumption ratio.
Under a centralized POE. all decisions on the distribution of
expenditure come from the state. Individuals' requests for higher
personal income and consumption may have some influence on the
decision-making, but by definition the central planner's choice will
dominate. One could think of situations where the planner's choice
will differ from the optimal ratio, but generally speaking, the
planner will choose a ratio higher than dc because she is responsible
for capital accumulation and has more complete information about the
role capital plays in economic growth. In fact, the history of
socialist economies suggests that the actual d under the central
planning system was usually higher than d* despite the inherent
desire to over-consume.
In a decentralized POE, where local governments and SOEs have
autonomous decision-making power, the individuals' requests for
higher personal income and consumption become much more influential
than before. The result is that the investment-consumption ratio
will be closer to dc, and in general lower than the d in a
centralized POE. Our prediction is that the higher the degree of
autonomy, the higher the proportion of personal income to total
enterprise revenue.
Section 3: The Decentralization Reforms in China
"Decentralization reforms" refers to the devolution of
decision-making powers from the central government to various levels
of the local governments, the SOBs and the SOEs. It is, in essence,
changes in the managerial system and not of the ownership structure.
7
There were two stages in the decentralization of the Chinese
state industrial sector. The first stage was from 1979 to 1984. The
"fiscal responsibility system" was adopted to reshape central-local
fiscal ties. Local governments at various levels were given greater
autonomy in making decisions concerning local economic development
(see Wong, 1987 and 1991).
The bonus system was introduced to provide incentives for
workers in SOEs to improve labor productivity. Other than this,
little discretionary power was given to the enterprises.
The second stage of the decentralization program was from 1984
to 1989. SOEs started operating under the "contract responsibility
system." An SOE would enter into a contract with the state (the
owner) that would specify the amounts (instead of "rates") of taxes
and profits that it would pay each period. In return, the SOE would
have much greater autonomy in production mix, production level, labor
compensation, investment, and use of the retained profits.
The local banks began playing a more important role in 1983 when
the state stopped providing circulating capital to the SOEs and gave
this function to the SOBs. At the same time, SOBs were allowed to
make long-term investment loans. (The state continued to be a source
of investment funds, albeit decreasing in importance over time.) The
big institutional change occurred in 1984 when the local banks were
granted greater autonomy in their loan decisions.
However, the administrative structure of the financial system
remained unchanged. A local bank was still required to promote the
development of the local economy and subordinate itself to the local
government's "guidance". It was common for a local bank to have

8
various administrative ties with the local government, and for the
manager of the local bank to be appointed on the basis of the local
government's recommendation or approval.
Section 4: The Macroeconomic Consequences of the Decentralization
Reforms
To understand the relationship between inflation and the
decentralized system (in which the local governments, the SOEs and
the SOBs have been given wide autonomy) we need to understand the
behavior of these decentralized units.
When an SOE is simply viewed from the supply side, the expansion
of autonomy could result in some improvements in economic efficiency
(though perhaps only in the short-term). But an SOE is also in the
position to use public resources, including borrowed financial
resources, to claim a larger share of the national income. SOEs are
not only suppliers of goods, they are also demanders for goods. With
the expansion of enterprise autonomy, an SOE is in a better position
to realize its inherent proclivity to over-consume.
The circumstances are such that an SOE perceives that it could
increase both present and future consumption without any tradeoff
between them! The increases in future consumption are to be
guaranteed by enlarging present investment spending. The reason why
an SOE sees itself as being able to raise consumption and investment
spending simultaneously is because it is now not only allowed to
retain more of the profits but it is also more likely to be able to

9
increase its bank liabilities.7
This second source of funds comes from the greater autonomy of
the local governments and local banks. Although the credit quotas
set by the central financial authority were pretty much left intact
by the 1978-89 reforms, the local banks after 1984 faced greater
incentives and pressures to expand credit beyond their quotas. The
incentives follow from the fact that the personal incomes of the
local banks became dependent on the volume of their lending, and the
overall prosperity of the local economy. The pressures come from the
local governments who are often co-investors of the local SOEs and
who also oversee the management of the local SOBs.
This confluence of self-interest and external pressures resulted
in many SOBs not only ignoring the credit quotas when they had excess
reserves but also resorting to ingenious ways to "squeeze" more
reserves from the central bank. A common method was to lend to local
enterprises the funds designated for projects in the central plan.
When a centrally-directed project began to draw on its centrally-
allocated credits, the local bank would present the central bank with
the dilemma of supporting or stopping the fulfillment of the central
plan. The usual central bank response was to provide more credit to
enable the completion of the central plan projects.
Another common way of squeezing the central bank for funds was
to present the central bank with the fait accompli that the local
bank had extended credits beyond its reserve base. Since many banks
were doing this, the central bank opted for accommodation rather than
Section 8 will give additional reasons for the SOEs' proclivity to over-invest.

10
closure.8
It is this combination of actions by the local governments, SOEs
and local banks that has raised aggregate demand continuously and
caused inflation to accelerate since 1984.
The Survey easily found evidence consistent with the inherent
tendency to over-consume. In response to the question:
"How much pressure are you under from the workers to increase their income in various forms?"
30 percent of the enterprise managers said that they were under very
high pressure, 43 percent under quite high pressure, 21 percent under
moderate pressure, 5 percent under little pressure and 1 percent felt
no pressure.
This finding, of course, cannot be taken to be unique to the
decentralized socialism in China. Economics assumes as a matter of
course that utility-maximizing agents everywhere desire ever-
increasing wage compensation, and make their desire clear to their
bosses in a manner that is consistent with continued employment.
However, wishing for higher labor compensation and getting it are two
different things. We shall show that SOE personnel in China have
been extremely successful in realizing their desire. This may
explain why the government has responded with many regulations in the
1980s to control wage compensation. Our evidence will suggest that
SOEs have been able to skirt these regulations by increasing other
forms of personal income.
We define personal income to consist of cash income and income
8 Our conclusion that the banks have gotten less prudent is shared by Bowles and White (1989) who wrote that "after eight years of reform,....the credit constraint may have become softer" (p.487-488).

11
in kind, or direct income and indirect income, respectively.
Section 5: The Effects on Direct Income
Cash (direct) income is the sum of the basic wage and the
different types of bonuses. Table 2 shows that the direct income of
workers increased by 117 percent over the 1984-88 period, while
output increased only 59 percent. Cash income rose because of the
near doubling of the basic wage and near tripling of the bonus. This
caused a significant rise in the real level of direct labor
compensation because the rise in direct income exceeded the rise in
the retail price level by 7 to 15 percentage points every year. The
rise in net output value on the other hand exceeded the inflation
rate by only 1 to 5 percentage point.9
It is noteworthy that direct labor compensation continued
growing in real terms when real profits fell in 1987 and 1988 (see
Part B of Table 2). Real direct income of SOE personnel rose 8
percent and 10 percent respectively, while real total profits fell 38
percent and 8 percent respectively.
The point that clearly emerges from Table 3 is that the big
increases in direct labor compensation occurred not only because of
the introduction of bonuses but also because of the financial
decentralization. Bonuses were introduced in 1979, and they were
dispensed so generously that a bonus tax was introduced in 1984 to
discourage SOEs from giving big bonuses. An annual bonus of up to 4
months of basic wages was exempted from the bonus tax; but a fifth
9 It was negative in 1986 and 1988 if the cost of living index were used instead.
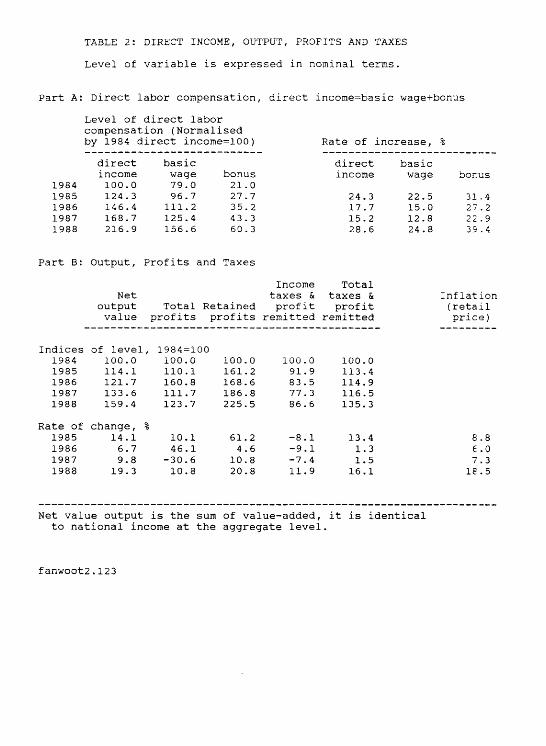
TABLE 2: DIRECT INCOME, OUTPUT, PROFITS AND TAXES
Level of variable is expressed in nominal terms.
Part A: Direct labor compensation, direct income=basic wage+bonus
Level of direct labor compensation (Normalised by 1984 direct income=100)
Part B: Output, Profits and Taxes
Rate of increase,
1984 1985 1986 1987 1988
direct income 100.0 124.3 146.4 168.7 216.9
basic wage 79.0 96.7 111.2 125.4 156.6
bonus 21.0 27.7 35.2 43.3 60.3
direct income
24.3 17.7 15.2 28.6
basic wage
22.5 15.0 12.8 24.8
bonus
31 .4 27.2 22 .9 39.4
Indices 1984 1985 1986 1987 1988
Rate of 1985 1986 1987 1988
Net output value
of level 100.0 114.1 121.7 133.6 159.4
change, 14.1 6.7 9.8 19.3
Total profits
Retained profits
, 1984=100 100.0 110.1 160.8 111.7 123.7
% 10.1 46.1
-30.6 10.8
100.0 161.2 168.6 186.8 225.5
61.2 4.6
10.8 20.8
Income taxes & profit
remitted
100.0 91.9 83.5 77. 3 86.6
-8.1 -9.1 -7.4 11.9
Total taxes & profit
remitted
100.0 113.4 114.9 116.5 135.3
13.4 1.3 1.5 16.1
Inflation (retail price)
8.8 6.0 7.3 18.5
Net value output is the sum of value-added, it is identical to national income at the aggregate level.
fanwoot2.123

TABLE 3: DISTRIBUTION OF NET OUTPUT VALUE (VALUE-ADDED)
direct income
retained profits
total taxes & profits
remitted
pre-tax debt
service deducted
from profits others
net output value
Part A: Share of Net Output Vale,
1980 1984 1985 1986 1987 1988
Part B:
1984 1985 1986 1987 1988
11.6 11.7 12.7 14.0 14.7 15.9
Level of
100.0 124.4 146.3 168.7 216.9
4.5 11.2 15.9 15.6 15.7 15.9
each item,
96.3 155.3 162.4 179.9 217.2
78.3 66.3 65.9 62.9 57.8 56.3
normalised
568.6 644.7 656.2 662.6 769.3
0.7 3.6 5.4 5.4 6.0 4.3
by 1984
30.9 53.0 56.7 68.2 58.7
4.9 7.2 0.1 2.1 5.8 7.7
direct income =100
61.8 1.1 22.1 66.5
105.4
857.6 978.4 1043.7 1145.8 1367.5
Part C: Rate of Change, %
1985 1986 1987 1988
24.4 17.7 15.3 28.6
61.2 4.6
10.8 20.7
13.4 1.8 1.0 16.1
71.8 6.9
20.3 -14.0
-98.3 1956.0 200.3 58.6
14.1 6.7 9.8
19.3

12
month bonus would require the SOE to pay a 100 percent bonus tax, a
sixth month bonus would be subject to a 200 percent bonus tax, a
seven month bonus would be subject to a 300 percent bonus tax, and so
forth.
But in retrospect, the 1979-84 bonuses granted in the absence of
the bonus tax were still quite restrained. The share of direct
income in net output value in 1984 was virtually identical to that in
1980. When wide financial autonomy was given to the SOEs in 1984,
the share of direct income rose from 12 percent in 1984 to 16 in 1988
despite the presence of the steeply progressive bonus tax, see Table
3.
Section 6: The Effects on Indirect Income
There were three components to the indirect income received by
SOE personnel: collective consumption, distribution of private
consumer goods, and housing. The first two items were treated as
production costs and the third as investment expenditure.
Collective consumption came from the myriad services supplied by
the SOEs to their employees. The range of services provided was so
broad that an SOE resembled a self-contained social community:
kindergartens, hospitals, transportation, recreational facilities,
dining facilities, funeral facilities and relief work. The welfare
fund paid for all these services. The size of the welfare fund
allowed by state regulations was proportional to the amount of cash
income (wages plus bonuses) and retained profits. The (perhaps
unintended) result of the higher labor costs was that fewer profits
were remitted to the state. Our sample showed a 240 percent increase
13
in the size of the welfare fund over the 1984-88 period, a finding
consistent with the large increases in cash income and retained
profits documented in Table 2 and 3.
The distribution of consumer goods occurred at two levels: the
common level and the elite level. It took place at the common level
in order to avoid the bonus tax. Many SOEs bought grain, fruits,
meat, eggs, fish, clothes, furniture and housewares and distributed
them to the employees. The costs of these items were charged mostly
to 'material costs' and 'non-production expenditure.' This is part
of the reason why the former rose 82 percent in the 84-88 period and
the latter 234 percent — see Part A of Table 4. Studies by Zhang
(1990) and Zhao (1989) suggest that the distribution of consumer
goods accounted for 25 to 33 percent of the total personal income of
SOE employees.
The distribution of consumer goods at the elite level was mainly
in the management office and the sales department. Consumption took
the form of lavish banquets, tourist travel, high-class hotels,
luxurious official cars and expensive office furniture. The Survey
showed that net management cost rose 165 percent in 1984-88, and
sales cost rose 300 percent — see Part A of Table 4. Management
costs expressed as a proportion of the "GNP"10 of the sample rose
steadily as well: 2.8 percent in 1980, 3.9 percent in 1984, 4.4
percent in 1985, 4.8 percent in 1986, 5.4 percent in 1987 and 5.9
percent in 1988.
The third component of the indirect income paid by SOEs was
housing. SOEs used a significant portion of the retained profits to
"GNP" equals net output value plus capital depreciation.

TABLE 4: SOURCES OF INDIRECT INCOME
Part A: Indices of non-wage cost (1984=100, average of 300 enterprises;
1984
1985
1986
1987
1988
Net output value
100.00
114.08
121.70
133.60
159.45
Total cost
100.00
120.62
139.37
161.20
189.16
Total production cost
100.00
121.34
139.69
158.13
190.61
Material cost*
100.00
120.75
135.48
151.51
181.64
Net management cost**
100.00
129.58
159.43
204.13
265.03
Sales cost
100.0
157.00
178.15
263.80
403.27
Net Non-production expenditure***
100.00
92.92
141.24
226.11
333.73
Part B: Composition of Capital Stock (average of 300 enterprises)
Total Value of Fixed Assets at original book value ('000 Rmb.)
1980
1984
1985
1986
1987
1988
59357,
80851.
87448,
98370.
112243,
120307.
.0
,5
.8
.9
.9
.0
Total Value of Productive Fixed Assets
('000 Rmb.)
50421.5
67474.6
71432.1
81050.9
91230.8
97047.7
Total Value Proportion of of Non-productive Non-productive Fixed Assets Assets to
Total Assets ('000 Rmb)
8935.5
13376.9
16016.7
17320.0
21013.1
23259.3
(%)
15.1
16.5
18.3
17.6
18.7
19.3
* = Expenditure on raw materials, intermediate goods and energy. ** = Total management cost - cost for new product research -
technological research cost - training cost. *** = Total non-production expenditure - labor insurance - expenditure
on enterprise-run schools.
fanwoot4.wp

build apartments (and physical structures for kindergartens and
employees club) and rented them to their workers at low rates that
would cover only maintenance costs. This diversion of investment
funds is clearly seen in Part B of Table 4. The value of non
productive fixed assets increased 160 percent in the 1980-88 period,
while the value of productive fixed assets increased only 92 percent.
The upshot was that the proportion of non-productive fixed assets to
total fixed assets went up from 15 percent in 1980 to 19 percent in
1988.
Section 7: The Effects on Labor Productivity. Retained Profits and
State Revenue
Table 2 shows that there was an 8.7 percent increase in the real
net output value over the 1984-88 period. Although this is not very
impressive growth, it is still tempting to argue that the generous
increases in personal income were necessary to induce this positive
output growth. But this is a hard argument to make because there
were extremely large investments over this period. The real stock of
productive capital in 1988 was 35 percent larger than in 1984.11 As
there is no reason to believe that this additional capital stock was
left unused, this massive infusion of capital rather than increases
in labor efficiency was responsible for the output growth.
Assuming constant returns to scale technology and a capital
11 This is calculated from adding the deflated incremental changes in the productive capital stock, see Table 4 for nominal stock figures. The deflator used was the retail price level.

15
share of income that was 3 0 percent12, we would expect an output
growth of 10.5 percent. But since the actual output growth was only
8.7 percent, this suggests either negative growth in total factor
productivity or that labor efficiency might have actually fallen in
the 1984-88 period! In either case, it indicates serious problems in
the SOEs. If we were to use the finding of Chen, Wang, Zheng,
Jefferson and Rawski (1988) that the share of capital income is 0.54
under the Cobb-Douglas specification of the production function, and
0.72 under the translog specification, then the SOE situation is
simply calamitous.
Our conclusion is that the 45 percent increase in real cash
income in 1984-88 did not induce any noticeable gains in labor
efficiency. We also conclude, in light of the survey finding that
over 70 percent of managers faced strong workers' pressure for higher
pay, that the explanation for the large real personal income gains is
that the managers caved in to the consumption demands of the workers.
The decentralization reforms gave the managers the financial room to
cave in.
Tables 2 and 3 show that the total taxes paid and profits
remitted to the state by SOEs fell as a proportion of net output
value: from 78 percent in 1980, to 66 percent in 1984 and 56 percent
in 1988. This fall in proportion was, of course, expected; this is
the essence of decentralization. What might not have been expected,
however, was the drop in the amount of real resources transferred
from the SOEs to the state. Inflation exceeded the increase in taxes
12 This figure is reasonable by international standards. Alternatively, we can assume Cobb-Douglas technology where the exponent of the capital variable is 0.3.
16
and profits received by the state by 5 percentage points in 1986, 6
percentage points in 1987 and 2 percentage points in 1988, see Part B
of Table 2.
There were five reasons for this decline in the real revenue
from the SOEs. The first reason was the economic slowdown in 1986
that helped to decrease nominal profits by 31 percent in 1987.
The second reason came from the change in 1985 when centrally-
allocated investment grants to SOEs were replaced by investment
loans. SOEs were allowed to deduct the debt services as cost, hence
reducing the amount of profits to be taxed. The debt service went
from 1 percent of net output value in 1980 to 6 percent in 1987
before falling to 4 percent in 1988, see Part A of Table 3.
The third reason for the decline in revenue from SOEs was the
large increases in direct labor compensation which further decreased
total profits. Direct income absorbed 16 percent of net output value
in 1988 compared to 12 percent in 1980.
The fourth reason was the large increases in indirect labor
compensation that raised production costs and hence reduced profits.
The misdirection of investment funds into housing meant that output
and profits would not increase in the future.
The fifth reason was the increasingly large proportion of
profits being retained by SOEs. They retained 5 percent of profits
in 1980, 11 percent in 1984 and 16 percent in 1988 (see Part A of
Table 3). The result was that the amount of retained profits
increased 126 percentage over the 1984-88 period.
Our point is that decentralization has weakened the fiscal base
of the central government without necessarily achieving the desired
17
goal of rationalizing the allocation of investment spending. A
significant portion of what would have been state revenue was
diverted into consumption and non-productive investments.
Furthermore, the decline in real state revenue from the SOEs
exacerbated the budget deficit, and, consequently, the printing of
money.
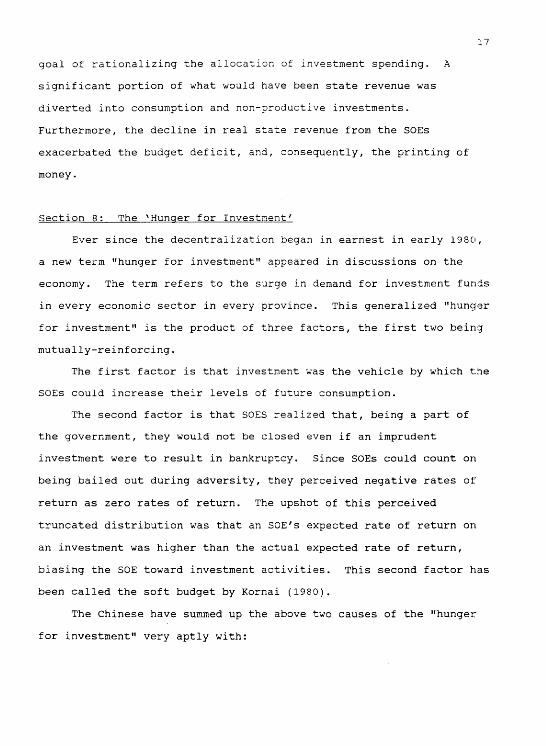
Section 8: The 'Hunger for Investment'
Ever since the decentralization began in earnest in early 1980,
a new term "hunger for investment" appeared in discussions on the
economy. The term refers to the surge in demand for investment funds
in every economic sector in every province. This generalized "hunger
for investment" is the product of three factors, the first two being
mutually-reinforcing.
The first factor is that investment was the vehicle by which the
SOEs could increase their levels of future consumption.
The second factor is that SOES realized that, being a part of
the government, they would not be closed even if an imprudent
investment were to result in bankruptcy. Since SOEs could count on
being bailed out during adversity, they perceived negative rates of
return as zero rates of return. The upshot of this perceived
truncated distribution was that an SOE's expected rate of return on
an investment was higher than the actual expected rate of return,
biasing the SOE toward investment activities. This second factor has
been called the soft budget by Kornai (1980).
The Chinese have summed up the above two causes of the "hunger
for investment" very aptly with:

18
"The losses of SOEs are socialized but the profits of SOEs are privatized."
The third factor behind the "hunger for investment" is the
career considerations of the SOE manager. She realizes that her
promotion to a larger SOE would be helped if she has a record of
engineering large expansion in output, and adding production capacity
is one sure way of doing so. As long as credit can be gotten, the
additional investment will not occur at the expense of employee
consumption. In fact, it would be optimal if she could get a loan
larger than the investment. She could then use the extra funds for
employee (and self) consumption to solidify her popularity with
them — a reputation that, according to Walder (1988), will stand her
in good stead during promotion deliberations. The revelation is that
the career considerations of the SOE manager bias her toward over
investment and over-consumption.
Table 5 presents evidence of the "hunger for investment." Part
A shows that the proportion of loan applications by SOEs that was
approved fell steadily in the 1987-89 period.13 In 1988, only 20
percent of firms got 75-100 percent of their loan applications
approved compared to 65 percent in 1986. The main reason for the
"tougher" acceptance criteria was that the number of loan
applications multiplied even faster than (what we shall see) the
explosion of bank credit.
Part B of Table 5 reports the managers' response to the
13 The original draft of the Survey questionnaire had asked for the amount of investment funds applied for in each year. On the advice of the State Statistical Bureau (SSB), this question was changed to ask the number of projects that were proposed and the number that were funded. The SSB felt that managers would not remember the value of the projects denied.
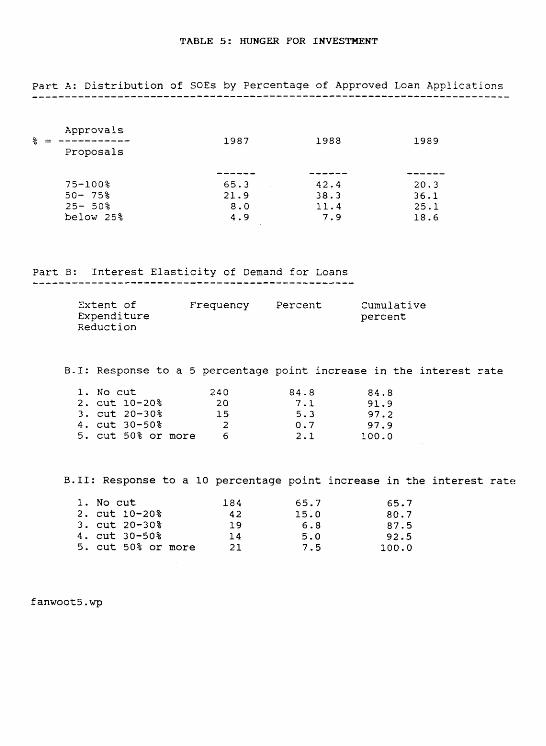
TABLE 5: HUNGER FOR INVESTMENT
Part A: Distribution of SOEs by Percentage of Approved Loan Applications
Approvals
% = 1987 1988 1989 Proposals
75-100% 65.3 42.4 20.3 50- 75% 21.9 38.3 36.1 25- 50% 8.0 11.4 25.1 below 25% 4.9 7.9 18.6
Part B: Interest Elasticity of Demand for Loans
Extent of Frequency Percent Cumulative Expenditure percent Reduction
B.I: Response to a 5 percentage point increase in the interest rate
1. No cut 240 84.8 84.8 2. cut 10-20% 20 7.1 91.9 3. cut 20-30% 15 5.3 97.2 4. cut 30-50% 2 0.7 97.9 5. cut 50% or more 6 2.1 100.0
B.II: Response to a 10 percentage point increase in the interest rate
1. No cut 184 65.7 65.7 2. cut 10-20% 42 15.0 80.7 3. cut 20-30% 19 6.8 87.5 4. cut 30-50% 14 5.0 92.5 5. cut 50% or more 21 7.5 100.0
fanwoot5.wp

19
question:
"How much would you reduce your demand for loans if the interest rate were to increase by 5 to 10 percentage
points?
The average interest rate for loans in this period was about 12
percent.
The Survey indicates that the interest rate elasticity of loans
was very low. 8 5 percent of managers would not change the amount of
investment they would undertake if the interest rate were to increase
by 5 percentage points, and 65 percent would still not change their
investment plans if the rise were 10 percentage points instead.
The flip-side of the earlier discussion of the increase in
consumption is that the amount of internal funds available for
investment have fallen; and the flip-side of the discussion on the
increased provision of low-rent housing is that the internal funds
available for productive investment has fallen further. The
interesting issue is how this decentralization-generated "hunger for
investment" was accommodated as decentralization reduces the
availability of SOE funds. The answer lay in the institutional
character of the financial system discussed in Section 4. The
combination of profit motive on the part of the local banks and the
local development motive on the part of the local governments led to
the bulk of the demand for funds being accommodated by the expansion
of bank credit.
Table 6 details the sources of investment funds. The amount of
internal funds available for investment (naturally) increased with
the decentralization reforms. It went up by a factor of 2 in the
1984-88 period, see item (2). What is remarkable is that the amount

Table 6: Sources of Investment Funds
(average of 300 SOEs)
1980 1984 1985 1986 1987 1988
(1) Index of total investment 70.09 100.00 141.42 186.25 277.68 322.10
(2) Index of internal funds available for investment 47.43 100.00 158.24 184.64 233.68 229.11
(3) Internal funds as % of total investment 26.01 36.72 41.09 36.40 30.907 26.12
(4) Internal funds as % of total productive investment 24.97 37.51 35.73 33.07 31.03 26.68
(5) Internal funds as % of total nonproductive investment 61.85 71.71 68.37 63.40 52.80
(6) Index of total external funds available * for investment 100.00 142.51 170.55 239.67 370.01
(7) External funds as % of total investment ** 56.01 41.07 41.38 37.60 35.44 47.18
(8) Index of state grants for investment 100.00 114.35 150.20 281.32 165.90
(9) State grants as % of total investment 57.33 18.10 13.30 13.42 18.40 9.39
(10) State grants as % of investment in productive capital 64.71 21.48 16.15 15.44 20.93 10.57
(11) Index of bank borrowing for investment *** 100.00 160.62 183.64 212.88 501.28
(12) Bank borrowing as % of total investment 5.33 24.99 28.38 24.65 19.17 38.90
(continued next page)

Notes to Table 6
* "External funds" is the sum of state grants from governments at all levels and bank loans, and does not include funds from unspecified "other sources". The "state grants" include those grants distributed through banks as loans.
** The sum of shares of "Internal funds" and "External funds" does not equal 100% because it does not include the share of funds from unspecified "other sources".
*** "Borrowing" here refers to true banking loans, and does not include state grants distributed in the form of loans.
fanwoot6.wp

20
of external funds increased even more rapidly: it rose by a factor of
four, see item (6). The amount of external funds literally exploded
in 1988, raising the ratio of external to internal funds from 1 in
1987 to 2 (see items (3) and (7)). Another indicator that easy bank
credit was responsible for the three-fold jump in investment spending
over the 1984-88 is the rise in the ratio of bank lending to total
investment, particularly in 1988 (see items(l) and (12)).
The result of this easy bank credit was the boom in productive
(physical capital) investment and non-productive (housing)
investment, as evidenced by internal funds being able to cover less
and less of the investments in each category over time (see items (4)
and (5)).
Section 9: The Effects at the Aggregate Level
The evidence in Sections 5 to 8 reveals two routes through which
the individual optimizing behavior of the SOEs resulted in expansion
of the money supply. The first route went from the increases in
labor compensation to the widening of the budget deficit, a large
proportion of which was immediately monetized. Our finding that the
amount of real resources transferred to the state fell in the 1986-88
period has its parallel at the aggregate level: total real government
revenue fell throughout the 1986-89 period, see Part C of Table 7.
What widened the budget deficit was that total expenditure
growth did not slow down to be in line with the slower revenue
growth. The proportion of expenditure that could be covered by
revenue fell from 94 percent in 1984 to 90 percent in 1989. One
major reason that expenditure growth could not be reduced was that

TABLE 7: GOVERNMENT REVENUE AND EXPENDITURE
total price enterprise total meno revenue subsidies subsidies expenditure items
budget Part A: Levels (billions of yuans) deficit
1978 124.8 1.1 11.5 123.7 -1.0 1979 126.4 7.9 11.7 147.0 20.6 1980 130.1 11.8 14.1 147.1 17.1 1981 130.2 15.9 12.6 140.1 9.9 1982 140.9 17.2 19.7 152.2 11.3 1983 160.7 19.7 24.0 173.0 12.3 1984 184.3 21.8 20.0 196.5 12.2 1985 229.7 26.2 25.9 236.5 6.8 1986 244.7 25.7 32.5 265.6 20.9 1987 257.6 29.5 37.6 282.5 24.9 1988 280.4 31.7 44.7 315.3 34.9 1989 324.5 37.0 60.0 361.4 37.0
Part B: Proportion of Total Expenditure, % 1978 100.8 0.9 9.3 1979 86.0 5.4 7.9 1980 88.4 8.0 9.6 1981 93.0 11.4 9.0 1982 92.6 11.3 12.9 1983 92.9 11.4 13.9 1984 93.8 11.1 10.2 1985 97.1 11.1 10.9 1986 92.1 9.7 12.2 1987 91.2 10.4 13.3 1988 88.9 10.1 14.2 1989 89.8 10.2 16.6
inflation Part C: Growth Rate, % (retail)
1979 1.3 613.5 1.3 18.8 2.0 1980 2.9 48.6 20.5 0.1 6.0 1981 0.1 35.4 -10.2 -4.8 2.4 1982 8.2 8.0 55.8 8.7 1.9 1983 14.0 14.6 21.8 13.6 4.4 1984 14.7 10.6 -16.7 13.6 2.8 1985 24.7 19.9 29.5 20.4 8.8 1986 6.5 -1.8 25.5 12.3 6.0 1987 5.3 14.8 15.9 6.4 7.3 1988 8.8 7.5 18.6 11.6 18.5 1989 15.7 16.7 34.3 14.6 17.8
The Chinese definition of Total Revenue was adjusted to exclude borrowing, and include price subsidies (until 1985) and enterprise subsidies.
The Chinese definition of Total Expenditure was adjusted to include price subsidies (until 1985) and enterprise subsidies. We ignored
principal repayments and extra-budgetary capital construction as they are small items.
These adjustments made the concepts closer to the IMF definitions.
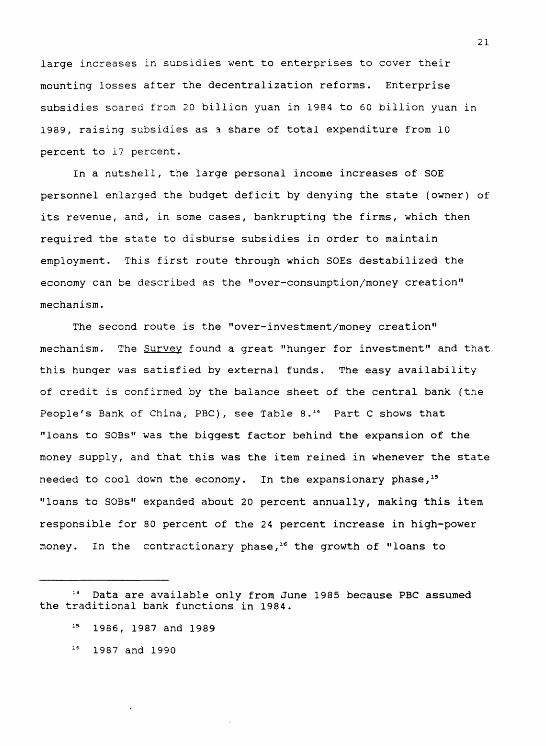
21
large increases in subsidies went to enterprises to cover their
mounting losses after the decentralization reforms. Enterprise
subsidies soared from 20 billion yuan in 1984 to 60 billion yuan in
1989, raising subsidies as a share of total expenditure from 10
percent to 17 percent.
In a nutshell, the large personal income increases of SOE
personnel enlarged the budget deficit by denying the state (owner) of
its revenue, and, in some cases, bankrupting the firms, which then
required the state to disburse subsidies in order to maintain
employment. This first route through which SOEs destabilized the
economy can be described as the "over-consumption/money creation"
mechanism.
The second route is the "over-investment/money creation"
mechanism. The Survey found a great "hunger for investment" and that
this hunger was satisfied by external funds. The easy availability
of credit is confirmed by the balance sheet of the central bank (the
People's Bank of China, PBC), see Table 8.14 Part C shows that
"loans to SOBs" was the biggest factor behind the expansion of the
money supply, and that this was the item reined in whenever the state
needed to cool down the economy. In the expansionary phase,15
"loans to SOBs" expanded about 20 percent annually, making this item
responsible for 80 percent of the 24 percent increase in high-power
money. In the contractionary phase,16 the growth of "loans to
14 Data are available only from June 1985 because PBC assumed the traditional bank functions in 1984.
1986, 1987 and 1989
1987 and 1990

Table 8: Components of High-Power Money (1985-90)*
1985 1986 1987 1988 1989 Sept.90
Part A: Balance Sheet of the People's Bank of China.
(in billions of Yuan, end of period)
Foreign r e s e r v e 12.4 3.7 15.0 20.9 32.9 68.3
Loans to SOBs 224.9 269.4 277.4 338.8 420.7 440 3
Loans to SOEs 8.6 13 22.7 30.6 34.5 37.5
Loans to Gov't -9.3 58 20.8 30.5 24.7 37.0
Others -7.9 -9.3 -13.6 -15.3 - '11.1 -8.8
Total Assets 228.6 282.7 322.2 405.5 501.7 574.3
Liabilities to bank 96.4 120.1 127.4 145.4 208.1 2733
Currency in circulation 98.8 121.8 1454 213.3 234.2 229.8
Deposits 33.4 40.8 49.4 46.9 5 9 3 71.3
Total Liabilities 228.6 282.7 322.2 405.5 501.7 574.3
Part B: Change from preceding year(%)
Foreign Reserve -70 305 39 57.4 106
Loans to SOBs 19.8 3 22 24.2 4.7
Loans to SOEs 51.2 74.6 34.8 12.7 8.7
Loans to Gov't 163.4 259 46.6 -19 49.8
Others -17.8 -46 -12.5 27.5 20.7
High-power Money 23.7 14.0 25.9 23.7 14.4
Part C: Contribution of each component to high-power money growth rate
(in percentage points)
Foreign r e s e r v e -3.8 4.0 1.8 3.0 7.0
Loans to SOBs 19.5 2.9 19.0 20.2 3.9
Loans to SOEs 1.9 3.4 2.5 1.0 0.6
Loans to Gov't 6.7 5 4 3.1 -1.4 2.4
Others -0.6 -1.5 -0.5 0.9 0.5
High-Power Money Growth (%) 23.7 14.0 25.9 23.7 14.4

22
SOBs" would be reduced to about 4 percent, and, given its large share
in the composition of high-power money, this would lower high-power
money growth to about 14 percent.
The primary importance of "loans to SOBs" to overall credit
availability supports our story of macroeconomic instability
originating from local firms being helped in their guest for capital
formation by the local banks. The incentives for over-investment at
the firm level are clear, and what Table 8 has confirmed is that the
local banks were able to sgueeze the central bank for more reserves.
The decomposition of GDP growth in the 1981-89 period confirms
our analysis, see Table 9. Consumption and investment spending leapt
forward with the decentralization reforms in 1984, 11 and 21 percent
growth respectively . However, with a given output capacity at any
point in time, the tendencies to over-consume and over-invest cannot
both be realized on a prolonged basis unless massive external
borrowing were to occur. Which tendency would dominate, and be seen
in the data, depends on the stance of monetary policy.
The 1984 change in the incentives to the financial system is the
reason why investment exceeded consumption as the leading expenditure
category in the 1985-87 period. The burst of bank credits in 1985
allowed domestic investment spending to contribute 11 percentage
points to the overall growth rate. The credit expansion allowed
investment to crowd out consumption in the competition for the use of
resources. This is why consumption grew only 3 percent in 1986.
However, with the reining in of credit in late 1988, the over-
consumption tendency asserted itself. Consumption grew 9 percent in
1989 despite the slowdown in GDP growth to 3 percent.
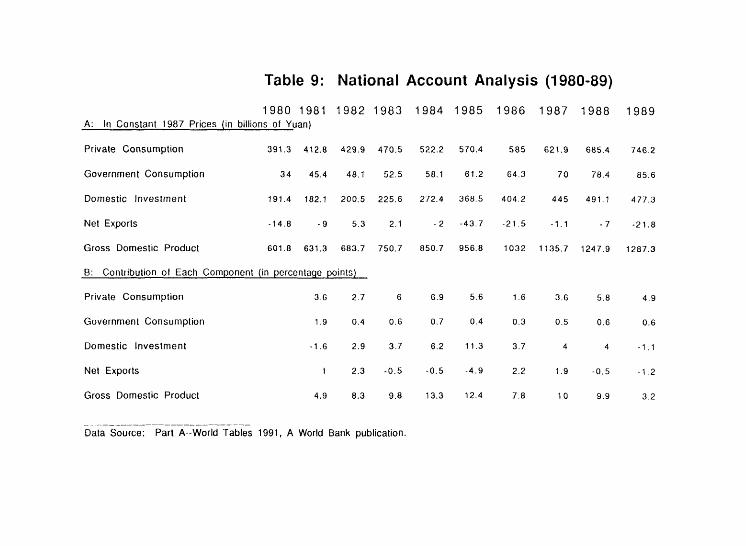
Table 9: National Account Analysis (1980-89)
1980 1981 1982 1983 1984 1985 1986 1987 1988 1989 A: In Constant 1987 Prices (in billions of Yuan)
Pr ivate C o n s u m p t i o n 391.3 412.8 429.9 470.5 522.2 570.4 585 621.9 685.4 746.2
Government Consumption 34 45.4 48.1 52.5 58.1 61.2 64.3 70 78.4 85.6
Domestic Investment 191.4 182.1 200.5 225.6 272.4 368.5 404.2 445 491.1 477.3
Net Exports -14.8 - 9 5.3 2.1 - 2 -43.7 -21 .5 -1 .1 - 7 -21.8
Gross Domest i c Produc t 601.8 631.3 683.7 750.7 850.7 956.8 1032 1135.7 1247.9 1287.3
B: Contribution of Each Component (in percentage points)
Private Consumption 3.6 2.7 6 6.9 5.6 1.6 3.6 5.8 4.9
Government Consumption 1.9 0.4 0.6 0.7 0.4 0.3 0.5 0.6 0.6
Domestic Investment -1.6 2.9 3.7 6.2 11.3 3.7 4 4 -1.1
Net Expor ts 1 2.3 -0 .5 -0.5 -4 .9 2.2 1.9 -0 .5 -1 .2
Gross Domestic Product 4.9 8.3 9.8 13.3 12.4 7.8 10 9.9 3.2
Data Source: Part A--World Tables 1991, A World Bank publication.

23
Section 10: Conclusions
We have provided what we deem to be reasonable evidence in
support of the "over-consumption/money creation" and the "over
investment/money creation" mechanisms. We argued that the
decentralization reforms have allowed the innate tendency to over-
consume and over-invest to realize themselves. The managers now have
the financial autonomy to accommodate the demands for higher personal
income and they have no incentive to resist. Furthermore, it is in
the interests of the local governments and local banks to help the
SOEs to attain credit they need to increase (local) output.
We found two results that are at odds with several recent
papers. The evidence in Section 5 and 6 suggested that the
increasing budget deficits were caused by the upward "wage drift" at
the enterprise level. Naughton (1991) is in agreement with us that
the budget deficit was due to lower revenue from the SOEs rather than
to deliberate expansionary fiscal policy. He differs from us in
claiming that the lower profits of the SOEs were caused by the
competition provided by the emergence of non-SOEs. By the logic of
Naughton's analysis, the deficit should be reduced by policing the
non-SOEs more strictly to prevent tax evasion and imposing a
consumption tax to regain the transfer given to the consumer through
the lower prices fostered by competition.
We have three problems with Naughton's explanation (in addition
to its being contradicted by the Survey data). The first is that
there are many heavy industries with rapidly falling profits that had
little or no entry by non-SOEs. The best examples are the steel
industry and the automotive industry.
24
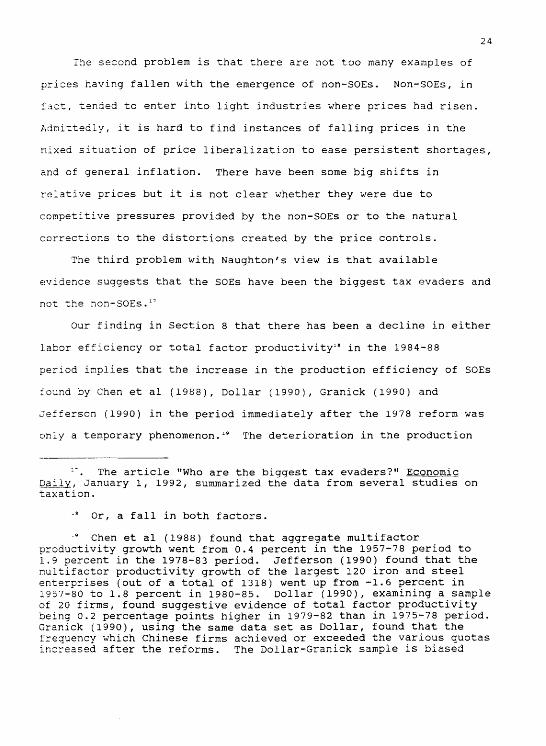
The second problem is that there are not too many examples of
prices having fallen with the emergence of non-SOEs. Non-SOEs, in
fact, tended to enter into light industries where prices had risen.
Admittedly, it is hard to find instances of falling prices in the
mixed situation of price liberalization to ease persistent shortages,
and of general inflation. There have been some big shifts in
relative prices but it is not clear whether they were due to
competitive pressures provided by the non-SOEs or to the natural
corrections to the distortions created by the price controls.
The third problem with Naughton's view is that available
evidence suggests that the SOEs have been the biggest tax evaders and
not the non-SOEs.17
Our finding in Section 8 that there has been a decline in either
labor efficiency or total factor productivity18 in the 1984-88
period implies that the increase in the production efficiency of SOEs
found by Chen et al (1988), Dollar (1990), Granick (1990) and
Jefferson (1990) in the period immediately after the 1978 reform was
only a temporary phenomenon.19 The deterioration in the production
'-'. The article "Who are the biggest tax evaders?" Economic Daily, January 1, 1992, summarized the data from several studies on taxation.
18 Or, a fall in both factors.
19 Chen et al (1988) found that aggregate multifactor productivity growth went from 0.4 percent in the 1957-78 period to 1.9 percent in the 1978-83 period. Jefferson (1990) found that the multifactor productivity growth of the largest 120 iron and steel enterprises (out of a total of 1318) went up from -1.6 percent in 1957-80 to 1.8 percent in 1980-85. Dollar (1990), examining a sample of 20 firms, found suggestive evidence of total factor productivity being 0.2 percentage points higher in 1979-82 than in 1975-78 period. Granick (1990), using the same data set as Dollar, found that the frequency which Chinese firms achieved or exceeded the various quotas increased after the reforms. The Dollar-Granick sample is biased

25
efficiency of the SOE sector in the second half of the 1980s is
supported by the research of Wang (1990)20 and Stepanek (1991).
Our explanation for why the productivity increase was not
sustained is that the managers bowed to egalitarian pressures and
discontinued the link between worker performance and bonus. The
workers realized over time that collective action was more "cost
effective" than mutual competition in securing a higher general level
of consumption. In fact, even the local industrial bureau could not
impose a link between firm performance and bonus. This is why
Jefferson and Xu (1991) found, in their sample of 20 SOEs in Wuhan
over the 1984-87 period, that there was "a convergence of returns to
labor . . .[despite] the relatively unreformed nature of labor
markets" (p. 63). The result of the discontinuation of the
performance-bonus link was that labor efficiency growth sputtered out
over time.
Our finding of poor SOE productivity performance in the 1984-88
is at odds with the claims of Jefferson and Xu (1991) and Groves,
Hong, McMillan and Naughton (1991).21 They found that labor
productivity was positively correlated with various indicators of
reforms (e.g. bonus payments, proportion of employees on contracts).
toward the best performing SOEs: three of their firms were among the ten firms that were selected in 1983 to receive "national awards for distinction in management" (Granick, p.13); and, "the sample enterprises were, throughout [1976 to 1982].., 40 to 120 per cent more profitable than were Chinese state-owned industrial enterprises as a whole" (Granick, p.180).
20 But we do not agree with Wang that this is the most important reason for why SOE profits fell and hence widened the budget deficit.
21 The data set used by Groves et al (1991) spanned 10 years, and the size of the sub-sample they used appears to be about 300.

The problem with the regressions in these two studies is that they do
not control for changes in the capital stock. We do not find it
plausible to assume that the labor productivity was unaffected by the
large amount of investment undertaken after 1984.
Our finding of no gain in the efficiency of SOEs in 1984-88
means that the increase in the aggregate growth rate during the 1985-
89 period must have come from the other sectors: the agricultural
sector, the non-SOE sector (private, collective, cooperative, town
and village enterprises) and the trade sector (enterprises in the
more outward-oriented coastal provinces in South China). To
attribute most of the increase in the growth rate to these other
sectors is not unreasonable. The SOEs are concentrated in the
industrial sector, and they now produce about 50 percent of the value
added there. The SOEs produce at most a third of today's GDP.
Since tolerance of the inflation generated by over-consumption
and over-investment cannot be justified by efficiency gains in the
SOEs, the way that monetary policy has been periodically used to
combat inflation is damning. One of the long-recognized favorable
side-effects of an economic slowdown is the sloughing off of the
layer of accumulated inefficient producers.22 But yet, during the
last two policy-induced economic slowdowns, the reduced amount of
credit available was channelled mostly to the SOEs, forcing many
efficient non-SOEs to close.23
22 Hence, Schumpeter's famous characterization of the cyclical downturn in the capitalist economy as a much-needed douching.
23 Oi (1991) provides an insightful account of how non-SOEs in the rural areas responded to the contractionary policies that began in 1989.
27
The chief lesson that we draw is that the SOEs must be
restructured if macroeconomic instability is to be reduced, and
economic growth to be enhanced. The question is whether any state
where the predominant mode of ownership is public can have the
political will to enforce tight budget constraints on SOEs. Kornai
(1991) is pessimistic on this question but Roemer (1991a and 1991b)
has recently proposed several novel mechanisms that might induce SOEs
to mimic the management practices of private firms.
As we mentioned at the beginning, this paper is only the first
look at the Survey. This first look has suggested that news of the
Chinese success story may have been greatly exaggerated. The claims
that China has successfully reformed its SOEs into efficient entities
evoke comparison with the claims made in the early 1970s that the
Chinese revolutionary strategy as manifested by the Cultural
Revolution has succeeded in creating the new socialist man. It is
with this historical lesson in mind that we are conducting the second
phase of our data analysis.

28
Reference
Bowles, Paul and Gordon White, 1989, "Contradictions in China's Financial Reforms: the Relationship Between Banks and Enterprises," Cambridge Journal of Economics. December, Vol. 13, p.481-495.
Chen Kuan, Wang Hongchang, Zheng Yuxin, Gary Jefferson and Thomas Rawski, 1988, "Productivity Change in Chinese Industry: 1953-1985," Journal of Comparative Economics, December, Vol. 12 No. 4, p.570-591.
Dollar, David, 1990, "Economic Reform and Allocative Efficiency in China's State-Owned Industry," Economic Development and Cultural Change, October, Vol. 39 No. 1, p.89-105.
Granick, David, 1990,Chinese State Enterprises: A Regional Property Rights Analysis, University of Chicago Press.
Groves, Theodore, Yongmiao Hong, John McMillan and Barry Naughton, 1991, "Autonomy and Incentives in Chinese State Enterprises, manuscript.
Jefferson, Gary, "China's Iron and Steel Industry Sources of Enterprise Efficiency and Impact of Reform," Journal of Developmen
Economics, October, Vol. 33 No. 2, p.329-355.
Jefferson, Gary, and Wenyi Xu, 1991, "The Impact of Reform on Socialist Enterprises in Transition: Structure, Conduct, and Performance in Chinese Industry," Journal of Comparative Economics, March, Vol. 15, No.l, p.45-64.
Kornai, Janos, 1980, Economics of Shortage, North Holland, New York.
Kornai, Janos, 1990, The Road to a Free Economy: Shifting from a Socialist System, Norton.
Naughton, Barry, 1991, "Implications of the State Monopoly over Industry and its Relaxation", manuscript.
Oi, Jean, 1991, "The Shifting Balance of Power in Central-Local Relations: Local Government Response to Fiscal Austerity in Rural China," manuscript.
Roemer, John, 1991a, "Market Socialism: A Blueprint," Dissent. Fall, p.562-569.
Roemer, John, 1991b, "Can there be socialism after Communism?" manuscript.
Stepanek, James, 1991, "China's Enduring State Factories: Why Ten Years of Reform Have Left China's Big State Enterprises Unchanged," in Joint Economic Committee of the U.S. Congress, China's Economic Dilemmas in the 1990s: The Problem of Reforms, Modernization, and Interdependence, April, p.440-454.
29
Walder, Andrew, 1988, "Factory and Manager in an Era of Reform," manuscript.
Wang, Xuefeng, 1990, "The Decline of Budget Revenues as a proportion of National Income", Jinqji Yaniiu (Economic Research), Issue No. 4.
Wong, Christine, 1987, "Between Plan and Market: The Role of the Local Sector in Post-Mao China," Journal of Comparative Economics, Vol.11, p.385-398.
Wong, Christine, 1991, "Central-Local Relations in an Era of Fiscal Decline: The Paradox of Fiscal Decentralization in Post-Mao China," manuscript.
Zhang Shuguang, 1990, "Personal Income in Kind," Jinqji Yanjiu (Economic Research), Issue No. 12.
Zhao Renwei, 1989, "Income-in-kind in the Process of Economic Reform," Jinqji Yanjiu (Economic Research), Issue No. 4.

WIDER Working Papers
WP 1. Amartya Sen: Food, Economics and Entitlements, February 1986
WP 2. Nanak Kakwani: Decomposition of Normalization Axiom in the Measurement of Poverty: a Comment, March 1986
WP 3. Pertti Haaparanta: The Intertemporal Effects of International Transfers, April 1986
WP 4. Nanak Kakwani: Income Inequality, Welfare and Poverty in a Developing Economy with Applications to Sri Lanka, April 1986
WP 5. Pertti Haaparanta: and Juha Kahkonen: Liberalization of Capital Movements and Trade: Real Appreciation, Employment and
Welfare, August 1986
WP 6. Pertti Haaparanta: Dual Exchange Markets and Intervention, August 1986
WP 7. Pertti Haaparanta: Real and Relative Wage Rigidities - Wage Indexation in the Open Economy Staggered Contracts Model,
August 1986
WP 8. Nanak Kakwani: On Measuring Undernutrition, December 1986
WP 9. Nanak Kakwani: Is Sex Bias Significant? December 1986
WP 10. Partha Dasgupta and Debraj Ray: Adapting to Undernourishment: The Clinical Evidence and Its Implications, April 1987
WP 11. Bernard Wood: Middle Powers in the International System: A Preliminary Assessment of Potential, June 1987
WP 12. Stephany Griffith-Jones: The International Debt Problem - Prospects and Solutions, June 1987
WP 13. Don Patinkin: Walras' Law, June 1987
WP 14. Kaushik Basu: Technological Stagnation, Tenurial Laws and Adverse Selection, June 1987
WP 15. Peter Svedberg: Undernutrition in Sub-Saharan Africa: A Critical Assessment of the Evidence, June 1987
WP 16. S. R. Osmani: Controversies in Nutrition and their Implications for the Economics of Food, July 1987
WP 17. Frederique Apffel Marglin: Smallpox in Two Systems of Knowledge, Revised, July 1987
WP 18. Amartya Sen: Gender and Cooperative Conlicts, July 1987
WP 19. Amartya Sen: Africa and India: What Do We Have to Learn from Each Other? August 1987
WP 20. Kaushik Basu: A Theory of Association: Social Status, Prices and Markets. August 1987
WP 21. Kaushik Basu: A Theory of Surplus Labour, August 1987
WF 22. Albert Fishlow: Some Reflections on Comparative Latin American Economic Performance and Policy, August 1987
WP 23. Sukhamoy Chakravarty: Post-Keynesian Theorists and the Theory of Economic Development, August 1987
WP 24. Georgy Skorov: Economic Reform in the USSR, August 1987
WP 25. Amartya Sen: Freedom of Choice: Concept and Content, August 1987
WP 26. Gopalakrishna Kumar: Ethiopian Famines 1973-1985: A Case-Study, November 1987
WP 27. Carl Riskin: Feeding China: The Experience since 1949, November 1987
WP 28. Martin Ravallion: Market Responses to Anti-Hunger Policies: Effects on Wages, Prices and Employment, November 1987
WP 29. S. R. Osmani: The Food Problems of Bangladesh, November 1987
WP 30. Martha Nussbaum and Amartya Sen: Internal Criticism and Indian Rationalist Traditions, December 1987
WP 31. Martha Nussbaum: Nature, Function and Cabability: Aristotle on Political Distribution, December 1987
WP 32. Martha Nussbaum: Non-Relative Virtues: An Aristotelian Approach, December 1987
WP 33. Tariq Banuri: Modernization and its Discontents, a Perspective from the Sociology of Knowledge, December 1987
WP 34. Alfred Maizels: Commodity Instability and Developing Countries: The Debate, January 1988
WP 35. Jukka Pekkarinen: Keynesianism and the Scandinavian Models of Economic Policy, February 1988
WP 36. Masahiko Aoki: A New Paradigm of Work Organization: The Japanese Experience, February 1988
WP 37. Dragoslav Avramovic: Conditionality: Facts, Theory and Policy - Contribution to the Reconstruction of the International
Financial System, February 1988
WP 38. Gerald Esptein and Juliet Schor: Macropolicy in the Rise and Fall of the Golden Age, February 1988
WP 39. Stephen Marglin and Amit Bhaduri: Profit Squeeze and Keynesian Theory, April 1988
WP 40. Bob Rowthorn and Andrew Glyn: The Diversity of Unemployment Experience since 1973, April 1988
WP 41. Lance Taylor: Economic Openness - Problems to the Century's End , April 1988
WP 42. Alan Hughes and Ajit Singh: The World Economic Slowdown and the Asian and Latin American Economies: A Comparative
Analysis of Economic Structure, Policy and Performance, April 1988
WP 43. Andrew Glyn, Alan Hughes, Alan Lipietz and Ajit Singh: The Rise and Fall of the Golden Age, April 1988
WP 44. Jean-Philippe Platteau: The Food Crisis in Africa: A Comparative Structural Analysis, April 1988
WP 45. Jean Dreze: Famine Prevention in India, May 1988
WP 46. Peter Svedberg: A Model of Nutrition, Health and Economic Productivity. September 1988
WP 47. Peter Svedberg: Undernutrition in Sub-Saharan Africa: Is There a Sex-Bias?, September 1988
WP 48. S. R. Osmani: Wage Determination in Rural Labour Markets: The Theory of Implicit Co-operation, December 1988
WP 49. S. R. Osmani: Social Security in South Asia, December 1988
WP 50. S. R. Osmani: Food and the History of India - An 'Entitlement' Approach, December 1988
WP 51. Grzegorz W. Kolodko: Reform, Stabilization Policies, and Economic Adjustment in Poland, January 1989
WP 52. Dariusz Rosati and Kalman Mizsei: Adjustment through Opening of Socialist Economies, January 1989
WP 53. Andrei Vernikov: Reforming Process and Consolidation in the Soviet Economy, January 1989
WP 54. Adam Torek: Stabilisation and Reform in the Hungarian Economy of the late 1980's, March 1989
WP 55. Zhang Yuyan: Economic System Reform in China, March 1989
WP 56. Amitava Krishna Dutt: Sectoral Balance: A Survey, March 1989
WP 57. Robert Pringle: Financial Markets and Governments, June 1989
WP 58. Marja-Liisa Swantz: Grassroots Strategies and Directed Development in Tanzania: The Case of the Fishing Sector, August 1989
WP 59. Aili Mari Tripp: Defending the Right to Subsist: The State vs. the Urban Informal Economy in Tanzania. August 1989
WP 60. Jacques H. Dreze, Albert Kervyn de Lettenhove, Jean-Philippe Platteau and Paul Reding: A Proposal for "Co-operative Relief
of Debt in Africa" (CORDA), August 1989
WP 61. Kaushik Basu: Limited Liability and the Existence of Share Tenancy, August 1989
WP 62. Tariq Banuri: Black Markets, Openness, and Central Bank Autonomy, August 1989
WP 63. Amit Bhaduri: The Soft Option of the Reserve Currency Status, August 1989
WP 64. Andrew Glyn: Exchange Controls and Policy Autonomy - The Case of Australia 1983-88, August 1989
WP 65. Jaime Ros: Capital Mobility and Policy Effectiveness in a Solvency Crisis. The Mexican Economy in the 1980s. August 1989
WP 66. Dan W. Brock: Quality of Life Measures in Health Care and Medical Ethics, August 1989
WP 67. Robert Erikson: Descriptions of Inequality. The Swedish Approach to Welfare Research, August 1989
WP 68. Onora O'Neill: Justice, Gender and International Boundaries, August 1989
WP 69. Bernard M. S. van Praag: The Relativity of the Welfare Concept, August 1989
WP 70. Hilary Putnam: Objectivity and the Science/Ethics Distinction, August 1989
WP 71. John E. Roemer: Distributing Health: The Allocation of Resources by an International Agency, August 1989
WP 72. Charles Taylor: Explanation and Practical Reason, August 1989
WP 73. Gerald Epstein and Herbert Gintis: International Capital Markets and the Limits of National Economic Policy, October 1989
WP 74. A. D. Cosh, A. Hughes and A. Singh: Openness, Innovation and Share Ownership: The Changing Structure of Financial
Markets, October 1989
WP 75. Robert B. Zevin: Are World Financial Markets more Open? If so Why and with What Effects?, October 1989
WP 76. Lance Taylor: Gap Disequilibria: Inflation, Investment, Saving and Foreign Exchange, October 1989
WP 77. Andrei Vernikov: Soviet Economy: Opening up and Stabilization, October 1989
WP 78. Kaushik Basu: The International Debt Problem: Could Someone Please Explain It to Me?, October 1989
WP 79. C. K. Omari: Rural Women, Informal Sector and Household Economy in Tanzania, October 1989
WP 80. Partha Dasgupta: Weil-Being: Foundations, and the Extent of Its Realization in Poor Countries, October 1989
WP 81. Grzegorz W. Kolodko, Marian Ostrowski, Dariusz Rosati: Stabilization Policy in Poland. Challenges and Constraints. February
1990
WP 82. S. R. Osmani: Food Deprivation and Undernutrition in Rural Bangladesh, February 1990
WP 83. Kalman Mizsei, Adam Torok: Modified Planned Economies at the Crossroads: The Case of Hungary, March 1990
WP 84. Partha Dasgupta: The Environment as a Commodity, March 1990
WP 85. V. M. Moghadam: Determinants of Female Labor Force Participation in the Middle East and North Africa, May 1990
WP 86. Lauri Siitonen: Political Theories of Development Cooperation - A Study of Theories of International Cooperation, July " 990
WP 87. Valentine M. Moghadam: Gender and Restructuring: Perestroika, the 1989 Revolutions, and Women, November 1990
WP 88. Walter C. Labys and Alfred Maizels: Commodity Price Fluctuations and Macro-economic Adjustments in the Developed
Countries, November 1990
WP 89. Siddig A. Salih, William H. Branson and Yusuf H. Al Ebraheem: Oil Driven Macroeconometric Model of Kuwait, March '991
WP 90. Simon Johnson and Bakhtior Islamov: Property Rights and Economic Reform in Uzbekistan, September 1991
WP 91. Simon Johnson: Spontaneous Privatization in the Soviet Union. How, Why and for Whom?, September 1991
WP 92. Jeffrey D. Sachs: Accelerating Privatization in Eastern Europe: The Case of Poland, September 1991
WP 93. Ardo H. Hansson: The Emergence and Stabilization of Extreme Inflationary Pressures in the Soviet Union, September 1991
WP 94. Ardo H. Hansson: The Importance of Being Earnest: Early Stages of the West German Wirtschaftswunder, September 1991
WP 95. Madhura Swaminathan: Understanding the "Informal Sector": A Survey, December 1991
WP 96. Stanislav V. Zhukov and Alexander Yu. Vorobyov: Reforming the Soviet Union: Lessons from Structural Experience, January
1992
WP 97. Siddig A. Salih: Managing Renewable Natural Capital in Africa, February 1992
WP 98. Haris Gazdar: Rural Poverty, Public Policy and Social Change: Some Findings from Surveys of Six Villages, May 1992
WP 99. Valentine M. Moghadam: Development and Patriarchy: The Middle East and North Africa in Economic and Demographic
Transition, July 1992
WP 100. Bela Bhatia: Lush Fields and Parched Throats: The Political Economy of Groundwater in Gujarat, August 1992

WP 101. John C. Harsanyi: Utilities, Preferences and Substantive Goods, December 1992
WP 102. Derseh Endale: The Ethiopian Famines, Entitlements and Governance, February 1993
WP 103. Derseh Endale: External Imbalances, Famines and Entitlements: A Case Study, February 1993
WP 104. Derseh Endale: Rural Markets, Food-Grain Prices and Famines: A Study on Selected Regions in Ethiopia, February 1993
WP 105. Alexander Yu. Vorobyov: Production Aspects of Russian Transition, June 1993
WP 106. Stanislav Zhukov: Monetary Aspects of Russian Transition. June 1993
WP 107. S. R. Osmani: The Entitlement Approach to Famine: An Assessment, June 1993
WP 108. S. R. Osmani: Growth and Entitlements: The Analytics of the Green Revolution, June 1993
WP 109. S. R. Osmani: Is There a Conflict between Growth and Welfarism? The Tale of Sri Lanka, June 1993
WP 110. Valentine M. Moghadam: Social Protection and Women Workers in Asia, June 1993
WP 111. Alain de Crombrugghe and David Lipton: The Government Budget and the Economic Transformation of Poland, July 1993
WP 112. Gang Fan and Wing Thye Woo: Decentralized Socialism and Macroeconomic Stability: Lessons from China, July 1993