Embed Size (px)
Citation preview

DEAL DRIVERS EMEAThe comprehensive review of mergers and acquisitions in the EMEA region.
2016FULL-YEAR EDITION
Published by:
In association with:

FINANCIAL TRANSACTIONS & REPORTING | MARKETING & COMMUNICATIONS FOR REGULATED INDUSTRY | CUSTOMER CONTENT & COLLABORATION SOLUTIONS
MERRILL DATASITE
This year, Merrill DataSite reached the 1 billion mark.
That’s 1 billion pages uploaded to our award-winning virtual data room since 2004.
Thousands of companies worldwide trust us to securely host their confidential information. Our single platform exists to support your rapidly changing needs.
Contact us at +44 20 3031 6300 to see how we can help you with your next transaction.
merrillcorp.com
© Merrill Communications LLC. All rights reserved.
Reaching the summit is no small feat.
1,000,000,000PAGES UPLOADED
41,000+VIRTUAL DATA ROOM PROJECTS SECURED
SINCE 2003
31,000+M&A TRANSACTIONS
SINCE 2003
20TECHNOLOGY AWARDS
IN THE PAST 8 YEARS
14LANGUAGES
SPOKEN

03
DEAL DRIVERS – EMEA
CONTENTS
ABOUT MERGERMARKET
Mergermarket is an unparalleled mergers and acquisitions intelligence tool. In any market, the lifeblood of advisers is deal flow. Mergermarket is unique in the provision of origination intelligence to the investment banking, legal, private equity, acquisition finance, public relations and corporate markets.
With an unrivalled network of journalists and analysts covering global M&A, Mergermarket generates proprietary
intelligence and delivers it, together with daily aggregated content, on its Mergermarket.com platform and by real-time email alerts to its subscribers.
This wealth of intelligence, together with a series of deal databases, individual and house league tables, profiles and editorial, has proven time and time again that this product can, and does, provide real revenues for Mergermarket’s clients. This is apparent when you see that Mergermarket
is used by over 400 of the world’s foremost advisory firms to assist in their origination process. Mergermarket is not interested in news, by then the opportunity has usually passed. Mergermarket focuses on revenue-generating intelligence and proves daily that it is one of the most useful and powerful tools for the M&A market.
Foreword 04
EMEA Heat Chart 05
All Sectors 06
Financial Services 14
Industrials & Chemicals 18
Energy, Mining & Utilities 22
Consumer 26
Telecoms, Media & Technology 30
Transportation 34
Pharma, Medical & Biotech 38
Construction 42
The Middle East & North Africa 46
About Merrill DataSite 50
Merrill DataSite Contacts 52

Welcome to the full-year 2016 edition of Deal Drivers EMEA, published by Mergermarket in association with Merrill Corporation.
This report provides an extensive review of M&A activity across Europe, the Middle East and North Africa. It offers detailed analysis of specific regions and sectors. It also identifies key trends that are set to develop over the course of the next six months.
Political uncertainty rocked Europe following the UK referendum in June and the severance process continues to cloud investor sentiment. However, M&A figures belie impressions of doom and gloom – deal volume in Europe reached a record high in 2016. Inbound value in particular sky rocketed in Q4, helping to make it a great year.
Market participants, and in particular PE firms, are also eager to seize any advantage arising out of the uncertainty and associated currency fluctuations. Transatlantic M&A remained unfazed, amounting to €344.8bn, continuing the record-highs of the past two years. A weaker pound (and euro) may make European targets more attractive for transatlantic buyers as the dollar gains strength. But uncertainty looms over the new US administration with market participants wary to predict policy changes. Monetary policy remains loose for the time being and corporates and Private Equity (PE) alike will take advantage of cheap cash while it lasts.
The partial rebound in Brent crude oil to a more comfortable level above US$50 per barrel provided some relief to struggling companies. This sparked mergers and helping to bridge the price expectation gap in a largely lacklustre dealmaking landscape. Nevertheless, the main attraction in the sector remains renewable energy, where several PE firms made successful exits over the past year. This sector has benefitted from a perk up in European power wholesale prices, making generating assets more attractive.
Distressed situations also continued to attract buyers to the Southern European regions. Here private capital is much needed by small and medium enterprises, as well as the financial services sector, with banks looking to chip away at non-performing loans.
In addition, Italian financial services experienced considerable consolidation, with several large mergers including the €3.7bn deal between Banca Popolare di Milano and Banco Popolare Societa Cooperativa.
Asian buyers, driven by China, have also enlivened dealmaking across Europe in 2016, with Asian acquirers bidding for strategic targets. Whether this trend will continue will greatly depend on the regulatory landscape, with China currently reigning in the outflow of capital, and governments in Europe looking to protect companies and IP of national interest. The sale of Germany’s Aixtron in September to Fujian Grand Chip Investment Fund was subject to much local scrutiny before ultimately failing due to US security concerns, and European governments have developed a heightened political awareness of bids for ‘critical’ infrastructure and technology.
However, European targets once highly prized for their location in a stable market now suddenly bear more risk. An increase in Euro-scepticism ahead of elections in Germany and France has the potential to polarise countries and brings with it the possibility of a volatile policy agenda.
This has already led to many investors branching out into less mature M&A markets such as Central and Eastern Europe, including into what were previously considered frontier markets such as Romania. Overall, it has been a record year for PE value in the CEE region and this trend is likely to continue. A number of privatisations in hot sectors such as pharma and telecoms are expected to contribute to the pipeline for 2017, which is also supported by a fast-growing software and technology scene.
The European M&A market for companies upgrading through digitalisation and the acquisition of technology across sectors is far from saturated and will continue to draw in international buyers. If not to London then to Berlin or perhaps to Tallinn.
04
DEAL DRIVERS – EMEA
FOREWORD
Sincerely,
Richard Martin Senior Director

05
DEAL DRIVERS – EMEA
EMEA HEAT CHART
Sector UK & Ireland
CEE German speaking
Italy Russia Nordics Benelux France SEE Iberia MENA Total
TMT 98 51 52 21 33 28 30 49 35 30 21 458
Consumer 36 79 41 87 49 29 40 45 19 18 15 458
Industrials & Chemicals 36 79 85 56 20 52 28 35 29 21 15 456
Energy, Mining & Utilities 59 35 16 28 29 30 15 7 16 19 14 268
Financial Services 44 30 38 26 37 14 18 10 10 12 9 248
Business Services 65 24 26 26 16 21 14 16 6 8 11 233
Pharma, Medical & Biotech 41 19 57 16 13 16 15 18 4 5 8 212
Leisure 32 22 11 6 9 10 16 11 10 11 5 143
Transportation 8 11 10 20 6 11 17 3 7 5 4 102
Construction 4 24 10 8 11 8 8 2 6 4 4 89
Real Estate 3 6 5 3 7 3 6 2 1 5 5 46
Agriculture 6 2 18 1 1 2 2 1 33
Defence 4 1 1 1 7
Other 2 2 4
Government 1 1 2
Total 432 387 353 298 249 233 209 199 147 140 112 2759
Hot Warm Cold
80 50 20
70 40 10
60 30 1
Note: Mergermarket’s Heat Chart of predicted deal flow is based on the intelligence collected in our database relating to companies rumoured to be up for sale, or officially up for sale, in the EMEA region. It is therefore indicative of areas that are likely to be active in the months to come. The intelligence comes from a range of sources, including press reports, company statements and our own team of journalists gathering proprietary intelligence from M&A practitioners across the region. The data does not differentiate between small and large transactions, nor between deals that could happen in the short or long term.
The Intelligence Heat Chart is based on ‘companies for sale’ stories tracked by Mergermarket in EMEA between 01/07/2016 and 31/12/2016. Opportunities are captured according to the dominant geography and sector of the potential target company.
EMEA HEAT CHART – INTELLIGENCE
For the coming months, Europe’s biggest M&A market, the UK and Ireland, is tipped to be the hottest with the TMT and business services sectors generating lots of market chatter, according to Mergermarket’s Heat Chart, which tracks ‘companies for sale’ stories.
The end of 2016, saw 21st Century Fox’s bid for a 60.9% stake in UK-based media company Sky for €21.4bn in order to diversify geographic reach across the Atlantic. Momentum in the sector looks set to build as the long-term attractiveness of such UK companies is coupled with big US players scouring Europe for the right set of capabilities.
Inbound investors are expected to become more active as uncertainty may begin to give way to an increasingly clear understanding of the impact of the UK’s decision to leave the EU and the processes involved.
Italy’s consumer sector remains hot for both the luxury and the fast-moving consumer goods segment as foreign investors look to
invest in the country’s brands. Further consolidation in the Italian financial services sector has been discussed in the context of difficulties facing the country’s banks.
Regulations aimed to make the financial services sector more stable in the wake of the financial crisis are also expected to continue to spark M&A among insurers, as large players seek diversified revenue streams and smaller businesses buckle under the weight of new capital and reporting rules.
The industrials & chemicals sector looks set to see considerable dealmaking including from bidders seeking out targets in Germany and the Central Eastern European region, commentators say. A number of industrials & chemicals companies in the Nordics have also been tipped for M&A activity.
Market participants also anticipate continued M&A in the MENA region as lower oil prices continue to exert pressure on cash flows of many of the Gulf region’s businesses.

06
DEAL DRIVERS – EMEA – ALL SECTORS
ALL SECTORSOVERVIEW
ALL SECTORS
Dealmakers seized on opportunities in Europe over the past year, pushing deal volume to a record high. Following a stellar year for global M&A in 2014 and 2015, 2016 continued to be a busy year for M&A in Europe. European deal volume amounted to 6,999 deals, topping 2015 with a 4% year-on-year increase. Deal value saw a slight decline of 10% year-on-year with a combined €729.5bn worth of announced deals. This included 21 megadeals above €5bn, amounting to €298.4bn – a similar outturn to 2015.
Despite Brexit woes, the UK & Ireland maintained pole position in European M&A with 22.3% of volume and 27.5% of value. The third quarter, in the immediate aftermath of the UK referendum, included the €27.3bn acquisition of microprocessor technology business ARM Holdings by Japanese SoftBank Group, with the latter transaction making up close to two-thirds of total deal value that quarter. Deal flow continued at a steady pace afterwards.
US buyers were also keen to tap into European technology, with this trend yielding the top deal of the year with the acquisition of Dutch company NXP Semiconductors by Qualcomm Inc for €42.1bn, and thereby making telecoms, media & technology (TMT) the top sector by value in 2016.
Rush for technology The German-speaking countries (Germany, Austria and Switzerland), followed on the heels of the UK & Ireland as the second most-targeted destination in Europe. While industrials & chemicals remain a staple of the German economy, the government has made it its mission to advance automation and the Internet-of-Things under the banner of Industrie 4.0. The success of this strategy is evident in bids such as the €3.8bn offer for robotics company KUKA AG from Chinese household appliances business Midea Group. While this deal received final regulatory approvals at the year’s end, the bid by Fujian Grand Chip Investment Fund for semiconductor business Aixtron lapsed following heightened attention by the Committee on Foreign Investment in the United States (CIFIUS).
Nevertheless, Chinese outbound activity reached a record high in 2016, according to Mergermarket data, and China's was the second biggest inbound force by value and volume in Europe after the US.
The inrush of Asian buyers also contributed to unprecedented dealflow in Central and Eastern Europe, where new transport infrastructure would have the potential to bolster access to both the CEE region and to Western European consumer markets.
The 2015 blockbuster acquisition of UK brewer SABMiller by AB InBev also sparked more deal flow in the region with the divestment of Anheuser-Busch’s CEE portfolio, which includes the popular Pilsner Urquell brand, to Japan’s Asahi Group for €7.3bn.
Private equity in Eastern Europe also shot to new heights in 2016, amounting to €4.3bn in deal value. This is partly due to GDP growth projections above the EU average in many of the region’s countries which have sparked a positive outlook for consumer spending and the growth of e-commerce.
Energy futures Commodities futures prices continued to spark M&A in the energy, mining & utilities sector across Europe, but in particular in Russia and the Middle East. National oil companies squeezed by the prolonged downturn in oil prices began in 2016 to seek out mergers to implement cost-efficiencies and, in the case of Russia, maintain cashflow and stake out market share. A consortium between Qatar Investment Authority and commodities trading giant Glencore made a €10.5bn-bid for a 19.5% stake in Rosneft Oil Company which effectively represents the biggest privatisation in Russia in many years.
Corporates were also keen to maximise efficiencies. While the merger between the US’ BakerHughes and Halliburton fell through, FMC Technologies jumped on the opportunity to merge with France’s Technip following their Forsys Subsea joint-venture in 2015.
In the utility segment, renewable assets (and in particular wind farm portfolios) continued to change hands across Europe, with many PE holding cycles winding down. Among the largest such exits was US PE firm Blackstone Energy Partners’ sale of a 80% stake in German WindMW for €1.7bn to China’s Three Georges, and UK-based firm Bridgepoint Advisers’ exit from Spanish Bora Wind Energy for €500m.
Private equity Buyouts were up 10% in volume in 2016 but combined value amounted to €108bn, a decrease of 11% compared to the previous year. Nevertheless, the 1,245 buyout deals accounted for 18% of total European deal flow by volume. The largest buyout of the year was the sale of a majority stake for €13.4bn (40x EBITDA multiple) in the UK’s gas distribution business, National Grid, by Macquarie, Allianz Capital Partners, Qatar Investment Authority and China Investment Authority among others. This deal is also indicative of the appetite sovereign wealth funds and insurance companies have in stable, long-term infrastructure, in particular in utilities and transportation. North American buyers were also active in 2016, with a €2.5bn bid for London City Airport by a consortium led by Canadian Ontario Teachers’ Pension Plan and including Kuwait Investment Authority.
As the infrastructure gap across Europe remains wide this trend is set to continue, with inbound investors willing to park funds long-term, especially as long as bank debt remains cheap.
However, growing Euroscepticism, Italy’s banking travails and the Brexit process may yet prove to be testing for investors seeking safe havens ahead of a tightening in interest rates.

ALL SECTORSTOP 20 ANNOUNCED DEALS FOR YEAR ENDING 31 DECEMBER 2016 (EUROPEAN TARGET)
DEAL DRIVERS – EMEA – ALL SECTORS
07
Announced Date
Status Bidder Company Target Company Sector Vendor Company Deal Value (€m)
27-Oct-16 P Qualcomm Incorporated NXP Semiconductors NV TMT 42,058
03-Feb-16 P China National Chemical Corporation
Syngenta AG Industrials & Chemicals 42,039
18-Jul-16 C SoftBank Group Corp ARM Holdings Plc (98.55% stake) TMT 27,276
15-Dec-16 P 21st Century Fox Inc Sky Plc (60.9% stake) TMT 21,373
21-Jul-16 C Sacam Mutualisation Credit Agricole – Regional Banks (25% stake) Financial Services Credit Agricole SA 18,542
12-Apr-16 C DZ Bank AG Westdeutsche Genossenschafts-Zentralbank Financial Services 17,000
25-Jan-16 C Johnson Controls Inc Tyco International plc Industrials & Chemicals 14,973
08-Dec-16 P A Consortium led by Macquarie Infrastructure and Real Assets
National Grid Gas Distribution Ltd (61% stake) Energy, Mining & Utilities National Grid Plc 13,428
16-Mar-16 P Deutsche Boerse AG London Stock Exchange (LSE) Plc Financial Services 13,339
27-Jun-16 C Boehringer Ingelheim GmbH Merial SAS Pharma, Medical & Biotech Sanofi SA 11,400
07-Dec-16 P A Consortium led by Qatar Investment Authority
Rosneft Oil Company OAO (19.5% stake) Energy, Mining & Utilities Rosneftegaz OAO 10,503
10-Feb-16 C Mylan NV Meda AB Pharma, Medical & Biotech 8,844
21-Jun-16 P Tencent Holdings Ltd Supercell Oy (84.3% stake) TMT SoftBank Group Corp 7,607
13-Feb-16 P Asahi Group Holdings Ltd Anheuser-Busch InBev NV (Central and East European Beer Business)
Consumer Anheuser-Busch InBev NV 7,300
07-Sep-16 P Liberty Media Corporation Formula One Group Leisure CVC Capital Partners Limited; Waddell & Reed Financial Inc; BlackRock Inc; and Norges Bank
6,969
17-Jun-16 P Siemens AG Gamesa Corporacion Tecnologica SA Industrials & Chemicals 6,640
15-Feb-16 C Liberty Global Europe Holding BV/Vodafone International Holdings BV
Ziggo BV; and Vodafone Libertel BV TMT Vodafone International Holdings BV; and Liberty Global Europe Holding BV
6,200
10-Oct-16 C Rosneft Oil Company OAO Bashneft ANK OAO (50.08% stake) Energy, Mining & Utilities The Federal Agency for State Property Management
5,929
05-Sep-16 P HELIOS Kliniken GmbH Quironsalud Pharma, Medical & Biotech CVC Capital Partners Limited 5,760
04-Mar-16 C Inversora Carso SA de CV Fomento de Construcciones y Contratas SA (48.3% stake)
Construction 5,734
C = Completed; P = Pending; L = Lapsed

DEAL DRIVERS – EMEA – ALL SECTORS
ALL SECTORSEUROPEAN M&A SPLIT BY DEAL SIZE
VALUE VOLUME
Moving average trend line
Based on announced deals, excluding those that lapsed or were withdrawn, where the dominant location of the target is in Europe.
08
Quarter endedQuarter ended
QUARTERLY M&A ACTIVITY – ALL SECTORS
VALUE VOLUME
Volu
me
Valu
e (€
bn)
Volu
me
Valu
e (€
m)
>€5,001m
€2,001m – €5,000m
€501m – €2,000m
€251m – €500m
€5m – €250m >€5,001m
€2,001m – €5,000m
€501m – €2,000m
€251m – €500m
€5m – €250m
Value not disclosed
0
500
1,000
1,500
2,000
2,500
3,000
3,500
4,000
4,500
5,000
5,500
6,000
6,500
7,000
7,500
2016201520142013201220112010
1,963
4,631
2,065
4,270
2,239
197
3,974
1,907
3,611
1,798
3,323
2,030
3,187
1,896
2,702
9
12
20 1921
15632
133
1611312
34
153
180
17336
172
14035
170
42 17118641
184178
35
0
100
200
300
400
500
600
700
800
900
2016201520142013201220112010
336.5
127.2
64.0
298.4
106.3
100.5
160.3
65.5
101.9
213.1
119.4
70.4
108.2
106.7
97.5
60.8
90.9
104.9
161.8
148.9 137.4176.8 177.8
52.9
92.7
88.9
113.1
159.6
61.3
100.1
109.8
99.1
140.1
46.1
86.8
0
200
400
600
800
1,000
1,200
1,400
1,600
1,800
2,000
Q4Q3Q2Q1Q4Q3Q2Q1Q4Q3Q2Q1Q4Q3Q2Q1Q4Q3Q2Q1Q4Q3Q2Q1Q4Q3Q2Q1
2010 2011 2012 2013 2014 2015 2016
0
25,000
50,000
75,000
100,000
125,000
150,000
175,000
200,000
225,000
250,000
275,000
300,000
Q4Q3Q2Q1Q4Q3Q2Q1Q4Q3Q2Q1Q4Q3Q2Q1Q4Q3Q2Q1Q4Q3Q2Q1Q4Q3Q2Q1
2010 2011 2012 2013 2014 2015 2016

09
DEAL DRIVERS – EMEA – ALL SECTORS
European bidder acquiring a North American target
North American bidder acquiring a European target
Total North American/ European deals
Based on dominant location of target and bidder and excludes all buyouts.
ALL SECTORSEUROPEAN BUYOUTS EUROPEAN EXITS
Quarter endedQuarter ended
Value Volume
Based on announced deals, excluding those that lapsed or were withdrawn, where the dominant location of the target is in Europe.
TRANSATLANTIC DEALS
VALUE VOLUME
Valu
e (€
m)
Volu
me
Valu
e (€
m)
Volu
me
Volume
Valu
e (€
m)
Valu
e (€
m) Volum
e
Quarter ended Quarter ended
0
10,000
20,000
30,000
40,000
50,000
60,000
70,000
80,000
90,000
100,000
110,000
120,000
Q4Q3Q2Q1Q4Q3Q2Q1Q4Q3Q2Q1Q4Q3Q2Q1Q4Q3Q2Q1Q4Q3Q2Q1Q4Q3Q2Q1
2010 2011 2012 2013 2014 2015 2016
0
25
50
75
100
125
150
175
200
225
250
275
300
325
350
Q4Q3Q2Q1Q4Q3Q2Q1Q4Q3Q2Q1Q4Q3Q2Q1Q4Q3Q2Q1Q4Q3Q2Q1Q4Q3Q2Q1
2010 2011 2012 2013 2014 2015 2016
0
5,000
10,000
15,000
20,000
25,000
30,000
35,000
40,000
45,000
Q4Q3Q2Q1Q4Q3Q2Q1Q4Q3Q2Q1Q4Q3Q2Q1Q4Q3Q2Q1Q4Q3Q2Q1Q4Q3Q2Q10
25
50
75
100
125
150
175
200
225
250
275
300
2010 2011 2012 2013 2014 2015 2016
0
5,000
10,000
15,000
20,000
25,000
30,000
35,000
40,000
45,000
50,000
Q4Q3Q2Q1Q4Q3Q2Q1Q4Q3Q2Q1Q4Q3Q2Q1Q4Q3Q2Q1Q4Q3Q2Q1Q4Q3Q2Q10
50
100
150
200
250
300
350
400
2010 2011 2012 2013 2014 2015 2016

22.2%
16.7%
12.7%7.5%
6.5%
8.8%
14.2%
9.4%2.0%
27.4%
19.8%
10.5%
6.8%
7.0%
10.4%
8.1%
9.0%
1.0%1.0%
19.8%
13.9%
5.8%
5.7%12.7%
21.1%
4.0%
2.5%
7.1%
2.1%
0.3%
4.4%0.6%
20.5%
6.7%
15.9%
13.9%
6.0%
14.4%
4.7%
3.5%
6.6%
4.8%
1.6%0.1%
1.3%
DEAL DRIVERS – EMEA - ALL SECTORS
ALL SECTORSMIX OF DEALS BY GEOGRAPHIC REGION
VALUE VOLUME
UK & Ireland
German speaking
France
Italy
Iberia
Benelux
Nordic
Central & Eastern Europe
Other
MIX OF DEALS BY INDUSTRY SECTOR
VALUE VOLUME
Industrials & Chemicals
Financial Services
Business Services
Consumer
Energy, Mining & Utilities
TMT
Leisure
Transportation
Pharma, Medical & Biotech
Construction
Real Estate
Defence
Agriculture
Based on announced deals, excluding those that lapsed or were withdrawn. Geographic region is determined with reference to the dominant location of the target.
Based on announced deals, excluding those that lapsed or were withdrawn, where the dominant location of the target is in Europe. Industry sector is based on the dominant industry of the target.
10

ALL SECTORSFINANCIAL ADVISERS
DEAL DRIVERS – EMEA - ALL SECTORS
LEGAL ADVISERS
TOP 20 – RANKED BY VALUE TOP 20 – RANKED BY VOLUME
TOP 20 – RANKED BY VALUE TOP 20 – RANKED BY VOLUME
2016 2015 Company Name Value (€m)
Number of Deals
1 1 Goldman Sachs 355,544 110
2 2 Morgan Stanley 321,710 96
3 4 Bank of America Merrill Lynch 217,102 88
4 11 Credit Suisse 209,792 71
5 8 Rothschild 204,918 259
6 3 JPMorgan 194,315 117
7 6 Barclays 189,538 80
8 5 Lazard 156,032 146
9 7 Deutsche Bank 145,329 64
10 15 UBS Investment Bank 142,799 84
11 12 Citi 125,294 86
12 13 Centerview Partners 101,673 13
13 21 Evercore Partners 100,839 47
14 19 HSBC 78,136 38
15 9 Robey Warshaw 60,243 4
16 - Ducera Partners 56,454 1
17 33 RBC Capital Markets 51,559 35
18 10 BNP Paribas 49,901 98
19 94 ALANTRA 48,091 68
20 75 China International Capital 44,297 3
2016 2015 Company Name Value (€m)
Number of Deals
1 4 Freshfields Bruckhaus Deringer 243,620 209
2 10 White & Case 225,877 212
3 19 Allen & Overy 210,934 220
4 1 Cravath, Swaine & Moore 203,539 19
5 13 Linklaters 189,459 220
6 2 Clifford Chance 181,776 214
7 15 Davis Polk & Wardwell 175,661 32
8 6 Sullivan & Cromwell 152,039 45
9 3 Cleary Gottlieb Steen & Hamilton 149,593 61
10 5 Skadden Arps Slate Meagher & Flom 132,091 72
11 39 Shearman & Sterling 126,086 61
12 50 Paul Weiss Rifkind Wharton & Garrison 107,423 27
13 8 Wachtell, Lipton, Rosen & Katz 101,068 15
14 162 Morrison & Foerster 95,354 16
15 31 Simpson Thacher & Bartlett 94,179 46
16 25 Slaughter and May 93,679 50
17 51 Jones Day 91,747 145
18 9 Weil Gotshal & Manges 78,142 112
19 14 Debevoise & Plimpton 73,713 23
20 38 Kirkland & Ellis 73,346 85
2016 2015 Company Name Value (€m)
Number of Deals
1 1 DLA Piper 68,670 276
2 2 CMS 24,680 254
3 3 Allen & Overy 210,934 220
4 4 Linklaters 189,459 220
5 5 Clifford Chance 181,776 214
6 7 White & Case 225,877 212
7 6 Baker & McKenzie 51,269 211
8 8 Freshfields Bruckhaus Deringer 243,620 209
9 9 Jones Day 91,747 145
10 12 Eversheds 22,741 145
11 10 Latham & Watkins 69,056 140
12 11 Hogan Lovells International 27,435 126
13 13 Weil Gotshal & Manges 78,142 112
14 23 Dentons 14,856 107
15 30 Pinsent Masons 9,631 103
16 42 PwC legal 6,368 97
17 18 Squire Patton Boggs 2,510 97
18 92 Orrick Herrington & Sutcliffe 7,210 94
19 19 Norton Rose Fulbright 11,762 87
20 20 Kirkland & Ellis 73,346 85
2016 2015 Company Name Value (€m)
Number of Deals
1 3 KPMG 18,464 280
2 1 PwC 12,964 266
3 2 Rothschild 204,918 259
4 5 Deloitte 17,131 233
5 4 EY 7,963 196
6 7 Lazard 156,032 146
7 15 BDO 1,130 125
8 8 JPMorgan 194,315 117
9 6 Goldman Sachs 355,544 110
10 16 BNP Paribas 49,901 98
11 9 Morgan Stanley 321,710 96
12 12 Bank of America Merrill Lynch 217,102 88
13 11 Citi 125,294 86
14 10 Oaklins 1,428 86
15 17 UBS Investment Bank 142,799 84
16 14 Barclays 189,538 80
17 25 Clearwater International 1,019 79
18 20 Lincoln International 2,136 73
19 18 Credit Suisse 209,792 71
20 23 Grant Thornton 853 69
The financial adviser league tables by value and volume have been run from 01/01/2016 to 31/12/2016, excluding lapsed and withdrawn deals. The tables are pan-European and cover all sectors.
The legal adviser league tables by value and volume have been run from 01/01/2016 to 31/12/2016 and include lapsed and withdrawn deals. The tables are pan-European and cover all sectors.
11

DEAL DRIVERS – EMEA - ALL SECTORS
ALL SECTORSFINANCIAL ADVISERS – SMALL-CAP (€5M – €250M)
LEGAL ADVISERS – SMALL-CAP (€5M – €250M)
TOP 20 – RANKED BY VALUE TOP 20 – RANKED BY VOLUME
TOP 20 – RANKED BY VALUE TOP 20 – RANKED BY VOLUME
The financial adviser small-cap league tables by value and volume have been run from 01/01/2016 to 31/12/2016, excluding lapsed and withdrawn deals.The tables are pan-European and cover all sectors.
The legal adviser small-cap league tables by value and volume have been run from 01/01/2016 to 31/12/2016 and include lapsed and withdrawn deals.The tables are pan-European and cover all sectors.
2016 2015 Company Name Value (€m)
Number of Deals
1 1 Rothschild 7,951 75
2 4 KPMG 6,063 91
3 2 PwC 5,371 81
4 3 Deloitte 4,689 58
5 6 Lazard 4,361 34
6 12 JPMorgan 3,964 24
7 9 BNP Paribas 3,116 29
8 5 EY 3,037 51
9 34 UniCredit Group 2,465 27
10 10 Morgan Stanley 2,405 13
11 21 Jefferies 2,352 17
12 8 Goldman Sachs 2,230 15
13 15 Barclays 2,174 17
14 27 ALANTRA 2,075 35
15 43 William Blair & Company 1,930 16
16 28 Houlihan Lokey 1,884 20
17 18 Robert W. Baird & Co 1,839 14
18 38 Societe Generale 1,794 12
19 67 Carnegie Investment Bank 1,761 18
20 7 Citi 1,755 11
2016 2015 Company Name Value (€m)
Number of Deals
1 5 Clifford Chance 6,764 62
2 4 Allen & Overy 6,074 56
3 1 DLA Piper 5,568 77
4 2 Linklaters 5,423 66
5 7 Baker & McKenzie 5,001 69
6 3 CMS 4,614 65
7 12 Freshfields Bruckhaus Deringer 4,439 40
8 6 White & Case 4,296 53
9 15 Norton Rose Fulbright 3,606 41
10 31 Travers Smith 3,154 28
11 10 Jones Day 3,034 45
12 9 Hogan Lovells International 2,952 44
13 26 King & Wood Mallesons 2,845 33
14 11 Weil Gotshal & Manges 2,843 24
15 8 Eversheds 2,735 40
16 25 Latham & Watkins 2,644 28
17 76 Dentons 2,618 37
18 30 Pinsent Masons 2,536 40
19 19 Ashurst 2,477 22
20 22 Skadden Arps Slate Meagher & Flom 2,290 20
2016 2015 Company Name Value (€m)
Number of Deals
1 1 DLA Piper 5,568 77
2 3 Baker & McKenzie 5,001 69
3 4 Linklaters 5,423 66
4 2 CMS 4,614 65
5 7 Clifford Chance 6,764 62
6 5 Allen & Overy 6,074 56
7 8 White & Case 4,296 53
8 9 Jones Day 3,034 45
9 10 Hogan Lovells International 2,952 44
10 20 Norton Rose Fulbright 3,606 41
11 15 Cuatrecasas 2,142 41
12 14 Freshfields Bruckhaus Deringer 4,439 40
13 6 Eversheds 2,735 40
14 22 Pinsent Masons 2,536 40
15 11 Squire Patton Boggs 2,237 38
16 47 Dentons 2,618 37
17 13 King & Wood Mallesons 2,845 33
18 75 Orrick Herrington & Sutcliffe 1,662 33
19 12 Osborne Clarke 1,537 32
20 27 Bird & Bird 1,942 31
2016 2015 Company Name Value (€m)
Number of Deals
1 5 KPMG 6,063 91
2 1 PwC 5,371 81
3 3 Rothschild 7,951 75
4 4 Deloitte 4,689 58
5 2 EY 3,037 51
6 11 ALANTRA 2,075 35
7 6 Lazard 4,361 34
8 9 BDO 1,130 34
9 7 BNP Paribas 3,116 29
10 25 UniCredit Group 2,465 27
11 22 JPMorgan 3,964 24
12 8 Oaklins 1,065 24
13 42 Houlihan Lokey 1,884 20
14 10 Grant Thornton 853 20
15 19 Investec 1,368 19
16 41 Carnegie Investment Bank 1,761 18
17 23 Clearwater International 756 18
18 24 Jefferies 2,352 17
19 28 Barclays 2,174 17
20 37 William Blair & Company 1,930 16
12

DEAL DRIVERS – EMEA - ALL SECTORS
ALL SECTORSPR ADVISERS
PR ADVISERS – SMALL-CAP (€5M – €250M)
TOP 20 – RANKED BY VALUE TOP 20 – RANKED BY VOLUME
TOP 20 – RANKED BY VALUE TOP 20 – RANKED BY VOLUME
The PR adviser small-cap league tables by value and volume have been run from 01/01/2016 to 31/12/2016 and exclude lapsed and withdrawn deals.The tables are based on advice to a European bidder, target or vendor.
The PR adviser league tables by value and volume have been run from 01/01/2016 to 31/12/2016 and exclude lapsed and withdrawn deals.The tables are pan-European and cover all sectors.
2016 2015 Company Name Value (€m)
Number of Deals
1 1 Brunswick Group 254,540 145
2 6 Sard Verbinnen & Co 187,917 44
3 2 Finsbury 155,782 66
4 5 FTI Consulting 143,828 157
5 21 CNC (Publicis/MSLGROUP) 138,768 37
6 10 Hering Schuppener (Finsbury) 105,846 37
7 3 Joele Frank Wilkinson Brimmer Katcher 89,876 33
8 43 Hirzel.Neef.Schmid.Counselors (AMO) 59,443 4
9 8 Kekst (Publicis/MSLGROUP) 53,757 39
10 24 Weber Shandwick Worldwide 44,636 13
11 - Dynamics Group 42,479 5
12 11 Maitland (AMO) 36,444 73
13 13 Citigate 19,656 56
14 30 Image Sept 19,176 67
15 9 Greenbrook Communications 18,492 56
16 12 Abernathy MacGregor Group (AMO) 17,770 19
17 85 Cardew Group 14,038 4
18 17 Powerscourt 13,680 35
19 25 Fitzroy Communications 13,339 2
20 75 Adfactors PR 11,711 5
2016 2015 Company Name Value (€m)
Number of Deals
1 1 FTI Consulting 5,206 74
2 2 Brunswick Group 3,019 38
3 6 Finsbury 2,360 19
4 4 Maitland (AMO) 2,001 24
5 8 Greenbrook Communications 1,897 15
6 3 Citigate 1,607 17
7 10 Instinctif Partners 1,594 30
8 9 Tulchan Communications 1,506 24
9 148 Community Group 1,423 22
10 7 Bell Pottinger Financial & Corporate 1,414 23
11 5 Hering Schuppener (Finsbury) 1,184 8
12 19 Hudson Sandler 1,146 12
13 17 Barabino & Partners 1,090 16
14 20 Kekst (Publicis/MSLGROUP) 1,022 8
15 44 Powerscourt 966 20
16 11 MHP Communications 897 20
17 15 Edelman 871 8
18 25 CityPress PR 821 9
19 65 Kreab 792 14
20 14 Image Sept 762 10
2016 2015 Company Name Value (€m)
Number of Deals
1 1 FTI Consulting 5,206 74
2 2 Brunswick Group 3,019 38
3 4 Instinctif Partners 1,594 30
4 6 Maitland (AMO) 2,001 24
5 9 Tulchan Communications 1,506 24
6 8 Bell Pottinger Financial & Corporate 1,414 23
7 154 Community Group 1,423 22
8 24 Powerscourt 966 20
9 5 MHP Communications 897 20
10 7 Finsbury 2,360 19
11 10 Buchanan Communications 415 18
12 3 Citigate 1,607 17
13 14 Barabino & Partners 1,090 16
14 22 Greenbrook Communications 1,897 15
15 67 Kreab 792 14
16 17 Hudson Sandler 1,146 12
17 19 Walbrook PR 150 12
18 13 Camarco 487 11
19 11 Redleaf Polhill 172 11
20 16 Image Sept 762 10
2016 2015 Company Name Value (€m)
Number of Deals
1 1 FTI Consulting 143,828 157
2 2 Brunswick Group 254,540 145
3 4 Maitland (AMO) 36,444 73
4 14 Image Sept 19,176 67
5 6 Finsbury 155,782 66
6 3 Citigate 19,656 56
7 8 Greenbrook Communications 18,492 56
8 5 Tulchan Communications 8,875 48
9 7 Instinctif Partners 5,717 47
10 18 Sard Verbinnen & Co 187,917 44
11 30 Community Group 9,498 42
12 11 Kekst (Publicis/MSLGROUP) 53,757 39
13 20 CNC (Publicis/MSLGROUP) 138,768 37
14 12 Hering Schuppener (Finsbury) 105,846 37
15 23 Powerscourt 13,680 35
16 13 Joele Frank Wilkinson Brimmer Katcher 89,876 33
17 9 Bell Pottinger Financial & Corporate 7,121 33
18 32 Kreab 2,854 32
19 47 Kable Communication Finance 2,278 32
20 19 Barabino & Partners 3,159 31
13

FINANCIAL SERVICESOVERVIEW
14
DEAL DRIVERS – EMEA - FINANCIAL SERVICES
Europe’s financial services sector last year wrestled with an increasingly stringent regulatory environment, the threat of pending interest rate hikes and highly volatile foreign exchange markets, alongside the additional distractions of Brexit and a US presidential election, yet still ended the year with a more active M&A market than in 2015.
Last year’s 468 deals compare favourably with a 6% increase to the 441 announced in 2015, with value similarly on the rise. A total €101.2bn changed hands throughout last year’s financial services deals versus €84.14bn a year prior, a 20% increase year-on-year.
The two largest contributors to this total came from the banking sector in the form of French holding company Sacam Mutualisation’s 25% stake acquisition in Credit Agricole’s regional banks worth €18.5bn, closely followed by the €17bn merger of Germany’s DZ Bank and Westdeutsche Genossenschafts-Zentralbank (WGZ).
Credit Agricole’s deal served to bolster the French banking group’s capital base in response to Basel III regulations while DZ and WGZ created the country’s third largest bank in terms of total assets. Post-merger, the combined entity has approximately €500bn of assets, placing closely behind German counterpart Commerzbank with €533bn. The deal was taking place barely months before Germany’s largest, Deutsche Bank, was being investigated for misleading and deceiving investors over repackaged mortgages.
Away from banking, insurance deals were hampered by the low interest rate environment, Solvency II and changes to tax regimes across Europe, causing operators to take a hard look at their portfolios and rethink their growth strategies. This led to many insurers divesting non-performing assets and using the cash to improve their capital adequacy ratios. Small to mid-market acquisitions were undertaken in an effort to offset the lack of growth potential in core European markets. That is not to say that the insurance sector was short of sizable deals last year.
Canadian property and casualty insurance provider Fairfax Financial acquired Switzerland-based Allied World for €4.5bn, and the €2.5bn merger between Dutch NN Group and Delta Lloyd Group were both announced in 2016.
The merger between the Canadian and Swiss insurers, along with Fairfax’s acquisition of UK-based Brit insurance in 2015, created a world leader in property and casualty insurance, reinsurance and investments. Meanwhile, NN Group’s decision to acquire its Dutch rival, Delta Lloyd, is expected to generate annual pre-tax cost savings of around €150m by 2020, as well as bringing increased stability to the company in a market full of challenges through benefits of scale.
Regulators’ decision to put in place greater transparency requirements has placed considerable pressure on investment managers operating across the EU to simplify and, ultimately, lower their overall fee structure, especially headline fees. Client fees have often provided a significant level of return for fund, wealth and asset managers alike. However, the Markets in Financial Instruments Directive II (MiFID II) will shed much-needed light on this source of income, permitting clients to heavily scrutinise the charges they incur. The increase in regulation has not only negatively impacted a major revenue stream for fund managers, but the added compliance burden imposed by regulators is ramping up the overall cost of conducting business too. This has led many firms to pursue M&A in order to swell their assets under management (AuM) in a bid to provide a buffer against rising costs coupled with a reduction in fees driven by increased transparency.
Europe’s largest asset manager, Amundi’s €3.6bn acquisition of UniCredit’s Pioneer Investments last year reflects this trend. The transaction increases the French asset manager’s AuM to €1.27tn, making it the 10th largest investment company globally, while also providing the scale required to weather the regulatory storm. In the UK, Tilney Bestinvest’s takeover of wealth manager Towry off Palamon Capital Partners was another such deal
last year. The transaction served to turn Tilney Bestinvest into one of the largest UK wealth management firms providing both financial planning and investment management, boasting €23bn-plus of AuM and a little more than €230m in revenues.
The megamerger between London Stock Exchange (LSE) and Deutsche Boerse announced in March has served to prop up deal value for the financial services sector and will continue to do so this year, as it faces further scrutiny from EU regulators over competition concerns. On top of the antitrust element, the Brexit vote has served to make this one of the most politically charged deals the market has seen in recent years, as German politicians, uncomfortable with the prospect of having euro-denominated clearing in London, push for the headquarter to be relocated to Frankfurt. Despite merger parties eager for the deal to be finalised and remaining adamant that the structure of the deal should remain unchanged, there is still a real risk of it falling through.
The same drivers that spurred deal volumes in financial services last year are likely to continue to do so in 2017. Increased regulation is expected to force companies to assess their portfolios and make divestments in order to bring stability to their balance sheets, while simultaneously looking out for inorganic opportunities in a Europe suffering from a prolonged period of low growth. This year will see national elections in both Germany and France, with opinion polls suggesting that euro-sceptic parties, France’s National Front and Germany’s Alternative fuer Deutschland, threaten to upset the pro-Europe equilibrium and usher in a period of greater uncertainty over the stability of the EU. This is likely to bring more volatility to the stock market and wider fluctuations in exchange rates that will likely spur inbound investment from US businesses looking to take advantage of a weaker euro and sterling.
by Aaran Fronda

15
DEAL DRIVERS – EMEA - FINANCIAL SERVICES
FINANCIAL SERVICESTOP 15 ANNOUNCED DEALS FOR YEAR ENDING 31 DECEMBER 2016 (EUROPEAN TARGET)
Announced Date
Status Bidder Company Target Company Vendor Company Deal Value (€m)
21-Jul-16 C Sacam Mutualisation Credit Agricole – Regional Banks (25% stake) Credit Agricole SA 18,542
12-Apr-16 C DZ Bank AG Westdeutsche Genossenschafts-Zentralbank 17,000
16-Mar-16 P Deutsche Boerse AG London Stock Exchange (LSE) Plc 13,339
18-Dec-16 P Fairfax Financial Holdings Limited Allied World Assurance Company Holdings AG 4,503
23-Mar-16 C Banco Popolare Societa Cooperativa Banca Popolare di Milano Scarl 3,714
12-Dec-16 P Amundi SA Pioneer Investment Management SGR UniCredit Group 3,545
28-Jul-16 C Banca Ifis SpA GE Capital Interbanca SpA General Electric Company 2,555
02-Nov-16 P NN Group NV Delta Lloyd Group 2,459
08-Dec-16 P Powszechny Zaklad Ubezpieczen SA; and Polish Development Fund SA
Bank Pekao SA (32.8% stake) UniCredit Group 2,382
20-Dec-16 P Lloyds Banking Group Plc MBNA Limited Bank of America Corporation 2,262
18-Apr-16 C Quaestio Capital Management Sgr Srl Banca Popolare di Vicenza SpA (99.33% stake) 1,500
28-Apr-16 C WiZink Bank SA Barclays Plc (Barclaycard business in Portugal and Spain)
Barclays Plc 1,300
12-Sep-16 L HarbourVest Global Private Equity Ltd SVG Capital Plc 1,200
01-Jul-16 C Mercedes-Benz Financial Services Nederland BV Athlon Car Lease International BV De Lage Landen International BV 1,100
28-Sep-16 P Phoenix Group Holdings Limited Abbey Life Assurance Company Ltd Deutsche Bank AG 1,085
C = Completed; P = Pending; L = Lapsed

Quarter ended
30.7%
13.5%
6.6%8.3%
5.6%
7.9%
8.8%
15.0%
3.6%
23.3%
20.3%
23.9%
15.8%
2.8%
6.0%
1.7% 5.3%
0.9%
16
DEAL DRIVERS – EMEA - FINANCIAL SERVICES
VALUE VOLUME
UK & Ireland
German speaking
France
Italy
Iberia
Benelux
Nordic
Central & Eastern Europe
Other
QUARTERLY TRENDS
VALUE VOLUME
Based on announced deals, excluding those that lapsed or were withdrawn. Geographic region is determined with reference to the dominant location of the target.
Based on announced deals, excluding those that lapsed or were withdrawn, where the dominant location of the target is in Europe.Industry sector is based on the dominant industry of the target.
FINANCIAL SERVICESMIX OF DEALS BY GEOGRAPHIC REGION
Volu
me
Valu
e (€
m)
0
5,000
10,000
15,000
20,000
25,000
30,000
35,000
40,000
Q4Q3Q2Q1Q4Q3Q2Q1Q4Q3Q2Q1Q4Q3Q2Q1Q4Q3Q2Q1Q4Q3Q2Q1Q4Q3Q2Q1
2010 2011 2012 2013 2014 2015 2016
0
25
50
75
100
125
150
Q4Q3Q2Q1Q4Q3Q2Q1Q4Q3Q2Q1Q4Q3Q2Q1Q4Q3Q2Q1Q4Q3Q2Q1Q4Q3Q2Q1
2010 2011 2012 2013 2014 2015 2016
Quarter endedMoving average trend line

17
DEAL DRIVERS – EMEA - FINANCIAL SERVICES
FINANCIAL SERVICESFINANCIAL ADVISERS
TOP 20 – RANKED BY VALUE TOP 20 – RANKED BY VOLUME
LEGAL ADVISERS
TOP 20 – RANKED BY VALUE TOP 20 – RANKED BY VOLUME
2016 2015 Company Name Value (€m)
Number of Deals
1 9 Bank of America Merrill Lynch 35,759 17
2 1 Morgan Stanley 29,827 13
3 2 JPMorgan 29,119 27
4 5 Rothschild 25,036 25
5 - Credit Agricole 22,629 6
6 3 Goldman Sachs 22,099 13
7 11 Deutsche Bank 21,675 11
8 16 Credit Suisse 20,362 7
9 4 UBS Investment Bank 19,861 11
10 10 Lazard 19,758 10
11 12 Barclays 18,365 18
12 15 HSBC 14,916 4
13 164 Perella Weinberg Partners 14,794 3
14 28 Societe Generale 14,449 9
15 20 RBC Capital Markets 13,703 3
16 - Robey Warshaw 13,339 1
17 29 Mediobanca 9,130 5
18 34 UniCredit Group 8,551 11
19 7 Citi 7,604 12
20 47 KPMG 5,153 26
2016 2015 Company Name Value (€m)
Number of Deals
1 9 Freshfields Bruckhaus Deringer 29,351 29
2 51 Cleary Gottlieb Steen & Hamilton 22,575 8
3 48 White & Case 20,369 16
4= - Brandford-Griffith 18,542 1
4= - Darrois Villey Maillot Brochier 18,542 1
6 2 Linklaters 15,093 28
7 85 Latham & Watkins 13,652 9
8 24 Herbert Smith Freehills 13,386 6
9 131 Baker & McKenzie 11,434 20
10 14 Allen & Overy 10,675 28
11 46 Gianni, Origoni, Grippo, Cappelli & Partners
8,168 7
12 3 Clifford Chance 7,419 21
13 61 Gatti Pavesi Bianchi 7,352 8
14 8 Skadden Arps Slate Meagher & Flom 5,834 10
15 64 Torys 5,745 3
16 38 Shearman & Sterling 5,685 6
17 84 Willkie Farr & Gallagher 5,170 4
18 18 Slaughter and May 4,980 12
19 235 Walder Wyss 4,941 4
20 78 Homburger 4,550 2
2016 2015 Company Name Value (€m)
Number of Deals
1 2 JPMorgan 29,119 27
2 1 KPMG 5,153 26
3 6 Rothschild 25,036 25
4 9 Barclays 18,365 18
5 7 Deloitte 1,463 18
6 14 Bank of America Merrill Lynch 35,759 17
7 3 Morgan Stanley 29,827 13
8 5 Goldman Sachs 22,099 13
9 8 PwC 1,667 13
10 10 Citi 7,604 12
11 16 Deutsche Bank 21,675 11
12 11 UBS Investment Bank 19,861 11
13 28 UniCredit Group 8,551 11
14 4 EY 441 11
15 13 Lazard 19,758 10
16 22 Societe Generale 14,449 9
17 12 Fenchurch Advisory Partners 1,092 9
18 17 BNP Paribas 2,163 8
19 23 ALANTRA 163 8
20 20 Credit Suisse 20,362 7
2016 2015 Company Name Value (€m)
Number of Deals
1 2 Freshfields Bruckhaus Deringer 29,351 29
2 1 Linklaters 15,093 28
3 4 Allen & Overy 10,675 28
4 3 Clifford Chance 7,419 21
5 12 Baker & McKenzie 11,434 20
6 5 CMS 123 17
7 13 White & Case 20,369 16
8 6 DLA Piper 732 13
9 10 Slaughter and May 4,980 12
10 23 Schoenherr Rechtsanwaelte 1,443 11
11 32 Skadden Arps Slate Meagher & Flom 5,834 10
12 15 Hogan Lovells International 1,964 10
13 42 Eversheds 498 10
14 27 Latham & Watkins 13,652 9
15 17 Dentons 392 9
16 20 Cleary Gottlieb Steen & Hamilton 22,575 8
17 67 Gatti Pavesi Bianchi 7,352 8
18 7 Weil Gotshal & Manges 3,446 8
19 9 Norton Rose Fulbright 2,021 8
20 16 Uria Menendez 941 8
The legal adviser league tables by value and volume have been run from 01/01/2016 to 31/12/2016, and include lapsed and withdrawn deals.The tables are pan-European and cover the Financial Services sector.
The financial adviser league tables by value and volume have been run from 01/01/2016 to 31/12/2016, excluding lapsed and withdrawn deals.The tables are pan-European and cover the Financial Services sector.

INDUSTRIALS & CHEMICALSOVERVIEW
DEAL DRIVERS – EMEA - INDUSTRIALS & CHEMICALS
18
The European industrials & chemicals sector last year notched up its second most successful year of deal value and volume on Mergermarket record since 2001, spearheaded by multibillion euro transactions that helped navigate through a year otherwise punctuated with political and economic uncertainty.
Deal value spiked 45% to €144.7bn, catapulting it to becoming the second best performing sector in Europe, with 19.8% of the region’s total M&A value. Deal volume in 2016 ticked up 5% year-on-year, totalling 1,427 transactions.
The German-speaking countries, Germany; Austria and Switzerland, made up the lion’s share of deal activity with 49.2% of value and 25.1% of volume. The UK and Ireland followed with 18.4% of the sector’s value and 15.3% of volume.
Industrials & chemicals deals accounted for three of Europe’s top 20 largest deals last year. China National Chemical Corp (ChemChina), which in 2015 acquired tire manufacturer Pirelli for €8.1bn, this time pursued Switzerland-headquartered agrochemicals business Syngenta. The €42.04bn acquisition, announced in February, eventually became the second-largest European deal after Qualcomm’s €42.06bn takeover of NXP Semiconductor.
Other top-ranking industrials & chemicals sector deals included Johnson Controls’ €15bn acquisition of Irish building controls manufacturer Tyco International, and Siemens AG’s €6.6bn takeover of Gamesa, a Spanish wind turbine maker.
Such high-profile deals helped make up for the slowing pace that Brexit and the US elections brought into play. Following the largely unexpected result in Britain’s referendum on EU membership in June, dealmakers paused for breath – and in some cases extended their summer of holidays – to try to make sense what impact currency fluctuations and potential subsequent trade deals and new regulatory frameworks could have upon manufacturing companies.
The build-up to the US presidential election – and its similarly unforeseen result – added a further layer of uncertainty, which is expected to spill into 2017 as president Donald Trump is set to impose a protectionist agenda over manufacturing businesses in the US, including the automotive segment.
This uncertainty led to more subdued deal activity in the second half of the year, which nevertheless saw an above-average €45.6bn deal value and 691 transactions. Despite the upheaval caused by a stream of political events, factors that had earlier benefitted M&A have not entirely disappeared as low yields and cheap money continued to fill the tanks of buyout firms and companies’ balance sheets.
Inbound interest from Chinese buyers was another factor that pushed deal activity across the sector. Besides ChemChina’s combination with Syngenta deal, other high-profile Chinese bids included Midea Group’s €3.8bn takeover of German industrial robots manufacturer Kuka; China Tianying’s acquisition of Urbaser, a Spanish waste management business, for €2.2bn; and Yinyi’s purchase of Punch Powertrain, a Belgian automotive technology developer, for €1bn.
The industrials & chemicals sector has been of particular interest to China’s M&A outbound efforts as per its ‘Made in China 2025’ plan – a government-led initiative pushing companies to upgrade the country’s manufacturing capabilities via acquisitions. European businesses with technology in areas such as automation, robotics and artificial intelligence have increasingly become targets for cash-rich Chinese corporations and buyout firms.
M&A has also resulted from companies’ efforts to rearrange their businesses. French oil major, Total, sold its German chemical division Atotech in a €2.9bn deal to US PE firm The Carlyle Group. The sale, which ranked among the largest sponsor-backed transaction in the sector last year, was part of a US$10bn disposal plan set in response to the weakness in oil prices.
Such a rationale was also behind deals carried out by diversified industrials groups looking to gain focus in certain segments. Johnson Controls spun off Adient, its unit specialised in the automotive market, in a €3.9bn transaction that was part of its efforts to concentrate on the building controls segment. These were later reaffirmed with the acquisition of Tyco International. US-headquartered Emerson Electric, which had been running a strategic review for a couple of years, announced the sale of its European-based Motors, Drives and Electric Power Generation businesses, including branches in France and the UK, to Nidec, a Japanese motor maker, for €1bn.
On the back of a strong year, dealmakers have started 2017 on a bullish note as low yields appear likely to continue fuelling PE firms with cheap money while sluggish organic growth perspectives in Europe could prompt companies to hunt external growth alternatives. Setbacks may come from uncertainty in political events such as the developments on the Brexit process and the unpredictable polices arising from the new US administration.
More headwinds could come from potential curbs on outbound Chinese M&A. Protectionism over the country could be on the rise. China’s Fujian Grand Chip abandoned its takeover of Aixtron, a German semiconductor group with US branches, as the US administration blocked the deal based on national security grounds while the German government hesitated amid concerns over an increasing number of Chinese takeovers. Obstacles could also come from the Chinese government itself. At the end of 2016, Chinese authorities announced new plans to control capital outflow and keep the renminbi stable, in a measure that is likely to affect outbound M&A.
by Joao Grando

19
DEAL DRIVERS – EMEA - INDUSTRIALS & CHEMICALS
INDUSTRIALS & CHEMICALSTOP 15 ANNOUNCED DEALS FOR YEAR ENDING 31 DECEMBER 2016 (EUROPEAN TARGET)
Announced Date
Status Bidder Company Target Company Vendor Company Deal Value (€m)
03-Feb-16 P China National Chemical Corporation Syngenta AG 42,039
25-Jan-16 C Johnson Controls Inc Tyco International plc 14,973
17-Jun-16 P Siemens AG Gamesa Corporacion Tecnologica SA 6,640
08-Sep-16 C Johnson Controls Inc (Shareholders) Adient plc Johnson Controls Inc 3,910
18-May-16 C Midea Group Co Ltd KUKA AG (86.5% stake) 3,778
06-Oct-16 P The Carlyle Group Atotech Total SA 2,861
17-Jun-16 C BASF SE Chemetall GmbH Albemarle Corporation 2,843
18-Aug-16 P Emerson Electric Co Pentair Plc (Valves & Controls) Pentair Plc 2,783
26-Sep-16 C China Tianying Inc Urbaser SA ACS Actividades de Construccion y Servicios SA 2,212
16-Nov-16 P Electricite de France SA New NP (75% stake) AREVA SA 1,875
11-Oct-16 P General Electric Company LM Wind Power Holding A/S Doughty Hanson & Co 1,500
08-Jul-16 C Dmitry Lobyak (Private investor) Uralkali OJSC (20% stake) The ONEXIM Group 1,492
02-Jun-16 C EQT Partners AB Apleona GmbH Bilfinger SE 1,400
16-May-16 C Konecranes Plc Terex Corporation (Material handling & port solutions business)
Terex Corporation 1,127
02-Aug-16 C Nidec Corporation Emerson Electric Co (Motors, drives and electric power generation businesses)
Emerson Electric Co 1,072
C = Completed; P = Pending; L = Lapsed

Quarter endedQuarter ended
20
DEAL DRIVERS – EMEA - INDUSTRIALS & CHEMICALS
INDUSTRIALS & CHEMICALSMIX OF DEALS BY GEOGRAPHIC REGION
VALUE VOLUME
UK & Ireland
German speaking
France
Italy
Iberia
Benelux
Nordic
Central & Eastern Europe
Other
VALUE VOLUME
Moving average trend line
Based on announced deals, excluding those that lapsed or were withdrawn. Geographic region is determined with reference to the dominant location of the target.
Based on announced deals, excluding those that lapsed or were withdrawn, where the dominant location of the target is in Europe.Industry sector is based on the dominant industry of the target.
QUARTERLY TRENDS
Valu
e (€
m)
Volu
me
Quarter endedQuarter ended
0
50
100
150
200
250
300
350
400
Q4Q3Q2Q1Q4Q3Q2Q1Q4Q3Q2Q1Q4Q3Q2Q1Q4Q3Q2Q1Q4Q3Q2Q1Q4Q3Q2Q1
2010 2011 2012 2013 2014 2015 2016
0
10,000
20,000
30,000
40,000
50,000
60,000
70,000
Q4Q3Q2Q1Q4Q3Q2Q1Q4Q3Q2Q1Q4Q3Q2Q1Q4Q3Q2Q1Q4Q3Q2Q1Q4Q3Q2Q1
2010 2011 2012 2013 2014 2015 2016
15.3%
25.0%
12.7%11.3%
5.8%
8.1%
13.5%
6.8% 1.5%
49.1%
18.4%
7.3%
3.3%
9.1%
3.5%
7.1%
1.9%0.3%

21
DEAL DRIVERS – EMEA - INDUSTRIALS & CHEMICALS
INDUSTRIALS & CHEMICALSFINANCIAL ADVISERS
TOP 20 – RANKED BY VALUE TOP 20 – RANKED BY VOLUME
LEGAL ADVISERS
TOP 20 – RANKED BY VALUE TOP 20 – RANKED BY VOLUME
2016 2015 Company Name Value (€m)
Number of Deals
1 10 Morgan Stanley 116,113 18
2 7 Credit Suisse 104,398 14
3 1 Goldman Sachs 87,106 23
4 2 Rothschild 75,049 56
5 3 Bank of America Merrill Lynch 65,327 9
6 4 JPMorgan 62,003 18
7 - Ducera Partners 56,454 1
8 8 UBS Investment Bank 47,847 13
9 40 HSBC 46,612 10
10 66 ALANTRA 43,167 21
11= - CCB International 42,039 1
11= - China CITIC Bank Corporation 42,039 1
11= 304 China International Capital 42,039 1
11= - Dyalco 42,039 1
15 14 Citi 34,883 20
16 13 Lazard 28,344 29
17 6 Barclays 26,523 16
18 - Centerview Partners 21,305 4
19 5 Deutsche Bank 13,143 6
20 9 BNP Paribas 9,905 18
2016 2015 Company Name Value (€m)
Number of Deals
1 13 Clifford Chance 109,328 40
2 49 Cravath, Swaine & Moore 98,493 2
3 19 Allen & Overy 84,269 33
4 9 Wachtell, Lipton, Rosen & Katz 79,739 6
5 4 Sullivan & Cromwell 76,863 10
6 5 Linklaters 71,081 36
7 51 Shearman & Sterling 67,789 13
8 14 Simpson Thacher & Bartlett 62,757 10
9 3 Cleary Gottlieb Steen & Hamilton 61,461 16
10 18 Paul Weiss Rifkind Wharton & Garrison 59,986 13
11 78 Debevoise & Plimpton 59,583 5
12 - Morrison & Foerster 58,107 5
13 339 Luthra & Luthra Law Offices 56,481 2
14 128 WilmerHale 56,467 2
15 71 Stikeman Elliott 56,454 5
16 - Franceschini e Miranda Advogados 56,454 1
17 11 White & Case 51,962 52
18 12 Davis Polk & Wardwell 51,509 9
19 80 Fangda Partners 50,927 8
20 414 Homburger 45,552 5
2016 2015 Company Name Value (€m)
Number of Deals
1 3 KPMG 2,717 65
2 1 PwC 1,902 62
3 4 Rothschild 75,049 56
4 5 Deloitte 8,711 50
5 2 EY 879 41
6 6 Lincoln International 839 31
7 8 BDO 205 30
8 7 Lazard 28,344 29
9 17 Goldman Sachs 87,106 23
10 16 Global M&A Partners 192 22
11 22 ALANTRA 43,167 21
12 9 Oaklins 325 21
13 20 Citi 34,883 20
14 25 Clearwater International 422 19
15 14 Morgan Stanley 116,113 18
16 13 JPMorgan 62,003 18
17 38 BNP Paribas 9,905 18
18 29 Barclays 26,523 16
19 12 DC Advisory 773 15
20 26 Credit Suisse 104,398 14
2016 2015 Company Name Value (€m)
Number of Deals
1 4 CMS 3,799 61
2 1 DLA Piper 4,342 53
3 6 White & Case 51,962 52
4 3 Baker & McKenzie 6,270 48
5 8 Jones Day 5,281 47
6 5 Clifford Chance 109,328 40
7 11 Freshfields Bruckhaus Deringer 28,954 38
8 10 Linklaters 71,081 36
9 2 Allen & Overy 84,269 33
10 7 Latham & Watkins 9,547 32
11 9 Eversheds 3,440 30
12 44 McDermott Will & Emery 5,249 27
13 19 Mannheimer Swartling 2,942 25
14 33 PwC legal 1,725 24
15 25 Vinge 1,534 24
16 15 Hengeler Mueller 5,420 21
17 16 Gleiss Lutz 44,770 20
18 17 King & Wood Mallesons 43,349 20
19 54 Noerr 890 20
20 79 Orrick Herrington & Sutcliffe 798 20
The financial adviser league tables by value and volume have been run from 01/01/2016 to 31/12/2016, excluding lapsed and withdrawn deals. The tables are pan-European and are based on the following sectors: Automotive; Chemicals & Materials; Industrials – electronics, automation and products and services; and Manufacturing – other.
The legal adviser league tables by value and volume have been run from 01/01/2016 to 31/12/2016 and include lapsed and withdrawn deals.The tables are pan-European and are based on the following sectors: Automotive; Chemicals & Materials; Industrials – electronics, automation and products and services; and Manufacturing – other.

DEAL DRIVERS – EMEA - ENERGY, MINING & UTILITIES
22
ENERGY, MINING & UTILITIESOVERVIEW
Deal activity across energy, mining and utility companies in 2016 somewhat mirrored that of commodity prices, rising throughout the year eventually ending 3% higher in terms of volume with 421 deals taking place versus 408 in 2015.
In January 2016, the oil prices sank below US$28-a-barrel, its lowest level since 2003, giving the industry already struggling to come to terms with a supply glut reality check.
But with Brent now happily trading above US$50-a-barrel, long-term investor appetite in 2016 resulted in slightly more dealmaking than in 2015.
However, combined value of Europe deals across all three sectors reached €93bn compared to €130bn in 2015, representing a 29% decrease on the previous year.
Energy, mining and utilities deals accounted for around 12.7% of the total value of M&A conducted across Europe in 2016, and 6% of total M&A volume.
Although not an entirely bullish year on the outset, there remains reason for optimism. Last year saw both the oil price nadir and political tumult – two trends that, by right, should depress both natural resource and utility deals.
However, the foot-dragging seen in 2015 among natural resource companies has seemingly been overcome. While depressed oil prices gave sellers the rationale and reasoning needed to exit, the steady rise in prices in the second half gave buyers confidence in mid- to long-term valuations.
The second-largest oil and gas deal was Rosneft’s capital hike, which saw a consortium led by Qatar Investment Authority and involving Glencore, take a 19.5% stake in the company for around €10.5bn.
Earlier in the year, the oil crunch saw other deals filter through as upstream and services companies sought out cleverly structured combinations to keep themselves competitive.
Topping this list was the €4bn merger between FMC Technologies and Technip, announced in May. The market downturn
drove the US equipment manufacturer and the French contractor together in order to cut costs and provide a single oilfield services offering to operators.
Mining likewise experienced a year divided by bearish and bullish commodity prices. The swing in prices became a disruptive influence on potentially large deals, as EMEA-headquartered major miners first launched and then hesitated on large disposal programmes. Glencore and Anglo American both set ambitious divestment targets in order to reduce their debt pile. These sales launched in earnest at the beginning of 2016 but the vendors’ expectations rose in line with commodity prices, and most of the deals fizzled out as markets improved and the urgency to sell abated.
Renewables saw a positive 2016 deal flow, with offshore wind catching the majority of interest, as highlighted by Blackstone Energy Partners’ €1.7bn sale of an 80% stake in Germany’s 288MW Meerwind wind farm to China Three Gorges.
Buyer interest in European power and utilities also yielded lively dealmaking activity in 2016. The largest deal of the year was the National Grid’s sale of a 61% stake in its UK gas distribution networks in December to a consortium of bidders led by Macquarie Infrastructure and Real Assets and China Investment Corp for €13.4bn.
French utility EDF’s sale of a 49.9% stake in French electricity distributor RTE for €4bn, as well as Spanish company Repsol and investment group Criteria Caixa’s 20% sale of Gas Natural Fenosa for €3.8bn are further examples of highly valued and highly competitive deals that took place in 2016.
These deals also became indicative of the appetite of long term investors – infrastructure and pension funds – for regulated and stable European assets.
Additionally, many deals that took place saw an element of interest from Asian investors looking to deploy capital in Europe. The €1.4bn sale of German waste-to-energy company EEW by EQT to Beijing Enterprise, being yet a further example.
Already 2017 appears to be shaping towards continuation of those trends seen in the second half of last year. A more stable oil price has created a positive deal environment and investor sentiment has returned to the sector, which may lead to a number of small-and-mid cap IPOs, as well as provide a little vim and vigour needed for larger players to return more active and acquisitive. A number of large oil and gas assets remain for sale and only time will tell whether the bid-ask disparity eventually aligns and these are successfully executed.
Mining should see a similar level of improved activity, with capital returning to exploration and with mid-tier producers seeing an opportunity to consolidate. With Glencore’s head, Glasenberg, returning to his entrepreneurial form and Anglo American’s spin-off plans afoot, the major miners could also surprise the sector with left-field transactions.
Power producers and utilities, however, remain the safest bet for a bullish 2017. The pipeline looks set with the sale of Goldman Sachs’ Spanish and Finnish portfolio gas distribution companies, Redexis and Elenia, due to kick off. Many large utilities such as EDF, Engie, Centrica, E.ON and Enel are carefully looking at adapting their portfolios and business focus, which could create opportunities for players looking to consolidate in their space.
by Patrick Harris

23
DEAL DRIVERS – EMEA – ENERGY, MINING & UTILITIES
ENERGY, MINING & UTILITIESTOP 15 ANNOUNCED DEALS FOR YEAR ENDING 31 DECEMBER 2016 (EUROPEAN TARGET)
Announced Date
Status Bidder Company Target Company Vendor Company Deal Value (€m)
08-Dec-16 P A Consortium led by Macquarie Infrastructure and Real Assets
National Grid Gas Distribution Ltd (61% stake) National Grid Plc 13,428
07-Dec-16 P A Consortium led by Qatar Investment Authority Rosneft Oil Company OAO (19.5% stake) Rosneftegaz OAO 10,503
10-Oct-16 C Rosneft Oil Company OAO Bashneft ANK OAO (50.08% stake) The Federal Agency for State Property Management
5,929
14-Dec-16 P Caisse des Depots et Consignations; and CNP Assurances SA
Réseau de Transport d'Electricité (49.9% stake) Electricite de France SA 4,092
19-May-16 C FMC Technologies Inc Technip SA 4,060
12-Sep-16 C Global Infrastructure Partners Gas Natural Fenosa (20% stake) Repsol SA; and Criteria Caixa SAU 3,803
28-Oct-16 C Rosneft Oil Company OAO Bashneft ANK OAO (31.2% stake) 2,849
29-Jun-16 P Snam SpA (Shareholders) Italgas SpA (86.5% stake) Snam SpA 2,836
30-Nov-16 C E.ON SE (Shareholders) Uniper SE (53.35% Stake) E.ON SE 1,955
17-Oct-16 C EP Investment SARL; and EP Investment 2 SARL Energeticky a Prumyslovy Holding AS (35% stake) Milees Limited 1,862
15-Jul-16 P Gazprom PJSC Gazprom PJSC (3.59% stake) Vnesheconombank 1,728
13-Jun-16 C China Three Gorges Corporation WindMW GmbH (80% stake) Blackstone Energy Partners LP 1,700
17-Oct-16 P Energeticky a Prumyslovy Holding AS Energeticky a Prumyslovy Holding AS (30% stake) Biques Limited; EP Investment SARL; and Milees Limited
1,500
17-Oct-16 P Consortium of investors led by Macquarie Group Limited
EP Infrastructure AS (30% stake) Energeticky a Prumyslovy Holding AS 1,500
04-Feb-16 C Beijing Enterprises Holdings Limited EEW Energy from Waste GmbH EQT Partners AB 1,438
C = Completed; P = Pending; L = Lapsed

Quarter endedQuarter ended
24
DEAL DRIVERS – EMEA - ENERGY, MINING & UTILITIES
ENERGY, MINING & UTILITIESMIX OF DEALS BY GEOGRAPHIC REGION
VALUE VOLUME
UK & Ireland
German speaking
France
Italy
Iberia
Benelux
Nordic
Central & Eastern Europe
Other
QUARTERLY TRENDS
VALUE VOLUME
Based on announced deals, excluding those that lapsed or were withdrawn. Geographic region is determined with reference to the dominant location of the target.
Based on announced deals, excluding those that lapsed or were withdrawn, where the dominant location of the target is in Europe.Industry sector is based on the dominant industry of the target.
Valu
e (€
m)
Volu
me
0
20
40
60
80
100
120
140
Q4Q3Q2Q1Q4Q3Q2Q1Q4Q3Q2Q1Q4Q3Q2Q1Q4Q3Q2Q1Q4Q3Q2Q1Q4Q3Q2Q1
2010 2011 2012 2013 2014 2015 2016
0
10,000
20,000
30,000
40,000
50,000
60,000
70,000
80,000
90,000
Q4Q3Q2Q1Q4Q3Q2Q1Q4Q3Q2Q1Q4Q3Q2Q1Q4Q3Q2Q1Q4Q3Q2Q1Q4Q3Q2Q1
2010 2011 2012 2013 2014 2015 2016
19.2%
11.6%
8.3%
10.9%9.3%
4.8%
14.3%
18.5%
3.1%
23.6%
7.0%
11.6%
6.1%8.0%0.7%
4.9%
37.4%
0.7%
Moving average trend line

25
DEAL DRIVERS – EMEA - ENERGY, MINING & UTILITIES
ENERGY, MINING & UTILITIESFINANCIAL ADVISERS
TOP 20 – RANKED BY VALUE TOP 20 – RANKED BY VOLUME
LEGAL ADVISERS
TOP 20 – RANKED BY VALUE TOP 20 – RANKED BY VOLUME
2016 2015 Company Name Value (€m)
Number of Deals
1 3 Bank of America Merrill Lynch 30,301 11
2 2 Morgan Stanley 22,702 10
3 15 VTB Capital 20,901 8
4 33 RBC Capital Markets 20,659 13
5 24 Macquarie Group 17,124 9
6 13 Barclays 16,718 7
7 4 Goldman Sachs 15,958 11
8 7 Citi 14,977 16
9 6 Robey Warshaw 13,428 1
10 5 Rothschild 12,417 24
11= - Arpwood Capital 11,490 2
11= - JM Financial 11,490 2
13 1 Lazard 9,626 16
14 31 Societe Generale 9,113 5
15 8 Deutsche Bank 8,855 7
16 50 UBS Investment Bank 8,750 5
17 17 BNP Paribas 8,314 14
18 20 Evercore Partners 6,774 7
19 22 Santander Global Corporate Banking 6,044 8
20 - Sberbank 5,929 1
2016 2015 Company Name Value (€m)
Number of Deals
1 14 Linklaters 40,232 31
2 17 White & Case 22,613 25
3 23 Clifford Chance 19,244 28
4 6 Freshfields Bruckhaus Deringer 17,896 13
5 37 CMS 16,081 25
6 165 Eversheds 15,180 11
7 64 Baker & McKenzie 14,760 9
8= 140 AZB & Partners 11,490 2
8= 132 Cyril Amarchand Mangaldas 11,490 2
10 29 Latham & Watkins 10,840 10
11 - Cleary Gottlieb Steen & Hamilton 10,508 5
12 - Darrois Villey Maillot Brochier 8,441 3
13 - Talwar Thakore & Associates 6,573 3
14 1 Herbert Smith Freehills 5,903 16
15 30 Garrigues 5,130 5
16 24 Skadden Arps Slate Meagher & Flom 4,914 6
17 48 Weil Gotshal & Manges 4,749 5
18 26 Sullivan & Cromwell 4,561 3
19 15 Norton Rose Fulbright 4,542 25
20 31 Uria Menendez 4,171 8
2016 2015 Company Name Value (€m)
Number of Deals
1 5 Rothschild 12,417 24
2 4 KPMG 1,875 20
3 2 Citi 14,977 16
4 9 Lazard 9,626 16
5 3 BNP Paribas 8,314 14
6 1 EY 604 14
7 18 RBC Capital Markets 20,659 13
8 8 PwC 667 13
9 14 Bank of America Merrill Lynch 30,301 11
10 10 Goldman Sachs 15,958 11
11 6 Morgan Stanley 22,702 10
12 7 Macquarie Group 17,124 9
13 11 UniCredit Group 3,805 9
14 25 VTB Capital 20,901 8
15 26 Santander Global Corporate Banking 6,044 8
16 16 Credit Suisse 5,673 8
17 17 Barclays 16,718 7
18 15 Deutsche Bank 8,855 7
19 20 Evercore Partners 6,774 7
20 12 JPMorgan 5,193 6
2016 2015 Company Name Value (€m)
Number of Deals
1 5 Linklaters 40,232 31
2 1 Clifford Chance 19,244 28
3 11 White & Case 22,613 25
4 3 CMS 16,081 25
5 2 Norton Rose Fulbright 4,542 25
6 40 Orrick Herrington & Sutcliffe 3,989 18
7 4 Allen & Overy 3,000 18
8 7 Herbert Smith Freehills 5,903 16
9 9 DLA Piper 1,145 15
10 19 Freshfields Bruckhaus Deringer 17,896 13
11 16 Watson, Farley & Williams 2,037 13
12 8 Hogan Lovells International 2,746 12
13 18 Eversheds 15,180 11
14 33 Latham & Watkins 10,840 10
15 35 Dentons 2,366 10
16 10 Baker & McKenzie 14,760 9
17 41 BA-HR 1,713 9
18 22 Thommessen 1,400 9
19 15 Cuatrecasas 269 9
20 20 Uria Menendez 4,171 8
The financial adviser league tables by value and volume have been run from 01/01/2016 to 31/12/2016, excluding lapsed and withdrawn deals. The tables are pan-European and are based on the following sectors: Energy, Mining and Utilities.
The legal adviser league tables by value and volume have been run from 01/01/2016 to 31/12/2016 and include lapsed and withdrawn deals.The tables are pan-European and are based on the following sectors: Energy, Mining and Utilities.

DEAL DRIVERS – EMEA - CONSUMER
26
CONSUMEROVERVIEW
While in 2015 European consumer and retail M&A activity was characterised by a series of mega deals, 2016 gave way to a more balanced environment dominated by post-deal disposals, increased levels of tactical M&A and more reasonable valuations, particularly for higher-risk deals. Macroeconomic uncertainty surrounding Brexit, alongside tightening credit markets, impacted activity but as yet there has been no strong indication of a long-term downturn in M&A levels. Deals have continued, albeit more focused on the small to mid-market.
The last quarter of the year registered the highest deal value, reaching €16.6bn, but this was still a far cry from the impressive €124.7bn registered in Q4 2015 thanks to the €114.5bn 'megabrew' merger between AB InBev and SABMiller. Still, Q4 2016 was a substantial improvement from Q3 2016, which registered €5.1bn in deal value, the lowest recorded since Q3 2009, when activity reached a mere €4.2bn.
Total deal value for the year stood at €40.6bn across 974 deals. Volume was similar to the 982 registered in 2015 and slightly above the 941 of 2014.
Only one consumer transaction made it to the top 20 largest deals of the year – the Asahi Group’s takeover of Anheuser-Busch InBev’s Eastern European assets, for €7.3bn. This compares to the three deals included in 2015’s equivalent list. Moreover, the Asahi deal would not have even broken into 2015’s top 20 largest deals, such has been the shift in M&A values.
Asahi’s deal was, however, the most expensive transaction the Japanese company has completed so far. Asahi also played a part in the second-largest consumer deal last year having acquired a package of beer brands in Western Europe from SABMiller. The disposals were needed to secure competition regulators’ approval for the megabrew.
Activity in the retail space was particularly strong in the UK, despite the initial panic in the immediate aftermath of the result of the EU referendum and the expectations
for a decline in consumer spending and high-street metrics. The UK registered 71 retail deals for the whole year, behind France’s 91 deals. However, in value terms, the UK was well ahead seeing €4.3bn worth of deals take place, while France only recorded €918m. The retail segment in the European consumer sector, was the most prolific, with a total of 367 deals.
The largest retail deal of the year was French Groupe SEB’s takeover of German tableware and kitchenware supplier WMF for €1.6bn. A similar-sized deal was J Sainsbury's acquisition of UK-based Home Retail Group. Also in the UK, discount retailer Poundland, was acquired by Steinhoff International for €578m. The latter two deals are examples of how companies in the space continue to look at ways to diversify and reposition themselves in a challenging landscape characterised by changing consumer behaviours and fierce competition.
The foods segment continued to see relatively subdued levels of activity. There were 298 deals announced across Europe for the whole year, amounting to €5.75bn. The UK and Ireland together were the most active with 47 deals totalling €1.13bn. Relevant UK deals include the sale of potato chips manufacturer Tyrrells Group by Investcorp to US-based snack food group Amplify Snack Brands for €354m, the acquisition of a 50% stake in fresh food producer Bakkavor Group by Bakk AL Holdings for €215m, and the sale ofa 19.9% stake in Premier Foods to Nissin Foods Holdings of Japan for €131m.
Private equity activity bounced back, particularly in the second half of the year. Significant levels of dry powder on the back of successful fund closes in previous years and sponsors keen to deploy capital have driven activity. There have been a number of large disposals by PE houses, including KKR’s sale of WMF to SEB for €1.6bn; German lighting company SLV, which was sold to Ardian by Cinven for €800m; and Ardian’s exit from German fashion retailer Schustermann & Borenstein to Permira for €700m.
The positive end to 2016 has given way to a surge of deals being readied for the first half of 2017 in spite of the uncertainties ahead – Brexit; elections in France, Germany and the Netherlands; Trump’s protectionist rhetoric; and China’s clamp down on outbound investments. The year has certainly had a good start with the announcement of two mega deals: the acquisition of Italian Luxottica by French ophthalmic lens group Essilor International, and the transatlantic merger of tobacco giants British American Tobacco and Reynolds American for €56.98 bn.
by Virginia Garcia Martinez

27
DEAL DRIVERS – EMEA - CONSUMER
CONSUMERTOP 15 ANNOUNCED DEALS FOR YEAR ENDING 31 DECEMBER 2016 (EUROPEAN TARGET)
Announced Date
Status Bidder Company Target Company Vendor Company Deal Value (€m)
13-Dec-16 P Asahi Group Holdings Ltd Anheuser-Busch InBev NV (Central and East European Beer Business)
Anheuser-Busch InBev NV 7,300
19-Apr-16 C Asahi Group Holdings Ltd Royal Grolsch NV (Grolsche Bierbrouwerij Nederland NV); Birra Peroni SRL; and Meantime Brewing Company Limited
SABMiller Plc 2,550
23-May-16 C Groupe SEB SA WMF Group GmbH Kohlberg Kravis Roberts & Co LP 1,585
18-Mar-16 C J Sainsbury Plc Home Retail Group Plc 1,584
18-Mar-16 L Conforama France SA Darty Plc 1,216
12-Apr-16 C InvestIndustrial Artsana SpA (60% stake) The Catelli family 1,200
14-Dec-16 P Safmar Financial & Investment Group M.Video Alexander Tynkovan (Private investor); Mikhail Tynkovan (Private investor); and Pavel Breev (Private investor)
1,134
27-Oct-16 P Ardian SLV GmbH Cinven Partners LLP 800
19-Feb-16 C Dolly Srl Panini SpA Fineldo SpA; and Hugo Aldo Sallustro (Private investor)
755
25-Oct-16 P Permira Advisers LLP Schustermann & Borenstein GmbH Ardian 700
15-Mar-16 C Davide Campari-Milano SpA Societe des Produits Marnier Lapostolle 652
04-Oct-16 P LVMH Moet Hennessy Louis – Vuitton SE Rimowa GmbH (80% stake) Dieter Morszeck (Private investor) 640
27-Dec-16 P Groupe Lactalis SA Parmalat SpA (12.26% stake) 637
13-Jul-16 C Steinhoff International Holdings Ltd Poundland Group plc (76.4% stake) 578
25-Aug-16 C Leonard Green & Partners LP Signet Jewelers Limited (Undisclosed Stake) 554
C = Completed; P = Pending; L = Lapsed

Quarter ended Quarter ended
28
DEAL DRIVERS – EMEA - CONSUMER
CONSUMERMIX OF DEALS BY GEOGRAPHIC REGION
VALUE VOLUME
UK & Ireland
German speaking
France
Italy
Iberia
Benelux
Nordic
Central & Eastern Europe
Other
QUARTERLY TRENDS
VALUE VOLUME
Based on announced deals, excluding those that lapsed or were withdrawn. Geographic region is determined with reference to the dominant location of the target.
Based on announced deals, excluding those that lapsed or were withdrawn, where the dominant location of the target is in Europe. Industry sector is based on the dominant industry of the target.
Moving average trend line
Volu
me
Valu
e (€
m)
0
10,000
20,000
30,000
40,000
50,000
60,000
70,000
80,000
90,000
100,000
110,000
120,000
130,000
Q4Q3Q2Q1Q4Q3Q2Q1Q4Q3Q2Q1Q4Q3Q2Q1Q4Q3Q2Q1Q4Q3Q2Q1Q4Q3Q2Q1
2010 2011 2012 2013 2014 2015 2016
0
25
50
75
100
125
150
175
200
225
250
275
300
Q4Q3Q2Q1Q4Q3Q2Q1Q4Q3Q2Q1Q4Q3Q2Q1Q4Q3Q2Q1Q4Q3Q2Q1Q4Q3Q2Q1
2010 2011 2012 2013 2014 2015 2016
17.5%
13.4%
18.2%
8.9%
7.6%
9.5%
12.0%
10.9%2.0%
21.8%
14.6%
3.7%
6.9%
19.3%
2.6%
3.9%
26.0%
1.2%

29
DEAL DRIVERS – EMEA - CONSUMER
CONSUMERFINANCIAL ADVISERS
TOP 20 – RANKED BY VALUE TOP 20 – RANKED BY VOLUME
LEGAL ADVISERS
TOP 20 – RANKED BY VALUE TOP 20 – RANKED BY VOLUME
2016 2015 Company Name Value (€m)
Number of Deals
1 16 Rothschild 31,344 36
2 3 Lazard 30,180 26
3 7 Morgan Stanley 22,789 7
4 1 Goldman Sachs 18,902 14
5 4 Deutsche Bank 13,531 7
6 6 Barclays 8,855 9
7 5 Bank of America Merrill Lynch 7,915 7
8 12 Credit Suisse 7,722 10
9 20 Credit Agricole 6,928 13
10 2 JPMorgan 6,631 10
11 19 HSBC 6,468 5
12= - JayDee Partners 5,519 1
12= - Maybank Investment Bank 5,519 1
14 10 BNP Paribas 5,354 10
15 14 Citi 5,242 6
16 116 Natixis 5,225 9
17 15 UBS Investment Bank 4,939 13
18 40 Societe Generale 4,116 3
19 13 Perella Weinberg Partners 3,559 3
20 25 UniCredit Group 2,167 12
2016 2015 Company Name Value (€m)
Number of Deals
1 2 Freshfields Bruckhaus Deringer 15,640 21
2 24 Skadden Arps Slate Meagher & Flom 14,237 9
3 19 Allen & Overy 12,545 30
4 4 Cravath, Swaine & Moore 12,454 4
5 89 Dechert 12,022 11
6 76 Bredin Prat 11,070 9
7 13 Wachtell, Lipton, Rosen & Katz 11,039 2
8 5 Linklaters 10,637 24
9 7 Hogan Lovells International 10,248 14
10 1 Cleary Gottlieb Steen & Hamilton 7,519 10
11 70 Darrois Villey Maillot Brochier 7,171 4
12 28 Kirkland & Ellis 4,137 7
13 354 Baer & Karrer 4,014 7
14 3 Clifford Chance 3,976 24
15 - King & Spalding 3,472 2
16 17 Simpson Thacher & Bartlett 3,121 7
17 10 Bowmans 3,025 2
18 31 Hengeler Mueller 2,695 7
19 102 Dentons 2,592 16
20 171 Walder Wyss 2,484 8
2016 2015 Company Name Value (€m)
Number of Deals
1 1 KPMG 1,335 43
2 3 Deloitte 554 39
3 4 PwC 840 37
4 2 Rothschild 31,344 36
5 7 Lazard 30,180 26
6 8 EY 622 26
7 41 BDO 305 17
8 5 Goldman Sachs 18,902 14
9 9 Oaklins 116 14
10 20 Credit Agricole 6,928 13
11 17 UBS Investment Bank 4,939 13
12 26 UniCredit Group 2,167 12
13 33 ALANTRA 261 11
14 14 Credit Suisse 7,722 10
15 6 JPMorgan 6,631 10
16 19 BNP Paribas 5,354 10
17 25 Barclays 8,855 9
18 76 Natixis 5,225 9
19 27 Houlihan Lokey 719 9
20 23 Lincoln International 403 9
2016 2015 Company Name Value (€m)
Number of Deals
1 3 DLA Piper 1,377 34
2 1 Allen & Overy 12,545 30
3 6 Linklaters 10,637 24
4 4 Clifford Chance 3,976 24
5 5 Baker & McKenzie 1,183 24
6 2 CMS 657 24
7 11 Freshfields Bruckhaus Deringer 15,640 21
8 10 Eversheds 224 21
9 7 White & Case 2,196 20
10 26 Dentons 2,592 16
11 12 Hogan Lovells International 10,248 14
12 8 Latham & Watkins 1,678 14
13 40 Pedersoli Studio Legale 1,509 13
14 30 PwC legal 650 13
15 36 Cuatrecasas 560 13
16 62 Gianni, Origoni, Grippo, Cappelli & Partners
1,661 12
17 100 Chiomenti 1,619 12
18 117 Dechert 12,022 11
19 64 Travers Smith 1,693 11
20 24 Stibbe 551 11
The financial adviser league tables by value and volume have been run from 01/01/2016 to 31/12/2016, excluding lapsed and withdrawn deals.The tables are pan-European and are based on the following sectors: Consumer -retail, food and other.
The legal adviser league tables by value and volume have been run from 01/01/2016 to 31/12/2016 and include lapsed and withdrawn deals.The tables are pan-European and are based on the following sectors: Consumer – retail, food and other.

30
DEAL DRIVERS – EMEA - TMT
TELECOMS, MEDIA & TECHNOLOGYOVERVIEW
The year was shaping up to be lacklustre for European telecoms, media & technology (TMT) M&A, but activity heated up in the second half of the year with several blockbuster deals.
The largest deal of the year in Europe across all sectors, US-based semiconductor firm Qualcomm’s €42bn bid for Dutch peer NXP, which was announced in October, helped bump up value significantly.
The second and third largest TMT deals in Europe in 2016 were also announced in the second half of the year. Japanese company SoftBank’s €27.3bn bid for UK-based semiconductor technology firm ARM, and 21st Century Fox’s €21.4bn bid for the 60.9% stake in UK Sky which it did not already own, resulted in record deal value for Europe with €154bn by year’s end.
Telecoms Despite a robust overall performance, dealmaking in the telecom carriers segment sank to its lowest level of deal value on record, as a series of planned mega deals fell apart. While deal volume was on a relatively even keel with a decline of 8% to 86 deals across the region, the total value dropped to €16.3bn from €50bn a year earlier.
The collapse of multi-billion-euro merger talks between Orange and Bouygues, as well as French regulator AMG’s opposition to Dutch cable company Altice’s €2.47bn offer to buy the rest of French SFR Group telecom unit not only stymied any potential growth in annual deal value but also put a damper on the long-awaited consolidation across Europe’s telecoms landscape.
However, Vodafone and Liberty Global secured approval from Brussels in the fourth quarter to combine their Dutch businesses in a deal worth €6.2bn.
Media The year fared better for M&A activity in the media sector. The sector clocked up 202 deals in Europe worth €27.5bn – its highest since 2007 and more than twice the €12.8bn registered last year with some 245 transactions.
This boost was largely down to a few stand-out deals, notably 21st Century Fox’s €21.4bn offer for a 60.9% stake in Sky.The European Commission is expected to be formally notified of Fox’s bid in March, which was first blocked in 2010 by the UK Government over a phone-hacking scandal that ripped through 21st Century Fox owner Rupert Murdoch’s News International group. While Fox and Sky executives are confident the deal will be given the go-ahead the second time around, politicians are calling on UK regulators to scrutinise potential risks to media plurality.
Following General Atlantic’s €1.29bn takeover of commodity price reporting agency Argus Media in the second quarter, business data and subscription services will continue to be a focal point of M&A activity. Schneider Electric’s agriculture and weather data business, DTN, as well as Official Airlines Guide and RISI, both owned by Epiris, formerly known as Electra Partners, are said to be up for sale.
Technology Technology’s M&A landscape was dominated by two large semiconductor deals – Qualcomm’s €42bn takeover bid of Dutch NXP and SoftBank’s €27.3bn ARM deal. Semiconductor firms have been through large waves of consolidation over the past two years and as the smartphone market slows, semiconductor suppliers are seeking safety in size and diversification. In both these deals, the Internet-of-Things (IoT) was cited as a key rationale. For Qualcomm, which mainly supplies mobile device makers, buying NXP is an opportunity to enter the automotive industry, set to be transformed by not only connected vehicles, but autonomous ones, in the not-too-distant future.
For SoftBank, a Japanese technology and telecoms conglomerate that has never previously invested in the semiconductor space, the ARM acquisition was a bold move to position itself as a provider of core technology for IoT. ARM is primarily a licensor of intellectual property – it does not design or manufacture chips, instead licenses its IP to semiconductor companies around the world. With predictions that
the IoT market will eventually become an US$11tn business by 2025, according to a report by McKinsey, there remains plenty of mileage for the subsector to continue driving deals.
M&A activity in TMT remained resilient after June’s Brexit vote, and is expected to continue as such. Secular trends in IoT, artificial intelligence, and automation are driving legacy players to consolidate or acquire new technology.
Inflexion’s minority investment in Outdoor Plus last November could trigger a wave of consolidation across digital billboard companies owned by PE firms. Clear Channel Communications, owned by Bain Capital Partners and Platinum Equity-owned Exterion Media could see exits in the coming year.
Meanwhile, in the telecoms space, the M&A community is waiting on a number of large deals. After the scuppering of the Three/O2 deal, Telefonica must contend with how it will offload O2. It also has a portfolio of infrastructure assets called Telxius, which it attempted to float in September, before being pulled at the last moment. And so further movement involving each of these would come as little surprise in 2017.
by Yining Su and Amy-Jo Crowley

31
DEAL DRIVERS – EMEA - TMT
TELECOMS, MEDIA & TECHNOLOGYTOP 15 ANNOUNCED DEALS FOR YEAR ENDING 31 DECEMBER 2016 (EUROPEAN TARGET)
Announced Date
Status Bidder Company Target Company Vendor Company Deal Value (€m)
27-Oct-16 P Qualcomm Incorporated NXP Semiconductors NV 42,058
18-Jul-16 C SoftBank Group Corp ARM Holdings Plc (98.55% stake) 27,276
15-Dec-16 P 21st Century Fox Inc Sky Plc (60.9% stake) 21,373
21-Jun-16 P Tencent Holdings Ltd Supercell Oy (84.3% stake) SoftBank Group Corp 7,607
15-Feb-16 C Liberty Global Europe Holding BV/Vodafone International Holdings BV
Ziggo BV; and Vodafone Libertel BV Vodafone International Holdings BV; and Liberty Global Europe Holding BV
6,200
14-Oct-16 C Cinven Partners LLP; Permira Advisers LLP; and Mid Europa Partners LLP
Allegro Group Sp z oo Naspers Limited 2,949
05-Sep-16 L Altice NV SFR Group (22.25% stake) 2,468
14-Jun-16 P JAC Capital Management Ltd; and Wise Road Capital LTD
Nexperia BV NXP Semiconductors NV 2,445
01-Aug-16 C Verizon Communications FleetMatics Group Plc Institutional Venture Partners 1,959
26-May-16 C SES SA O3b Networks Limited (50.9% stake) North Bridge Venture Partners; and Satya Capital LLP 1,727
06-Dec-16 P GoDaddy Operating Company LLC HEG Cinven Partners LLP 1,690
23-Nov-16 C Ctrip.com International Ltd Skyscanner Holdings Limited Khazanah Nasional Berhad; Scottish Equity Partners LLP; Sequoia Capital; and Vitruvian Partners LLP
1,670
23-May-16 P General Atlantic LLC Argus Media Limited Nasmyth family 1,292
07-Jul-16 C AVAST Software SRO AVG Technologies NV Ameriprise Financial Inc; and TA Associates Management LP
1,232
10-Feb-16 L Consortium led by Golden Brick Opera Software ASA 1,121
C = Completed; P = Pending; L = Lapsed

3.1%
36.4%
2.5%
41.1%
7.3%
4.3%
3.5%
1.2%
0.6%
25.3%
18.9%
12.1%5.0%
4.3%
8.7%
16.3%
7.6%1.8%
32
DEAL DRIVERS – EMEA - TMT
TELECOMS, MEDIA & TECHNOLOGYMIX OF DEALS BY GEOGRAPHIC REGION
VALUE VOLUME
UK & Ireland
German speaking
France
Italy
Iberia
Benelux
Nordic
Central & Eastern Europe
Other
VALUE VOLUME
QUARTERLY TRENDS
Based on announced deals, excluding those that lapsed or were withdrawn. Geographic region is determined with reference to the dominant location of the target.
Based on announced deals, excluding those that lapsed or were withdrawn, where the dominant location of the target is in Europe.Industry sector is based on the dominant industry of the target.
Valu
e (€
m)
Volu
me
Moving average trend line
0
25
50
75
100
125
150
175
200
225
250
275
300
Q4Q3Q2Q1Q4Q3Q2Q1Q4Q3Q2Q1Q4Q3Q2Q1Q4Q3Q2Q1Q4Q3Q2Q1Q4Q3Q2Q1
2010 2011 2012 2013 2014 2015 2016
0
10,000
20,000
30,000
40,000
50,000
60,000
70,000
80,000
90,000
Q4Q3Q2Q1Q4Q3Q2Q1Q4Q3Q2Q1Q4Q3Q2Q1Q4Q3Q2Q1Q4Q3Q2Q1Q4Q3Q2Q1
2010 2011 2012 2013 2014 2015 2016
Quarter ended Quarter ended

33
DEAL DRIVERS – EMEA - TMT
TELECOMS, MEDIA & TECHNOLOGYFINANCIAL ADVISERS
TOP 20 – RANKED BY VALUE TOP 20 – RANKED BY VOLUME
LEGAL ADVISERS
TOP 20 – RANKED BY VALUE TOP 20 – RANKED BY VOLUME
2016 2015 Company Name Value (€m)
Number of Deals
1 2 Goldman Sachs 116,000 19
2 7 Barclays 66,926 8
3 30 Centerview Partners 64,819 3
4 3 Morgan Stanley 56,477 19
5 5 Credit Suisse 49,770 10
6 14 Evercore Partners 47,923 14
7 23 Qatalyst Group 42,553 4
8 22 UBS Investment Bank 42,120 19
9 1 JPMorgan 38,212 15
10= 44 Mizuho Financial Group 34,883 2
10= 45 Raine Group 34,883 2
12 67 Robey Warshaw 33,476 2
13 11 Lazard 30,324 15
14 6 Deutsche Bank 29,972 7
15 40 Sumitomo Mitsui Financial Group 27,276 2
16 - Daiwa Securities Group 27,276 1
17 10 PJT Partners 23,871 3
18 4 Bank of America Merrill Lynch 22,420 14
19 16 LionTree Advisors 8,952 4
20 73 Numis Securities 8,317 3
2016 2015 Company Name Value (€m)
Number of Deals
1 9 Allen & Overy 79,037 31
2 35 Davis Polk & Wardwell 73,138 10
3 2 Skadden Arps Slate Meagher & Flom 67,180 12
4 14 White & Case 64,147 39
5 6 De Brauw Blackstone Westbroek 54,073 11
6 1 Freshfields Bruckhaus Deringer 53,266 35
7 7 Sullivan & Cromwell 50,025 6
8 40 Jones Day 46,946 33
9 62 Paul Weiss Rifkind Wharton & Garrison 46,637 8
10 64 DLA Piper 46,428 52
11 12 Cravath, Swaine & Moore 44,505 4
12 4 Shearman & Sterling 43,915 14
13 37 Slaughter and May 43,473 12
14 57 Morrison & Foerster 37,158 8
15 300 Anderson Mori & Tomotsune 34,983 3
16 18 Cleary Gottlieb Steen & Hamilton 31,536 8
17 158 Mori Hamada & Matsumoto 27,276 1
18 20 Weil Gotshal & Manges 24,769 22
19 11 Herbert Smith Freehills 23,271 10
20 68 Kirkland & Ellis 16,385 26
2016 2015 Company Name Value (€m)
Number of Deals
1 1 PwC 2,382 35
2 10 KPMG 1,095 30
3 2 EY 166 27
4 8 Rothschild 3,634 25
5 9 Deloitte 1,717 23
6 4 Goldman Sachs 116,000 19
7 11 Morgan Stanley 56,477 19
8 32 UBS Investment Bank 42,120 19
9 22 BDO 53 19
10 5 Oaklins 158 16
11 19 Globalscope Partners 153 16
12 6 JPMorgan 38,212 15
13 7 Lazard 30,324 15
14 20 BNP Paribas 6,177 15
15 24 Evercore Partners 47,923 14
16 13 Bank of America Merrill Lynch 22,420 14
17 26 GP Bullhound 229 14
18 3 GCA Corporation 783 12
19 47 William Blair & Company 1,054 11
20 14 Credit Suisse 49,770 10
2016 2015 Company Name Value (€m)
Number of Deals
1 1 DLA Piper 46,428 52
2 7 White & Case 64,147 39
3 6 Freshfields Bruckhaus Deringer 53,266 35
4 4 Jones Day 46,946 33
5 5 Baker & McKenzie 1,608 33
6 3 Allen & Overy 79,037 31
7 59 Orrick Herrington & Sutcliffe 2,216 28
8 25 Bird & Bird 1,297 28
9 27 Kirkland & Ellis 16,385 26
10 11 Hogan Lovells International 1,811 26
11 9 Clifford Chance 9,984 25
12 2 CMS 1,004 25
13 13 Linklaters 5,807 24
14 44 Dentons 1,892 24
15 17 Latham & Watkins 11,057 23
16 22 Osborne Clarke 437 23
17 14 Weil Gotshal & Manges 24,769 22
18 29 Eversheds 340 22
19 98 Pinsent Masons 2,524 20
20 30 Goodwin Procter 2,674 19
The financial adviser league tables by value and volume have been run from 01/01/2016 to 31/12/2016 and exclude lapsed and withdrawn deals.The tables are pan-European and are based on the following sectors: Computer – software, hardware and semiconductors; Telecoms – Hardware and Carriers; Internet/E-commerce and Media.
The legal adviser league tables by value and volume have been run from 01/01/2016 to 31/12/2016 and include lapsed and withdrawn deals.The tables are pan-European and are based on the following sectors: computer – Software, Hardware and semiconductors; Telecoms – Hardware and Carriers; Internet/E-commerce and Media.

ALL SECTORS34
DEAL DRIVERS – EMEA - TRANSPORTATION
TRANSPORTATIONOVERVIEW
European M&A value in the transportation sector returned to familiar levels in 2016, as low oil prices and an oversupply of assets contributed to downward pricing pressure. The volume of transactions however, picked up the pace in 2016 with buyers maximising lower-priced opportunities in the belief that valuations had reached their lowest and could begin to recover.
A total of 245 transportation and logistics deals were made in 2016, equating to €17.96bn. One less deal took place in 2015, yet total deal value hit €29.2bn that year. Smaller-sized deals gained momentum as the year progressed. In the second half of 2016, 125 deals took place, five more deals than in the previous six months, but totalled €8.86bn, compared to €9.11bn in the first half of the year.
Logistics and privatisations were key drivers among last year’s largest deals and made for a sizzling June. The Italian government’s €2.9bn sale of a 35% stake in Poste Italiane to Cassa depositi e Prestiti in June, was not only the largest logistics deal in Europe but the largest privatisation in Italy, and went on to become the largest flotation on the Italian stock exchange when 34.6% was listed for €3.4bn in October 2015.
While June’s UK referendum on EU membership put the brakes on numerous deals throughout the second half of the year, February’s sale of London City Airport to a consortium led by Ontario Teachers’ Pension Plan for €2.5bn lifted UK deals for the year as a whole. The deal was the second-largest European transportation deal of the year.
Airports dominated Europe’s deal landscape in 2016 with French airport deals ranking fourth and sixth in terms of the year’s biggest deals. In October, Azzura – the consortium formed by EDF Invest and Atlantia and Aeroporti di Roma – acquired 64% of Aeroports de la Cote d’Azur from the French government for €1.3bn. Earlier in July, a 60% stake in Aeroports de Lyon was also sold by the government to a consortium consisting of VINCI Airports,
Caisse des Depots et Consignations and Credit Agricole Assurances for €530m.
Shipping yielded the third-biggest deal of the year and boosted deal value by a further €1.44bn when Norwegian shipping giant Wilhelmsen and Swedish shipping and logistics company Wallenius penned an agreement on 22 December to merge into a global shipping and logistics platform. In February, London-based Baltic Dry Index had fallen to its lowest-ever level of 290 points. With oil prices recovering, yet volatile, there was a sense of safety in numbers with players joining one another in mergers deals.
The oversupply of vehicles and vessels is also expected to remain an issue in the transportation industry in 2017, driving down spot rates and sale prices. In the shipping sector for example, too many vessels mean that rates could continue to be unprofitable, although this has in turn driven companies to look at setting up joint ventures to take advantage of acquiring these low-priced assets.
The price of oil also continues to negatively impact the shipping tanker sector. Although the Organization of the Petroleum Exporting Countries (OPEC) brokered an agreement at the end of 2016 for its member countries to reduce their oil output by 1.2m barrels a day, some members remain exempt and are not only unwilling to cut their share of the market, but have increased oil production. This, combined with additional global economic woes, means that oil prices are likely to remain volatile and that oversupply and stockpiling from 2016 will likely continue to mute demand for transporting oil and oil products, creating a 'wait and see' M&A environment.
Conversely, these challenges are also expected to lead to more mergers and joint ventures in the shipping and logistics sector along the lines of the Wilhelmsen and Wallenius deal.
Early in 2017, Netherlands-based HSF Logistics made a bid to merge with N&K Spedition of Denmark, creating one of the
biggest European logistics service providers, which will include an offering of chilled and frozen product transport, warehousing, logistics and airfreight services.
Meanwhile, upcoming elections in Germany and France and the Brexit process in the UK have the potential to dampen their respective M&A levels where the tendency will move towards more PE exits along the lines of Global Infrastructure Partners and Highstar Capital’s exit from London City Airport, as well as smaller transactions.
by Elaine Green

35
DEAL DRIVERS – EMEA - TRANSPORTATION
TRANSPORTATIONTOP 15 ANNOUNCED DEALS FOR YEAR ENDING 31 DECEMBER 2016 (EUROPEAN TARGET)
Announced Date
Status Bidder Company Target Company Vendor Company Deal Value (€m)
24-Jun-16 P Cassa depositi e Prestiti Poste Italiane SpA (35% stake) Italian Ministry for the Economy and Finance 2,930
26-Feb-16 C Ontario Teachers' Pension Plan; Kuwait Investment Authority; Alberta Investment Management Corporation; OMERS Private Equity Inc; andHermes GPE LLP
London City Airport Limited Global Infrastructure Partners; and Highstar Capital LP
2,529
22-Dec-16 P Wilh. Wilhelmsen ASA Wallenius Lines AB 1,442
30-Oct-16 C Atlantia SpA; Aeroporti di Roma SpA; and EDF Invest Aeroports de la Cote d’Azur (64% stake) Government of France; and Department of Alpes-Maritimes
1,300
24-Oct-16 C Buckeye Partners LP VTTI (50% stake) VIP Terminals Finance BV 1,057
28-Jul-16 C Caisse des Depots et Consignations; Credit Agricole Assurances SA; and VINCI Airports SAS
Aeroports de Lyon SA (60% stake) Government of France 530
18-Jul-16 C Stolt-Nielsen Limited Jo Tankers (Chemical tanker operations) Jo Tankers AS 520
27-Jan-16 C Borealis Infrastructure Management Inc Compania Logistica de Hidrocarburos CLH SA (15% stake)
Global Infrastructure Partners 500
08-Apr-16 P COSCO (Hong Kong) Group Limited Piraeus Port Authority (OLP) (67% stake) Hellenic Republic Asset Development Fund 389
22-Sep-16 C Undisclosed bidder M-Star Fleet MPC Muenchmeyer Petersen Capital AG 355
05-Dec-16 P Etihad Airways NIKI Luftfahrt GmbH (49.8% stake) Air Berlin PLC & Co Luftverkehrs KG 300
11-Jan-16 C Borealis Infrastructure Management Compania Logistica de Hidrocarburos CLH SA (9.15% stake)
Compania Espanola de Petroleos SAU 300
20-Sep-16 C BW LPG Limited Aurora LPG Holding ASA (70.17% stake) 299
28-Sep-16 C Deutsche Post AG UK Mail Group Plc 279
17-Jun-16 C Elanders AB LGI Logistics Group International GmbH KAJO NEUKIRCHEN Management und Beteiligungs GmbH; and M Cap Finance Mittelstand GmbH & Co KG
257
C = Completed; P = Pending; L = Lapsed

22.0%
8.4%
11.6%7.4%
17.8%
6.6%
14.7%
5.2%
6.3%17.0%
14.7%
12.7%
8.2%9.4%
11.0%
12.7%
10.6%
3.7%
0
2,000
4,000
6,000
8,000
10,000
12,000
14,000
16,000
18,000
Q4Q3Q2Q1Q4Q3Q2Q1Q4Q3Q2Q1Q4Q3Q2Q1Q4Q3Q2Q1Q4Q3Q2Q1Q4Q3Q2Q1
2010 2011 2012 2013 2014 2015 2016
36
DEAL DRIVERS – EMEA - TRANSPORTATION
TRANSPORTATIONMIX OF DEALS BY GEOGRAPHIC REGION
VALUE VOLUME
UK & Ireland
German speaking
France
Italy
Iberia
Benelux
Nordic
Central & Eastern Europe
Other
QUARTERLY TRENDS
VALUE VOLUME
Valu
e (€
m)
Volu
me
Based on announced deals, excluding those that lapsed or were withdrawn. Geographic region is determined with reference to the dominant location of the target.
Based on announced deals, excluding those that lapsed or were withdrawn, where the dominant location of the target is in Europe.Industry sector is based on the dominant industry of the target.
Moving average trend line
0
10
20
30
40
50
60
70
80
Q4Q3Q2Q1Q4Q3Q2Q1Q4Q3Q2Q1Q4Q3Q2Q1Q4Q3Q2Q1Q4Q3Q2Q1Q4Q3Q2Q1
2010 2011 2012 2013 2014 2015 2016
Quarter endedQuarter ended

37
DEAL DRIVERS – EMEA - TRANSPORTATION
TRANSPORTATIONFINANCIAL ADVISERS
TOP 20 – RANKED BY VALUE TOP 20 – RANKED BY VOLUME
LEGAL ADVISERS
TOP 20 – RANKED BY VALUE TOP 20 – RANKED BY VOLUME
2016 2015 Company Name Value (€m)
Number of Deals
1 9 Bank of America Merrill Lynch 6,904 5
2 2 Citi 5,943 2
3 7 Lazard 5,663 4
4 12 RBC Capital Markets 5,162 4
5 22 Nomura Holdings 3,140 2
6= - EQUITA S.I.M. 2,930 1
6= 5 Goldman Sachs 2,930 1
8 20 Credit Suisse 2,679 2
9 21 UBS Investment Bank 2,041 3
10 15 Evercore Partners 2,011 2
11 - Cowen Group 2,011 1
12 14 Societe Generale 1,526 3
13 - Arctic Securities 1,472 2
14 - SEB 1,442 2
15= - Compagnie Financiere du Lion 1,300 1
15= 39 Mediobanca 1,300 1
17 17 Barclays 1,283 3
18 4 BNP Paribas 1,265 8
19 3 Morgan Stanley 1,187 2
20 10 HSBC 830 2
2016 2015 Company Name Value (€m)
Number of Deals
1 43 Freshfields Bruckhaus Deringer 8,523 8
2 6 Clifford Chance 6,513 10
3 8 White & Case 5,937 6
4 3 Allen & Overy 5,780 8
5 5 Linklaters 4,349 9
6 80 Cleary Gottlieb Steen & Hamilton 4,320 6
7 2 Latham & Watkins 3,676 6
8 70 Gianni, Origoni, Grippo, Cappelli & Partners
3,050 4
9 67 Chiomenti 2,961 2
10= - Mourant Ozannes 2,529 1
10= 20 Slaughter and May 2,529 1
12 - Mayer Brown 2,136 2
13 25 Gibson Dunn & Crutcher 2,094 4
14 - O'Melveny & Myers 2,091 2
15 4 Skadden Arps Slate Meagher & Flom 2,011 2
16 - McGuireWoods 2,011 1
17 142 Wiersholm 2,005 6
18 179 Gide Loyrette Nouel 1,830 2
19 133 Schjodt 1,811 4
20 1 Sullivan & Cromwell 1,672 3
2016 2015 Company Name Value (€m)
Number of Deals
1 6 Rothschild 616 9
2 16 KPMG 96 9
3 11 BNP Paribas 1,265 8
4 42 BDO 6 7
5 57 Credit Agricole 639 6
6 4 PwC 374 6
7 3 EY 15 6
8 8 Bank of America Merrill Lynch 6,904 5
9 2 Deloitte 71 5
10 17 Lazard 5,663 4
11 18 RBC Capital Markets 5,162 4
12 24 Danske Bank Corporate Finance 575 4
13 14 UniCredit Group 205 4
14 110 Translink Corporate Finance - 4
15 21 UBS Investment Bank 2,041 3
16 19 Societe Generale 1,526 3
17 30 Barclays 1,283 3
18 - SpareBank 1 Markets 457 3
19 13 Deutsche Bank 334 3
20 50 Pareto Securities 149 3
2016 2015 Company Name Value (€m)
Number of Deals
1 1 Clifford Chance 6,513 10
2 4 Linklaters 4,349 9
3 3 Freshfields Bruckhaus Deringer 8,523 8
4 2 Allen & Overy 5,780 8
5 12 DLA Piper 193 8
6 5 White & Case 5,937 6
7 108 Cleary Gottlieb Steen & Hamilton 4,320 6
8 15 Latham & Watkins 3,676 6
9 78 Wiersholm 2,005 6
10 9 CMS - 6
11 32 Gianni, Origoni, Grippo, Cappelli & Partners
3,050 4
12 86 Gibson Dunn & Crutcher 2,094 4
13 23 Schjodt 1,811 4
14 8 Baker & McKenzie 237 4
15 20 Wikborg Rein & Co 203 4
16 14 Sullivan & Cromwell 1,672 3
17 76 Thommessen 819 3
18 18 Ashurst 571 3
19 36 Squire Patton Boggs 436 3
20 71 Hengeler Mueller 392 3
The financial adviser league tables by value and volume have been run from 01/01/2016 to 31/12/2016, excluding lapsed and withdrawn deals. The tables are pan-European and cover the Transportation sector.
The legal adviser league tables by value and volume have been run from 01/01/2016 to 31/12/2016 and include lapsed and withdrawn deals. The tables are pan-European and cover theTransportation sector.
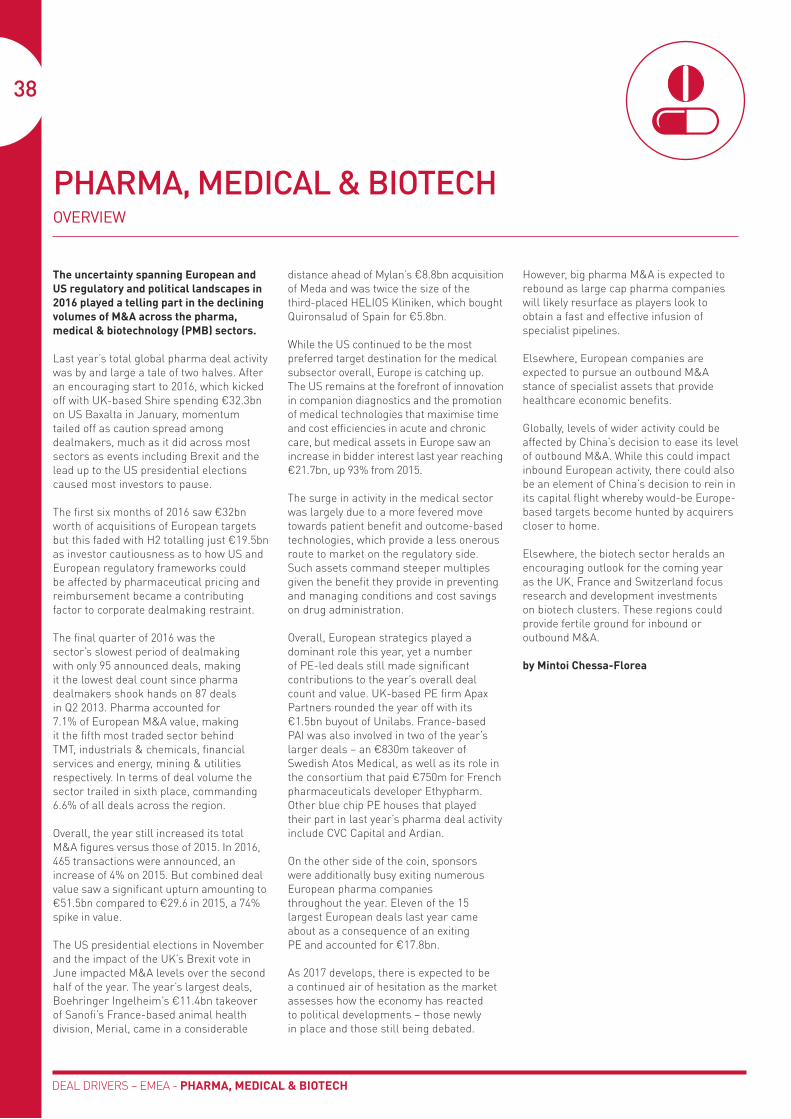
DEAL DRIVERS – EMEA - PHARMA, MEDICAL & BIOTECH
38
PHARMA, MEDICAL & BIOTECHOVERVIEW
The uncertainty spanning European and US regulatory and political landscapes in 2016 played a telling part in the declining volumes of M&A across the pharma, medical & biotechnology (PMB) sectors.
Last year’s total global pharma deal activity was by and large a tale of two halves. After an encouraging start to 2016, which kicked off with UK-based Shire spending €32.3bn on US Baxalta in January, momentum tailed off as caution spread among dealmakers, much as it did across most sectors as events including Brexit and the lead up to the US presidential elections caused most investors to pause.
The first six months of 2016 saw €32bn worth of acquisitions of European targets but this faded with H2 totalling just €19.5bn as investor cautiousness as to how US and European regulatory frameworks could be affected by pharmaceutical pricing and reimbursement became a contributing factor to corporate dealmaking restraint.
The final quarter of 2016 was the sector’s slowest period of dealmaking with only 95 announced deals, making it the lowest deal count since pharma dealmakers shook hands on 87 deals in Q2 2013. Pharma accounted for 7.1% of European M&A value, making it the fifth most traded sector behind TMT, industrials & chemicals, financial services and energy, mining & utilities respectively. In terms of deal volume the sector trailed in sixth place, commanding 6.6% of all deals across the region.
Overall, the year still increased its total M&A figures versus those of 2015. In 2016, 465 transactions were announced, an increase of 4% on 2015. But combined deal value saw a significant upturn amounting to €51.5bn compared to €29.6 in 2015, a 74% spike in value.
The US presidential elections in November and the impact of the UK’s Brexit vote in June impacted M&A levels over the second half of the year. The year’s largest deals, Boehringer Ingelheim’s €11.4bn takeover of Sanofi’s France-based animal health division, Merial, came in a considerable
distance ahead of Mylan’s €8.8bn acquisition of Meda and was twice the size of the third-placed HELIOS Kliniken, which bought Quironsalud of Spain for €5.8bn.
While the US continued to be the most preferred target destination for the medical subsector overall, Europe is catching up. The US remains at the forefront of innovation in companion diagnostics and the promotion of medical technologies that maximise time and cost efficiencies in acute and chronic care, but medical assets in Europe saw an increase in bidder interest last year reaching €21.7bn, up 93% from 2015.
The surge in activity in the medical sector was largely due to a more fevered move towards patient benefit and outcome-based technologies, which provide a less onerous route to market on the regulatory side. Such assets command steeper multiples given the benefit they provide in preventing and managing conditions and cost savings on drug administration.
Overall, European strategics played a dominant role this year, yet a number of PE-led deals still made significant contributions to the year’s overall deal count and value. UK-based PE firm Apax Partners rounded the year off with its €1.5bn buyout of Unilabs. France-based PAI was also involved in two of the year’s larger deals – an €830m takeover of Swedish Atos Medical, as well as its role in the consortium that paid €750m for French pharmaceuticals developer Ethypharm. Other blue chip PE houses that played their part in last year’s pharma deal activity include CVC Capital and Ardian.
On the other side of the coin, sponsors were additionally busy exiting numerous European pharma companies throughout the year. Eleven of the 15 largest European deals last year came about as a consequence of an exiting PE and accounted for €17.8bn.
As 2017 develops, there is expected to be a continued air of hesitation as the market assesses how the economy has reacted to political developments – those newly in place and those still being debated.
However, big pharma M&A is expected to rebound as large cap pharma companies will likely resurface as players look to obtain a fast and effective infusion of specialist pipelines.
Elsewhere, European companies are expected to pursue an outbound M&A stance of specialist assets that provide healthcare economic benefits.
Globally, levels of wider activity could be affected by China’s decision to ease its level of outbound M&A. While this could impact inbound European activity, there could also be an element of China’s decision to rein in its capital flight whereby would-be Europe-based targets become hunted by acquirers closer to home.
Elsewhere, the biotech sector heralds an encouraging outlook for the coming year as the UK, France and Switzerland focus research and development investments on biotech clusters. These regions could provide fertile ground for inbound or outbound M&A.
by Mintoi Chessa-Florea

39
DEAL DRIVERS – EMEA - PHARMA, MEDICAL & BIOTECH
PHARMA, MEDICAL & BIOTECHTOP 15 ANNOUNCED DEALS FOR YEAR ENDING 31 DECEMBER 2016 (EUROPEAN TARGET)
Announced Date
Status Bidder Company Target Company Vendor Company Deal Value (€m)
27-Jun-16 C Boehringer Ingelheim GmbH Merial SAS Sanofi SA 11,400
10-Feb-16 C Mylan NV Meda AB 8,844
05-Sep-16 P HELIOS Kliniken GmbH Quironsalud CVC Capital Partners Limited 5,760
19-Dec-16 P Svenska Cellulosa Aktiebolaget SCA BSN Medical GmbH EQT Partners AB 2,740
04-Jan-16 C Acadia Healthcare Company Inc The Priory Group Limited Advent International Corporation 1,968
12-Dec-16 P Apax Partners LLP Unilabs SA (undisclosed controlling stake) Nordic Capital; Altamir & Cie; and Apax Partners MidMarket SAS
1,500
19-May-16 C Creat Group Corporation BPL Holdings Limited Bain Capital LLC; and UK Department of Health 1,068
18-Nov-16 P Bupa Finance plc Oasis Healthcare Limited Bridgepoint Advisers Limited 975
16-Nov-16 P Life Healthcare Group Holdings Limited Alliance Medical Group Limited M&G Investments; and Talbot Hughes McKillop LLP 883
30-May-16 P PAI Partners SAS Atos Medical AB EQT Partners AB 830
04-May-16 C Sonova Holding AG AudioNova International BV HAL Investments BV 830
29-Jun-16 C Ecolab Inc Laboratoires Anios SA Ardian 750
09-Jun-16 C PAI Partners SAS; Korea Investment Corporation; and CDC International Capital
Ethypharm SA Intermediate Capital Group Plc; and Astorg Partners 750
05-Oct-16 C Accord Healthcare Ltd Actavis UK Ltd; and Actavis Ireland Ltd Teva Pharmaceutical Industries Ltd 685
28-Nov-16 P Ardian Laboratoire Unither SA Equistone Partners Europe Limited; Parquest Capital; Picardie Investissement SA; and CM-CIC Investissement
650
C = Completed; P = Pending; L = Lapsed

18.7%
19.0%
14.0%6.5%
9.7%
8.2%
15.3%
1.7%6.9%
Quarter endedQuarter ended
0
10
20
30
40
50
60
70
80
90
100
110
120
130
140
Q4Q3Q2Q1Q4Q3Q2Q1Q4Q3Q2Q1Q4Q3Q2Q1Q4Q3Q2Q1Q4Q3Q2Q1Q4Q3Q2Q1
2010 2011 2012 2013 2014 2015 2016
0
5,000
10,000
15,000
20,000
25,000
30,000
35,000
40,000
45,000
50,000
55,000
60,000
Q4Q3Q2Q1Q4Q3Q2Q1Q4Q3Q2Q1Q4Q3Q2Q1Q4Q3Q2Q1Q4Q3Q2Q1Q4Q3Q2Q1
2010 2011 2012 2013 2014 2015 2016
40
DEAL DRIVERS – EMEA - PHARMA, MEDICAL & BIOTECH
PHARMA, MEDICAL & BIOTECHMIX OF DEALS BY GEOGRAPHIC REGION
VALUE VOLUME
UK & Ireland
German speaking
France
Italy
Iberia
Benelux
Nordic
Central & Eastern Europe
Other
QUARTERLY TRENDS
VALUE VOLUME
Based on announced deals, excluding those that lapsed or were withdrawn. Geographic region is determined with reference to the dominant location of the target.
Based on announced deals, excluding those that lapsed or were withdrawn, where the dominant location of the target is in Europe.Industry sector is based on the dominant industry of the target.
Valu
e (€
m)
Volu
me
Moving average trend line
26.0%3.8%
13.9%
2.3%
23.0%
0.7%0.5%
11.9%
17.9%

41
DEAL DRIVERS – EMEA - PHARMA, MEDICAL & BIOTECH
PHARMA, MEDICAL & BIOTECHFINANCIAL ADVISERS
TOP 20 – RANKED BY VALUE TOP 20 – RANKED BY VOLUME
LEGAL ADVISERS
TOP 20 – RANKED BY VALUE TOP 20 – RANKED BY VOLUME
2016 2015 Company Name Value (€m)
Number of Deals
1 4 Goldman Sachs 48,261 6
2 2 Barclays 41,015 7
3 8 Morgan Stanley 36,729 4
4 9 Citi 35,681 6
5 5 Deutsche Bank 34,087 4
6 16 Bank of America Merrill Lynch 32,618 10
7 13 Evercore Partners 32,471 3
8 7 Rothschild 31,137 24
9 1 JPMorgan 17,084 13
10 12 Lazard 15,260 10
11 6 Jefferies 12,719 16
12 11 Centerview Partners 12,181 4
13 - SEB 9,220 3
14 - Handelsbanken Capital Markets 9,131 3
15 21 BNP Paribas 7,310 6
16 38 UniCredit Group 6,417 5
17 26 UBS Investment Bank 5,345 3
18 35 Guggenheim Partners 3,213 5
19 106 MTS Health Partners 2,770 4
20 - Lilja & Co 2,740 1
2016 2015 Company Name Value (€m)
Number of Deals
1 21 Freshfields Bruckhaus Deringer 56,127 14
2 13 White & Case 50,068 19
3 12 Cravath, Swaine & Moore 42,848 5
4 19 Kirkland & Ellis 36,983 11
5 28 Fried Frank Harris Shriver & Jacobson 36,237 5
6 30 Jones Day 35,448 12
7 18 Davis Polk & Wardwell 34,337 5
8 26 Ropes & Gray 34,001 6
9 25 Matheson 32,934 3
10 27 Slaughter and May 32,834 3
11 1 Arthur Cox 32,390 5
12 8 Weil Gotshal & Manges 15,985 17
13 37 Linklaters 14,729 15
14 33 Simpson Thacher & Bartlett 11,973 7
15 - Talwar Thakore & Associates 11,400 1
16 192 Vinge 10,364 5
17 6 Morgan Lewis & Bockius 9,798 7
18 24 Stibbe 9,674 3
19 138 Mannheimer Swartling 9,528 6
20 41 Allen & Overy 9,024 15
2016 2015 Company Name Value (€m)
Number of Deals
1 2 PwC 1,647 27
2 1 Rothschild 31,137 24
3 8 Deloitte 1,358 24
4 5 EY 1,301 22
5 3 KPMG 326 18
6 6 Jefferies 12,719 16
7 9 JPMorgan 17,084 13
8 30 Bank of America Merrill Lynch 32,618 10
9 7 Lazard 15,260 10
10 37 ALANTRA 984 9
11 19 BDO 110 8
12 10 Barclays 41,015 7
13 33 Piper Jaffray & Co 814 7
14 16 Lincoln International 648 7
15 18 Clearwater International - 7
16 4 Goldman Sachs 48,261 6
17 14 Citi 35,681 6
18 11 BNP Paribas 7,310 6
19 27 Oaklins 157 6
20 23 UniCredit Group 6,417 5
2016 2015 Company Name Value (€m)
Number of Deals
1 4 DLA Piper 8,445 25
2 5 Baker & McKenzie 1,090 21
3 3 White & Case 50,068 19
4 6 Weil Gotshal & Manges 15,985 17
5 7 Clifford Chance 4,896 17
6 2 CMS 198 16
7 9 Linklaters 14,729 15
8 10 Allen & Overy 9,024 15
9 22 Freshfields Bruckhaus Deringer 56,127 14
10 1 Latham & Watkins 5,816 13
11 78 Dentons 386 13
12 8 Jones Day 35,448 12
13 19 Covington & Burling 2,075 12
14 12 Kirkland & Ellis 36,983 11
15 27 Hengeler Mueller 6,710 11
16 70 Pinsent Masons 701 10
17 59 Garrigues 6,427 9
18 36 Osborne Clarke 3,036 9
19 13 Cooley 2,752 9
20 20 Goodwin Procter 1,840 9
The financial adviser league tables by value and volume have been run from 01/01/2016 to 31/12/2016, excluding lapsed and withdrawn deals. The tables are pan-European and are based on the following sectors: Biotechnology; Medical; and Pharmaceuticals.
The legal adviser league tables by value and volume have been run from 01/01/2016 to 31/12/2016 and include lapsed and withdrawn deals.The tables are pan-European and are based on the following sectors: Biotechnology; Medical; and Pharmaceuticals.

DEAL DRIVERS – EMEA - CONSTRUCTION
42
CONSTRUCTIONOVERVIEW
The volume of European M&A activity increased across the construction sector last year despite a marked decline in value.
Plans for companies to diversify operations and expand into new geographic locations were among the themes behind inorganic growth in the construction space, which recorded €15bn worth of deals in 2016 compared to €27.6bn in 2015.
The latest figures represent the second consecutive year-on-year decline in value terms; deals undertaken in 2014 amounted to €43.9bn.
The number of deals that took place last year rose to 334 from 263 in 2015, a 27% increase in activity. It also represents a 27% and 42% improvement on 2014 and 2013 figures, respectively.
The sector accounted for 2.1% of European M&A deals by value, while representing 4.8% of volume.
Buyers most actively sought out companies involved in the heavy construction, cement, construction services and builders' supplies subsectors.
Inversora Carso, a Mexico-based investment vehicle controlled by Carlos Slim, acquired a near 66% stake in Spanish construction, services and environment group Formento de Construcciones y Contratas for more than €6.1bn in what was by far the largest European deal undertaken in the sector last year.
The stake was purchased in two tranches, with an initial 17.66% interest announced in early February. Inversora Carso announced the acquisition of a further 48.3% stake in March, with the deal completing in July. The deals bumped up the Iberian market to lead in terms of total European deal value, accounting for 44.6%, but fell by the wayside regarding volume, only representing 5.1% of total deals undertaken throughout the year.
Russian investment bank, Sberbank acquired a 6.12% interest in Switzerland’s LafargeHolcim for €1.5bn in the year’s
second-largest deal of the year while US-based Standard Industries announced the acquisition of the remaining 70.9% stake it did not own in Germany’s Braas Monier Building Group for €1.25bn in September, rounding off the top three deals in 2016. Earlier in the summer, Braas Monier had sold a 29.1% stake to hedge fund 40 North Management, an employee-owned hedge fund sponsor and a subsidiary of Standard Industries, for €250m.
Spanish infrastructure company Abertis Infraestrucuras’ €1.2bn 51.4% acquisition of Italian A4 Holding was among the largest Southern European construction deals last year. Southern Europe’s construction sector has yet to fully recover from its economic setbacks with many looking to maximise their businesses through tie-ups. Others, especially those heavily involved in infrastructure, have switched focus towards non-domestic projects in an environment that is more intent on finding stability than concentrating on growth.
Financial institutions also co-starred with corporates in concluding a variety of large European deals. For example, World Bank Group member, International Finance Corporation, acquired an undisclosed stake in Turkish construction and infrastructure company Ronesans for €194m.
Non-European investors looked to find growth opportunities among companies that have suffered as a consequence of various factors such as fluctuating or softening currencies and the uncertainty that surrounds Europe and its trade agreements in the fall-out from Britain’s decision to leave the EU. Companies from Mexico, the US, China and Japan took advantage of Europe’s precarious economic outlook and were involved in the sector’s largest deals.
The opening quarter of 2016 saw the most construction transactions value, reaching €8.6bn, before petering out as the year progressed. The second half of the year only accounted for €3.6bn worth of deals as geopolitical uncertainty added further layers of caution among dealmakers, leaving M&A as more a luxury for those with robust enough balance sheets to
look for potential bargains while smaller businesses remained quiet.
The UK’s construction industry rose to a seven-month high in October last year, according to the Purchasing Managers’ Index, prompting a more optimistic outlook for the sector. While some UK-based companies looked to diversify operations in an effort to widen their services through M&A deals, Britain’s vote to leave the EU left industry executives in a state of flux and activity eased as a consequence.
Private equity funds and financial organisations contributed to dealmaking in 2016 with the likes of US firm The Carlyle Group making an appearance among some of the largest deals in the space by acquiring Spanish roofing specialist Cupa Group for €170m.
The construction space is seen as a mainstay of M&A activity in Benelux, with the sale of non-core assets and a focus on more profitable subsectors among the driving forces. Belgium-based Compagnie des Ciments Belges acquirer, Italian cement producer Cementir, is also expected to undertake further deals, with the Italian market as its focus. Transactions valued below €100m are thought to be the sweet spot.
by Lloyd Vassell

DEAL DRIVERS – EMEA – CONSTRUCTION
43
CONSTRUCTIONTOP 15 ANNOUNCED DEALS FOR YEAR ENDING 31 DECEMBER 2016 (EUROPEAN TARGET)
Announced Date
Status Bidder Company Target Company Vendor Company Deal Value (€m)
04-Mar16 C Inversora Carso SA de CV Fomento de Construcciones y Contratas SA (48.3% stake) 5,734
22-Jan-16 C Sberbank OAO LafargeHolcim Ltd (6.12% stake) Eurocement Holding AG 1,498
15-Sep-16 P Standard Industries Inc Braas Monier Building Group Services GmbH (70.9% stake) 1,246
10-May-16 C Abertis Infraestructuras SA A4 Holding SpA (51.4% stake) Intesa Sanpaolo SpA; Astaldi SpA; and Equiter SpA
1,205
05-Feb-16 C Inversora Carso SA de CV Fomento de Construcciones y Contratas SA (17.66% stake) 401
19-Jul-16 P LIXIL Group Corporation Grohe Group SARL (43.75% stake) Development Bank of Japan Inc 385
25-Jul-16 C Cementir Holding SpA Compagnie des Ciments Belges SA Ciments Francais 312
14-May-16 C 40 North Management LLC Braas Monier Building Group Services GmbH (29.1% stake) Monier Holdings SCA 250
08-Feb-16 C Consortium led by Gilde Buy Out Partners BV, Navitas Capital and Todlin NV
Koninklijke Reesink NV 232
10-Jul-16 C International Finance Corporation Ronesans Holding AS (Undisclosed stake) 194
17-Jun-16 P LSREF4 ARIA Beteiligungs GmbH & Co KG ISARIA Wohnbau AG 184
25-Jun-16 C The Carlyle Group Cupa Group Abanca Corporacion Bancaria, SA; Ulpiano Fernandez (Private investor); Aureliano Fernandez (Private investor); and Bautista Lopez (Private investor)
170
22/06/2016 P Dutch Infrastructure Fund BV Auto-Estradas Norte Litoral (51% stake); and Via do Infante (49% stake)
Cintra Infraestructuras SA 159
10/03/2016 C Engie SA Maia Eolis SA (51% stake) Groupe Maia 152
04/11/2016 P FS Amber Holdings BV Gdansk Transport Company SA (29.69% stake) John Laing Group plc 147
C = Completed; P = Pending; L = Lapsed
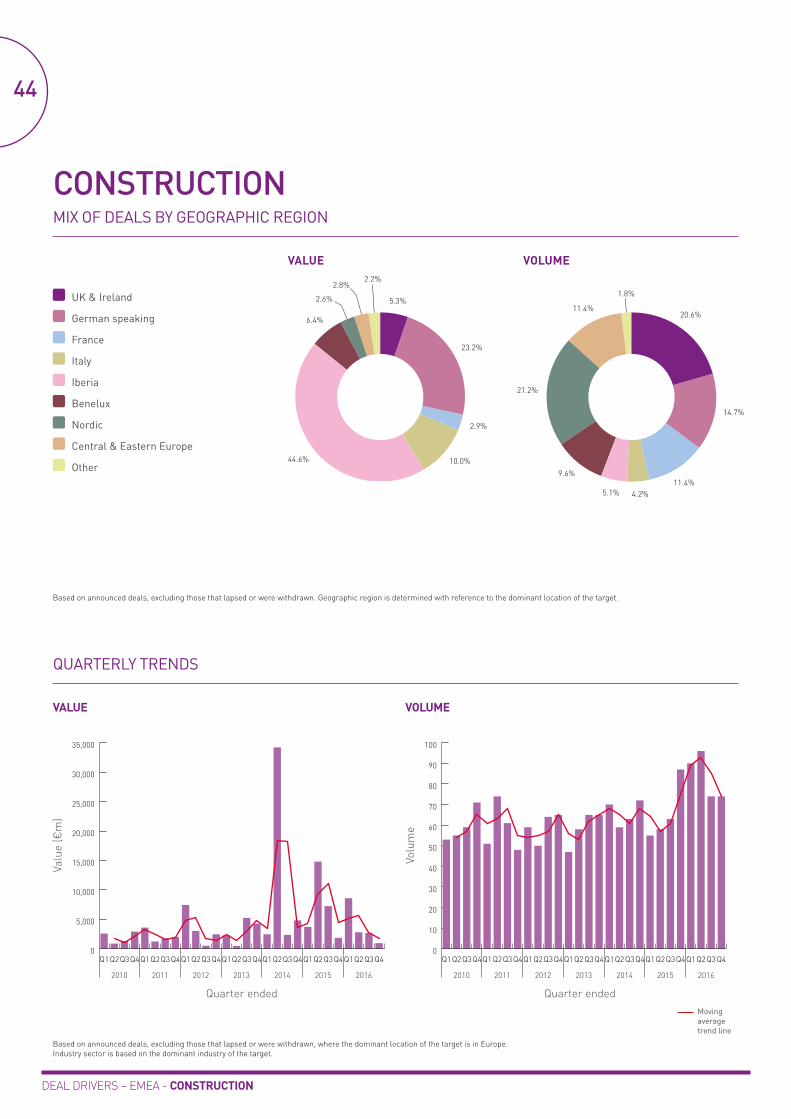
44
DEAL DRIVERS – EMEA - CONSTRUCTION
CONSTRUCTIONMIX OF DEALS BY GEOGRAPHIC REGION
VALUE VOLUME
UK & Ireland
German speaking
France
Italy
Iberia
Benelux
Nordic
Central & Eastern Europe
Other
QUARTERLY TRENDS
VALUE VOLUME
Based on announced deals, excluding those that lapsed or were withdrawn. Geographic region is determined with reference to the dominant location of the target.
Based on announced deals, excluding those that lapsed or were withdrawn, where the dominant location of the target is in Europe.Industry sector is based on the dominant industry of the target.
Valu
e (€
m)
Volu
me
Moving average trend line
Quarter endedQuarter ended
0
10
20
30
40
50
60
70
80
90
100
Q4Q3Q2Q1Q4Q3Q2Q1Q4Q3Q2Q1Q4Q3Q2Q1Q4Q3Q2Q1Q4Q3Q2Q1Q4Q3Q2Q1
2010 2011 2012 2013 2014 2015 2016
0
5,000
10,000
15,000
20,000
25,000
30,000
35,000
Q4Q3Q2Q1Q4Q3Q2Q1Q4Q3Q2Q1Q4Q3Q2Q1Q4Q3Q2Q1Q4Q3Q2Q1Q4Q3Q2Q1
2010 2011 2012 2013 2014 2015 2016
23.2%
2.9%
10.0%44.6%
6.4%
2.8%2.2%
5.3%2.6%
20.6%
14.7%
11.4%4.2%5.1%
9.6%
21.2%
11.4%
1.8%

45
DEAL DRIVERS – EMEA - CONSTRUCTION
CONSTRUCTIONFINANCIAL ADVISERS
TOP 20 – RANKED BY VALUE TOP 20 – RANKED BY VOLUME
LEGAL ADVISERS
TOP 20 – RANKED BY VALUE TOP 20 – RANKED BY VOLUME
2016 2015 Company Name Value (€m)
Number of Deals
1 34 Santander Global Corporate Banking 5,935 2
2 12 Credit Suisse 5,734 1
3 18 Citi 2,798 4
4 10 Rothschild 2,542 7
5 23 Lazard 2,456 6
6 13 BNP Paribas 1,820 5
7 6 UBS Investment Bank 1,811 3
8 1 JPMorgan 1,749 4
9 - Houlihan Lokey 1,566 5
10 16 Mediobanca 1,517 2
11 - Sberbank 1,498 1
12 - Arpwood Capital 1,267 1
13 27 Moelis & Company 1,246 1
14= - Banca IMI/Intesa Sanpaolo 1,205 1
14= 44 Leonardo & Co 1,205 1
16= 5 Societe Generale 1,106 1
16= 15 Zaoui & Co 1,106 1
18 - Standard Chartered 967 3
19 11 HSBC 863 2
20 36 KPMG 750 12
2016 2015 Company Name Value (€m)
Number of Deals
1 26 Baker & McKenzie 8,692 14
2 17 Linklaters 8,001 14
3 - Ontier 6,135 2
4 - Sullivan & Cromwell 2,263 4
5 93 Cuatrecasas 1,547 6
6 14 Hengeler Mueller 1,496 3
7 88 Ashurst 1,482 3
8 19 Freshfields Bruckhaus Deringer 1,386 7
9 70 Pinsent Masons 1,326 6
10 - Studio Legale Lombardi Molinari Segni 1,295 2
11= 32 AZB & Partners 1,267 1
11= - Crawford Bayley & Co 1,267 1
11= - Cyril Amarchand Mangaldas 1,267 1
14 - Cravath, Swaine & Moore 1,246 1
15 20 Allen & Overy 1,241 9
16 44 BonelliErede 1,225 2
17 25 White & Case 1,131 7
18= 13 Cleary Gottlieb Steen & Hamilton 1,106 1
18= - Jeantet Associes 1,106 1
20 1 Stikeman Elliott 948 1
2016 2015 Company Name Value (€m)
Number of Deals
1 2 KPMG 750 12
2 6 Deloitte 629 10
3 1 PwC 198 10
4 5 Rothschild 2,542 7
5 44 ALANTRA 221 7
6 17 Lazard 2,456 6
7 34 BDO 90 6
8 8 BNP Paribas 1,820 5
9 - Houlihan Lokey 1,566 5
10 14 Lincoln International 56 5
11 10 Clearwater International 32 5
12 70 Grant Thornton 8 5
13 9 Citi 2,798 4
14 12 JPMorgan 1,749 4
15 60 Livingstone Partners - 4
16 21 UBS Investment Bank 1,811 3
17 - Standard Chartered 967 3
18 15 Global M&A Partners 54 3
19 11 Oaklins 22 3
20 - Evli Bank 15 3
2016 2015 Company Name Value (€m)
Number of Deals
1 1 Baker & McKenzie 8,692 14
2 5 Linklaters 8,001 14
3 2 DLA Piper 412 11
4 30 CMS 197 11
5 4 Allen & Overy 1,241 9
6 34 Eversheds 166 9
7 11 Freshfields Bruckhaus Deringer 1,386 7
8 13 White & Case 1,131 7
9 128 Gateley 140 7
10 54 Cuatrecasas 1,547 6
11 6 Pinsent Masons 1,326 6
12 7 Clifford Chance 487 6
13 17 Wiersholm 76 6
14 69 Kirkland & Ellis 551 5
15 15 Bech-Bruun 7 5
16 16 Mannheimer Swartling - 5
17 - Sullivan & Cromwell 2,263 4
18 80 Shearman & Sterling 737 4
19 - Thommessen 181 4
20 47 Squire Patton Boggs 132 4
The financial adviser league tables by value and volume have been run from 01/01/2016 to 31/12/2016, excluding lapsed and withdrawn deals. The tables are pan-European and are based on the following sectors: Construction.
The legal adviser league tables by value and volume have been run from 01/01/2016 to 31/12/2016 and include lapsed and withdrawn deals.The tables are pan-European and cover on the following sectors: Construction.

DEAL DRIVERS – EMEA - THE MIDDLE EAST & NORTH AFRICA
46
THE MIDDLE EAST & NORTH AFRICAOVERVIEW
Reduced government spending, owing to continued low oil prices and falling company revenues, prompted a consolidation drive across a variety of industries in the Middle East and North Africa last year. This led to a significant lift in total deal value for the region and a slim uptick in the number of deals that were announced throughout 2016.
A total 112 deals were announced last year worth a combined €32.5bn. This compares to the 105 deals valued at €14bn in 2015. The 132% increase in deal value can be largely attributed to National Bank of Abu Dhabi and First Gulf Bank’s €13.4bn merger that took place in July. The deal not only accounted for 41% of the region’s total deal value last year, but was instrumental in leading financial services to become the biggest M&A sector by value, accounting for 48.1% of the region’s total.
In all, financial services saw a total €15.6bn of deals take place from 16 deals. Without the two bank’s merging, MENA’s financial services performance throughout last year would have otherwise remained flat despite accounting for a third of the top 15 largest deals that took place in 2016.
Pharma, medical & biotech contributed €656m to the region’s annual deal value with 15 deals. MENA has been grappling with a steady rise in non-communicable diseases including diabetes and cardiovascular diseases alongside an aging population, and as such there has been an increased demand for quality healthcare services. Hospital operator NMC Health’s €527m acquisition of private UAE-based Al Zahra Hospital was the biggest medical deal last year in MENA.
The consumer sector remained robust recording 16 deals at a total value of €3.2bn. The sector has witnessed tremendous growth in recent years with a cultural shift of people increasingly dining out as well as a growing population demanding more consumer products. The most significant such deal was the €2.8bn acquisition of a 69% stake with subsequent mandatory offer in food conglomerate Kuwait Food Company by UAE-based Adeptio.
The telecoms, media & telecommunications space picked up momentum in 2016 with 12 deals valued at €701m with investors increasingly interested in internet and e-commerce deals.
MENA’s energy sector recorded 13 deals worth €5.5bn. The sector was the region’s third most-targeted behind financial services and consumer and commanded 11.6% of all deal volume that took place last year.
The sector’s largest deal of the year was BP’s €2.1bn acquisition of 10% in ADCO Onshore Concession and was followed by China’s Guangdong Yudean Group and Malaysian YTL Power International’s €1.1bn acquisition of a 60% stake in Jordan’s Attarat Power Company from Estonia’s Eesti Energia and Jordan’s Near East Investments. This is expected to help move along the project to build an oil shale-fired 554 MW power plant and mine in Jordan. It will become the first such power plant that aims to cover a substantial portion of the country’s energy needs and in the long-term help reduce its dependence on importing oil products for power generation.
Rosneft’s 30% stake acquisition in Egypt’s Zohr oil field, from Italian major Eni for €1bn rounded off the sector’s three largest deals and highlights Eni’s aim of quickly monetising its exploration discoveries. Eni discovered the Zohr field in August 2015.
While the UAE, Saudi Arabia and Egypt remained the most active countries, Qatar, the world’s largest exporter of liquefied natural gas, invested heavily in energy deals, highlighted by its sovereign wealth fund, Qatar Investment Authority (QIA), which was part of a consortium that invested €10.5bn into Rosneft in return for a 19.5% stake.
Changes to Abu Dhabi’s healthcare regulation last year could further prompt dealmaking throughout 2017. Emiratis are now required to pay 20% of treatment fees received at private healthcare facilities. It is anticipated this could lead to a fall in medical visits that will subsequently cause a knock-
on effect on the revenues of healthcare providers, causing the potential for a degree of consolidation within the emirate.
MENA-based investors are also increasingly embracing the technology sector. A consortium of financial institutions, including Abraaj Capital and US-based SQM Frontier Management combined to buy 35% of Dubai’s answer to Uber, Careem Networks. The eleven-party consortium shelled out €479m for its stake.
Elsewhere, UAE-based online clothes retailer, Souq.com captured the attention of investors based in the UK, US and Singapore respectively as Baillie Gifford, International Finance Corporation and Standard Chartered Private Equity combined to invest €249m in the e-commerce retailer.
Among the most active countries in 2017 will likely be Egypt as it is becoming an area of particular interest to domestic and Gulf investors looking to buy within the food and beverage sector, which is seeing increased demand from a growing population. A depreciation in the Egyptian pound is also motivating foreign investors to invest in the country. The Egyptian pound lost 57% of its value after the country decided to float its currency in November.
by Ruth McKee AlGhamdi
DEAL DRIVERS – EMEA – THE MIDDLE EAST & NORTH AFRICA
47
THE MIDDLE EAST & NORTH AFRICATOP 15 ANNOUNCED DEALS FOR YEAR ENDING 31 DECEMBER 2016 – MIDDLE EAST & NORTH AFRICA ALL SECTORS (BASED ON TARGET, EXCLUDES ISRAEL)
Announced date
Status Bidder Company Target Company Sector Vendor Company Deal Value (€m)
03-Jul-16 P National Bank of Abu Dhabi PJSC First Gulf Bank Financial Services 13,352
28-Jun-16 P Hapag-Lloyd AG United Arab Shipping Company (SAG) Transportation Government of Qatar; and Public Investment Fund
4,886
18-Jun-16 P Adeptio LLC Kuwait Food Company (Americana) KSCP
Consumer Al-Khair National for Stocks and Real Estate Co
2,820
17-Dec-16 C BP Plc ADCO Onshore Concession (10% stake) Energy, Mining & Utilities Abu Dhabi National Oil Company 2,093
17-Mar-16 C Lafarge Maroc Holcim Maroc Construction LafargeHolcim Ltd 1,106
06-May-16 P YTL Power International Berhad; and Guangdong Yudean Group Co Ltd
Attarat Power Company (60% stake) Energy, Mining & Utilities Eesti Energia AS; and Near East Investments
1,104
12-Dec-16 P Rosneft Oil Company OAO Zohr oil field (30% stake) Energy, Mining & Utilities Eni SpA 1,063
19-Dec-16 P BP Plc Kosmos Energy Ltd (offshore exploration blocks C6, C8, C12 and C13 in Mauritania) (62% stake); and Kosmos Energy Ltd (Saint-Louis Profond and Cayar Profond blocks in Senegal) (32.49% stake)
Energy, Mining & Utilities Kosmos Energy Ltd 877
27-Oct-16 P Societe Nationale D'Investissement SA OGM holding (50% stake) Financial Services Attijariwafa Bank 529
14-Dec-16 P NMC Health Plc Al Zahra Hospital Pharma, Medical & Biotech Gulf Medical Projects Company 527
18-Dec-16 C Rakuten Inc; Abraaj Capital Holdings Limited; Saudi Telecom Company; Al Tayyar Energy Limited; Lumia Capital; BECO Capital; STC Ventures; Wamda Capital; SQM Frontier Management LP; Endure Capital; and El Sewedy Investments
Careem Networks FZ LLC (35% stake) TMT 479
04-Oct-16 P Attijariwafa Bank Barclays Bank Egypt SAE Financial Services Barclays Plc 447
14-Dec-16 P Sanlam Ltd; and Santam Limited Saham Finances SA (16.6% stake) Financial Services 309
17-Mar-16 C A consortium of Lebanese and Arab Investors
Credit Libanais SAL (40% stake) Financial Services EFG-Hermes Holding SAE 276
29-Feb-16 C Baillie Gifford; International Finance Corporation; and Standard Chartered Private Equity Limited
Souq.com (undisclosed stake) TMT 249
C = Completed; P = Pending; L = Lapsed

Quarter ended Quarter ended
0.3%
48.1%
0.5%10.0%
17.1%
3.8%
0.1%
2.2%
2.0%
16.1%
14.3%11.6%
10.7%
2.7%
7.1%
0.9%8.0%4.5%
13.4%
12.5%
14.3%
0
5
10
15
20
25
30
35
40
Q4Q3Q2Q1Q4Q3Q2Q1Q4Q3Q2Q1Q4Q3Q2Q1Q4Q3Q2Q1Q4Q3Q2Q1Q4Q3Q2Q1
2010 2011 2012 2013 2014 2015 2016
0
2,000
4,000
6,000
8,000
10,000
12,000
14,000
16,000
Q4Q3Q2Q1Q4Q3Q2Q1Q4Q3Q2Q1Q4Q3Q2Q1Q4Q3Q2Q1Q4Q3Q2Q1Q4Q3Q2Q1
2010 2011 2012 2013 2014 2015 2016
48
DEAL DRIVERS – EMEA - THE MIDDLE EAST & NORTH AFRICA
THE MIDDLE EAST & NORTH AFRICAMIX OF DEALS BY INDUSTRY SECTOR
VALUE VOLUME
QUARTERLY TRENDS
VALUE VOLUME
Valu
e (€
m)
Volu
me
Based on announced deals, excluding those that lapsed or were withdrawn, where the dominant location of the target is in the Middle East & North Africa (excluding Israel). Industry sector is based on the dominant industry of the target.
Based on announced deals, excluding those that lapsed or were withdrawn, where the dominant location of the target is in the Middle East & North Africa (excluding Israel).Industry sector is based on the dominant industry of the target.
Moving average trend line
Industrials & Chemicals
Financial Services
Business Services
Consumer
Energy, Mining & Utilities
TMT
Leisure
Transportation
Pharma, Medical & Biotech
Construction
Real Estate

49
DEAL DRIVERS – EMEA – THE MIDDLE EAST & NORTH AFRICA
THE MIDDLE EAST & NORTH AFRICAFINANCIAL ADVISERS
TOP 20 – RANKED BY VALUE TOP 20 – RANKED BY VOLUME
TOP 20 – RANKED BY VALUE TOP 20 – RANKED BY VOLUME
LEGAL ADVISERS
The financial adviser league tables by value and volume have been run from 01/01/2016 to 31/12/2016, excluding lapsed and withdrawn deals. The tables are based on advice to a European bidder, target or vendor and cover the Middle East and North Africa excluding Israel, and cover all sectors.
2016 2015 Company Name Value (€m)
Number of Deals
1 2 Clifford Chance 22,353 21
2 3 Freshfields Bruckhaus Deringer 20,925 19
3 6 Linklaters 10,782 13
4 1 Allen & Overy 25,231 12
5 5 White & Case 17,192 12
6 44 Gibson Dunn & Crutcher 1,784 12
7 4 Baker & McKenzie 1,132 10
8 10 Clyde & Co 104 10
9 7 Shearman & Sterling 4,273 9
10 9 Norton Rose Fulbright 1,052 9
11 15 Latham & Watkins 325 7
12 27 Eversheds 40 7
13 55 DLA Piper 318 6
14 48 T-Law Advisors 527 5
15 17 Cleary Gottlieb Steen & Hamilton 6,597 4
16 36 Goodwin Procter 903 4
17 67 King & Wood Mallesons 684 4
18= 11 Hogan Lovells International - 4
18= 12 King & Spalding - 4
20 34 Sullivan & Cromwell 1,553 3
2016 2015 Company Name Value (€m)
Number of Deals
1 11 Allen & Overy 25,231 12
2 15 Clifford Chance 22,353 21
3 2 Freshfields Bruckhaus Deringer 20,925 19
4 10 White & Case 17,192 12
5 1 Linklaters 10,782 13
6 32 Cleary Gottlieb Steen & Hamilton 6,597 4
7 13 Shearman & Sterling 4,273 9
8 27 Skadden Arps Slate Meagher & Flom 3,139 2
9= - Grandall Law Firm 2,136 1
9= - Kabraji & Talibuddin 2,136 1
11 57 Gibson Dunn & Crutcher 1,784 12
12 19 Sullivan & Cromwell 1,553 3
13 31 Kirkland & Ellis 1,318 3
14 17 Baker & McKenzie 1,132 10
15 - Jeantet Associes 1,114 2
16 55 Norton Rose Fulbright 1,052 9
17 - Claro y Cia 1,048 2
18 - Vinge 1,000 2
19=
-
Accura; Arthur Cox; Gorrissen Federspiel; McCann FitzGerald; Pinsent Masons; Thommessen
1,000
1
2016 2015 Company Name Value (€m)
Number of Deals
1 2 EY 94 15
2 23 UBS Investment Bank 14,896 8
3 3 Rothschild 4,303 6
4 21 Jefferies 1,671 6
5 18 Credit Suisse 17,305 5
6 14 Lazard 7,797 5
7 7 JPMorgan 5,161 5
8 4 HSBC 1,380 5
9 13 Barclays 958 5
10 1 Morgan Stanley 689 5
11 17 KPMG 259 5
12 5 Citi 7,572 4
13 9 EFG-Hermes Holding 129 4
14 42 Houlihan Lokey 1,692 3
15 - deNovo Corporate Advisors 527 3
16 - VTB Capital 10,742 2
17 8 Bank of America Merrill Lynch 10,603 2
18 12 Goldman Sachs 3,369 2
19 - Societe Generale 1,307 2
20 22 Moelis & Company 1,179 2
2016 2015 Company Name Value (€m)
Number of Deals
1 22 Credit Suisse 17,305 5
2 26 UBS Investment Bank 14,896 8
3 - VTB Capital 10,742 2
4 8 Bank of America Merrill Lynch 10,603 2
5 12 Lazard 7,797 5
6 10 Citi 7,572 4
7 6 JPMorgan 5,161 5
8 2 Rothschild 4,303 6
9 3 Goldman Sachs 3,369 2
10 - Guotai Junan Securities 2,136 1
11 33 Houlihan Lokey 1,692 3
12 5 Jefferies 1,671 6
13 9 HSBC 1,380 5
14 - Societe Generale 1,307 2
15 19 Moelis & Company 1,179 2
16 15 Zaoui & Co 1,106 1
17 30 Evercore Partners 1,000 2
18 11 Barclays 958 5
19 7 Deutsche Bank 933 2
20 1 Morgan Stanley 689 5
The legal adviser league tables by value and volume have been run from 01/01/2016 to 31/12/2016 and include lapsed and withdrawn deals. The tables are based on advice to a European bidder, target or vendor and cover the Middle East and North Africa excluding Israel, and cover all sectors.

FINANCIAL TRANSACTIONS & REPORTING | MARKETING & COMMUNICATIONS FOR REGULATED INDUSTRY | CUSTOMER CONTENT & COLLABORATION SOLUTIONS
MERRILL DATASITE
This year, Merrill DataSite reached the 1 billion mark.
That’s 1 billion pages uploaded to our award-winning
virtual data room since 2004.
Thousands of companies worldwide trust us to securely
host their confidential information. Our single platform
exists to support your rapidly changing needs.
Contact us at +44 20 3031 6300 to see how we can
help you with your next transaction.
merrillcorp.com
© Merrill Communications LLC. All rights reserved.
Reaching the summit is no small feat.
1,000,000,000PAGES UPLOADED
41,000+VIRTUAL DATA ROOM PROJECTS SECURED
SINCE 2003
31,000+M&A TRANSACTIONS
SINCE 2003
20TECHNOLOGY AWARDS
IN THE PAST 8 YEARS
14LANGUAGES SPOKEN

52
DEAL DRIVERS – EMEA
MERRILL DATASITE CONTACTS
ASIA-PACIFIC
Chennai; Coimbatore; Hong Kong; Shenzhen; Singapore
Tel: +44 20 3031 6300
NORTH AMERICA
Andover; Atlanta; Boston; Bothell; Chicago; Dallas; Denver; Grove City; Houston; Irvine; La Mirada; Los Angeles; Minneapolis; New York; Oregon City; Palo Alto; Philadelphia; Sartell; Seattle; St. Cloud; St. Paul; Toronto; Troy; Union; Washington DC
Tel: 888 311 4100
EUROPE AND MIDDLE EAST & AFRICA
Frankfurt; London; Paris
Tel: +44 20 3031 6300
C&S AMERICA
Mexico City
Tel: +52 55 9171 2237
Sao Paulo
Tel: +55 11 3895 8542

53
DEAL DRIVERS – EMEA
ABOUT REMARK
Remark, the publishing, market research and events division of The Mergermarket Group, offers a range of services that give clients the opportunity to enhance their brand profile, and to develop new business opportunities. Remark publishes over 50 thought leadership reports and holds over 70 events across the globe each year which enable its clients to demonstrate their expertise and underline their credentials in a given market, sector or product.
Remark is part of The Mergermarket Group. To find out more please visit www.mergermarket.com/remark/ or www.mergermarket.com/events/.
Any queries regarding this publication or the data within it should be directed to:
Erik Wickman Global Managing Director, Remark Tel: +1 212 686 3329 [email protected]
Kathleen Van Aerden Head of Research, EMEA, Mergermarket [email protected]
David Swettenham Head of Production, Remark [email protected]
DEAL DRIVERS – EMEA

The following notes pertain to data contained in this publication:
• Deals are included where the deal value is greater than or equal to US$5m.
• Where no deal value has been disclosed, deals are included if the turnover of the target is greater than or equal to US$10m.
• Transactions excluded include property transactions and restructurings where the ultimate shareholders’ interests are not changed.
• Deals are included in the graphs for each section if the target is a European and MENA (excluding Israel) company, respectively.
• The list of Top Deals is based on deals where the target or parent is a European and MENA (excluding Israel) company, respectively.
• The data underlying the League Tables is based on deals where the bidder, target/vendor or parent of either is a European and MENA (excluding Israel) company, respectively.
© Mergermarket
Published by: Remark 4th Floor, 10 Queen Street Place London EC4R 1BE Tel:+44 (0)20 3741 1000 www.mergermarket.com
This publication contains general information and is not intended to be comprehensive nor to provide financial, investment, legal, tax or other professional advice or services. This publication is not a substitute for such professional advice or services, and it should not be acted on or relied upon or used as a basis for any investment or other decision or action that may affect you or your business. Before taking any such decision you should consult a suitably qualified professional adviser. Whilst reasonable effort has been made to ensure the accuracy of the information contained in this publication, this cannot be guaranteed and neither Mergermarket nor any of its subsidiaries nor any affiliate thereof or other related entity shall have any liability to any person or entity which relies on the information contained in this publication, including incidental or consequential damages arising from errors or omissions. Any such reliance is solely at the user’s risk.