Embed Size (px)
Citation preview

151
DDT (021)
EXPLANATION
DDT was first evaluated in 1966 and has been reviewed several times since. At the 22nd (1990) and23rd (1991) Sessions of the CCPR countries were requested to supply monitoring and other relevantdata on DDT (ALINORM 91/24, para 77; ALINORM 91/24A, para 77). At the 23rd Session theexisting Extraneous Maximum Residue Limits (ERLs) for DDT were converted to temporary limitsawaiting evaluation by the 1993 JMPR. The 1993 JMPR proposed ERLs for carrots, eggs, meat andmilks and the 1994 JMPR confirmed the existing TERL for cereal grains on the basis of the availabledata. The 1995 CCPR was informed that additional data on meat were available from Australia, NewZealand and the USA and decided to keep the proposal for meat at Step 3 pending the evaluation ofthese data by the 1996 JMPR. The 28th (1996) Session of the CCPR advanced all ERLs except thatfor meat to Step 8 (ALINORM 97/24, para 85).
The Meeting received national residue survey data on DDT in animal products from Australia(Anon., 1995a), Germany (Anon., 1995b), New Zealand (Anon., 1994; Jowett and Viggers, 1995),Norway (Anon., 1996), Thailand (Anon., 1995c) and the USA (Anon., 1995d) and on DDT in food ofplant origin from Norway (Anon., 1996) and The Netherlands (Anon, 1995e). The Netherlands alsosubmitted information on analytical methods and national MRLs (Anon., 1995e). Poland providedinformation on national MRLs (Anon., 1995f). The British annual report of the Working Party onPesticides Residues for 1994 included information on DDT residues (Anon., 1995g). Residue data andinformation on the dietary intake of DDT were made available by the Global Environment MonitoringSystem - Food Contamination Monitoring and Assessment Programme (GEMS/Food) of WHO (WHO,1996; Moy, 1996a,b).
USE PATTERN
No information was supplied by governments on registered or recommended uses of DDT inagriculture. An evaluation by the Pesticide Action Network (PAN, 1991) showed that DDT is banned(all uses prohibited by final regulatory action owing to health or environmental hazards) in 29countries, severely restricted (most uses prohibited owing to health or environmental hazards, certainspecific uses remain authorized) in 23 countries, and unregistered (no registered uses, but not explicitlybanned) in 4 countries.
RESIDUES IN FOOD IN COMMERCE OR AT CONSUMPTION
The presentation of the data received differed from country to country, and the layouts in the Tables areconsequently different. With the exception of the Australian data all the residues are expressed as thesum of p,p′-DDT, o,p′-DDT, p,p′-DDE and p,p′-TDE (p,p′-DDD), in conformity with the Codexdefinition. In the Australian survey the residues of DDT, DDE and TDE were reported separately.
Monitoring of meat in Australia (Table 1). Residues of p,p′- and o,p′-DDT, p,p′-DDE and p,p′-TDEwere reported for the period January 1989-December 1994 by the National Residue Survey ofAustralia. The reporting limit was 0.1 mg/kg for each compound.

DDT152
Table 1. Residues of DDT in meat in Australia, 1989-1994 (Anon., 1995a).
Commodity Compound No. ofsamples
No. ofresidue-free samples
No. of sampleswith trace only1
No. of samples with residues, mg/kg, in ranges 0.1-1 1.1-2.5 2.6-5 5.1-10 >10
Beef (fat) DDTDDETDE
398543985439854
397303714939752
60 1283 47
61 1394 53
1 24 2
1 3 1
1
Buffalo (fat) DDTDDETDE
432 432 432
432 428 438
1 1
3 1
Deer (fat) DDTDDETDE
110 110 110
110 106 110
3 1
Emu (fat) DDTDDETDE
9 9 9
9 7 9
2
Game goat (fat) DDTDDETDE
87 87 87
87 87 87
Goat (fat) DDTDDETDE
927 927 927
925 912 924
4 3
2 7
Horse (fat) DDTDDETDE
1939 1939 1939
1926 1837 1936
4 31
9 70 2
1 1
Kangaroo (fat) DDTDDETDE
482 482 482
480 473 482
2 3 6
Sheep (fat) DDTDDETDE
292702927029270
291692560429208
59 1336 33
41 2314 28
13 1
Porcine (fat) DDTDDETDE
159001590015900
157611525715814
62 427 44
74 210 40
2 5 2
1 1
Poultry (fat) DDTDDETDE
2167 2167 2167
2161 2007 2165
4 151 1
2 9 1
Rabbit (fat) DDTDDETDE
570 570 570
570 566 562
4 7 1
1 Trace only: unquantifiable amount between the limit of detection and the reporting limit (0.1 mg/kg)
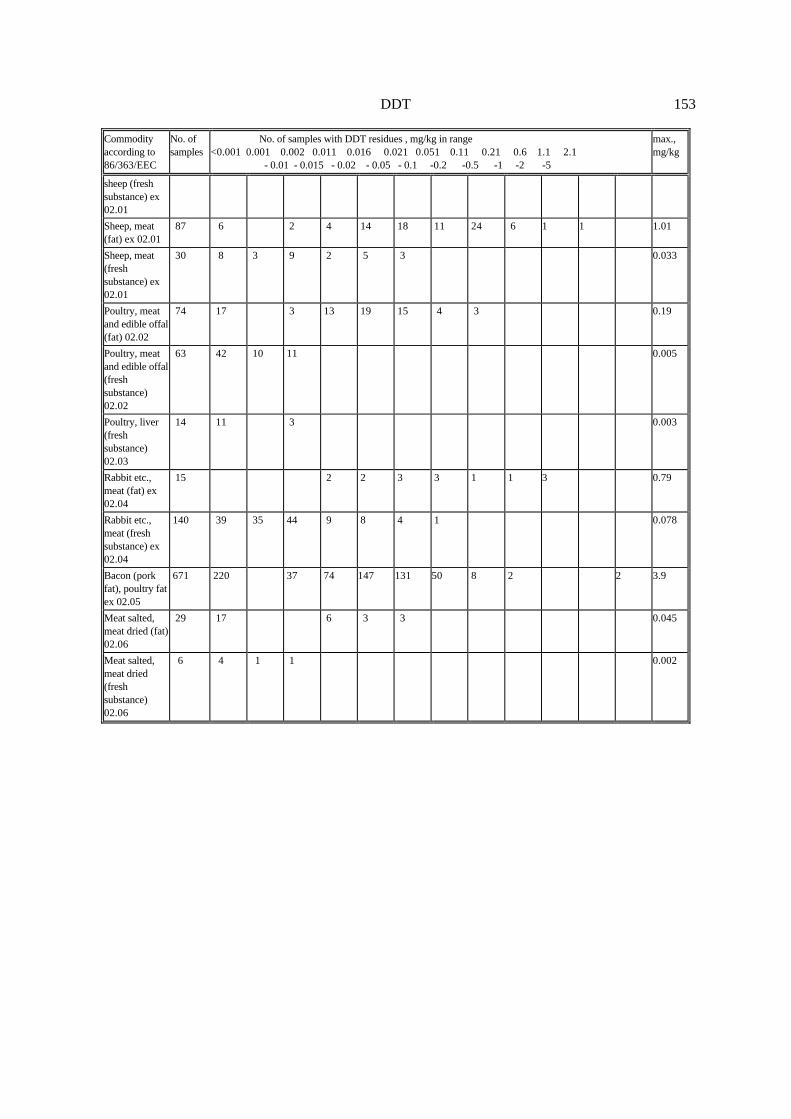
Monitoring of meat in Germany (Table 2). Information was supplied on residues of DDT frommonitoring carried out in 1993. Residue data were expressed on the fat and raw product basis with alimit of determination of 0.001 mg/kg. The commodities were classified according to Council Directiveof 24 July 1986, 86/363/EEC, modifying Council Directive 93/57/EEC of 29 June 1993 (EEC, 1986,1993).
Table 2. Residues of DDT in meat in Germany, 1993 (Anon., 1995b).
Commodityaccording to86/363/EEC
No. ofsamples
No. of samples with DDT residues , mg/kg in range<0.001 0.001 0.002 0.011 0.016 0.021 0.051 0.11 0.21 0.6 1.1 2.1 - 0.01 - 0.015 - 0.02 - 0.05 - 0.1 -0.2 -0.5 -1 -2 -5
max.,mg/kg
Meat, exceptsheep (fat) ex02.01
777 128 87 54 102 230 119 39 17 1 0.5
Meat, except 1080 618 192 221 36 7 3 2 1 0.42
DDT 153
Commodityaccording to86/363/EEC
No. ofsamples
No. of samples with DDT residues , mg/kg in range<0.001 0.001 0.002 0.011 0.016 0.021 0.051 0.11 0.21 0.6 1.1 2.1 - 0.01 - 0.015 - 0.02 - 0.05 - 0.1 -0.2 -0.5 -1 -2 -5
max.,mg/kg
sheep (freshsubstance) ex02.01
Sheep, meat(fat) ex 02.01
87 6 2 4 14 18 11 24 6 1 1 1.01
Sheep, meat(freshsubstance) ex02.01
30 8 3 9 2 5 3 0.033
Poultry, meatand edible offal(fat) 02.02
74 17 3 13 19 15 4 3 0.19
Poultry, meatand edible offal(freshsubstance)02.02
63 42 10 11 0.005
Poultry, liver(freshsubstance)02.03
14 11 3 0.003
Rabbit etc.,meat (fat) ex02.04
15 2 2 3 3 1 1 3 0.79
Rabbit etc.,meat (freshsubstance) ex02.04
140 39 35 44 9 8 4 1 0.078
Bacon (porkfat), poultry fatex 02.05
671 220 37 74 147 131 50 8 2 2 3.9
Meat salted,meat dried (fat)02.06
29 17 6 3 3 0.045
Meat salted,meat dried(freshsubstance)02.06
6 4 1 1 0.002

DDT154
Commodities according to Council Directive 86/363/EEC:ex 02.01: Meat and edible offal of horses, asses, mules,bovine animals, swine, sheep and goats, fresh, chilled or frozen 02.02: Dead poultry and edible offal thereof (except liver), fresh, salted or in brine 02.03: Poultry liver, fresh, chilled, frozen, salted or in brineex 02.04: Other meat and edible offal, fresh, chilled or frozen, of domestic pigeons, domestic rabbits and gameex 02.05: Pig fat and poultry fat, fresh, chilled, frozen, salted, in brine, dried or smoked 02.06: Meat and edible offal (except poultry liver), salted, in brine, dried or smoked
Monitoring of meat in New Zealand. The results of residue monitoring from July 1990 to June 1994,including routine testing (Table 3) and specifically targeted sampling from regions with a known DDThistory (Table 4) were submitted.
Table 3. Residues of DDT in meat in New Zealand, 1990-1994 (Anon., 1994).
Commodity, Year No. of samplesanalysed
No.positive1
No. of samples with residues, mg/kg fat, inrange
DDT, mg/kg
0.02-0.5
0.51-1.0
1.01-2.0
2.1-5.0
>5 Mean Median Max.
Lambs
1990-1991 244 123 119 1 3 0.13 0.05 1.4
1991-1992 159 95 84 4 7 0.24 0.11 1.7
1992-1993 261 138 127 7 2 2 0.19 0.07 3.7
1993-1994 301 178 161 13 4 0.19 0.08 1.5
Sum 965 534 491 25 16 2
% of no. analysed 55.5 51 2.6 1.7 0.2
Adult sheep
1990-1991 203 85 77 5 1 2 0.21 0.07 3.3
1991-1992 158 87 78 5 4 0.2 0.07 1.5
1992-1993 84 37 34 2 1 0.2 0.09 1.2
1993-1994 103 68 61 3 2 2 0.24 0.06 2.6
Sum 548 277 250 15 8 4
% of no. analysed 50.5 46 2.7 1.5 0.7
Adult bovine
1990-1991 202 70 69 1 0.085 0.04 0.73
1991-1992 261 125 117 5 3 0.14 0.06 1.3
1992-1993 132 47 47 1 0.08 0.04 0.89
1993-1994 164 77 71 4 2 0.16 0.08 1.4
Sum 739 319 304 11 5
% of no. analysed 43 41 1.5 0.68
Suckling calves
1990-1991 306 201 175 18 8 0.23 0.11 1.3
1991-1992 309 246 206 26 7 7 0.31 0.13 4.1
1992-1993 310 193 188 5 0.13 0.09 0.98
1993-1994 301 217 199 9 6 2 1 0.29 0.15 5.2
Sum 1211 857 768 58 21 9 1
% of no. analysed 71 63 4.8 1.7 0.74 0.08
Pigs
1990-1991 232 88 85 3 0.07 0.03 0.62
1991-1992 305 180 175 1 2 2 0.12 0.045 3.1
1992-1993 288 170 161 4 3 1 1 0.17 0.04 6.2
1993-1994 100 69 66 2 1 0.12 0.05 1.45
DDT 155
Commodity, Year No. of samplesanalysed
No.positive1
No. of samples with residues, mg/kg fat, inrange
DDT, mg/kg
0.02-0.5
0.51-1.0
1.01-2.0
2.1-5.0
>5 Mean Median Max.
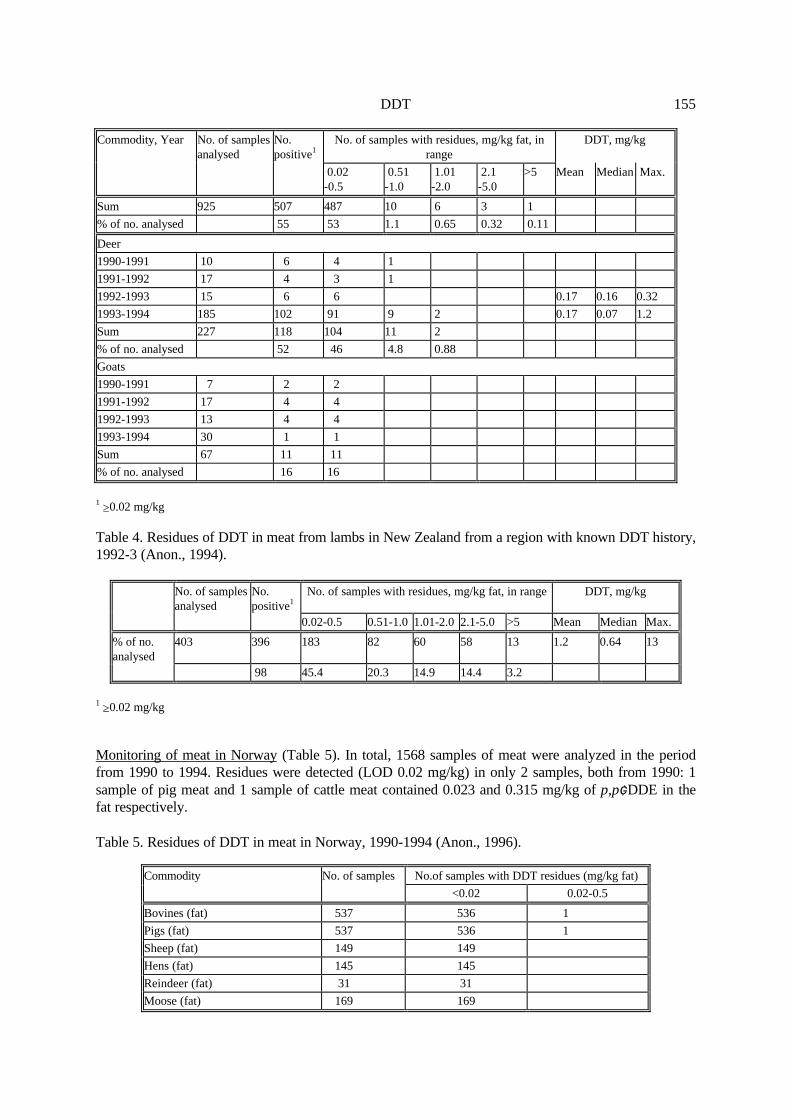
Sum 925 507 487 10 6 3 1
% of no. analysed 55 53 1.1 0.65 0.32 0.11
Deer
1990-1991 10 6 4 1
1991-1992 17 4 3 1
1992-1993 15 6 6 0.17 0.16 0.32
1993-1994 185 102 91 9 2 0.17 0.07 1.2
Sum 227 118 104 11 2
% of no. analysed 52 46 4.8 0.88
Goats
1990-1991 7 2 2
1991-1992 17 4 4
1992-1993 13 4 4
1993-1994 30 1 1
Sum 67 11 11
% of no. analysed 16 16
1 ≥0.02 mg/kg
Table 4. Residues of DDT in meat from lambs in New Zealand from a region with known DDT history,1992-3 (Anon., 1994).
No. of samplesanalysed
No.positive1
No. of samples with residues, mg/kg fat, in range DDT, mg/kg
0.02-0.5 0.51-1.0 1.01-2.0 2.1-5.0 >5 Mean Median Max.
% of no.analysed
403 396 183 82 60 58 13 1.2 0.64 13
98 45.4 20.3 14.9 14.4 3.2
1 ≥0.02 mg/kg
Monitoring of meat in Norway (Table 5). In total, 1568 samples of meat were analyzed in the periodfrom 1990 to 1994. Residues were detected (LOD 0.02 mg/kg) in only 2 samples, both from 1990: 1sample of pig meat and 1 sample of cattle meat contained 0.023 and 0.315 mg/kg of p,p′-DDE in thefat respectively.
Table 5. Residues of DDT in meat in Norway, 1990-1994 (Anon., 1996).
Commodity No. of samples No.of samples with DDT residues (mg/kg fat)
<0.02 0.02-0.5
Bovines (fat) 537 536 1
Pigs (fat) 537 536 1
Sheep (fat) 149 149
Hens (fat) 145 145
Reindeer (fat) 31 31
Moose (fat) 169 169
DDT156
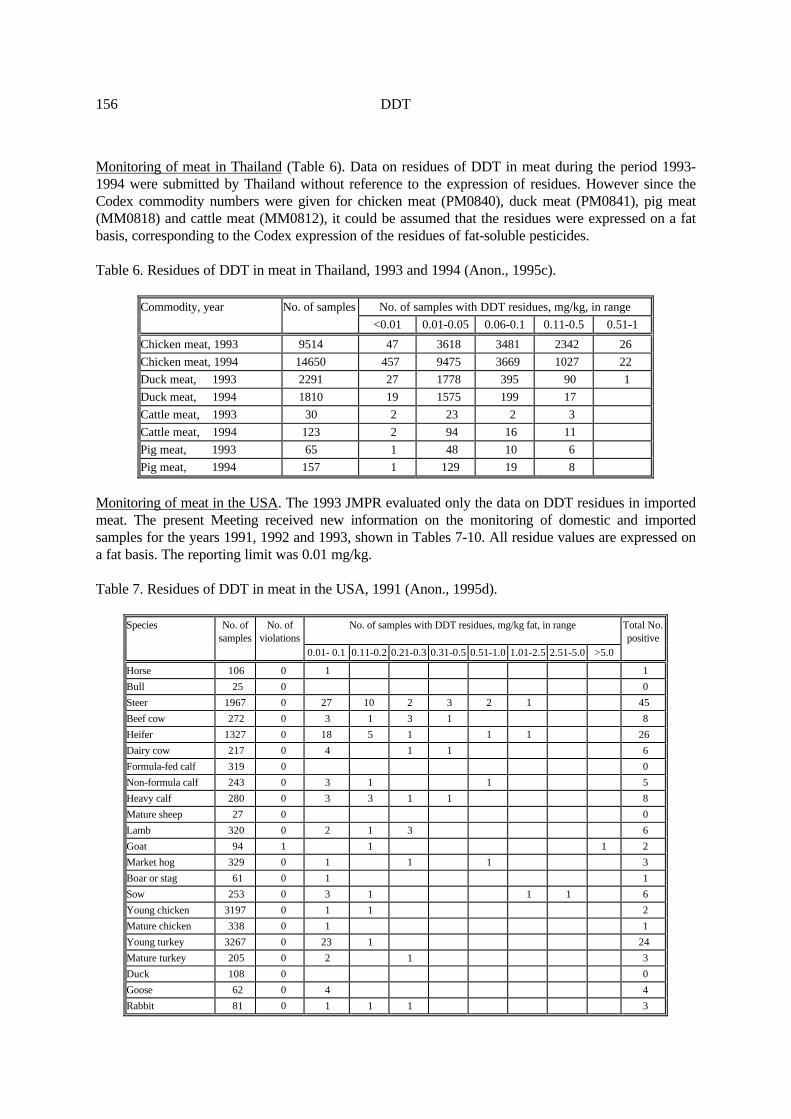
Monitoring of meat in Thailand (Table 6). Data on residues of DDT in meat during the period 1993-1994 were submitted by Thailand without reference to the expression of residues. However since theCodex commodity numbers were given for chicken meat (PM0840), duck meat (PM0841), pig meat(MM0818) and cattle meat (MM0812), it could be assumed that the residues were expressed on a fatbasis, corresponding to the Codex expression of the residues of fat-soluble pesticides.
Table 6. Residues of DDT in meat in Thailand, 1993 and 1994 (Anon., 1995c).
Commodity, year No. of samples No. of samples with DDT residues, mg/kg, in range
<0.01 0.01-0.05 0.06-0.1 0.11-0.5 0.51-1
Chicken meat, 1993 9514 47 3618 3481 2342 26
Chicken meat, 1994 14650 457 9475 3669 1027 22
Duck meat, 1993 2291 27 1778 395 90 1
Duck meat, 1994 1810 19 1575 199 17
Cattle meat, 1993 30 2 23 2 3
Cattle meat, 1994 123 2 94 16 11
Pig meat, 1993 65 1 48 10 6
Pig meat, 1994 157 1 129 19 8
Monitoring of meat in the USA. The 1993 JMPR evaluated only the data on DDT residues in importedmeat. The present Meeting received new information on the monitoring of domestic and importedsamples for the years 1991, 1992 and 1993, shown in Tables 7-10. All residue values are expressed ona fat basis. The reporting limit was 0.01 mg/kg.
Table 7. Residues of DDT in meat in the USA, 1991 (Anon., 1995d).
Species No. ofsamples
No. ofviolations
No. of samples with DDT residues, mg/kg fat, in range Total No.positive
0.01- 0.1 0.11-0.2 0.21-0.3 0.31-0.5 0.51-1.0 1.01-2.5 2.51-5.0 >5.0
Horse 106 0 1 1
Bull 25 0 0
Steer 1967 0 27 10 2 3 2 1 45
Beef cow 272 0 3 1 3 1 8
Heifer 1327 0 18 5 1 1 1 26
Dairy cow 217 0 4 1 1 6
Formula-fed calf 319 0 0
Non-formula calf 243 0 3 1 1 5
Heavy calf 280 0 3 3 1 1 8
Mature sheep 27 0 0
Lamb 320 0 2 1 3 6
Goat 94 1 1 1 2
Market hog 329 0 1 1 1 3
Boar or stag 61 0 1 1
Sow 253 0 3 1 1 1 6
Young chicken 3197 0 1 1 2
Mature chicken 338 0 1 1
Young turkey 3267 0 23 1 24
Mature turkey 205 0 2 1 3
Duck 108 0 0
Goose 62 0 4 4
Rabbit 81 0 1 1 1 3
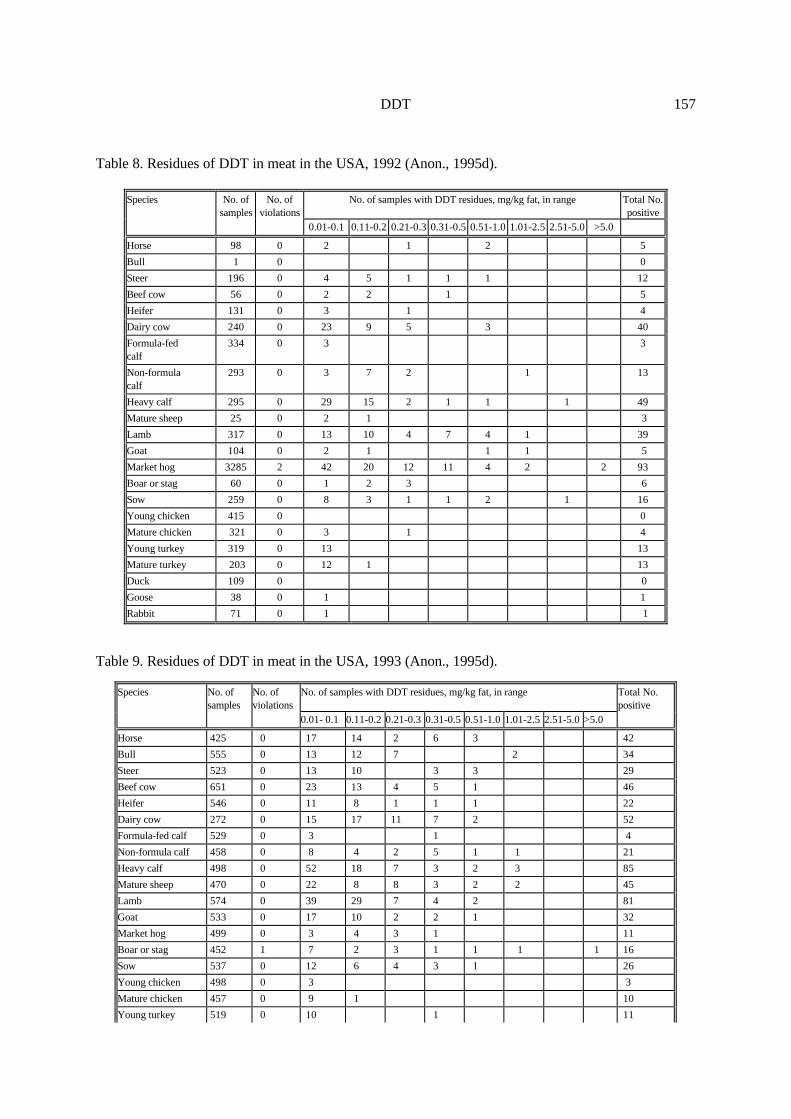
DDT 157
Table 8. Residues of DDT in meat in the USA, 1992 (Anon., 1995d).
Species No. ofsamples
No. ofviolations
No. of samples with DDT residues, mg/kg fat, in range Total No.positive
0.01-0.1 0.11-0.2 0.21-0.3 0.31-0.5 0.51-1.0 1.01-2.5 2.51-5.0 >5.0
Horse 98 0 2 1 2 5
Bull 1 0 0
Steer 196 0 4 5 1 1 1 12
Beef cow 56 0 2 2 1 5
Heifer 131 0 3 1 4
Dairy cow 240 0 23 9 5 3 40
Formula-fedcalf
334 0 3 3
Non-formulacalf
293 0 3 7 2 1 13
Heavy calf 295 0 29 15 2 1 1 1 49
Mature sheep 25 0 2 1 3
Lamb 317 0 13 10 4 7 4 1 39
Goat 104 0 2 1 1 1 5
Market hog 3285 2 42 20 12 11 4 2 2 93
Boar or stag 60 0 1 2 3 6
Sow 259 0 8 3 1 1 2 1 16
Young chicken 415 0 0
Mature chicken 321 0 3 1 4
Young turkey 319 0 13 13
Mature turkey 203 0 12 1 13
Duck 109 0 0
Goose 38 0 1 1
Rabbit 71 0 1 1
Table 9. Residues of DDT in meat in the USA, 1993 (Anon., 1995d).
Species No. ofsamples
No. ofviolations
No. of samples with DDT residues, mg/kg fat, in range Total No.positive
0.01- 0.1 0.11-0.2 0.21-0.3 0.31-0.5 0.51-1.0 1.01-2.5 2.51-5.0 >5.0
Horse 425 0 17 14 2 6 3 42
Bull 555 0 13 12 7 2 34
Steer 523 0 13 10 3 3 29
Beef cow 651 0 23 13 4 5 1 46
Heifer 546 0 11 8 1 1 1 22
Dairy cow 272 0 15 17 11 7 2 52
Formula-fed calf 529 0 3 1 4
Non-formula calf 458 0 8 4 2 5 1 1 21
Heavy calf 498 0 52 18 7 3 2 3 85
Mature sheep 470 0 22 8 8 3 2 2 45
Lamb 574 0 39 29 7 4 2 81
Goat 533 0 17 10 2 2 1 32
Market hog 499 0 3 4 3 1 11
Boar or stag 452 1 7 2 3 1 1 1 1 16
Sow 537 0 12 6 4 3 1 26
Young chicken 498 0 3 3
Mature chicken 457 0 9 1 10
Young turkey 519 0 10 1 11

DDT158
Species No. ofsamples
No. ofviolations
No. of samples with DDT residues, mg/kg fat, in range Total No.positive
0.01- 0.1 0.11-0.2 0.21-0.3 0.31-0.5 0.51-1.0 1.01-2.5 2.51-5.0 >5.0
Mature turkey 228 0 4 4
Duck 322 0 1 1
Goose 3 0 0
Rabbit 84 0 2 1 3
Monitoring data for the period January-December 1994 are summarized in Table 10. Thereporting limit was 0.04 mg/kg. All residues are expressed on a fat basis.
Table 10. Residues of DDT in meat in the USA, 1994 (Anon., 1995d).
Species No. ofsamples
No. of samples with DDT residues, mg/kg fat, in range
<0.04 0.04-0.1 0.11-0.2 0.21-0.3 0.31-0.5 0.51-1 1.01-2.5 2.51-5 >5
Cattle 3955 3657 151 66 39 31 7 2 1 1
Pigs 1457 1346 57 27 14 8 3 1 1
Horses 217 213 1 2
Poultry 1990 1973 13 3 1
Sheep and goats 900 692 91 55 27 15 18 2
Monitoring of dairy products in New Zealand (Table 11). DDT residues found in the monitoring ofdairy products carried out from June 1992 to May 1994 are shown in Table 11. In samples with a fatcontent of 2% or more "total DDT and metabolites" occurred only as DDE. Two anomalously highresidues in cheese of 0.48 and 0.55 mg/kg in the fat, were both considered to be due to stress of theanimals caused by an early summer snow storm. In addition to butter, cheese and fortified milk (babyfood) the products analysed were anhydrous milk fat (99.9% fat), buttermilk powder (12% fat), wholemilk powder (26% fat), whey protein concentrate (1.2% fat), skim milk powder (max. 1.2% fat),casein, caseinate, total milk protein (max. 1.2% fat), lactose and lactalbumin. In all, 2915 samples wereanalysed (Table 11, last line) using an analytical method with a limit of determination of 0.01 mg/kg.
Table 11. Residues of DDT in dairy products in New Zealand, June 1992 - May 1994 (Jowett andViggers, 1995).
Commodity No. of samples
No. of samples with DDT residues, mg/kg fat, in range Max. residue, mg/kg fat
<0.01 0.01-0.099 0.1-0.19 0.2-0.49 0.5-1.0
Butter 180 29 142 9 0.13
Cheese 398 42 277 61 17 1 0.55
Fortified milk,Baby food
295 144 148 3 0.16
All productgroups combined1
2915 966 1748 171 29 1 0.55
1 Butter, cheese, fortified milk, anhydrous milk fat, buttermilk powder, whole milk powder, whey protein concentrate, skimmilk powder, casein, caseinate, total milk protein, lactose, lactalbumin
Monitoring of foods of plant origin in Norway. In Norway, domestic and imported food is routinely

DDT 159
analysed for residues of DDT. In the period 1985-1995 12,682 samples of fruit, vegetables andpotatoes were analysed with a limit of determination of 0.05 mg/kg (Anon., 1996). Residues were foundonly in a single sample of imported table grapes in 1994 which contained 1.2 mg/kg DDT, probablyowing to illegal use. Results from the monitoring of cereal grains (wheat 411, rye 70, oats 15 samples)during the period 1990-1995 were also received. The residues were below the Norwegian nationalMRL (before 1994 0.1 mg/kg, since 1994 0.05 mg/kg).
Monitoring of food of plant origin in The Netherlands. The 1993 JMPR reported monitoring data onDDT residues for the period 1987-1991. The present Meeting received additional information for 1991-1993 and 1994 (Tables 12 and 13). In addition 167 samples of tea were analysed during 1991-1993:four samples contained residues of DDT above the LOD of 0.05 mg/kg but below the Dutch MRL of 1mg/kg.
Table 12. Residues of DDT in foods of plant origin in The Netherlands, 1991-1993 (Anon., 1995e).
Product No. of samples No. of samples with DDT residues, mg/kg, in range <0.05 0.05-0.09 0.1 or higher
Berries and small fruit: grapes 999 994 5
Miscellaneous fruit: kiwifruit 309 307 2
Root and tuber vegetables: carrots 609 606 3
Fruiting vegetables: sweet peppers cucumbers
1129 644
1127 222
2 2
Leaf vegetables and fresh herbs: lambs lettuce iceberg lettuce
310 557
305 553
5 4
Table 13. Residues of DDT in foods of plant origin in The Netherlands, 1994 (Anon., 1995e).
Product No. ofsamples
No. of samples with DDT residues,mg/kg, in range
<0.025 0.025-0.049 ≥0.05
Berries and small fruit 103 101 2
Root and tuber vegetables: carrots 144 143 1
Stem vegetables: celery 209 208 1
Fruiting vegetables: tomatoes melons
332 164
331 164
1
Leaf vegetables and fresh herbs: iceberg lettuce parsley
185 149
184 148
11
Pulses 23 22 1
UK monitoring data. Table 14 shows the results of the 1994 UK monitoring programme for DDTresidues (Anon., 1995g).

DDT160
Table 14. Residues of DDT in foods in the UK, 1994 (Anon., 1995g).
Commodity No. of samples Residue or range, mg/kg, and(no. of samples)
Basis MRL,mg/kg
Remarks
Bread 53 <0.01 (53)
Milk 202 <0.0008 (201), 0.002 (1) whole product 0.04 residue present asp,p′-DDE
Apple, dessertApple, cookingApple, juice
25 UK 48 imported 29 UK 40 UK 9 imported
<0.05 (73)<0.05 (29)<0.05 (49)
Asparagus 6 UK 20 imported <0.01 (26)
Lettuce imported UK produced
31 56
<0.01 (30), 0.02 (1, France)<0.01 (56)
0.05residue present asp,p′-DDE
Infant cerealsWheat germWheat bran
12 8 11
<0.01 (12)<0.01 (8)<0.01 (11)
Cream UK produced unknown origin
30 6
<0.04 (30)<0.04 (6)
fatfat
Chocolate UK produced imported
62 2
<0.02 (62)<0.02 (2)
fatfat
Honey UK produced imported blended
20 60 20
<0.008 (20)<0.008 (59), 0.009 (1, Mexico)<0.008 (20)
whole product residue present as p,p′-DDT and o,p′-DDT
Vegetable oils imported unknown origin
57 16
<0.02 (62)<0.02 (2)
fat
Goat cheese UK produced imported unknown originGoat milk
11 11 6 8
<0.01 (11)<0.01 (11)<0.01 (6)<0.004 (8)
fatfatfatwhole product
Pig kidney UK produced imported unknown origin
11 1 11
<0.008 (11)<0.008<0.008 (11)
whole product
Lamb kidney UK produced imported unknown origin
11 6 8
<0.008 (9), 0.009 (2)<0.008 (6)<0.008 (8)
wholeproduct
0.1 1st sample:0.009 p,p′-DDE,2nd sample: 0.003 p,p′-TDE and 0.006 p,p′-DDE
Ox kidney UK produced unknown origin
15 16
<0.008 (15)<0.008 (16)
wholeproduct
Lamb, imported 74 <0.01 (38), 0.01-0.09 (23) 0.1-0.3 (12), 0.8
fat 1 residue present asp,p′-DDE
Lamb liver UK produced imported
12 5
<0.008 (12)<0.008 (5)
wholeproduct
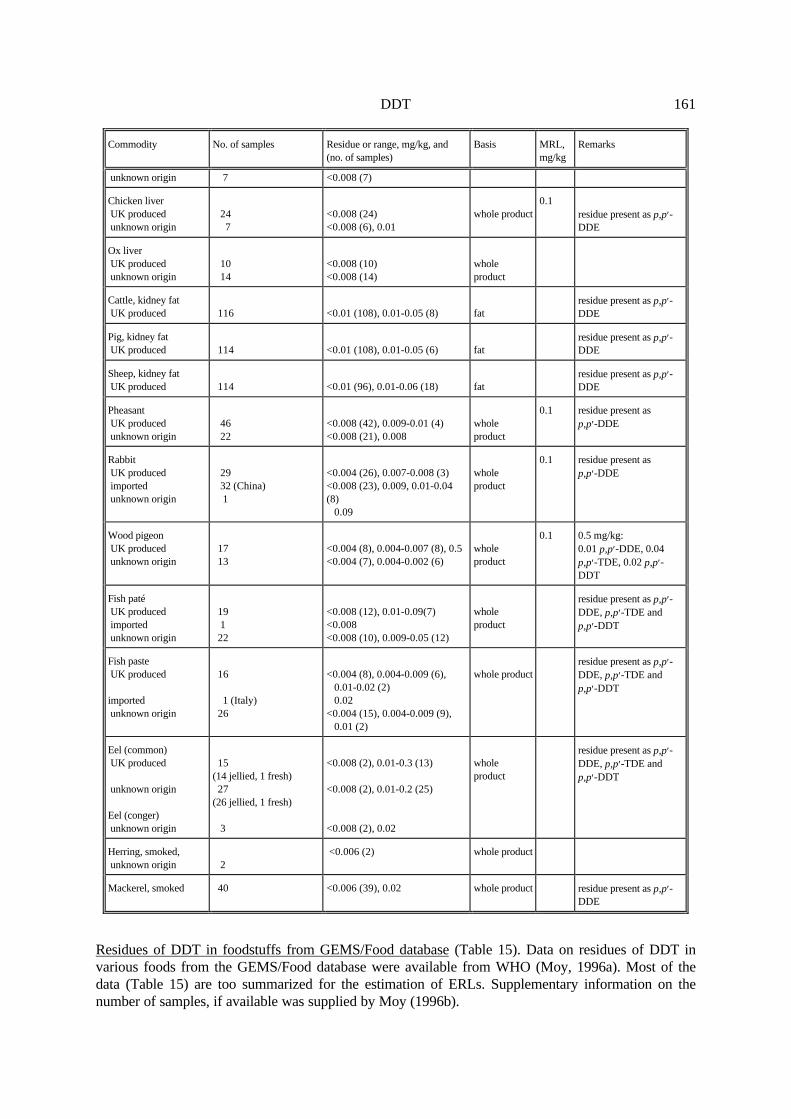
DDT 161
Commodity No. of samples Residue or range, mg/kg, and(no. of samples)
Basis MRL,mg/kg
Remarks
unknown origin 7 <0.008 (7)
Chicken liver UK produced unknown origin
24 7
<0.008 (24)<0.008 (6), 0.01
whole product0.1
residue present as p,p′-DDE
Ox liver UK produced unknown origin
10 14
<0.008 (10)<0.008 (14)
wholeproduct
Cattle, kidney fat UK produced
116 <0.01 (108), 0.01-0.05 (8) fat
residue present as p,p′-DDE
Pig, kidney fat UK produced 114 <0.01 (108), 0.01-0.05 (6) fat
residue present as p,p′-DDE
Sheep, kidney fat UK produced 114 <0.01 (96), 0.01-0.06 (18) fat
residue present as p,p′-DDE
Pheasant UK produced unknown origin
46 22
<0.008 (42), 0.009-0.01 (4)<0.008 (21), 0.008
wholeproduct
0.1 residue present asp,p′-DDE
Rabbit UK produced imported unknown origin
29 32 (China) 1
<0.004 (26), 0.007-0.008 (3)<0.008 (23), 0.009, 0.01-0.04(8) 0.09
wholeproduct
0.1 residue present asp,p′-DDE
Wood pigeon UK produced unknown origin
17 13
<0.004 (8), 0.004-0.007 (8), 0.5<0.004 (7), 0.004-0.002 (6)
wholeproduct
0.1 0.5 mg/kg:0.01 p,p′-DDE, 0.04p,p′-TDE, 0.02 p,p′-DDT
Fish paté UK produced imported unknown origin
19 1 22
<0.008 (12), 0.01-0.09(7)<0.008<0.008 (10), 0.009-0.05 (12)
wholeproduct
residue present as p,p′-DDE, p,p′-TDE andp,p′-DDT
Fish paste UK produced
imported unknown origin
16
1 (Italy) 26
<0.004 (8), 0.004-0.009 (6), 0.01-0.02 (2) 0.02<0.004 (15), 0.004-0.009 (9), 0.01 (2)
whole productresidue present as p,p′-DDE, p,p′-TDE andp,p′-DDT
Eel (common) UK produced
unknown origin
Eel (conger) unknown origin
15(14 jellied, 1 fresh) 27(26 jellied, 1 fresh)
3
<0.008 (2), 0.01-0.3 (13)
<0.008 (2), 0.01-0.2 (25)
<0.008 (2), 0.02
wholeproduct
residue present as p,p′-DDE, p,p′-TDE andp,p′-DDT
Herring, smoked, unknown origin 2
<0.006 (2) whole product
Mackerel, smoked 40 <0.006 (39), 0.02 whole product residue present as p,p′-DDE
Residues of DDT in foodstuffs from GEMS/Food database (Table 15). Data on residues of DDT invarious foods from the GEMS/Food database were available from WHO (Moy, 1996a). Most of thedata (Table 15) are too summarized for the estimation of ERLs. Supplementary information on thenumber of samples, if available was supplied by Moy (1996b).

DDT162
Table 15. DDT residues in foodstuffs from various countries (GEMS/Food; Moy, 1996a,b).
Commodity/Country Year Residues, mg/kg Remarks and {no. of samples}
Median Mean 90thpercentile
Range
Cereals/Australia 1990-1992 0.0082 0.00002-0.0023
Cereals/Canada 1989-1990 <0.01<0.01
<0.01<0.01
<0.01-0.02<0.01-0.01
Breakfast cereal {50}Infant cereal {50}
Cereals/China (P.R.) 19921990
0.019 0.0270.0012
0.095 <0.001-0.0950.0009-0.0014
Cereals/India 1990 (R)1990 (R)1990 (R)
1989
0.120.0260.31
0.0035
max.0.52max.0.085
max 1.30.0017-0.0054
WheatRiceMaize
Cereals/Former SovietUnion
1991 (R)1991 (R)
1.31.2
o,p′-DDT in wheatp,p′-DDT in wheat
Cereals/Spain 1990-19911990-1991
<0.001<0.001
<0.001-0.003<0.001-0.003
Bread, Basque countryCereals, Basque country
Cereals/Qatar 1989-1991 <0.01 Wheat, barley, maize, rice,flour {233}
Cereals/Vietnam 1990-1991 0.002 0.001-0.0033 Rice
Chicken/Brazil 199119901989
<0.001<0.001<0.001
0.070.040.07
<0.001-0.3<0.001-0.22<0.001-0.16
Sao Paulo {30}Sao Paulo {22}Sao Paulo {36}
Chicken/Canada 1984-19891986-19881986-1988
0.0010.00140.0009
max. 0.003max.0.0013
Chicken meat, domesticDDE, Avian, broilerDDE, Avian, turkey
Chicken/Denmark 1986-1991 0.003 0.002-0.003 Poultry meat, domestic
Chicken/Japan 1992-1993 0.001
Chicken/Kenya 1988 (R) 0.68
Chicken/Poland 1992 0.0560.02
Chicken/Spain 1995 (R) 0.00063 0.0004-0.00087 DDE, fresh poultry sausage
Eggs/Canada 1986-1988 0.008 max. 0.009 DDE, extractable fat, Ontario
Eggs/China (P.R.) 19921990
0.02 0.030.041
0.095 0.01-0.0950.013-0.072
Eggs/Cuba 1985-1988 0.61 Fat
Eggs/Denmark 1986-1991 0.02 0.02-0.03
Eggs/Finland 1994 (R) 0.0016 0.0005-0.024 Imported (fat)
Eggs/Netherlands 1990-1992 0.11-0.20 Egg powder (fat)
Eggs/Spain 1990-1991 <0.001 Basque country
Fish/Arabian Gulf 1987 (R)1987 (R)
0.002-0.0110.005-0.045
NW Arabian GulfHor-al-Hammar
Fish/Australia 1990-1991 0.022 0.00014-0.23
Fish/Canada 19841984
23
Cod, Admiralty IntelCod, Barrow Strait
Fish/China (P.R.) 19921990
0.024 0.0460.14
0.095 max. 0.310.0097-0.44
Fish uncookedAquatic food
Molluscs/Croatia 1976-19901976-19901976-1990
0.00510.00510.006
0.00790.00840.0063
BivalvesMusselsOysters
Fish/Cuba 1985-1988 0.075
Fish/Egypt 1990 (R)1990 (R)1990 (R)1990 (R)
1986-19881986-19881986-1988
0.00490.0760.0470.0150.730.230.057
o,p′-DDEp,p′-DDTo,p′-DDTp,p′-DDTo,p′-DDT, Red Sea gov.p,p′-DDE, Ismailia gov.p,p′-DDT, Ismailia gov.
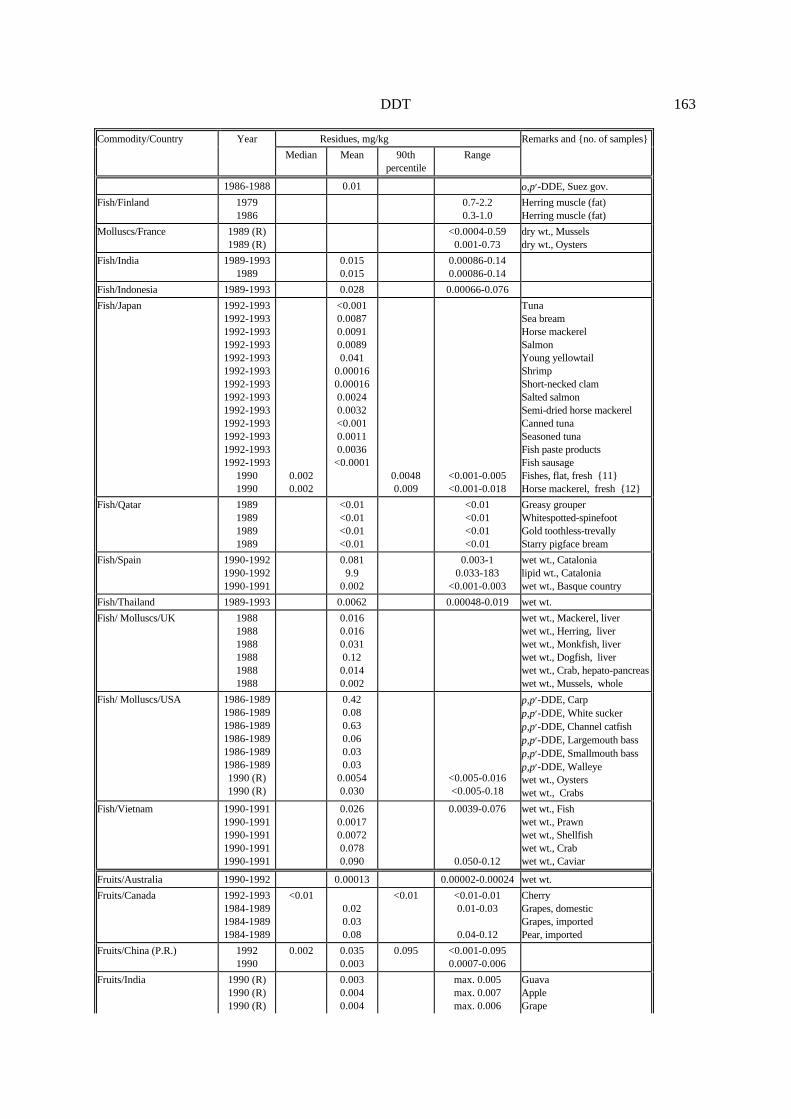
DDT 163
Commodity/Country Year Residues, mg/kg Remarks and {no. of samples}
Median Mean 90thpercentile
Range
1986-1988 0.01 o,p′-DDE, Suez gov.
Fish/Finland 19791986
0.7-2.20.3-1.0
Herring muscle (fat)Herring muscle (fat)
Molluscs/France 1989 (R)1989 (R)
<0.0004-0.590.001-0.73
dry wt., Musselsdry wt., Oysters
Fish/India 1989-19931989
0.0150.015
0.00086-0.140.00086-0.14
Fish/Indonesia 1989-1993 0.028 0.00066-0.076
Fish/Japan 1992-19931992-19931992-19931992-19931992-19931992-19931992-19931992-19931992-19931992-19931992-19931992-19931992-1993
19901990
0.0020.002
<0.0010.00870.00910.00890.041
0.000160.000160.00240.0032<0.0010.00110.0036
<0.00010.00480.009
<0.001-0.005<0.001-0.018
TunaSea breamHorse mackerelSalmonYoung yellowtailShrimpShort-necked clamSalted salmonSemi-dried horse mackerelCanned tunaSeasoned tunaFish paste productsFish sausageFishes, flat, fresh {11}Horse mackerel, fresh {12}
Fish/Qatar 1989198919891989
<0.01<0.01<0.01<0.01
<0.01<0.01<0.01<0.01
Greasy grouperWhitespotted-spinefootGold toothless-trevallyStarry pigface bream
Fish/Spain 1990-19921990-19921990-1991
0.0819.9
0.002
0.003-10.033-183
<0.001-0.003
wet wt., Catalonialipid wt., Cataloniawet wt., Basque country
Fish/Thailand 1989-1993 0.0062 0.00048-0.019 wet wt.
Fish/ Molluscs/UK 198819881988198819881988
0.0160.0160.0310.120.0140.002
wet wt., Mackerel, liverwet wt., Herring, liverwet wt., Monkfish, liverwet wt., Dogfish, liverwet wt., Crab, hepato-pancreaswet wt., Mussels, whole
Fish/ Molluscs/USA 1986-19891986-19891986-19891986-19891986-19891986-19891990 (R)1990 (R)
0.420.080.630.060.030.03
0.00540.030
<0.005-0.016<0.005-0.18
p,p′-DDE, Carpp,p′-DDE, White suckerp,p′-DDE, Channel catfishp,p′-DDE, Largemouth bassp,p′-DDE, Smallmouth bassp,p′-DDE, Walleyewet wt., Oysterswet wt., Crabs
Fish/Vietnam 1990-19911990-19911990-19911990-19911990-1991
0.0260.00170.00720.0780.090
0.0039-0.076
0.050-0.12
wet wt., Fishwet wt., Prawnwet wt., Shellfishwet wt., Crabwet wt., Caviar
Fruits/Australia 1990-1992 0.00013 0.00002-0.00024 wet wt.
Fruits/Canada 1992-19931984-19891984-19891984-1989
<0.010.020.030.08
<0.01 <0.01-0.010.01-0.03
0.04-0.12
CherryGrapes, domesticGrapes, importedPear, imported
Fruits/China (P.R.) 19921990
0.002 0.0350.003
0.095 <0.001-0.0950.0007-0.006
Fruits/India 1990 (R)1990 (R)1990 (R)
0.0030.0040.004
max. 0.005max. 0.007max. 0.006
GuavaAppleGrape

DDT164
Commodity/Country Year Residues, mg/kg Remarks and {no. of samples}
Median Mean 90thpercentile
Range
Fruits/Spain 1990-19911990-1991
<0.001<0.0002
Basque countrySugars, Basque country
Fruits/USA 1991-1992 max. 0.01 Sugar beet
Meat/Australia 1990-1992 0.013 0.00016-0.083 wet wt., Meat and fat
Meat/Canada 1984-19891986-19881986-19881986-19881986-19881986-19881985-1987
0.140.0300.0080.0550.0290.024
0.10-0.17max. 0.41
0.008max. 0.15max. 0.20max. 0.08
0.00025-0.0038
Pig meat (fat), domesticDDE, Beef (fat)DDE, Goat (fat)DDE, Rabbit (fat)DDE, Lamb, Mutton (fat)DDE, Pork (fat)highest in Pork
Meat/China (P.R.) 19921990
0.095 0.161.2
0.48 <0.001-0.60.12-4.1
DDT, Meat, uncookedMeats, fat
Meat/Cuba 1985-1988 0.43 Pork fat, Havana
Meat/Denmark 1986-19911986-1991
0.040.04
0.02-0.090.02-0.10
Cattle meat (fat), domesticPig meat (fat), domestic
Meat/Egypt 1993 (R)1993 (R)1993 (R)1993 (R)1993 (R)
1993 (R)1993 (R)1993 (R)1993 (R)1993 (R)1993 (R)
1-51-74
0
49.6
41-75
Beef carcases, CairoBeef carcase muscle, CairoBeef carcase fat, CairoBuffalo carcases, CairoBuffalo carcase muscle, CairoBuffalo carcase fat, CairoBuffalo carcase liver, CairoMutton carcases, CairoMutton carcases muscle, CairoMutton carcase fat, CairoMutton carcase liver, Cairo
Meat/India 1989 0.5 0.00065-4.1 wet wt., (fat)
Meat/Japan 1992-19931992-19931992-1993
0.0160.00860.075
Beef fatPork fatSausage fat
Meat/Mexico 1995 (R) 0.14 Bovine kidney fat, Vera Cruz
Meat/Netherlands 1990-19921990-19921990-19921990-19921990-1992
0.11-0.500.11-0.500.01-0.050.01-0.050.01-0.10
Calf (fat), domesticPig (fat), domesticSheep (fat), domesticGoat (fat), domesticHorse (fat), domestic
Meat/New Zealand 1990-19911990-1991
<0.03<0.03
<0.03<0.03
Beef (fresh) {48}Meat products {48}p,p′- DDT, o,p′-DDT
Meat/Poland 1990-19931990-19931990-19931990-19931990-19931990-19931990-19931990-19931991 (R)1991 (R)
1987-19881987-1988
1987-19881986-19891986-19891986-19891986-1989
19861986
0.870.730.260.280.120.140.120.14
0.180.0630.0480.0490.100.032
0.00034-0.00180.022-0.120.045-0.0840.079-0.14
0.40-0.44
p,p′-DDE, Wild boarDDT, Wild boarp,p′-DDE, Roe-deerDDT, Roe-deerp,p′-DDE, StagDDT, Stagp,p′-DDE, ElkDDT, ElkMuscle, HorseFat, HorseFat, RuminantsFat, Rabbits, Swine, Turkeys,GeeseFat, Duck, Wild boarFat, Wild boarFat, Roe-deerFat, StagFat, ElkFat, PigLiver, Pig

DDT 165
Commodity/Country Year Residues, mg/kg Remarks and {no. of samples}
Median Mean 90thpercentile
Range
19861984-1985
1984-1985
1980-19831980-19831980-19831980-1983
0.0065
0.230.0570.045
0.0071
0.18-0.32
0.006-0.009
Meat, PigFat, Wild boar, Roe-deer, ReddeerBrain, Wild boar, Roe-deer,Red deerFat,Wild boarFat, Roe-deerFat, StagFat, Elk
Meat/Former Soviet Union 1991 (R)1991 (R)
2.02.0
o,p′-DDT, Porkp,p′-DDT, Pork
Meat/Spain 1994 (R)1990-19911990-19911995 (R)1995 (R)1995 (R)1995 (R)
1995 (R)
25<0.003<0.005
0.0063
0.0070.016
0.0066
0.0077
max. 91
<0.005-0.007(2)
0.004-0.016
0.004-0.0150.009-0.030.004-0.013
0.004-0.013
LambMeat, Basque countryMeat products, Basque countryDDE, Pork, Cured sausage(fat)DDE, Pork, Cured ham (fat)DDE, Pork, Bologna (fat)DDE, Fresh sausage with beefand pork (fat)DDE, Fresh beef sausage (fat)
Meat/USA 1991-1992199219921991
1991
max. 0.50max. 0.19max. 0.44max. 1.1
max. 0.27
Cattle (fat), importedPig (fat), importedSheep (fat), importedSheep, lamb, goat (fat),importedPig (fat), imported
Meat/Vietnam 1990-19911990-1991
0.00130.048
0.061-0.180.01-0.086
Wet wt., FatWet wt., Meat
Edible Oils/Australia 1990-1992 0.0021 0.00036-0.0053 Wet wt.
Edible Oils/China (P.R.) 1992 0.022 0.035 0.095 <0.007-0.095
Edible Oils/India 1990 (R)1990 (R)1990 (R)1990 (R)
1989
0.592.41.5
0.210.021
max. 0.73max. 7.5max. 2.2
max. 0.650.0018-0.057
VegetableMustardGroundnutSesameWet wt.
Edible Oils/Spain 1990-1991 <0.01 Fats and oils, Basque country
Edible Oils/Vietnam 1990-1991 0.067 Wet wt.
Pulses/Australia 1990-1992 0.0024 0.00002-0.0086 Wet wt.
Pulses/India 1990 (R)1990 (R)1990 (R)1990 (R)1990 (R)
1989
0.0220.0160.0230.0630.0390.02
max. 0.051max. 0.057max. 0.086max. 0.16max. 0.12
0.0011-0.04
ArharMoongGramLentilBlack GramWet wt.
Pulses, Nuts/Spain 1990-1991 <0.001 Basque country
Pulses/Vietnam 1990-1991 0.0019 0.00034-0.003 Wet wt.
Vegetables/Australia 1990-1992 0.0033 0.00007-0.0089 Wet wt.
Vegetables/Canada 1984-19891984-19891984-19891984-19891984-1989
0.040.430.050.040.02
0.01-0.110.39-0.48
0.01-0.07
Carrots, domesticCarrots, importedPotatoes, domesticPotatoes, importedCucumbers, imported
Vegetables/China (P.R.) 1992199019901990
1994 (R)1992 (R)
0.019 0.0240.00210.00160.0009
0.38
0.095 <0.001-0.0950.0015-0.00280.0004-0.00330.0032-0.008
0.0012-0.11
Fresh vegetableLegumes and nutsPotatoesVegetablesVegetables (fatty food)Vegetables

DDT166
Commodity/Country Year Residues, mg/kg Remarks and {no. of samples}
Median Mean 90thpercentile
Range
Vegetables/Egypt 1990 (R) 0.002 max. 0.005 Spinach
Vegetables/Spain 1990-1991 <0.001 Basque country
Vegetables/USA 1991-19921991-19921991-1992
max. 0.17max. 0.13max. 0.03
Carrots, domesticCarrots, importedTomatoes, imported
Dairy/Argentina 1994 0.00096 Butter, Santa Fe, Rosario
Dairy/Australia 1990-1992 0.0059 0.0016-0.018 Wet wt., Dairy products
Dairy/Brazil 1989-1991 0.020 0.025 0.05 <0.01-0.14 Cow whole Milk, Sao Paulo {184}
Dairy/Bulgaria 1993 <1.0 max. 1.8 Ewe Milk-cheese (one sample)
Dairy/Canada 19861984-19891984-19891984-1989
0.00064
0.030.04
0.02-0.10.01-0.060.01-0.11
Cow milk (fat basis)Butter, domesticCheese, domesticCheese, imported
Dairy/China (P.R.) 19921990
0.025 0.0330.0028
0.095 <0.008-0.0950.0005-0.0063
Whole fluid Milk (uncooked)Milk
Dairy/Cuba 1985-19881985-19881985-1988
0.00490.0240.030
Butter, HavanaWhole product, Milk, HavanaWhole product,Cheese, Havana
Dairy/Denmark 1986-19911986-19911986-19911986-1991
0.020.030.040.03
0.02-0.030.02-0.050.02-0.040.03-0.03
Butter, domesticCheese, domesticCheese, importedButter, imported
Dairy/Finland 1994 (R)1994 (R)1994 (R)1994 (R)
ND0.000680.000540.00014
0.0002-0.00070.0002-0.0012
0.0002-0.00076
Wet wt., Milkp,p′-TDE, domestic Cheesep,p′-DDE, imported Cheesep,p′-TDE, imported Cheese
Dairy/Greece 1992-1993 0.10 Northern Greece
Dairy/India 1994 (R)1993 (R)1993 (R)1993 (R)1993 (R)1993 (R)1993 (R)
19931992 (R)1992 (R)1990 (R)1990 (R)1990 (R)
19891989
1988 (R)
0.63
0.220.190.340.380.190.006
0.0584.83.8
0.00141.4
0.78
0.042-0.38
0.0400.74
max. 0.22max. 9.8max. 6.00.17-5.20.78-3.0
Milk (fat)Milk, DelhiBuffalo MilkMilk, condensedCheeseCreamCurdCow milkBovine milk, HaryanaBaby milk, HaryanaMilkButterDeshi gheeWet wt.Wet wt.Cheese, Punjab
Dairy/Israel 1986 0.0032 Cow milk
Dairy/Japan 19941994
1992-19931992-19931992-1993
19931993199219921991
1991
1990
<0.02<0.025
<0.02<0.020.0130.0120.013
0.019
0.013
<0.02<0.0250.00260.00230.00021<0.02<0.020.0140.0150.022
0.032
0.057<0.025
0.0290.0280.0230.0260.054
0.058
0.017
<0.02-0.076<0.025
<0.02-0.059<0.02-0.081<0.01-0.074<0.01-0.056<0.01-0.17
<0.01-0.11
<0.01-0.053
Milk, cow's, pasteurized wholefluidMilk, cow's, raw whole fluidIce creamProcessed CheeseCow milkMilk, cow's, raw whole fluidMilk, cow's, pasteurized wholefluidMilk, cow's, pasteurized wholefluidMilk, cow's, raw whole fluidMilk, cow's, pasteurized wholefluid
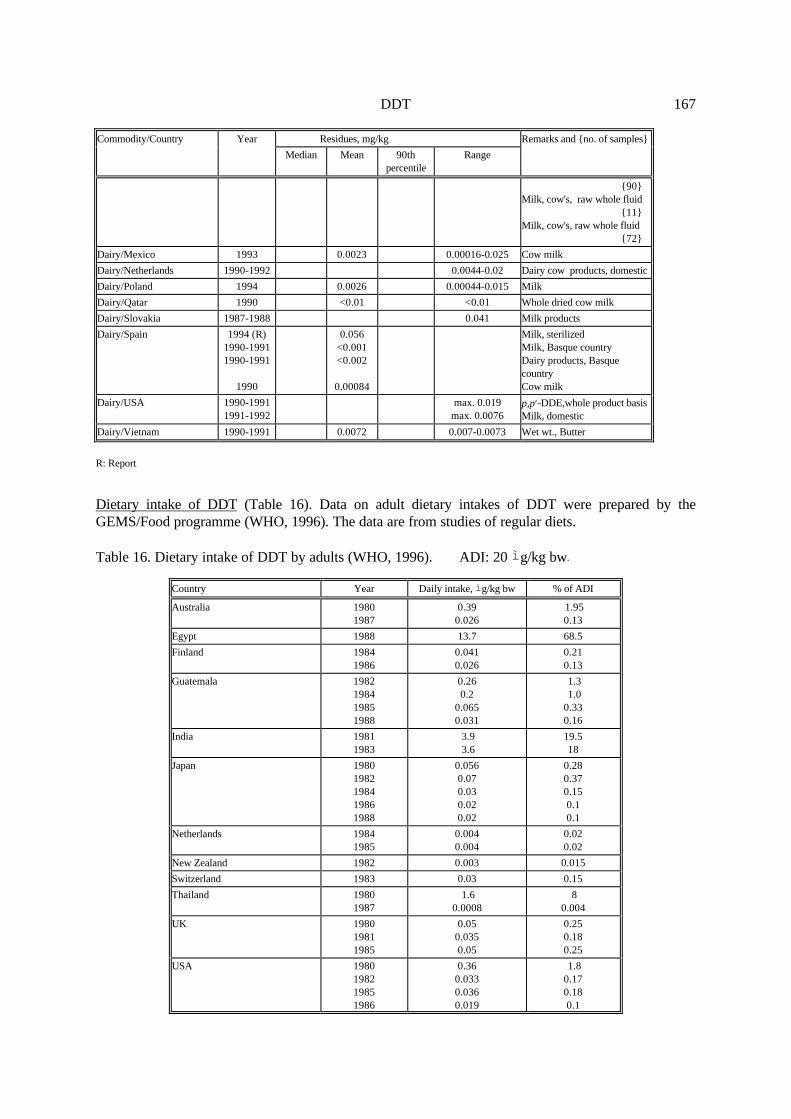
DDT 167
Commodity/Country Year Residues, mg/kg Remarks and {no. of samples}
Median Mean 90thpercentile
Range
{90}Milk, cow's, raw whole fluid {11}Milk, cow's, raw whole fluid {72}
Dairy/Mexico 1993 0.0023 0.00016-0.025 Cow milk
Dairy/Netherlands 1990-1992 0.0044-0.02 Dairy cow products, domestic
Dairy/Poland 1994 0.0026 0.00044-0.015 Milk
Dairy/Qatar 1990 <0.01 <0.01 Whole dried cow milk
Dairy/Slovakia 1987-1988 0.041 Milk products
Dairy/Spain 1994 (R)1990-19911990-1991
1990
0.056<0.001<0.002
0.00084
Milk, sterilizedMilk, Basque countryDairy products, BasquecountryCow milk
Dairy/USA 1990-19911991-1992
max. 0.019max. 0.0076
p,p′-DDE,whole product basisMilk, domestic
Dairy/Vietnam 1990-1991 0.0072 0.007-0.0073 Wet wt., Butter
R: Report
Dietary intake of DDT (Table 16). Data on adult dietary intakes of DDT were prepared by theGEMS/Food programme (WHO, 1996). The data are from studies of regular diets.
Table 16. Dietary intake of DDT by adults (WHO, 1996). ADI: 20 ì g/kg bw.
Country Year Daily intake, ì g/kg bw % of ADI
Australia 19801987
0.390.026
1.950.13
Egypt 1988 13.7 68.5
Finland 19841986
0.0410.026
0.210.13
Guatemala 1982198419851988
0.260.2
0.0650.031
1.3 1.00.330.16
India 19811983
3.9 3.6
19.518
Japan 19801982198419861988
0.0560.070.030.020.02
0.280.370.150.10.1
Netherlands 19841985
0.0040.004
0.020.02
New Zealand 1982 0.003 0.015
Switzerland 1983 0.03 0.15
Thailand 19801987
1.60.0008
80.004
UK 198019811985
0.050.0350.05
0.250.180.25
USA 1980198219851986
0.360.0330.0360.019
1.80.170.180.1
DDT168
Country Year Daily intake, ì g/kg bw % of ADI
1988 0.025 0.13
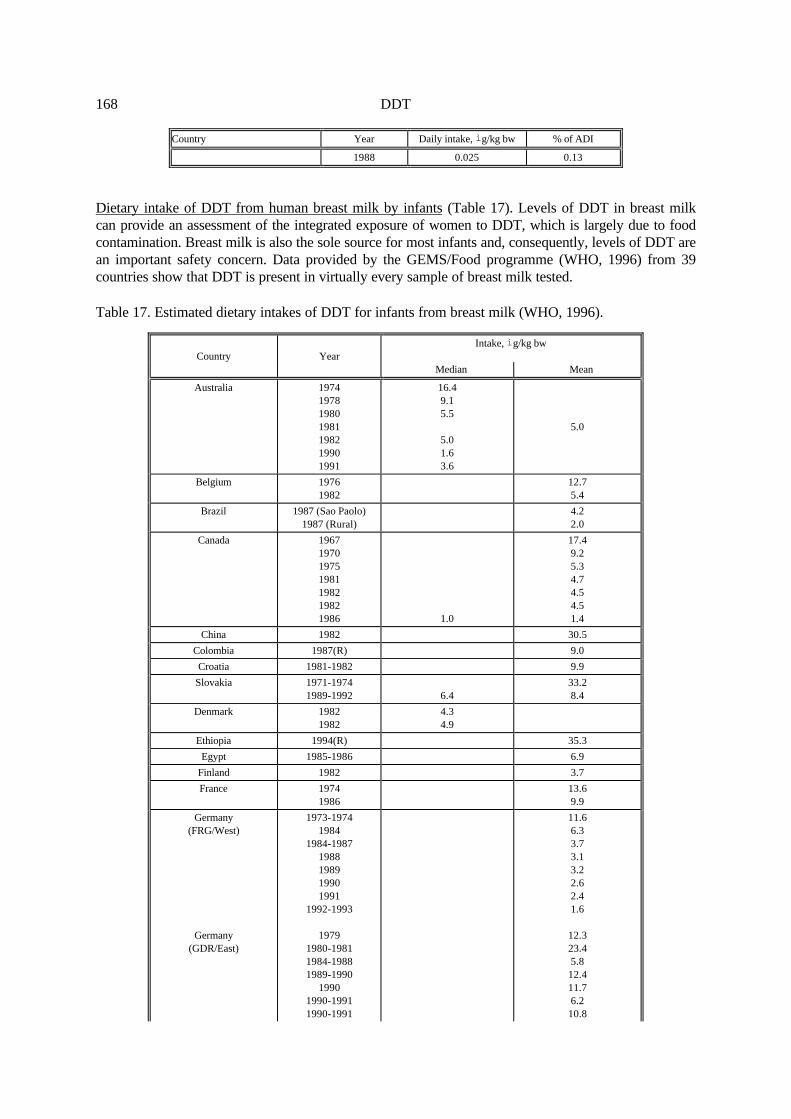
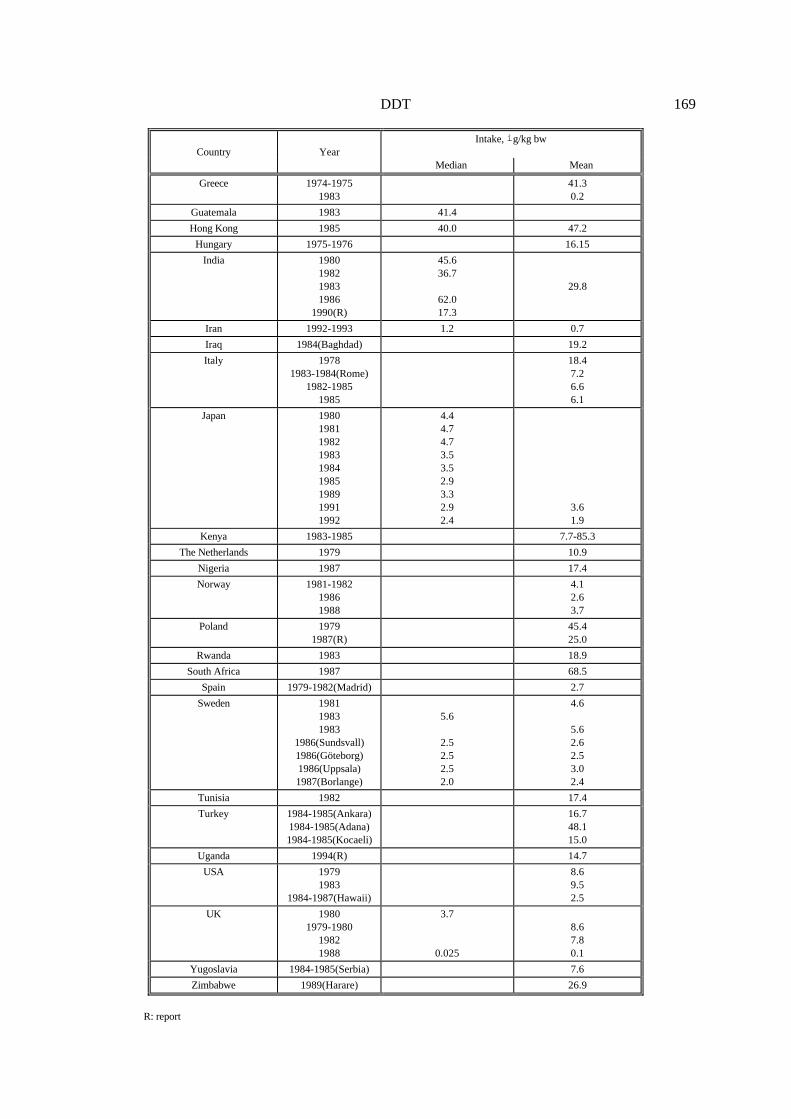
Dietary intake of DDT from human breast milk by infants (Table 17). Levels of DDT in breast milkcan provide an assessment of the integrated exposure of women to DDT, which is largely due to foodcontamination. Breast milk is also the sole source for most infants and, consequently, levels of DDT arean important safety concern. Data provided by the GEMS/Food programme (WHO, 1996) from 39countries show that DDT is present in virtually every sample of breast milk tested.
Table 17. Estimated dietary intakes of DDT for infants from breast milk (WHO, 1996).
Country YearIntake, ì g/kg bw
Median Mean
Australia 1974197819801981198219901991
16.49.15.5
5.01.63.6
5.0
Belgium 19761982
12.75.4
Brazil 1987 (Sao Paolo)1987 (Rural)
4.22.0
Canada 1967197019751981198219821986 1.0
17.49.25.34.74.54.51.4
China 1982 30.5
Colombia 1987(R) 9.0
Croatia 1981-1982 9.9
Slovakia 1971-19741989-1992 6.4
33.28.4
Denmark 19821982
4.34.9
Ethiopia 1994(R) 35.3
Egypt 1985-1986 6.9
Finland 1982 3.7
France 19741986
13.69.9
Germany(FRG/West)
Germany(GDR/East)
1973-19741984
1984-19871988198919901991
1992-1993
19791980-19811984-19881989-1990
19901990-19911990-1991
11.66.33.73.13.22.62.41.6
12.323.45.812.411.76.210.8
DDT 169
Country YearIntake, ì g/kg bw
Median Mean
Greece 1974-19751983
41.30.2
Guatemala 1983 41.4
Hong Kong 1985 40.0 47.2
Hungary 1975-1976 16.15
India 1980198219831986
1990(R)
45.636.7
62.017.3
29.8
Iran 1992-1993 1.2 0.7
Iraq 1984(Baghdad) 19.2
Italy 19781983-1984(Rome)
1982-19851985
18.47.26.66.1
Japan 198019811982198319841985198919911992
4.44.74.73.53.52.93.32.92.4
3.61.9
Kenya 1983-1985 7.7-85.3
The Netherlands 1979 10.9
Nigeria 1987 17.4
Norway 1981-198219861988
4.12.63.7
Poland 19791987(R)
45.425.0
Rwanda 1983 18.9
South Africa 1987 68.5
Spain 1979-1982(Madrid) 2.7
Sweden 198119831983
1986(Sundsvall)1986(Göteborg)1986(Uppsala)1987(Borlange)
5.6
2.52.52.52.0
4.6
5.62.62.53.02.4
Tunisia 1982 17.4
Turkey 1984-1985(Ankara)1984-1985(Adana)1984-1985(Kocaeli)
16.748.115.0
Uganda 1994(R) 14.7
USA 19791983
1984-1987(Hawaii)
8.69.52.5
UK 19801979-1980
19821988
3.7
0.025
8.67.80.1
Yugoslavia 1984-1985(Serbia) 7.6
Zimbabwe 1989(Harare) 26.9
R: report

DDT170
NATIONAL MAXIMUM RESIDUE LIMITS
The Meeting was informed of the following national MRLs (next page) for DDT in animal products.
Definition of the residue: sum of p,p′-DDT, o,p′-DDT, p,p′-DDE and p,p′-TDE (p,p′-DDD).
Country Commodity MRL, mg/kg
Australia Meat (fat) 5
European Union Meat1,2
Milk3
Eggs4
10.040.1
Norway Young bovine animal (fat)Pig (fat)Sheep (fat)Lamb (fat)Hen (fat)Reindeer (fat)Moose (fat)
1111111
Poland Meat and meat products (fat)Milk and milk productsEggs
1 0.04 0.1
1 In fat2 The maximum level of the residues in meat and meat products are expressed on the basis of fat. In the case of foodstuffswith a fat content of 10% or less by weight, the residue is related to the total weight of the boned foodstuff. In such cases,the maximum level is one-tenth of the value related to the fat content, but must be no less than 0.01 mg/kg.3 In determining the residues in raw cow’s milk and whole cream cow’s milk, a fat content of 4% by weight should betaken as a basis. For raw milk and whole cream milk of other animal origin the residues are expressed on the basis of thefat. For other foodstuffs - with a fat content of less than 2% by weight, the maximum level is taken as half that set for raw milk and whole creammilk, - with a fat content of 2% or more by weight, the maximum level is expressed in mg/kg of fat. In such cases, themaximum level is 25 times that set for raw milk and whole cream milk4 For eggs and egg products with a fat content higher than 10% the maximum level is expressed in mg/kg fat. In such casesthe maximum level is 10 times the maximum level for fresh eggs
APPRAISAL
DDT was first evaluated in 1966 and has been reviewed several times since. The JMPR in 1993 and1994 proposed Extraneous Residue Limits (ERLs) for carrots, eggs, meat and milks and confirmed theprevious temporary ERL proposed for cereal grains. The 1995 CCPR was informed that additionaldata on meat were available from Australia, New Zealand and the USA and decided to keep theproposal for meat (1 mg/kg) at Step 3 pending the evaluation of these data by the 1996 JMPR. The28th (1996) Session of the CCPR advanced all ERLs except that for meat to Step 8. The existing CXLfor meat, 5 mg/kg (fat), was converted to a temporary limit in 1993.
No information was supplied by governments on registered or recommended uses of DDT oncrops or animals. Some countries allow its limited use for public health applications.
The Meeting received national residue survey data on DDT in meat from Australia, Germany,
DDT 171
New Zealand, Norway, Thailand, the UK and the USA.
The British annual report on residue monitoring for 1994, further data on dairy products fromNew Zealand and on commodities of plant origin from Norway and Spain were also provided.Information on residues and dietary intakes of DDT was made available by Global EnvironmentMonitoring System - Food Contamination Monitoring and Assessment Programme (GEMS/Food) ofWHO. Because no request was made for these data by the CCPR however, the Meeting could notconclude that a complete database was available to support re-evaluations of ERLs for commoditiesother than meat and proposed to postpone such evaluations to a later periodic review.
Definition of the residue: Sum of p,p′-DDT, o,p′-DDT, p,p′-DDE and p,p′-TDE (p,p′-DDD).
The residue is fat-soluble.
Meat. Residues of DDT and its metabolites in most of the many samples analysed were at very lowlevels, but in some samples of meat fat were higher than the proposed ERL of 1 mg/kg.From Australia, results of 91,747 analyses of meat fat were available from 1989-1994, and 51 samples(0.06% of the total) of which 29 were beef, 1 deer, 1 horse, 13 sheep and 7 pork, contained residuesabove 1 mg/kg. In 3 samples the residues were higher than 5 mg/kg.
In Germany, 1653 samples of fat of meat were analysed in 1993. Only 1 sample of sheep fatand 2 samples of bacon (0.2% of the total number) contained residues in the ranges 1.1-2 and 2.1-5mg/kg respectively.
Analyses of 1568 and 28,640 meat fat samples were available from Norway (1990-1994) andThailand (1993-1994) respectively. All residues were lower than 1 mg/kg.
In the USA, 31 (0.08%) of 38,420 meat fat samples from 1991-1994 contained residues higherthan 1 mg/kg (4 samples with residues above 5 mg/kg).
In UK monitoring in 1994 74 samples of lamb fat were analysed and none contained residuesexceeding 1 mg/kg.
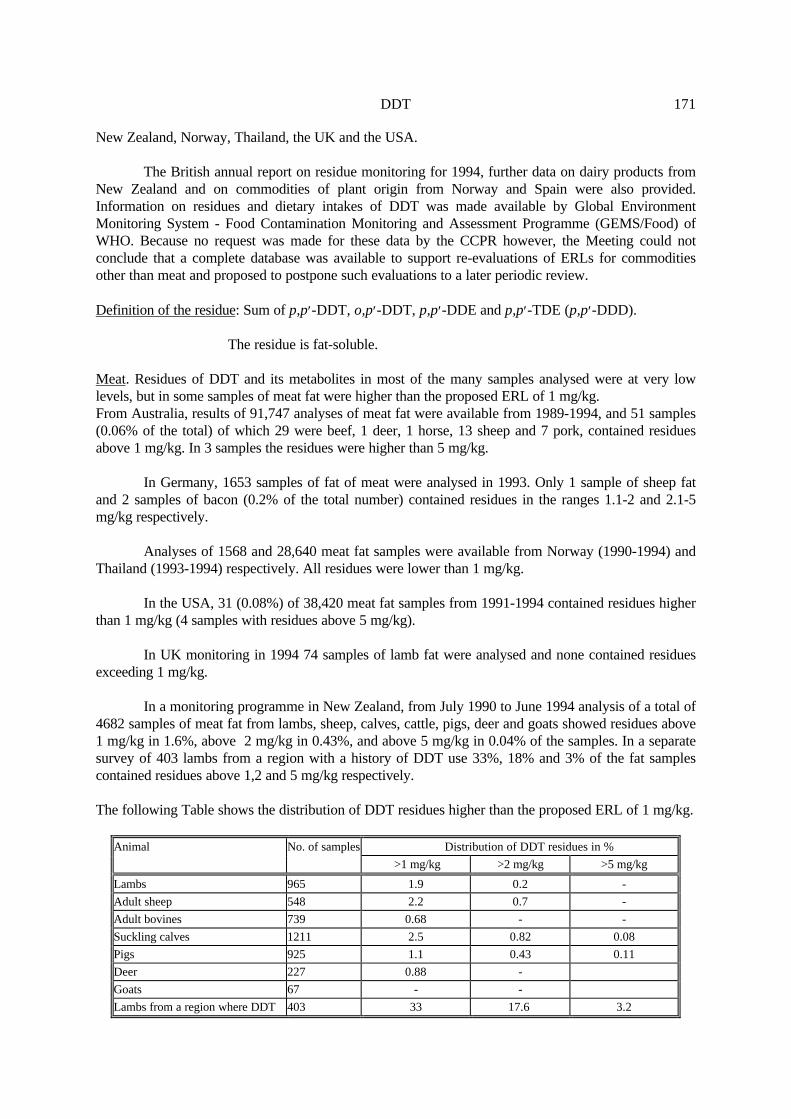
In a monitoring programme in New Zealand, from July 1990 to June 1994 analysis of a total of4682 samples of meat fat from lambs, sheep, calves, cattle, pigs, deer and goats showed residues above1 mg/kg in 1.6%, above 2 mg/kg in 0.43%, and above 5 mg/kg in 0.04% of the samples. In a separatesurvey of 403 lambs from a region with a history of DDT use 33%, 18% and 3% of the fat samplescontained residues above 1,2 and 5 mg/kg respectively.
The following Table shows the distribution of DDT residues higher than the proposed ERL of 1 mg/kg.
Animal No. of samples Distribution of DDT residues in %
>1 mg/kg >2 mg/kg >5 mg/kg
Lambs 965 1.9 0.2 -
Adult sheep 548 2.2 0.7 -
Adult bovines 739 0.68 - -
Suckling calves 1211 2.5 0.82 0.08
Pigs 925 1.1 0.43 0.11
Deer 227 0.88 -
Goats 67 - -
Lambs from a region where DDT 403 33 17.6 3.2

DDT172
Animal No. of samples Distribution of DDT residues in %
was historically used
In all, 162,102 samples of meat fat were analysed in Australia, Germany, Norway, Thailand,the UK and the USA, and residues above 1 mg/kg were found in 85 samples (0.05%). The samplesfrom New Zealand belonged to a different population. Excluding the lambs from the region with aknown DDT history, 1.6% of the 4682 samples analysed were higher than the proposed ERL of 1mg/kg; 0.43% higher than 2 mg/kg and 0.04% higher than 5 mg/kg.
The GEMS/Food database for meat fat shows low levels of DDT residues in most countries,but maximum residues were found of 2 mg/kg in the former Soviet Union (1991), 4.1 mg/kg in China(1990), 7 mg/kg in Egypt (1993), 4.1 mg/kg in India (1989) and 91 mg/kg in Spain (1994). Thesefigures are insufficient to support a revision of the proposed ERL, because some relevant information(e.g. number of samples analysed, explanation of extreme values) is not given.
RECOMMENDATIONS
On the basis of the residue data received from the government of New Zealand, the Meeting concludedthat the ERL of 1 mg/kg for DDT in meat (fat) recommended by the 1993 JMPR should be increased to5 mg/kg, thus confirming the existing temporary CXL.
Definition of the residue for compliance with MRLs and for estimation of dietary intake:
Sum of p,p′-DDT, o,p′-DDT, p,p′-DDE and p,p′-TDE (p,p′-DDD).
The residue is fat soluble.
Commodity Recommended ERL, mg/kg
CCN Name New Previous
MM 0095 Meat 5 (fat) 1 (fat)
REFERENCES

DDT 173
Anon. 1994. Submission to JMPR on the proposedchanges to the ERL for DDT. Information onmonitoring DDT residue data for meat by the Ministryof Agriculture, New Zealand, 1994. Unpublished.
Anon. 1995a. Information on national residue surveyDDT residue data for the 1996 JMPR byCommonwealth Department of Primary Industries andEnergy, Australia, March 21, 1995. Unpublished.
Anon. 1995b. Information on national residue surveyDDT residue data for the 1996 JMPR by theBundesministerium für Gesundheit, Germany, July 18,1995. Unpublished.
Anon. 1995c. Information on national residue surveyDDT residue data for the 1996 JMPR by Thailand,1995. Unpublished.
Anon. 1995d. Information on national residue surveyDDT residue data for the 1996 JMPR by the USAEnvironmental Protection Agency, Washington D.C.,USA, February 3, 1995. Unpublished.
Anon. 1995e. Information of The Netherlands onpesticides to be considered by the JMPR 1996,Ministerie van Volksgezondheid, Welzijn en Sport,Rijswijk, The Netherlands, December 1995.Unpublished.
Anon. 1995f. Information on national MRLs ofpesticides on the agenda of 1996 JMPR by Poland,1995. Unpublished.
Anon. 1995g. Annual report of the working party onpesticide residues: 1994. Ministry of Agriculture,Fisheries and Food, Health and Safety Executive, UK.Supplement to the Pesticides Register 1995, LondonHMSO.
Anon. 1996. Information on national residue surveyDDT residue data for the 1996 JMPR by NorwegianFood Control Authority, Norway, March 27, and April30, 1996. Unpublished.
EEC, 1986. Council Directive of 24 July 1986 on thefixing of maximum levels for pesticide residues in andon foodstuffs of animal origin (86/363/EEC).
EEC, 1993. Richtlinie des Rates von 29. Juni 1993 zurÄnderung der Anhänge der Richtlinien 86/362/EWGund 86/363/EWG über die Festsetzung vonHöchstgehalten an Rückstaänden vonSchädlingsbekämpfungsmitteln auf und in Getreidesowie Lebensmitteln tierischen Ursprungs. Abl. L211von 23.08.1993.
IPCS, 1996. Results of an Informal IPCS Survey onPersistent Organic Pollutants. IFCS Expert Meeting onPOPs, 17-19 June 1996, Manila, Philippines. Prepared
by WHO. Unpublished.
Jowett, J. and Viggers, E., 1995. Information onnational residue survey DDT residue data for the 1996JMPR by New Zealand. Dairy pesticide residuesreport; MAF applied statistics group, January 1995.Unpublished.
Moy, G. 1996a. DDT residues in foodstuffs fromvarious nations. GEMS/Food database. Letter by DrGerald Moy, GEMS/Food Coordinator of WHO,Geneva, 12 July 1996. Unpublished.
Moy, G. 1996b. Summary of data on residues of DDTcomplex, o,p′-DDT and p,p′-DDT. GEMS/Fooddatabase. Letter by Dr Gerald Moy, GEMS/FoodCoordinator of WHO, Geneva, 20 August 1996.Unpublished.
PAN, 1991. "Demise of the dirty dozen" chartbackground information and source material. Compiledby the Pesticide Action Network (PAN) North AmericaRegional Center, San Francisco, USA, 4/91.
WHO, 1996. IFCS Intergovernmental Forum onChemical Safety, Persistent Organic Pollutants. IFCSExpert Meeting on POPs, 17-19 June 1996, Manila,Philippines. Prepared by WHO. Unpublished.