Embed Size (px)
Citation preview

102
RLFF
Regression Line Fractal Framework


111
Daily Squeeze

112
Market Beliefs

113
What’s the nature of the market?DescriptionDynamic?ProcessStrategyProcessValue
Simple RandomChaoticComplexComplicated
Closed, linearStatic
InstinctTrainingAnalysis
Speed, precision
Closed, linearStatic
RationalEngineering
AnalysisControl
(Closed), networkDynamicSystemsAdaptiveModelingLearning
Open, (network)DynamicMorphing
MetaphoricalBalance
Sense-making
ProbabilisticUncertainStatisticalAnalyticalCalibrationDiscipline
• Different situations need different responses, strategies, approaches
• Boundaries, indicators, volatility?• What about the market?

114
Performance Math
Market
Sector
Stock
50%
25%
25%

Statistics
115

116
Traffic lighting with statistics
Average
+1 St Dev
-1 StDev
AdaptiveTime period mattersCurrent stateChanging stateTime series

117
Extremes
1/6 1/6worst best
2/3normal

118
Getting on the bandwagon
InnovatorsEarly adoptersEarly mass adoptersLate mass adopters“Grumpy old men”
12
43
5 12
4
3
5
0%
100%
50%

GYR
119

Example of Green & Yellow Zone
120
Mechanical entry for the swing trade
Profit target for the swing trade
Standard frame
Initial stop for the swing tradeYellow zone
Red zone
When the swing trade pattern fired
Green zoneI want to be long in the swing trade position
I can try to front run a green zone trade if I can see to the one inside yesterdays range
I am out of the swing trade or I am going short, because it’s failing

121
Green Zone Trading: mechanical trading once Price moves above yesterday’s range
•Use scans & systems to find high probability/high payoff swing trade candidates•Any of the Tortoise swing trade systems, patterns, preferences•Frame the trades that meet 2:1 reward:risk ratios on a re-test of the 10day High•Enter the trades when price > yesterday’s high +.05•Initial risk: .05 below yesterday’s low (or 1x ATR if you prefer)•Once in the trade, use a trailing stop of the initial risk or adjust to .05 below yesterday’s low
Think of the Green Zone as the Core position with overnight/Swing trade levels of risk
Green zone & Yellow zone trading

Green zone & Yellow zone trading
122
Yellow Zone Trading: intraday opportunity trading on a mechanical trade, with tactical momentum
•Start with any Green Zone trade frame that gives 2:1•Look for opportunities when you can see 2:1 reward:risk, using the mechanical entry as your profit target•Tighten up your stop and prepare to take profits if it stalls near the mechanical entry•Consider adding another position at the mechanical entry, or simply accept the current trade as your mechanical Green Zone trade, but with an improved entry, and let it become your swing trade•If you have a successful Yellow Zone trade AND a Green Zone trade, take the Yellow Zone trade off before the close, so you only carry the swing trade risk overnight, then seek to get back in the following day with another Yellow Zone tradeThink of the Yellow Zone as the “Turbo” position with intraday trade levels of risk

Mastermind Insights
123

Supertrader Summit Insights
124
•Chatroom Mastermind effect•Feed the bulldog every day•Where do beliefs come from?•Connectivism & The Market Mosaic•Trader Quality Number•Your system is what you do•Double loop learning & learning styles, auditory learning•“That coal won’t shovel itself”•Tell the Universe•All your preparation is for…•Phase transitions and critical states•Zeno stop•Trade framing•Snapping turtle & hybrid frog•551w•“.25R improvement on every trade”•Zero state•Ready - Fire - Aim•You are ALWAYS trading

Live Trading Prep

Example of Green & Yellow Zone
126
Mechanical entry for the swing trade
Profit target for the swing trade
Standard frame
Initial stop for the swing tradeYellow zone
Red zone
When the swing trade pattern fired
Green zoneI want to be long in the swing trade position
I can try to front run a green zone trade if I can see to the one inside yesterdays range
I am out of the swing trade or I am going short, because it’s failing
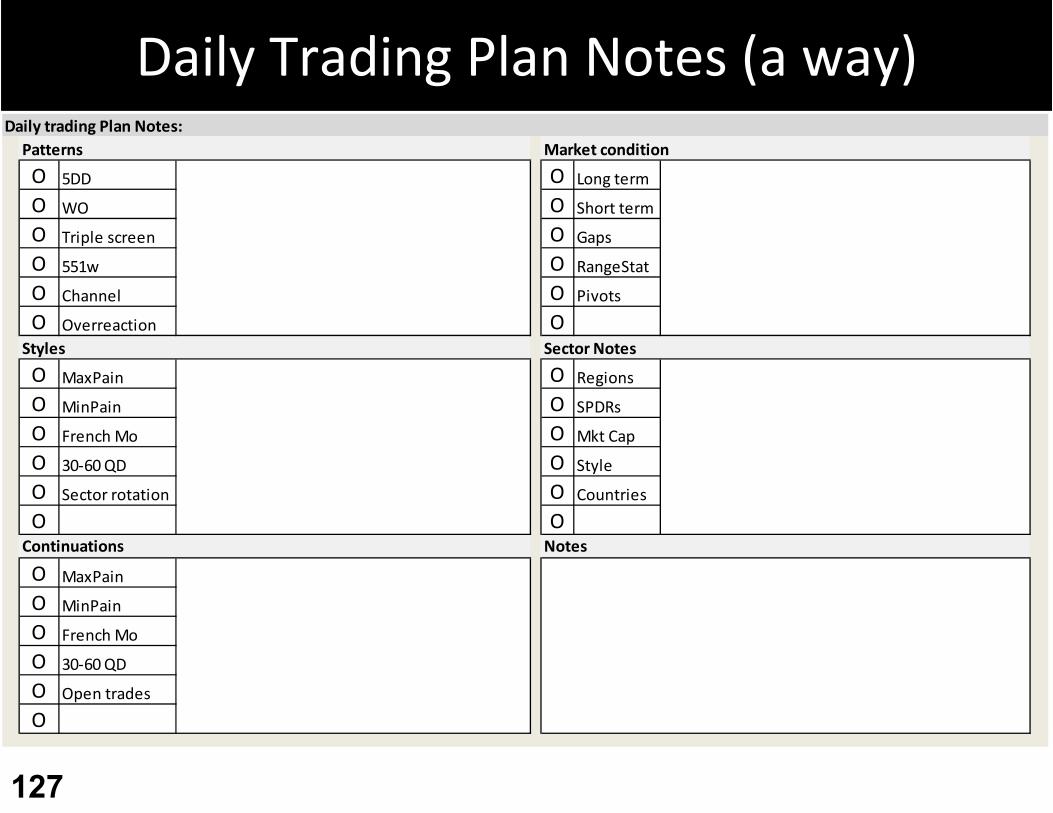
Daily Trading Plan Notes (a way)
127
O 5DD O Long term
O WO O Short term
O Triple screen O Gaps
O 551w O RangeStat
O Channel O Pivots
O Overreaction O
O MaxPain O Regions
O MinPain O SPDRs
O French Mo O Mkt Cap
O 30‐60 QD O Style
O Sector rotation O Countries
O O
O MaxPain
O MinPain
O French Mo
O 30‐60 QD
O Open trades
O
Daily trading Plan Notes:
Sector Notes
Market condition
Notes
Styles
Continuations
Patterns

Daily: Plan‐Prepare‐Execute
128

129
Max(ever)
Min(ever)
Min(future)
Max(future)
Max(x)
Min(x)
Avg(x)
Avg+1SD(x)
Avg-1SD(x)
SD
SD
30 days of dataCalculate daily RangesCalculate statistics:
•Max•Min•Avg•SD•Avg +1SD•Avg -1SD
•Calculate•Rstat / SD
•Select targets
•Stalk entry•Wait 30 min
HOD
RangeStat
LOD
SD
SD

•130
SPY
EFA
QQQQ
MDY
XLE
EWZILF
EPP
MVVMZZ
UWM
QLD
IWM
QID
TWM
EEMEEV
FXP FXI
EFU IEV
XLB
XLF
XLI
SKF
SMN
BAC
AXP
JPM
VOT
HPQ
CSCO
MSFTAAPL
CLF
GLD
AA
SLV AGQ SLWZSL
GDX GDXJ
CVX
CAT
HD
EWM
XME
NFLX
DBADBC
WMTTLT
DVN

Logic chain
•131
i start with SPY to assess mkt conditions from the open and during the day
i compare the vertical column above and below for intraday relative strength comparisons of indices and sectors to SPY
if a sector looks very good or very bad i then go east and west to find an even better target for easy trading
to include looking all the way to the right for stocks outperforming their peers in an outperforming sector, going in the same up direcition as mkt
if mkt failing i find worst sector ETF and trade the double inverse "long“
the stocks and ETFs on there are often the result of swing trade patterns which are favorable for the next couple days so i have extra protection when trading them intraday

Technical Analysis
132
133
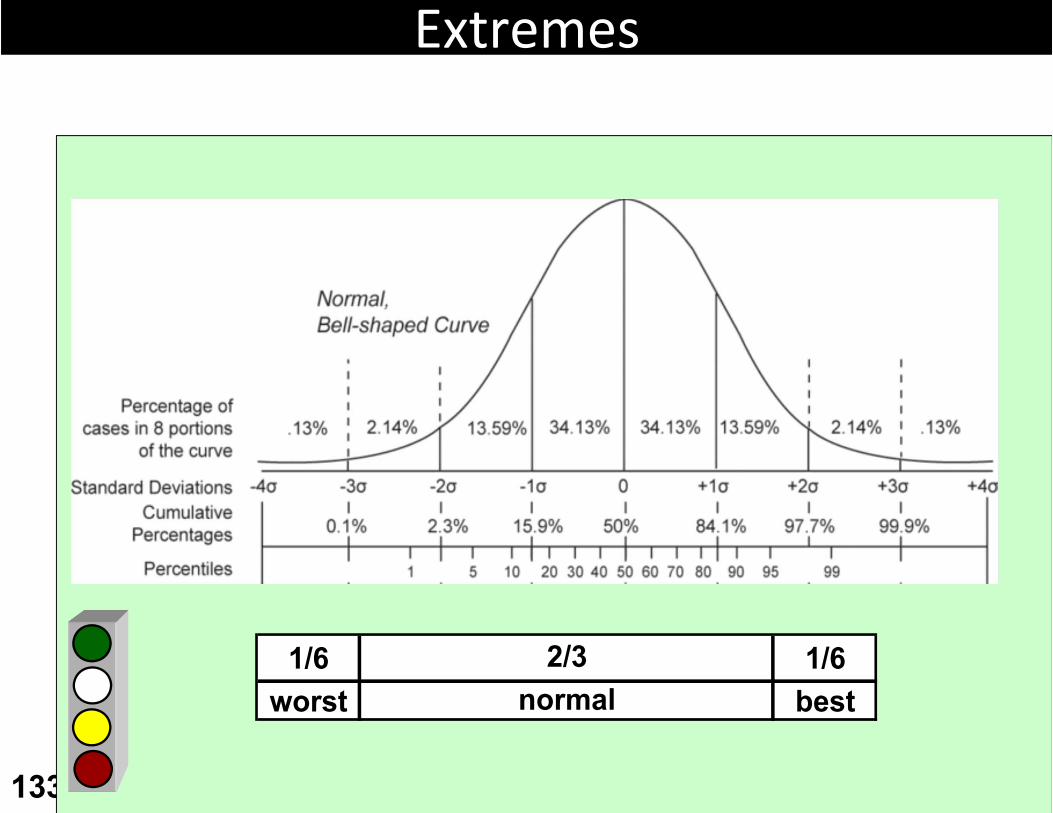
Extremes
1/6 1/6worst best
2/3normal

134
Traffic lighting with statistics
Average
+1 St Dev
-1 StDev
AdaptiveTime period mattersCurrent stateChanging stateTime series
135
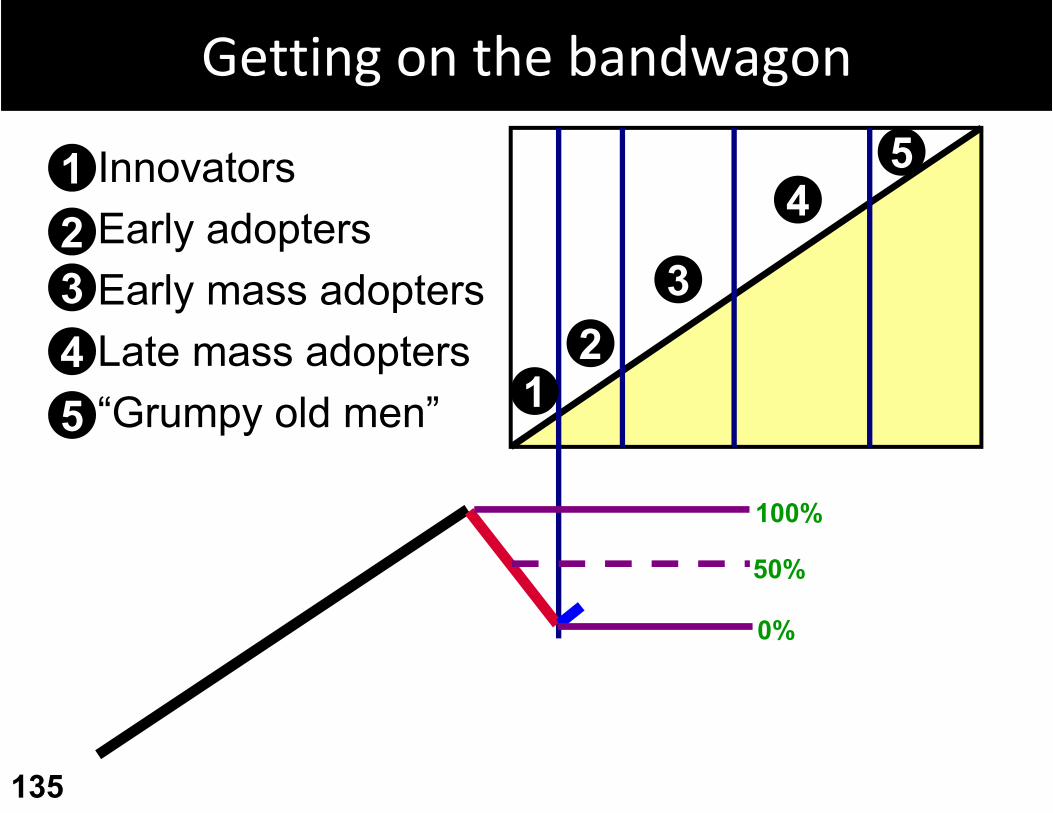
Getting on the bandwagon
InnovatorsEarly adoptersEarly mass adoptersLate mass adopters“Grumpy old men”
12
43
5 12
4
3
5
0%
100%
50%
136
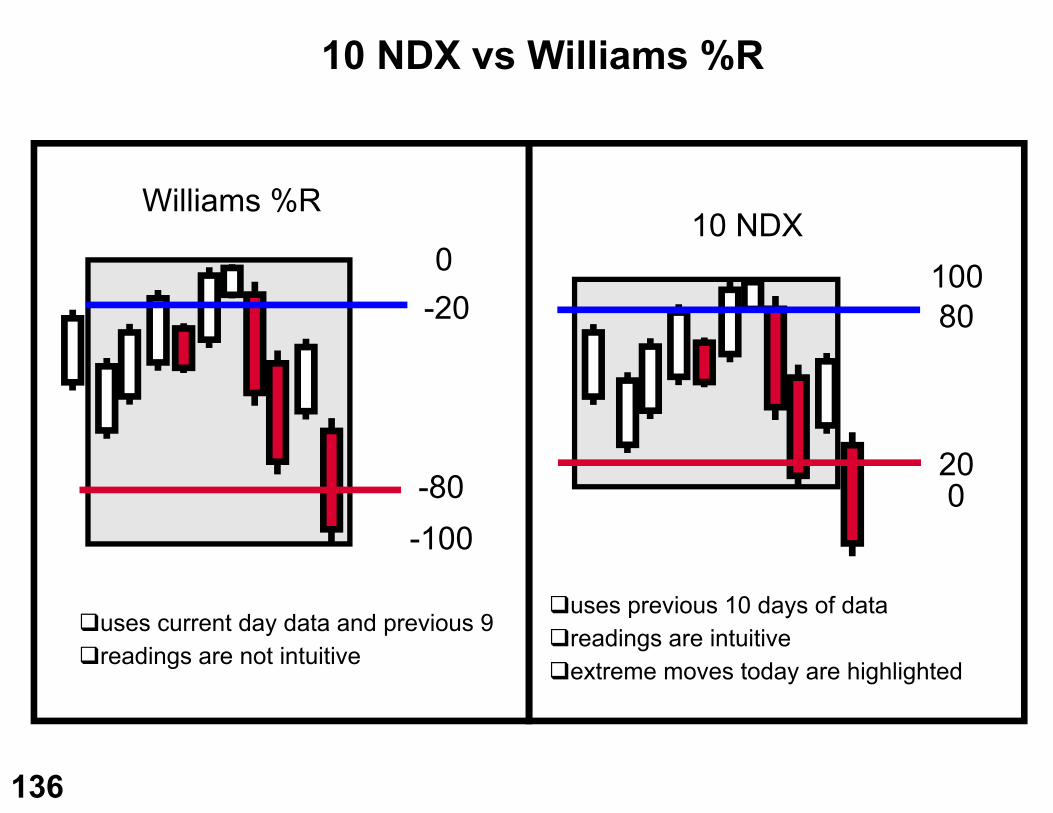
10 NDX vs Williams %R
Williams %R10 NDX
0-20
-80-100
10080
200
uses current day data and previous 9readings are not intuitive
uses previous 10 days of datareadings are intuitiveextreme moves today are highlighted

Gap Stat
137

Range Stat
138

139

140


Indicator (Parameter) Color Nickname NoteBB(30, 1) Blue RiverBB(30, 2) Light blue FloodplainBB(30, 3) Thick red line Z3 limitSMA (30) ThicK red line BbmeanBB(10, 0.5) Orange Dragon front runs turns in the riverBB (4, 0.25) Purple Baby dragon front runs the dragon, useful for profit taking stopsRL(10) Blue Traders Price Fast RL of the Fast pairRL(30) Black Health of the trend Slow RL of the Fast pairRL(90) Green Intermediate trend Fast RL of the Slow pairRL(270) Purple Long term fair value Slow RL of the slow pairVWAP Orange "Price magnet" Price used to settle up for brokers and clientsPSAR (0.2, 0.2) black dot accelerated trailing stop adjust parameters to reflect your stop "intuition"Volume at price left side Market profile identify key price levels for support andr resistance

![Ascensoresdetraccion[Compatibility Mode]](https://img.dokumen.tips/doc/110x75/5571fb0a497959916993c8ac/ascensoresdetraccioncompatibility-mode.jpg)
![Aknaxpur [compatibility mode]](https://img.dokumen.tips/doc/110x75/558b0b67d8b42afe758b4717/aknaxpur-compatibility-mode.jpg)
![Bioelektricitet [Compatibility Mode]](https://img.dokumen.tips/doc/110x75/5436c733219acd57088b465e/bioelektricitet-compatibility-mode.jpg)
![951_HARMONISASI [Compatibility Mode]](https://img.dokumen.tips/doc/110x75/5571fddf49795991699a2415/951harmonisasi-compatibility-mode.jpg)
![Springs [Compatibility Mode]](https://img.dokumen.tips/doc/110x75/541a4f157bef0ae4168b4637/springs-compatibility-mode.jpg)
![sISTEMOPERASI [Compatibility Mode]](https://img.dokumen.tips/doc/110x75/5571ff3249795991699ccfd9/sistemoperasi-compatibility-mode.jpg)
![Tangga [Compatibility Mode]](https://img.dokumen.tips/doc/110x75/5572131d497959fc0b91a230/tangga-compatibility-mode.jpg)
![Awire [Compatibility Mode]](https://img.dokumen.tips/doc/110x75/5535ead5550346640d8b4748/awire-compatibility-mode.jpg)
![Nahwu1 [Compatibility Mode]](https://img.dokumen.tips/doc/110x75/5571f93649795991698f0e97/nahwu1-compatibility-mode.jpg)
![Presentation [Compatibility Mode]](https://img.dokumen.tips/doc/110x75/551db5d04a795993108b47fa/presentation-compatibility-mode.jpg)
![Perancangan [Compatibility Mode]](https://img.dokumen.tips/doc/110x75/5571ffed49795991699e6d50/perancangan-compatibility-mode.jpg)
![Animals [compatibility mode]](https://img.dokumen.tips/doc/110x75/558863edd8b42a450e8b45ed/animals-compatibility-mode-55888a17ad280.jpg)
![302INII1 [Compatibility Mode])](https://img.dokumen.tips/doc/110x75/55721306497959fc0b916e6c/302inii1-compatibility-mode.jpg)
![EWS [Compatibility Mode]](https://img.dokumen.tips/doc/110x75/54673170af795974338b5529/ews-compatibility-mode.jpg)
![Perintang [compatibility mode]](https://img.dokumen.tips/doc/110x75/55841491d8b42a11168b521f/perintang-compatibility-mode.jpg)
![Ppt [compatibility mode]](https://img.dokumen.tips/doc/110x75/558c1f17d8b42ab1528b478a/ppt-compatibility-mode.jpg)
![Ppt_ch01 [Compatibility Mode]](https://img.dokumen.tips/doc/110x75/5532a389550346c6058b4669/pptch01-compatibility-mode.jpg)

![Isomers [compatibility mode]](https://img.dokumen.tips/doc/110x75/5590bc1e1a28abbf308b46da/isomers-compatibility-mode-5593e8f124020.jpg)
![Mitosis [compatibility mode]](https://img.dokumen.tips/doc/110x75/558d4aedd8b42aa9108b46e7/mitosis-compatibility-mode.jpg)
![KEMOTERAPI [Compatibility Mode]](https://img.dokumen.tips/doc/110x75/5571fd704979599169991974/kemoterapi-compatibility-mode.jpg)
![Generators [compatibility mode]](https://img.dokumen.tips/doc/110x75/55546f71b4c905a5798b53e2/generators-compatibility-mode.jpg)
![Astronomy [Compatibility Mode]](https://img.dokumen.tips/doc/110x75/558422bed8b42a785e8b460a/astronomy-compatibility-mode.jpg)
![Saklar... [Compatibility Mode]](https://img.dokumen.tips/doc/110x75/5571fd7049795991699918d7/saklar-compatibility-mode.jpg)
![Mitosis1 [compatibility mode]](https://img.dokumen.tips/doc/110x75/5566bd2cd8b42aac288b473e/mitosis1-compatibility-mode.jpg)
![Tolsom [Compatibility Mode]](https://img.dokumen.tips/doc/110x75/5462bba3af7959a4058b4b91/tolsom-compatibility-mode.jpg)
![โครงการอ่างเก็บน้ำมวกเหล็ก [Compatibility Mode]](https://img.dokumen.tips/doc/110x75/55720fde497959fc0b8c9f54/-compatibility-mode-55b9464b4bef6.jpg)
![12 [compatibility mode]](https://img.dokumen.tips/doc/110x75/54454664afaf9f14098b45ce/12-compatibility-mode.jpg)
![ASERTIVNOST [Compatibility Mode]](https://img.dokumen.tips/doc/110x75/5571ffa249795991699dbaf9/asertivnost-compatibility-mode.jpg)
![SOSIOMETRI [Compatibility Mode]](https://img.dokumen.tips/doc/110x75/5571f88849795991698da001/sosiometri-compatibility-mode.jpg)