Embed Size (px)
Citation preview

Daylighting and Electric Lighting Integration in the Retail Sector – A Case Study of the IKEA Kaarst Store
1
DAYLIGHTING AND ELECTRIC LIGHTING INTEGRATION IN THE RETAIL SECTOR A Case Study of the IKEA Kaarst Store
Rafael Campamà Pizarro
Master thesis in Energy-efficient and Environmental Buildings Faculty of Engineering | Lund University
Daylighting and Electric Lighting Integration in the Retail Sector – A Case Study of the IKEA Kaarst Store
2
Lund University
Lund University, with eight faculties and a number of research centres and specialized institutes, is the largest establishment for research and higher education in Scandinavia. The main part of the University is situated in the small city of Lund which has about 112,000 inhabitants. A number of departments for research and education are, however, located in Malmö. Lund University was founded in 1666 and has today a total staff of 6,000 employees and 47,000 students attending 280 degree programmes and 2,300 subject courses offered by 63 departments.
Master Programme in Energy-efficient and Environmental Building Design
This international programme provides knowledge, skills and competencies within the area of energy-efficient and environmental building design in cold climates. The goal is to train highly skilled professionals who will significantly contribute to and influence the design, building or renovation of energy-efficient buildings, taking into consideration the architecture and environment, the inhabitants’ behaviour and needs, their health and comfort, as well as the overall economy.
The degree project is the final part of the master programme leading to a Master of Science (120 credits) in Energy-efficient and Environmental Buildings.
Examiner: Marie-Claude Dubois (Energy and Building Design)
Supervisors: Niko Gentile (Energy and Building Design)
Ola Sundelin (Inter IKEA AB)
Keywords: daylighting, electric lighting, lighting controls, integration, human centric lighting, circadian potential, melanopic lux, non-visual effects, energy saving, retail, case study, IEA-SHC, furniture store, shopping experience.
Thesis: EEBD - # / 19

Daylighting and Electric Lighting Integration in the Retail Sector – A Case Study of the IKEA Kaarst Store
3
Abstract The retail sector represents 11% of the GDP and employs 15% of the workforce in the European Union. To tackle growth of e-commerce, physical retail stores need to be reviewed; both to decrease operating costs, increase productivity and to make the shopping experience more appealing. Energy use for lighting accounts for 50% of the total energy use in non-food retail stores, which is consumed primarily during daylight hours. Therefore, designing for daylighting and electric lighting integration is fundamental to obtain energy savings, as well as keeping occupants healthy and satisfied. This thesis describes field monitoring and supplementary building performance simulations of an existing daylighting and electric lighting integrated design for a furniture store. The store includes several areas of the showroom equipped with abundant daylighting. For the monitoring, the areas of the Living Room and Home Decoration exhibitions were selected. They include wide glazed areas, daylight harvesting systems, and tunable lighting. The monitoring procedure assesses four aspects: energy use, objective or measurable lighting conditions, circadian potential, and subjective evaluation of lighting. This study introduces an assessment based on the customers' path, which proved particularly informative in a retail setting. The results suggest that the integration project was successful in terms of energy saving, as well as customers and staff appreciation. Observations allowed a critical view on some of the objective photometric measures. Surprisingly, limited glare which simulations showed to occur, seems not to be a problem for users, rather an opportunity in a retail scenario. The customers were more attentive to daylighting and observing objects under natural light, and having a (good) view to the outside was the most positively evaluated. Clients also reported a better shopping experience compared to equivalent shops. Staff members showed satisfaction with the electric lighting solutions, such as LED panels with automatic tuning of correlated colour temperature. For future projects, the study argues that daylighting in furniture shops may be an asset. In addition, for the methodological part, the monitoring suggests that objective and subjective evaluations should be always combined for a full understanding of the integrated project.

Daylighting and Electric Lighting Integration in the Retail Sector – A Case Study of the IKEA Kaarst Store
4
Acknowledgements In first place, I want to thank my wife, Maria, for always being there, supporting and granting me the necessary time and motivation to complete this thesis. Also, thanks to my two sons; Luca, for helping me to choose the cover, and Leo, for waiting to be born a few hours after I defended this thesis.
I would like to express my gratitude to my supervisor Niko Gentile for his invaluable and unfailing support, as well as for giving me the opportunity to integrate this monitoring project into IEA-SHC Task 61 and for always being willing to share his expertise and kindness.
I would like to extend my appreciation to Ola Sundelin for supporting and shaping the idea of this thesis from the very beginning and to Inter IKEA for providing me with an office space during the literature research and pre-monitoring stages of this study.
Thanks also to LTH's Environmental Psychology department for all the equipment made available, with special thanks to Thorbjörn Laike, as the monitoring would not have been so successful without his help.
I also would like to express my gratitude for the supporting material provided by Petra Francke from the Communication section of Lund University and Johanne Elde from the Communication and Marketing section of LTH, which was also very practical for implementing the survey to the customers in the store.
During my visits to Kaarst, the staff in the store was extremely welcoming and participative with this project. I would especially like to thank Ingo Wackers for making me feel like a member of the Facility Management team and giving me access to every system and door.
Thanks to Andreas Carlberg from Piri for being so collaborative and providing all the necessary data from his state-of-the-art lighting control system installed in the Home Decoration section. Although in the end it was not possible to reconfigure the system to act as an energy monitor, Piri did everything possible.
A very special mention to Andreas Karst from Trilux, for coming to the store during one of the visits, as well as for providing all the necessary technical information. The Trilux control system was also not able to be used for energy monitoring in the end. However, during the writing of this thesis, additional energy trackers by courtesy of Trilux were installed. This data is not included in this report, since the monitoring is still going on, but will be used by the IEA-SHC Task 61.
The Swedish Energy Agency is acknowledged for the financial aid provided to support the activities in IEA SHC Task 61 / EBC Annex 77, which the case study evaluation in this thesis forms part of.
Jonas Manuel Gremmelspacher is gratefully acknowledged for his assistance in translating the surveys into German.

Daylighting and Electric Lighting Integration in the Retail Sector – A Case Study of the IKEA Kaarst Store
5
Last but certainly not least, many thanks to Marie-Claude Dubois for inspiring this thesis and for her Daylight lectures, due to which it has been worthwhile to complete the EEBD Master’s program at Lund University.

Daylighting and Electric Lighting Integration in the Retail Sector – A Case Study of the IKEA Kaarst Store
6
Table of content Abstract ............................................................................................................ 3 Acknowledgements .......................................................................................... 4 Table of content ............................................................................................... 6 Nomenclature ................................................................................................... 8 1 Introduction ........................................................................................... 10
1.1 Objectives and research questions 10 1.2 Scope and limitations 11
2 Background and literature review ....................................................... 12 2.1 Daylight integration in buildings 12 2.2 Daylighting integration in the retail sector 14 2.3 Daylight integration potential at IKEA stores 15 2.4 Standards and relevant frameworks 16
2.4.1 Environmental certifications 16 2.4.2 Daylight in buildings standard EN 17037:2018 17 2.4.3 Other EN standards 18 2.4.4 Observed-Based Assessments 18
3 Methodology .......................................................................................... 19 3.1 Monitoring Protocol 19 3.2 Kaarst store case study 20
3.2.1 Geometry 20 3.2.2 Lighting solutions 21 3.2.3 Selection of monitored areas 21
3.3 Monitoring 24 3.3.1 Energy 24 3.3.2 Photometry 26
3.3.2.1 Horizontal illuminance 29 3.3.2.2 Cylindrical illuminance 30 3.3.2.3 Vertical illuminance 31 3.3.2.4 Spectral power distribution 31 3.3.2.5 Daylight Simulations 32
3.3.2.5.1 Daylight factor 32 3.3.2.5.2 Daylight autonomy 33 3.3.2.5.3 Annual direct sun hours 33 3.3.2.5.4 Daylight glare probability 34 3.3.2.5.5 View out 34
3.3.3 Circadian potential 37 3.3.4 User perspective 38
4 Results and discussion ........................................................................... 40 4.1.1 Energy 41 4.1.2 Photometry 43
4.1.2.1 Horizontal illuminance 44 4.1.2.2 Cylindrical illuminance 44 4.1.2.3 Daylight Simulations 46
4.1.2.3.1 Daylight factor 46 4.1.2.3.2 Daylight autonomy 47 4.1.2.3.3 Daylight glare probability 49

Daylighting and Electric Lighting Integration in the Retail Sector – A Case Study of the IKEA Kaarst Store
7
4.1.2.3.4 View out 50 4.1.3 Circadian potential 51 4.1.4 Users’ perspective 52
5 Conclusions ............................................................................................ 57 5.1 Lessons learned and future research 58
6 Summary ................................................................................................ 60 7 References .............................................................................................. 62 8 Appendix ................................................................................................ 68
8.1 SWOT Analysis 68 8.2 Living room Eh on-site measurements 70 8.3 Home decoration Eh on-site measurements 71 8.4 Costumers survey - Living Room 72 8.5 Costumers survey - Home Decoration 76 8.6 Costumers survey - Overall shopping experience 80 8.7 Survey to the staff 84

Daylighting and Electric Lighting Integration in the Retail Sector – A Case Study of the IKEA Kaarst Store
8
Nomenclature ANSI American National Standards Institute ASE Annual Solar Exposure ASHRAE American Society of Heating, Refrigeration and Air Conditioning Engineers BREEAM Building Research Establishment Environmental Assessment Method CAD Computer Aided Design CEN European Committee CIE Commission Internationale de l’Eclairage DA Daylight Autonomy DALI Digital Addressable Lighting Interface DF Daylight Factor [%] DOE Department of Energy EML Equivalent Melanopic Lux EPS Expanded Polystyrene GDP Gross Domestic Products HCL Human Centred Lighting HD Home Decoration department HDR High Dynamic Range HMG Heschong Mahone Group HVAC Heating, Ventilation and Air-Conditioning IEA-SHC International Energy Agency-Solar Heating and Cooling Programme IES Illuminating Engineering Society of North America ISO International Organization for Standardization QR Quick Response LED Light-Emitting Diode LEED Leadership in Energy and Environmental Design LR Living Room department sDA Spatial Daylight Autonomy SIS Swedish Institute for Standards SPD Spectral Power Distribution SWOT Strengths Weaknesses Opportunities Threats USGBC US Green Building Council WWR Window-to-wall ratio Notation ° Degrees [-] °C Degrees Celsius [-] E Illuminance [lux]
g-value Solar energy transmittance [%] K Degree Kelvin [-] kWh/ m2 Kilowatt-hour per square meter [-] kWh/ m2 y Kilowatt-hour per square meter per year [-] R-value Thermal Resistance [m2 K/W] Tvis Visible transmittance [%] U-value Thermal conductance [W/m2 K] W/ m2 Watt per square meter [-]
Daylighting and Electric Lighting Integration in the Retail Sector – A Case Study of the IKEA Kaarst Store
9
“When light is dosed precisely, like salt, architecture reaches its best point”
Alberto Campo Baeza
“Our time is so specialized that we have people who know more and more or less and less”
Alvar Aalto
“Learn the rules like a pro, so you can break them like an artist”
Pablo Picasso

Daylighting and Electric Lighting Integration in the Retail Sector – A Case Study of the IKEA Kaarst Store
10
1 Introduction Retail and wholesale services are of great importance for the EU economy (Troch, 2016). In fact, the retail and wholesale sector represents 11% of the GDP and employs 15% of the workforce in the European Union (Eurostat, 2015). EU households devote up to a third of their budgetary resources to goods distributed by retailers, who in turn actively influence the quality of life of Europeans through price and choice of products on offer (European Commission, 2018). When it comes to in-store commerce, the retail sector faces a major challenge in the coming years, due to e-commerce growing fast and taking market shares, this was seen with a growth of 96 % between 2013 and 2018 in Europe (EuroCommerce, 2018). In the United States, the growth of e-commerce was slightly lower, but remained solid in Q1 2019 with 12.4% year-on-year, reaching 15% share of total retail sales (Meeker, 2019). Despite this, 59% of customers still prefer to buy their furniture in-store (Ecommerce Foundation, 2018), but expectations have changed. Physical stores seem to still have a chance, but they will have to be revamped to make the shopping experience a fresh new adventure, attracting and fostering customer loyalty. Additionally, reducing operating costs and increasing productivity is important for keeping the in-store business profitable (Jonathan Reynolds and Richard Cuthbertson, 2014), thus sustainable buildings with lower energy usage and a focus on the wellbeing of the staff are required. Energy use for lighting accounts for 50% of the total energy use in non-food retail stores (Jamieson, 2014; Euro Commerce, 2018), which is consumed primarily during daylight hours (U.S. Department of Energy, 2011). Thus, a huge potential exists in energy savings in lighting of retail buildings. Designing for daylighting and electric lighting integration is fundamental to obtain energy savings, as well as healthy and satisfied occupants. Literature investigates the multiple benefits of integrated solutions (Baker et al., 2013; Edwards et al., 2002), but objective monitoring of exemplary sustainable real-world projects is rare. In this thesis, a peculiar case study is presented; a pilot IKEA furniture store opened in Kaarst (Germany) in 2018 with the aim of testing daylight integrated design as a new strategy for the chain for new store openings and retrofits. The solutions include skylights, wide windows with automated blinds, combined with daylight harvesting and colour tunable electric lighting. The aim of this integrated design was to provide an attractive environment to customers and employees while saving energy. The approach is quite innovative; indeed, lighting design in the retail sector tends to rely mostly on electric lighting, which is easy to control in terms of intensity, distribution, and colour. The use of daylighting introduces a number of opportunities and risks to a typology of store and clientele so accustomed to the "closed box". This study seeks to evaluate this integration in the project as a whole, by combining technical measurements with observation of the customers and staff, aiming to identify the multiple benefits of daylight integration. The final objective of this thesis is to understand to what extent integrated lighting solutions can save energy and improve the shopping experience and wellbeing of the employees in this type of stores.
1.1 Objectives and research questions
The main aim of this study is to globally evaluate the integration of daylighting and electric lighting in a furniture store. The thesis explores the existing systems (daylighting, electric lighting and controls) and the integration design strategies selected in the featured case

Daylighting and Electric Lighting Integration in the Retail Sector – A Case Study of the IKEA Kaarst Store
11
study. The performance is evaluated in terms of energy use, measured or simulated photometry and circadian aspects of lighting, as well as users’ feedback. The lessons learned from this study are intended to guide decision-makers in the design of equivalent retail stores, as well as to help fine-tune the IEA-SHC Task 61 (sub-task D) monitoring protocol, of which the case study presented in this thesis is a part. The following research questions are intended to be answered with the results of this study:
1. Can integration of daylighting and electric lighting improve the shopping experience in a furniture store?
2. Is the energy use for lighting reduced with the integration of daylighting and electric lighting?
3. Does the daylighting and electric lighting integration improve the working experience and wellbeing of the employees?
An additional specific objective in this study was to investigate the usefulness of combined technical and observer-based environmental assessments to evaluate the integrated lighting project. Listed below are the operational sub-aims making-up this objective:
• Explore the suitability of different lighting metrics in the context of a furniture store • Evaluate the impact of furniture modelling in daylight simulations • Test a survey method based on QR codes • Investigate circadian potential and non-visual effects in the context of a furniture
store
1.2 Scope and limitations
Some tasks had to be simplified during the thesis development, mainly because the monitoring campaign was carried out by a single person and the number and duration of on-site visits were limited. Furthermore, it was not possible to get external support to conduct the customer surveys personally in German, so it was decided that customer surveys would be performed using online forms, which were accessible via QR codes using a standard smartphone. The simplification of the survey procedure was also meant to facilitate replication in other equivalent stores of the same chain that have no daylight, in order to allow comparison of the results. However, the latter was not feasible for several reasons. Sales-related data could not be accessed due to retailer confidentiality policies, thus the will and impetus to buy was added as a question in the customer survey. The store analysis focused on two departments with differing daylight integration scenarios, which were extensively investigated. In addition, a comprehensive review of the overall shopping experience in the store was also carried out. It was not possible to monitor the real energy use for lighting, as sub-meters for lighting circuits were not operational during the study. Alternatively, the original intent was to monitor daylight harvesting controls, although this was not feasible either, since the monitoring functionality of the controls was not compatible with the installed fixtures.
Daylighting and Electric Lighting Integration in the Retail Sector – A Case Study of the IKEA Kaarst Store
12
Energy use for lighting evaluation was assessed through standardized calculation methodology, based on extensive information of the lighting system provided by the contractor and manufacturers of fixtures and DHS (Daylight Harvesting System) controls. The conditions required for the adequate estimation of the Daylight Factor (DF) could not be met, so it was estimated using computational simulations. 2 Background and literature review A literature review was conducted prior to and during the study, which can be grouped into four main clusters gathering information from existing research:
• Daylight integration in buildings • Daylight integration in the retail sector • Daylight integration potential at IKEA stores • Standards and relevant frameworks
2.1 Daylight integration in buildings
The use of daylight is a major issue in sustainable and human-centred building design. It encompasses and directly influences topics such as health, wellbeing, productivity and energy efficiency, to list the most important aspects. The study of daylight integration in buildings has been extensively investigated and there are thorough literature reviews gathering the main findings (Leslie, 2003; Kruisselbrink et al., 2018). Nevertheless, research often focuses exclusively on residential buildings or working environments (Bodart and De Herde, 2002; Cheung and Chung, 2008; Dubois and Blomsterberg, 2011), given that they occupy a large part of 90% of the time that human beings spend indoors (Klepeis et al., 2001; Brasche and Bischof, 2005; Schweizer et al., 2007). Literature has consistently argued that the incorporation of daylight into buildings improves the health and wellbeing of the occupant. (Pauley, 2004; van Bommel and van den Beld, 2004; Lockley, 2009; Christoffersen, 2011; Shanmugam et al., 2013; Kralikova and Wessely, 2019). In turn, improving wellbeing plays a key role in raising productivity in workplaces. Therefore, investing in wellbeing is a wise decision in terms of profitability for employers, as it is much more beneficial than reducing energy consumption or rental costs, as cost for employees often represent around 90% of the overall business running costs (Alker et al., 2014; Stopka, 2016). Some studies prove that the daylight-related productivity increase may range from 2-3% (Heschong, 2003a) up to 25% when combined with additional biophilic design practices (Bill Browning et al., 2012). That increase is fostered by the decrease in absenteeism rates and, more importantly, by the mitigation of the phenomenon of presenteeism in the workplace. In other words, occupants feel better and more at ease at their workplace, thereby making their tasks more effective. The impact of daylight on such important aspects such as learning has also been explored by numerous investigations (Heschong, 2003b). Long-term studies comparing the performance of students in classes with and without windows have shown a robust connection between

Daylighting and Electric Lighting Integration in the Retail Sector – A Case Study of the IKEA Kaarst Store
13
the presence of daylight and outdoor views with a positive impact on students’ performance (Küller and Lindsten, 1992). Also in healthcare facilities, the presence of daylight appears to be connected with a decrease in the average length of the patients’ stay (Choi et al., 2012), proving that a high illuminance in the morning is more beneficial, thus rooms with east-oriented windows perform the best with a decrease of the length of the stay between 16% - 41%. Furthermore, the lighting revolution brought about by light-emitting diodes (LED) as a source for illumination in the recent years (Pandharipande and Caicedo, 2011; Nardelli, A. et al., 2017; Montoya et al., 2017) has also created a great potential for energy consumption savings in lighting retrofitting. Numerous studies have analysed the performance of these renovations together with the integration of daylight harvesting systems (Knoop et al., 2016). While red and green-emitting LED lamps have been used in electronics for decades, LED as lighting technology only started with the invention of the blue-emitting LED (Nakamura et al., 1994), which finally allowed the production of white-light LED lamps as a source for illumination. This earned the team led by Nakamura a well-deserved Nobel Prize in 2014, and brought a paradigm shift in luminous efficacy to the lighting industry. Although the introduction of LEDs may lead to a sharp reduction of the global 20% of electricity used for lighting, there is also the risk that the final savings will be minimal if not used wisely (Shellenberger and Nordhaus, 2014). This is illustrated by numerous studies that support the so-called rebound effect (Saunders, 2008; Saunders and Tsao, 2012). This means that all the savings brought by installing more efficient light sources can rebound in a higher number of light sources installed, which may result in a similar or even higher final lighting power installed. Daylight integration is thus crucial to reduce the energy use for lighting. However, daylight harvesting systems (DHS) are complex, and they need to be well designed, installed and operated in order to be effective. When properly designed, they can provide up to 40%-60% in energy savings (Williams et al., 2011; Xu et al., 2017). Conversely, they can become useless when not correctly implemented, even increasing the total energy use due to parasitic consumption of certain control systems or faulty installation. Most recent LEDs also provide the ability to tune the colour output. This has led to the appearance of several LED luminaires that attempt to dynamically replicate the spectrum of daylight throughout the day by changing its CCT, giving rise to the so-called circadian lighting, or human centric light (HCL), which promises to be more respectful with the biological circadian rhythm. In this field, lighting technology has made significant progress. At present it is possible to recreate a spectrum of light quite close to the visible range of daylight (Seoul Semiconductor, 2018). Even some multispectral LED modules, combining different channels, are able to replicate natural light dynamically throughout the day (Ledmotive, 2019). However, this technology is not yet fully efficient, since it is often based on superimposing different channels in the same module. Indeed, luminaires achieving a more daylight-like dynamic spectrum, accumulate up to seven channels, thereby boosting energy use and production costs. Although algorithms that seek to optimize the efficiency and spectrum of multichannel LEDs already exist, and even some daylight-like LEDs claim very good luminous efficacy of 150 lm/W (Seoul Semiconductor, 2018), their use is not yet

Daylighting and Electric Lighting Integration in the Retail Sector – A Case Study of the IKEA Kaarst Store
14
widespread on a large scale and the impact on the health and well-being of users still needs to be more thoroughly investigated. In summary, there is no light source more efficient and respectful of human physiological needs than the one coming from the sun.
2.2 Daylighting integration in the retail sector
Daylighting was a common source of illumination in industrial buildings and warehouses before the 1950s. However, with the cheapening of fluorescent lights and air-conditioning systems, daylight was progressively abandoned in favour of electric lighting (Heschong et al., 2002). The existing literature on the integration of daylight in commercial buildings is not abundant, especially regarding field-studies and monitoring of real cases. Much of these studies have been conducted on a large scale by the Heschong Mahone Group (HMG) in the United States, comparing a significant number of retail stores with and without daylight integration. In 1999, a study analysing and monitoring a full portfolio of a retail-chain, consisting of 108 stores, where two-third of the stores presented generous daylighting through skylights, found that in the daylit stores, sales were between 31% to 49% higher compared to the ones without skylights. (Heschong, 1999). Subsequently, another study was conducted by HMG in 2003, which included 73 stores in California (Aumann and Heschong, 2003). Out of these, 24 presented integrated daylight by means of diffusing skylights. Staff interviews and customer surveys were also included, along with an analysis of energy savings due to DHS. It was found that increases in hours of daylight were strongly correlated with an increase in sales, although to a lesser extent than in the previous study. Increases in sales were consistent throughout the year, without seasonal variation, suggesting a long-term customer loyalty and not impulsive buying. Although most customers were unaware of the daylight presence, they did perceive a greater clarity and brightness of light conditions. Moreover, customers felt more relaxed and stayed longer in the store. Regarding lighting energy savings, stores with DHS consumed about 20% to 30% less electricity. When combining lighting and HVAC in the whole building, energy savings declined. However, it remained in a beneficial range of 15% to 25% energy savings. It is interesting to review the Western U.S. energy crisis that occurred between 2000 and 2001 in California. Like other sectors, retail had to reduce the use of electricity, which in the case of lighting was agreed to be halved. After analysing the data in 2003, HMG verified that daylit stores experienced an average increase in sales of 5.5%. This episode made many retailers reconsider the use of daylight in new projects and refurbishments, which generated a number of internal studies and monitoring of stores with DHS, the resulting energy savings of which were around 20% to 30% (EPA, 2002; Food Distributor, 2002; L. Edwards and P. Torcellini, 2002). Different studies on the integration of daylight in commercial buildings are based on building performance simulations (BPS), often using parametric analyses. Generally, these studies are concerned with the energy savings potential in lighting, performance of the

Daylighting and Electric Lighting Integration in the Retail Sector – A Case Study of the IKEA Kaarst Store
15
different control systems strategies, and photometric characterization of the indoor spaces. Resulting energy savings are not consistent throughout literature, and can range from almost negligible results to more than 50% (Luca et al., 2018) depending on the chosen design strategies, location, geometry, luminaire efficiency and system operation by the end user. The perception of colours is also a key factor in retailing, especially in the textile and furniture industry, and there is a great deal of relevant literature available (Hinks and Shamey, 2011). From the colour choice in the design phase, verification and replicability of the resulting colour after manufacture and, finally, the perception of colours by the customer in the shop are integral. A multitude of factors are involved, but the quantity, and mostly the quality, of the light are the most determining. The spectrum of the light or spectral power distribution (SPD), the colour rendering index (CRI) and CCT (CIE, 2019) characterize the fidelity of the perceived colours, assuring that the client will not be misled by an inadequate illumination (Boissard and Fontoynont, 2009).
2.3 Daylight integration potential at IKEA stores
As part of a corporate plan, IKEA sought to list the main design principles that would enable more sustainable stores. This resulted in 14 sustainable design principles, which the franchises from the company are encouraged to implement in new developments. The company prepared internal technical booklets with related data and know-how from existing research. In addition, this is illustrated with some examples of good practices from their own stores, as inspiration for the different actors involved in the design, construction and operation of the stores. Among these sustainable principle booklets, the following two were of interest for this study and thus examined:
a. Daylight: This guide explains why daylight is important for customers and co-workers, and why it is a commercial opportunity. Moreover, an exhaustive list of advantages of daylight is listed. Worth mentioning are the good perception of colours and textures that natural light provides, and the natural feeling and atmosphere created by a view of the outdoors. (Inter IKEA, 2017a).
b. Envelope openings: This defines the impact of the openings in the indoor environment of the store, as well as the balance between transparency and multidirectional assessment of the views-in and out, as can be seen summarized in the Figure 1.
Figure 1: On the left the ideal daylight integration in the IKEA building. On the right, envelope openings design approach and the impact in views-in and views-out.(Inter IKEA, 2017b).
Based on these guidelines, a specific daylight brochure was developed after completion of the Kaarst store (Inter IKEA, 2017c), which describes the solutions and strategies used in each area, aimed at sharing the know-how acquired. In fact, in the design phase, daylight performance levels were verified by requesting the collaboration of experts in the field. One

Daylighting and Electric Lighting Integration in the Retail Sector – A Case Study of the IKEA Kaarst Store
16
of these reports carried out by White Arkitekter, where glare risk and luminance assessments are verified by means of BPS, was also reviewed (Dubois, M.-C. and Erlendsson, Ö., 2015).
2.4 Standards and relevant frameworks
In order to define both the technical and observer-based assessments to be carried out, it was decided to investigate standards, regulations and environmental certification schemes. This allowed the gathering and, therefore, selection of the adequate measurements, metrics and thresholds defining a successful daylight integration in a furniture store, thus, defining a sufficiently robust framework upon which to base the monitoring protocol.
2.4.1 Environmental certifications Environmental certifications are increasingly more stringent, and typically exceed building codes. Therefore, the requirements in regard to daylight integration design and associated aspects were verified. The three certifications that were most fruitful under the focus of this study were LEED v4.1, BREEAM 2017 and the WELL Building Standard. Daylight credit at LEED v4.1 (USGBC, 2019) focuses primarily on promoting savings in the building's annual energy use. This is achieved by rewarding energy savings in indoor electric lighting and limiting the risk of overheating; in the first case through spatial daylight autonomy (sDA) and in the second, using the annual solar exposure (ASE). Neither of these metrics seemed suitable for evaluation in the monitoring protocol. Nevertheless, for the Quality views credit, one of the described evaluation methods in LEED, based on the view factor, was retained. This method, which indeed was developed by HMG (Heschong, 2003a), is further explained in the methodology chapter. The approach to Daylight of BREEAM (BRE Global, 2016; SGBC and BRE Global, 2018) is not so much to save energy, but to promote designs that facilitate the homogeneous profusion of natural light indoors. The average daylight factor (DF����, cfr CIE 17-279) (CIE, 2019) is defined as the required metric to ensure this, whilst the horizontal illuminance (Eh , cfr CIE 17-539) (CIE, 2019) can also be used, adapting the thresholds and required assessment area depending on the type of building. Both the use of DF���� and Eh seemed suitable to be implemented in the evaluation of the Kaarst store. However, the requirement of a minimum uniformity (U0 = Emin/ E�, cfr CIE 17-552)(CIE, 2019) that accompanies them was not. 𝑈𝑈0 > 0.3 would be difficult to reach in our case study, where the areas studied do not have skylights, but lateral windows, the building being very deep and lacking the core of natural light contribution. In this way, daylight BREEAM approach keeps similarities with the daylight provision within the EN17037 Daylight in Buildings (CEN, 2018), which is commented on below. In the case of the WELL Building Standard (International Well Building Institute, 2017a), the approach is based on achieving the well-being of the occupant, regardless of energy consumed. The non-visual effects of integrated daylight design are evaluated in WELL using the equivalent melanopic lux (EML). It was decided to select the EML to be incorporated to the monitoring protocol, since this metric will enable comparisons between measured on-site values, after data processing (Lucas et al., 2014), with simulated values using ALFA software (Solemma, 2018). Both procedures are detailed in the methodology

Daylighting and Electric Lighting Integration in the Retail Sector – A Case Study of the IKEA Kaarst Store
17
chapter. It is necessary to mention that to date, the use of EML, which indeed was introduced by the WELL Building Standard, is still questioned by some researchers (Rea, 2017) and institutions, mainly due to the circumstance that it is a fairly recent metric. In fact, since the discovery of the of the ipRGC (intrinsically photosensitive retinal ganglion cells) (Berson et al., 2002) great progress has been made in understanding the interactions of lighting in human health. Apart from EML, different functions have been introduced to evaluate and understand how ipRGC respond to light and relate to rods and cones, as seen in CIE S026:2018 (CIE, 2018). The available literature in this field of research is prolific (Hattar et al., 2002; Rea et al., 2002; Berson et al., 2002; Viola et al., 2008; Chellappa et al., 2011; Sahin and Figueiro, 2013; Figueiro, 2017; Zele et al., 2018; Perez, 2019), the results and conclusions being relatively uneven, although they do show that the main trend is in line with the use of EML. Overall, the journey from LEED through BREEAM, EN17037 to finally reach WELL, illustrates the movement that integrated lighting design has experienced, from energy saving as the sole driver to today's HCL or circadian luminaires, promoting more soft values to the occupants, often at the sacrifice of higher consumption. It is no longer a matter of "lumen/watt" for lighting fixtures, or “kilowatt-hour” for integrated systems. It is about adequate lighting for health and human wellbeing, without the limitations of existing energy metrics.
2.4.2 Daylight in buildings standard EN 17037:2018 The recently launched EN17037:2018 European standard for daylight in buildings (CEN, 2018) seeks to harmonise a common methodology for daylit buildings in Europe. It integrates the particularities originated by the existing different geographical and climatic zones within the continent. The standard recommends methods and thresholds for the assessment of daylight provision, outdoor views, sunlight exposure and glare. This standard was used to define most of the monitoring protocol in relation to photometry, integrating the following methods or thresholds:
a. Minimum target illuminance (ETmin) of 300 lux on 50% of the area, which will define a well daylit space
b. Maximum target illuminance (ETmax) of 750 lux on 50% of the area, which will define an extremely well daylit space
c. For the assessment of the views outwards the medium level of recommendation was selected, but without considering the horizontal sight angle parameter. Nonetheless, the other parameters were integrated, namely external distance of the view ≥ 20 m and holding two layers in the view (landscape and ground or sky) from 75% of the area. The view factor was prioritized over the horizontal sight angle proposed in the standard, as it was considered to fit better in a retail scenario. This is elaborated in the methodology chapter.
d. Height of eye level standing at 1.70 m e. Checking criteria for the minimum size of horizontal grid used in the daylight
simulations f. Use of the daylight glare probability metric to assess glare risk potential

Daylighting and Electric Lighting Integration in the Retail Sector – A Case Study of the IKEA Kaarst Store
18
This standard applies to any space occupied on a regular basis, which means for extended periods. It is important to keep this in mind, as the occupants in a furniture store or any retail building, besides the staff, spent a limited time there, so the metrics could not be properly tuned, nor could they be proven as appropriate in offices or schools.
2.4.3 Other EN standards The rest of the standards that were verified were basically those related to electric lighting design and the requirements for calculation of lighting energy consumption. It was verified in the EN 12464-1:2011 (CEN, 2011) that design levels for electric lighting are often set at the 300 lux in workplaces, a threshold that was previously set as ETmin . Indeed, the probability of "switch-on" of the electrical lighting is high for illuminances below 100 lux and extremely low for illuminances exceeding 300 lux. In order to assess the energy use of the DHS in the store, the methods defined in the EN 15193-1:2017 Energy performance in buildings, and energy requirements for lighting (CEN, 2017) were used. The method for the energy use assessment is detailed in the methodology chapter.
2.4.4 Observed-Based Assessments For the preparation of customer and staff surveys, as well as interviews with the staff from the store, the user assessment defined in the monitoring protocol (Dubois, M.-C. et al., 2016; Gentile et al., 2016) from the IEA-SHC Task 50 was the starting-point. Considering the particularities of this case study, additional literature was investigated to support the necessary adjustments in the surveys and interviews, as well as the resulting data treatment. The "Real World Research" book by (Robson and McCartan, 2016) was extremely useful to prepare the semi-structured interviews and the different questionnaires, as well as the "Occupant survey Toolkit" (CBE, 2019) developed by the Center for the Built Environment at the University of California, which was consulted to verify the structure and sections in the surveys.

Daylighting and Electric Lighting Integration in the Retail Sector – A Case Study of the IKEA Kaarst Store
19
3 Methodology This chapter provides an overview of the methodology developed to address the study. The chapter is structured in three subchapters, beginning with the description of the Monitoring Protocol, which was developed in collaboration with IEA-SHC Task 61, and adapted to the specificities of the case study. Secondly, the subchapter Model introduces the analysed building and the present lighting systems, followed by the justification for the areas of the store that were selected for monitoring. Lastly, the third subchapter gathers the different aspects that conform the monitoring, detailing the methods used to evaluate energy use for lighting, photometric aspects and circadian potential of the space and feedback from users. The overview workflow applied throughout the thesis, which is summarized in four stages, is illustrated in the Figure 2 below:
Figure 2: Thesis overview methodology. (Illustration by the author).
3.1 Monitoring Protocol
The evaluation of the integrated lighting design for the selected areas follows a monitoring protocol that was developed jointly with IEA SHC Task 61 / EBC Annex 77 Subtask D (Gentile and Osterhaus, 2019). This protocol was still under development at the time of writing this report, since the case study analysed in this thesis was the first of the Subtask activities. The IKEA case study itself provided feedback to the monitoring protocol, which was further adjusted according to the lessons learned from the case study (Figure 2). The final version of the monitoring protocol is expected by the end of Task 61, in late 2021. The monitoring protocol requires on site measurements of:
1. Energy for lighting and heating/cooling thermal loads impact 2. Photometric aspects 3. Circadian aspects of lighting 4. Users’ opinion
When on site measurements are not possible, the protocol allows for calculations. A common case is that of energy for lighting, where separate meters for lighting are only rarely provided in real buildings, and the protocol allows for a calculation based on the standard EN15193:2017 (CEN, 2017). A key feature of the protocol is the combined use of so-called Technical Environmental Assessment (TEAs) (or objective measurements, with technical instrumentation) and Observed-Based Environmental Assessments (OBEAs) (or subjective measurements,

Daylighting and Electric Lighting Integration in the Retail Sector – A Case Study of the IKEA Kaarst Store
20
usually with questionnaires or interviews) (Craik and Feimer, 1987). One of the reasons to combine TEAs and OBEAs is that a full evaluation based only on technical instruments would be difficult, resource-consuming, and, most important, limited. Cross-evaluation with OBEAs instead highlights aspects that are often impossible to be measured in reality, especially with few point-in-time TEAs or at the individual level (O’Brien et al., 2019). The monitoring campaign was done during three site visits in spring 2019, each visit lasting for about one week. The purposes of the first visit, which was shorter, were to get acquainted with the building, the lighting systems and the staff, following the evaluation toolbox procedure from IEA-SHC Task 50: “Advanced Lighting Solutions for Retrofitting Buildings” (Gentile et al., 2016). During this first visit, two areas were selected for monitoring. The following visits were planned around the spring equinox and the actual monitoring, as described in the following sections, was carried out at that time.
3.2 Kaarst store case study
The case study is a furniture store from a global chain (IKEA) located in Kaarst (Figure 3), North Rhine-Westphalia, Germany (latitude 51° 13′ N, longitude 06°37′ E). The store is located in an open industrial area about 15 km west of Düsseldorf downtown, connected by public transport and a free shuttle bus, although most customers use private transportation. It is one of two IKEA stores in Düsseldorf, the other being an older, conventionally designed store 9 km east of the city.
Figure 3: Geographical location of the case study object. (Illustration by the author).
3.2.1 Geometry At first glance, the store resembles other stores from the same furniture chain; two rectangular blocks, one for exhibitions and the other for the self-service collection warehouse. The exhibitions block consists of two levels; the upper one containing the larger-format furniture showrooms such as Living Rooms, bedrooms and kitchens, while the lower level, the so-called market hall, contains the smaller-format products. There are entrance and restaurant acts articulating the connection between the two blocks as visualized in Figure 4.

Daylighting and Electric Lighting Integration in the Retail Sector – A Case Study of the IKEA Kaarst Store
21
Figure 4: Aerial photography of the store and illustrative 3d model showing the blocks in which the store is organized. (Photography courtesy from euroluftbild.de and illustrative model by the author).
3.2.2 Lighting solutions The most noticeable difference that the customer perceives once inside Kaarst store is daylight penetrating through large glazed areas. In the exhibitions block, the windows are strategically placed along the façade, while in the warehouse block, daylighting is provided by skylights and full height windows at the end of each aisle. Some façade windows are equipped with movable rollers but are blocked in the fully open position.
The electric lighting is provided with LED fixtures which are managed by the standard protocol DALI (Digital Illumination Interface Alliance, 2019).
The electric lighting sources are divided into three main groups regarding their functions:
1. General ambient lighting is provided by LED tubes. These luminaires are dimmable and are distributed freely throughout the entire exhibition block, supported by clipping onto the false ceiling mesh, which makes the electric lighting system very flexible. Depending on the desired light intensity in each department or zone, the density of installed luminaires can be increased or reduced very easily.
2. Spot lighting provided by LED non-dimmable spot luminaires of different power outputs are installed along the entire store. Mainly used to highlight the products.
3. LED panels with tunable CCT (called Human-Centred Light, HCL) are installed in two of the showroom areas, in the cash-line and in the co-worker’s canteen. These fixtures are dimmable but running at a fixed intensity of 80%. The CCT tuning is following a daily predefined profile which has been developed by the manufacturer.
In some of the daylit areas, a number of ambient lighting fixtures are controlled by daylight harvesting control systems, see Table 2.
3.2.3 Selection of monitored areas The spaces in the store of interest for this study were selected during an initial visit in February 2019. The selection first identified the areas with high daylight availability; among those, it prioritized those with electrical lighting integration. A SWOT analysis based on plans and documentation, as well as on discussion with the store staff and facility management team, identified two areas to be monitored as analysed in Table 1. The

Daylighting and Electric Lighting Integration in the Retail Sector – A Case Study of the IKEA Kaarst Store
22
complete SWOT analysis table including the non-selected areas can be found in the Appendix 8.1 SWOT Analysis. Table 1: SWOT Analysis of the daylit areas in the store. Only those finally selected are reported in table.
Daylit Areas Strengths Weaknesses Opportunities Threats
Living Room 1 Window 6.2 * 2.4m 1 Glazed Door 2.8 * 2.8 m
South and West windows, high-priced products. Colour rendering is important.
Modest size of windows. Risk of frontal glare.
First exhibition area. Ask about plans, such as expected visit time.
Transition zone to the rest of the showroom, many customers are not interested in the product range and they will skip it
Home Decoration Fully glazed west
and north façade in the area. Circadian fixtures installed.
Highly exposed to direct solar radiation during peak times. Interior sun shading.
Low-priced and greenery products, where light could play a major role.
Customers can be disturbed by sunlight.
1 Window 16 * 2.4m 1 Glazed Door 2.8 * 2.8 m
The two selected departments, Living Room (LR) and Home Decoration (HD), are shown in Figure 5 where the location within the exhibitions block can be observed.
Figure 5: Selected departments for being monitored, in yellow is highlighted the proposed path on every department. (Illustration by the author).
Located on the first floor, the Living Room (Figure 6) is the first department to be crossed by customers, and was determined to be an interesting place to ask clients about the time they plan to spend on their visit. The area presents a south-facing window and a glazed door oriented to the west, from which daylight penetrates during most of the daytime. The Window to Wall Ratio (WWR) of the exterior walls in this area is equal to 11%. Part of the electric lighting in the area is provided with daylight harvesting. The Living Room area exhibits products where the quality of light and rendering of colours is relevant. Such products are sofas, armchairs and coffee tables. Compared to the product range in the store, those are usually the most expensive, so interested customers tend to stay longer to examine

Daylighting and Electric Lighting Integration in the Retail Sector – A Case Study of the IKEA Kaarst Store
23
them in detail and compare the different textures and colours available.
Figure 6: Living Room department: Picture and floor plan with suggested walking path.
The Home Decoration department (Figure 7) is located on the ground floor; it is the second to last area before entering the final self-serve collection area. The products offered are low-priced, consisting mainly of indoor plants, gardening and small decorative objects such as candles and vases. The area receives both daylight and electric light, the latter being provided by spot lamps and a number of HCL panels. The windows have a direct view to the street, and they are almost full floor-to-ceiling-height, with a sill of only 40 cm. It is the department with the highest WWR in the store, 44%. The view from the north window consists of a playground and the west window provides a view of the parking lot.
Figure 7: Home Decoration department: Picture and floor plan with suggested walking path.
It is important to note that both areas have a suggested walking path which is drawn on the floor and designed for this same purpose. Customers are prompted to walk along that path in order to observe the whole product range; thus, it is also interesting to evaluate lighting on this specific path, rather than on traditional grid of points, which are more suitable for traditional office settings as represented in Figure 9.

Daylighting and Electric Lighting Integration in the Retail Sector – A Case Study of the IKEA Kaarst Store
24
3.3 Monitoring
As previously defined, monitoring was divided into four different aspects (energy, photometry, circadian potential and user perspective) following the defined protocol. These aspects are detailed below.
3.3.1 Energy The shop was not designed with a separate circuit for lighting; therefore, it is not possible to meter the electricity use for lighting only. As alternative, the comprehensive method of the standard EN15193:2017 (CEN, 2017) was used. Input data were based on measured quantities, like actual occupancy profiles and dimming schedules. The energy for lighting systems in the two selected zones, LR and HD, was calculated through the characterization and quantification of the luminaires, via field verification of the luminaires, circuits and controls. The energy calculation workflow is summarized in Figure 8.
Figure 8: Energy use for lighting calculation workflow.
In order to quantify the total installed power and calculate the energy use for lighting and standby of the different control systems, luminaires in the LR and HD areas were identified and accounted for, as can be seen in Table 2. A few luminaires for general lighting (Led linear Grid), specifically 17 in the Living Room and 35 in the Home Decoration, were dimmed by an illuminance sensor. The other luminaires, including the HCL Panels, which are potentially dimmable, operated at fixed luminous flux (Table 2). In order to obtain the real operating profile and the dimming schedule of such luminaires, two illuminance sensors were installed at each zone for four weeks. One sensor was placed under majority of scheduled dimmable luminaires and the other, used as a reference, under non-dimmable spotlights. This provided the resulting profile of the daily on/off schedules and dimming of the luminaires, which proved to be especially useful to establish daily patterns, e.g. the

Daylighting and Electric Lighting Integration in the Retail Sector – A Case Study of the IKEA Kaarst Store
25
arrival of the cleaning or restocking of products teams. An average of the four weeks analysed was made and introduced as input for the calculation of the energy use for lighting of the two areas. Table 2: Number and specifications of luminaires. Melanopic ratios for each luminaire measured on-site, but LED HCL from International Well Building Institute (International Well Building Institute, 2017b).
Type of fixture LED Linear Grid
LED Spotlight
LED Spotlight
LED Projector
LED HCL Panel
Power [W] 17 10.4 37 25 54 Luminous efficacy [lm/W] 138 75 72 60 143
CCT [K] 4000 3500 3500 4000 2700 / 6500
Melanopic Ratio 0.78 0.62 0.66 0.76 0.45 / 1.05
Dimmable Yes / DALI No No No Yes / DALI (Fixed to 80%)
Daylight Harvesting
Yes (Some zones) No No No No
Total units installed / (of which) with daylight harvesting
Living Room Area 70 / 17 87 / 0 37 / 0 3 / 0 No
Home Decoration Area 76 / 35 39 / 0 54 / 0 4 / 0 24 / 0
Taking into account the generous glazed surfaces and according to the guidelines of the monitoring protocol, a simple evaluation of the impact of the thermal loads was carried out through the energy modelling of the two areas studied. Despite being slightly outside the scope of the monitoring protocol, it was also decided to analyse the annual use of primary energy for heating and cooling. In this way, the impact of the openings on the performance of the building was obtained, both at a passive (geometry) and active (systems) scale.
The building was modelled with the three-dimensional CAD software Rhinoceros 6 (Robert McNeel and Associates, 2019). The model was then characterized thanks to the use of the visual scripting interface Grasshopper (McNeel, 2014) with the addition of the open source plug-in Honeybee from Ladybug tools (Sadeghipour Roudsari, M, 2013). The Honeybee plugin was connected to the OpenStudio (National Renewable Energy Laboratory (NREL), 2018a) interface which in turn uses EnergyPlus (National Renewable Energy Laboratory (NREL), 2018b) as a validated simulation engine.
EnergyPlus is a transient building performance simulation tool, focussed on energy use analysis. The software takes interior and exterior influences at a timestep of 8760 hours per year into account. A 3D building model, weather data on an hourly resolution including temperature, radiation, wind direction and speed, ground temperature among other many more measures are accounted for as inputs amongst the specific inputs regarding
Daylighting and Electric Lighting Integration in the Retail Sector – A Case Study of the IKEA Kaarst Store
26
construction setups and building system measures. Shading through surroundings and building elements is accounted for in the calculation.
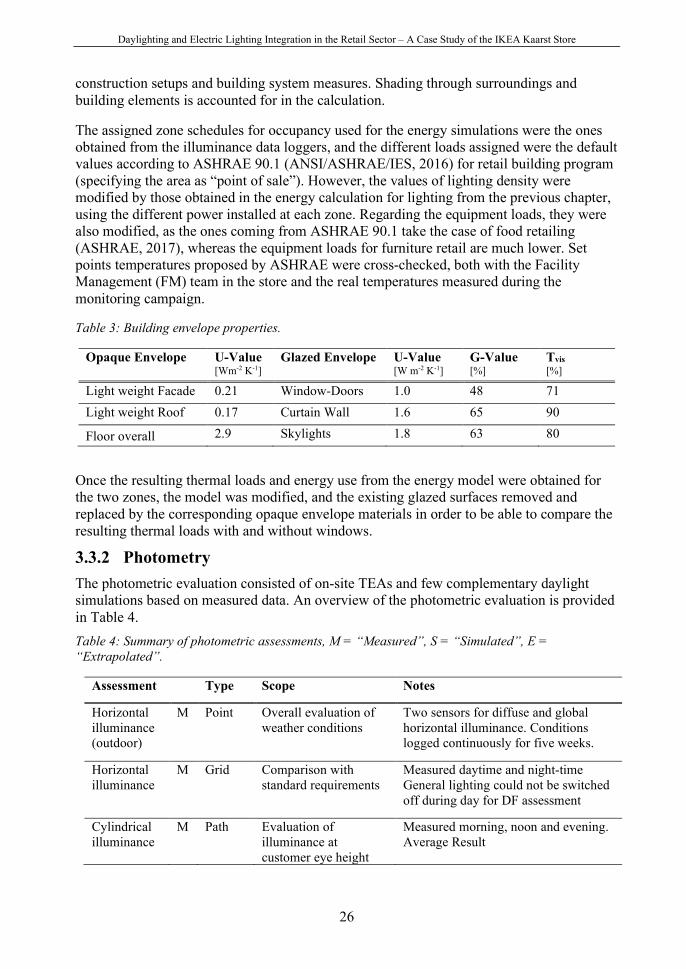
The assigned zone schedules for occupancy used for the energy simulations were the ones obtained from the illuminance data loggers, and the different loads assigned were the default values according to ASHRAE 90.1 (ANSI/ASHRAE/IES, 2016) for retail building program (specifying the area as “point of sale”). However, the values of lighting density were modified by those obtained in the energy calculation for lighting from the previous chapter, using the different power installed at each zone. Regarding the equipment loads, they were also modified, as the ones coming from ASHRAE 90.1 take the case of food retailing (ASHRAE, 2017), whereas the equipment loads for furniture retail are much lower. Set points temperatures proposed by ASHRAE were cross-checked, both with the Facility Management (FM) team in the store and the real temperatures measured during the monitoring campaign.
Table 3: Building envelope properties.
Opaque Envelope U-Value [Wm-2 K-1]
Glazed Envelope U-Value [W m-2 K-1]
G-Value [%]
Tvis [%]
Light weight Facade 0.21 Window-Doors 1.0 48 71 Light weight Roof 0.17 Curtain Wall 1.6 65 90
Floor overall 2.9 Skylights 1.8 63 80
Once the resulting thermal loads and energy use from the energy model were obtained for the two zones, the model was modified, and the existing glazed surfaces removed and replaced by the corresponding opaque envelope materials in order to be able to compare the resulting thermal loads with and without windows.
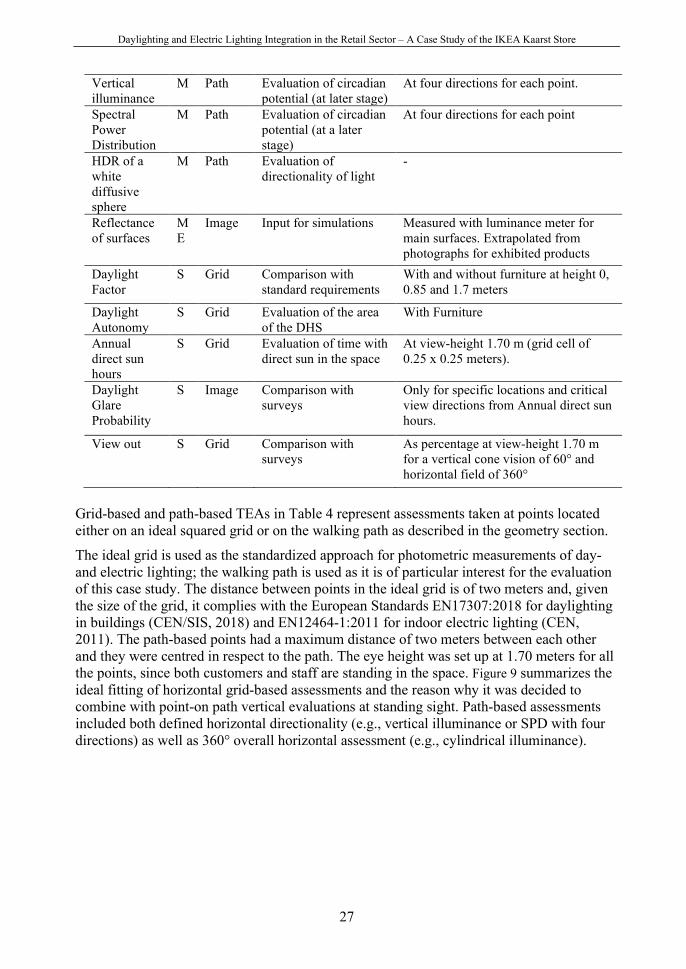
3.3.2 Photometry The photometric evaluation consisted of on-site TEAs and few complementary daylight simulations based on measured data. An overview of the photometric evaluation is provided in Table 4. Table 4: Summary of photometric assessments, M = “Measured”, S = “Simulated”, E = “Extrapolated”.
Assessment Type Scope Notes
Horizontal illuminance (outdoor)
M Point Overall evaluation of weather conditions
Two sensors for diffuse and global horizontal illuminance. Conditions logged continuously for five weeks.
Horizontal illuminance
M Grid Comparison with standard requirements
Measured daytime and night-time General lighting could not be switched off during day for DF assessment
Cylindrical illuminance
M Path Evaluation of illuminance at customer eye height
Measured morning, noon and evening. Average Result
Daylighting and Electric Lighting Integration in the Retail Sector – A Case Study of the IKEA Kaarst Store
27
Vertical illuminance
M Path Evaluation of circadian potential (at later stage)
At four directions for each point.
Spectral Power Distribution
M Path Evaluation of circadian potential (at a later stage)
At four directions for each point
HDR of a white diffusive sphere
M Path Evaluation of directionality of light
-
Reflectance of surfaces
M E
Image Input for simulations Measured with luminance meter for main surfaces. Extrapolated from photographs for exhibited products
Daylight Factor
S Grid Comparison with standard requirements
With and without furniture at height 0, 0.85 and 1.7 meters
Daylight Autonomy
S Grid Evaluation of the area of the DHS
With Furniture
Annual direct sun hours
S Grid Evaluation of time with direct sun in the space
At view-height 1.70 m (grid cell of 0.25 x 0.25 meters).
Daylight Glare Probability
S Image Comparison with surveys
Only for specific locations and critical view directions from Annual direct sun hours.
View out S Grid Comparison with surveys
As percentage at view-height 1.70 m for a vertical cone vision of 60° and horizontal field of 360°
Grid-based and path-based TEAs in Table 4 represent assessments taken at points located either on an ideal squared grid or on the walking path as described in the geometry section.
The ideal grid is used as the standardized approach for photometric measurements of day- and electric lighting; the walking path is used as it is of particular interest for the evaluation of this case study. The distance between points in the ideal grid is of two meters and, given the size of the grid, it complies with the European Standards EN17307:2018 for daylighting in buildings (CEN/SIS, 2018) and EN12464-1:2011 for indoor electric lighting (CEN, 2011). The path-based points had a maximum distance of two meters between each other and they were centred in respect to the path. The eye height was set up at 1.70 meters for all the points, since both customers and staff are standing in the space. Figure 9 summarizes the ideal fitting of horizontal grid-based assessments and the reason why it was decided to combine with point-on path vertical evaluations at standing sight. Path-based assessments included both defined horizontal directionality (e.g., vertical illuminance or SPD with four directions) as well as 360° overall horizontal assessment (e.g., cylindrical illuminance).

Daylighting and Electric Lighting Integration in the Retail Sector – A Case Study of the IKEA Kaarst Store
28
Figure 9: Traditional horizontal grid based assessment versus the proposed path based assessment. (Illustration by the author).
In addition to the TEAs listed in Table 4, two indoor illuminance and temperature sensors with datalogging were placed first at the Living Room department for five weeks, and later on in the Home Decoration during two weeks. The logging from these sensors were used only to cross-check some answers from customers and staff surveys. TEAs were carried out using the following professional and calibrated instruments, which are shown in Figure 10 and listed below:
Figure 10: Equipment used during the three monitoring campaigns performed in the store.
a. Two Hobo MX2202 exterior dataloggers for light and temperature, with built-in storage memory and Bluetooth connection,
b. Two Hobo U12-012 interior dataloggers for light, temperature and humidity, with built-in storage memory,
a
b c
d
e, f
g
h i

Daylighting and Electric Lighting Integration in the Retail Sector – A Case Study of the IKEA Kaarst Store
29
c. A Cylindrical illuminance meter Everfine Photo-2000, d. A Spectroradiometer Konica Minolta CL-70F, e. A Hagner spot luminance meter with a calibrated diffusive plate f. A Hagner illuminance meter, g. A camera Nikon D5300 with fisheye lenses to perform HDR images, h. A Hilty PD5 laser range meter, i. An EPS ball for light directionality, j. Two camera tripods.
Complementing the TEAs, a number of building performance simulations were conducted, which is detailed in the Daylight Simulations chapter.
3.3.2.1 Horizontal illuminance Horizontal illuminance measurements were differentiated between exterior longitudinal measurements and interior point-in-time measurements. External horizontal illuminance measurements were performed with two sensors for diffuse and global horizontal illuminance. These sensors were placed on the roof, verifying that they were not shaded by other elements of the building nor by each other. The sensor for diffuse illuminance was covered by a small dome that shielded it from direct sunlight, although not from diffuse light. The global illuminance sensor lacked this element. The lighting conditions were recorded continuously for five weeks with a time step set at one minute. The purpose of these sensors was to:
1. Allow the measurement of DF by a single person 2. Support and cross-check some answers related to lighting perception from the
customers survey
Internal horizontal illuminance measurements were made in the two areas studied. The previously mentioned two-meter ideal grid was used. At each point of the grid, the illuminance meter was placed at a height of 1.70 meters standing atop a tripod. At the beginning and end of each set of measurements, the height of the sensor with respect to the ground was verified. Two sets of measurements were made with and without daylight contribution conditions. Subsequently, the average of the two sets of measurements was calculated and the results were plotted for each of the areas as summarized in Table 5: Table 5: Summary of horizontal Illuminance assessments performed and resulting documents, M = “Measured”.
Zone Type Assessment Date/Time Sky/Sun Output/ Document
Living Room
M Grid 2*2 m
Eh at 1.70 m Daytime
Mars 4th 09:32-10:55
Variable Plan EhLR1, Grid with averaged daytime measurements of horizontal illuminance
Living Room
M Grid 2*2 m
Eh at 1.70 m Daytime
Mars 5th 14:50-15:52
Partly cloudy
Living Room
M Grid 2*2 m
Eh at 1.70 m Night-time
Mars 4th 19:35-20:05
Sunset at 18:18
Plan EhLR2, Grid with averaged night-time measurements of horizontal illuminance
Living Room
M Grid 2*2 m
Eh at 1.70 m Night-time
Mars 5th 19:32-20:02
Sunset at 18:18

Daylighting and Electric Lighting Integration in the Retail Sector – A Case Study of the IKEA Kaarst Store
30
Home decor.
M Grid 2*2 m
Eh at 1.70 m Daytime
Mars 1st 09:54-10:40
Variable Plan EhHD1, Grid with averaged daytime measurements of horizontal illuminance
Home decor.
M Grid 2*2 m
Eh at 1.70 m Daytime
Mars 2nd 13:31-14:35
Variable
Home decor.
M Grid 2*2 m
Eh at 1.70 m Night-time
Mars 1st 19:00-19:55
Sunset at 18:12
Plan EhHD2, Grid with averaged night-time measurements of horizontal illuminance
Home decor.
M Grid 2*2 m
Eh at 1.70 m Night-time
Mars 2nd 21:05-21:50
Sunset at 18:14
It must be noted that it was not possible to perform measurements under full night conditions, as the lighting was turned off ten to fifteen minutes after the store closed, which was at 20:00 Monday to Saturday and 22:00 on Fridays. On Sundays, the shop was closed, and light turned off, besides not being possible the access for security reasons.
3.3.2.2 Cylindrical illuminance It was decided to use the cylindrical illuminance (E𝑧𝑧, cfr CIE 17-273) (CIE, 2019) as this provides a good characterization of the light perceived by customers as they walk throughout the store. In fact, the semi-cylindrical illuminance (Ehz, cfr CIE 17-1160) (CIE, 2019) is a photometric quality criterion which is commonly used for three-dimensional objects, being the human face an ideal application. However, semi-cylindrical illuminance has the limitation of requiring a specific direction, which defines the range of azimuth angles delimiting the portion of cylinder. In other words, we should know where the customer is looking in order to verify the half cylinder of vertical illuminances to be evaluated, see Figure 11 below. By having products around the entire exhibition, customers are free to look around, thereby it was decided that the average of all vertical illuminances coming from the 360 degrees at each point. In this case, cylindrical illuminance (E𝑧𝑧) was the best choice.
Figure 11: The different illuminances considered in the monitoring at a glance. Eh= horizontal; Ev= vertical; Ez= cylindrical; Ehz= semi cylindrical. Illustration courtesy of Trilux Akademie.
Cylindrical illuminance measurements were made at eye level, set to 1.70 meters, for each of the points defined along each department’s path. For every point which previously had been traced on the path the cylindrical illuminance meter was placed on top of a tripod and the measurement performed. Three series of measurements were made for each zone and point, thereafter the average was calculated for both departments, as summarized in Table 6:

Daylighting and Electric Lighting Integration in the Retail Sector – A Case Study of the IKEA Kaarst Store
31
Table 6: Summary of cylindrical illuminance assessments performed and resulting documents, M = “Measured”.
Zone Type Assessment Date/Time Output/ Document
Living Room M Path Ez at 1.70 m Mars 2nd 10:05-10:30 Plan EzLR, Points on path with averaged measurements of cylindrical illuminance
Living Room M Path Ez at 1.70 m Mars 4th 14:50-15:20 Living Room M Path Ez at 1.70 m Mars 5th 18:10-18:28
Home decor. M Path Ez at 1.70 m Mars 2nd 09:05-09:30 Plan EzHD, Points on
path with averaged measurements of cylindrical illuminance
Home decor. M Path Ez at 1.70 m Mars 4th 13:10-13:55 Home decor. M Path Ez at 1.70 m Mars 5th 17:10-17:40
3.3.2.3 Vertical illuminance The monitoring of vertical illuminance (Ev, cfr CIE 17-1397) (CIE, 2019) was also limited to the points defined on the path, placing the illuminance meter vertically and fixed to a tripod, verifying that the sensor was at eye level (1.70 m). For each point, four measurements were taken, rotating 90 degrees horizontally between them. The resulting measurements in lux, or so-called photopic lux, were compared against the equivalent menalopic lux, in order to obtain the corresponding melanopic/photopic ratio of the incident light. That is why the measurements with the illuminance meter and the spectroradiometer should be simultaneous or very close in time. Finally, this was solved by making both measurements with the spectroradiometer, since it also provides illuminance as an output.
3.3.2.4 Spectral power distribution In the context of a furniture store where daylighting is integrated, the resulting light spectrum, from combining electric lighting and daylighting, will play a key role. Particularly with respect to its visual effects, since light is decisive in catching the customer's attention, along with displaying the colours and textures with fidelity. However, the variations in the resulting relative intensity curve of the light perceived could also enhance different potential non-visual effects. Hence, recording the spectral power distribution (SPD) for each of the four directions assigned to every point on the path would enhance the analysis of both visual and non-visual effects on the customers. For non-visual effects, the procedure is further explained in the circadian potential chapter, as these SPD measurements were used as input to derive the corresponding EML. The description of how these measurements were performed on-site is described in the previous chapter, since both Ev and SPD were taken simultaneously. A single set of measurements was made for each of the two paths analysed, as it was time-consuming to measure the four directions at every point. The spectral measurements were made on the following dates summarized in Table 7.
Daylighting and Electric Lighting Integration in the Retail Sector – A Case Study of the IKEA Kaarst Store
32
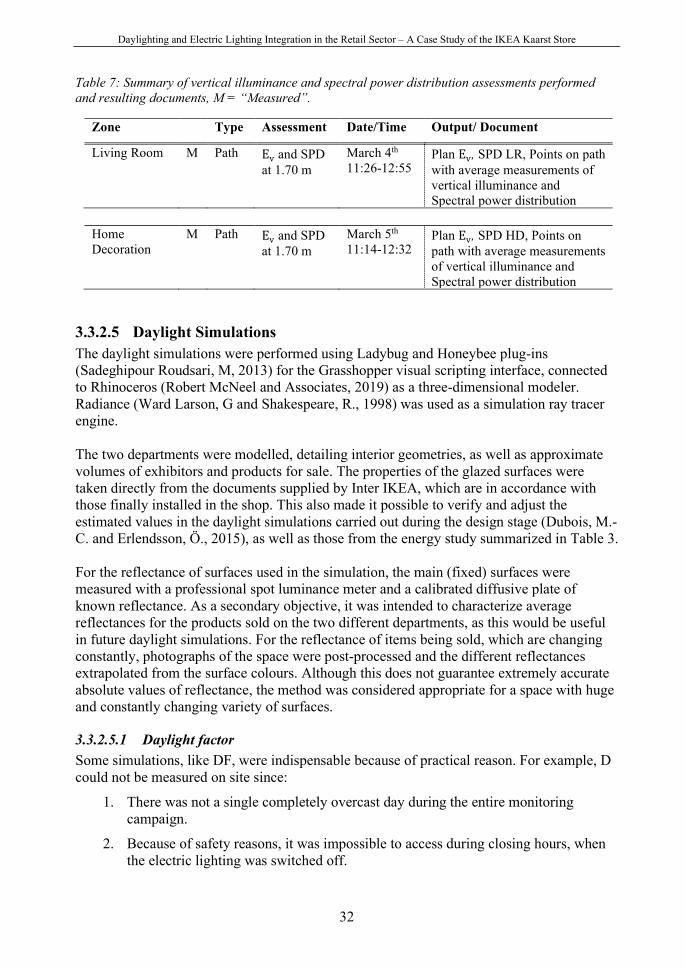
Table 7: Summary of vertical illuminance and spectral power distribution assessments performed and resulting documents, M = “Measured”.
Zone Type Assessment Date/Time Output/ Document
Living Room M Path Ev and SPD at 1.70 m
March 4th 11:26-12:55
Plan Ev, SPD LR, Points on path with average measurements of vertical illuminance and Spectral power distribution
Home Decoration
M Path Ev and SPD at 1.70 m
March 5th 11:14-12:32
Plan Ev, SPD HD, Points on path with average measurements of vertical illuminance and Spectral power distribution
3.3.2.5 Daylight Simulations The daylight simulations were performed using Ladybug and Honeybee plug-ins (Sadeghipour Roudsari, M, 2013) for the Grasshopper visual scripting interface, connected to Rhinoceros (Robert McNeel and Associates, 2019) as a three-dimensional modeler. Radiance (Ward Larson, G and Shakespeare, R., 1998) was used as a simulation ray tracer engine. The two departments were modelled, detailing interior geometries, as well as approximate volumes of exhibitors and products for sale. The properties of the glazed surfaces were taken directly from the documents supplied by Inter IKEA, which are in accordance with those finally installed in the shop. This also made it possible to verify and adjust the estimated values in the daylight simulations carried out during the design stage (Dubois, M.-C. and Erlendsson, Ö., 2015), as well as those from the energy study summarized in Table 3. For the reflectance of surfaces used in the simulation, the main (fixed) surfaces were measured with a professional spot luminance meter and a calibrated diffusive plate of known reflectance. As a secondary objective, it was intended to characterize average reflectances for the products sold on the two different departments, as this would be useful in future daylight simulations. For the reflectance of items being sold, which are changing constantly, photographs of the space were post-processed and the different reflectances extrapolated from the surface colours. Although this does not guarantee extremely accurate absolute values of reflectance, the method was considered appropriate for a space with huge and constantly changing variety of surfaces.
3.3.2.5.1 Daylight factor Some simulations, like DF, were indispensable because of practical reason. For example, D could not be measured on site since:
1. There was not a single completely overcast day during the entire monitoring campaign.
2. Because of safety reasons, it was impossible to access during closing hours, when the electric lighting was switched off.

Daylighting and Electric Lighting Integration in the Retail Sector – A Case Study of the IKEA Kaarst Store
33
The DF simulations were carried out designating a horizontal area to evaluate the entire surface of each department, deducting the perimeter spacing and respecting the maximum size of the ideal grid defined in the EN 17037:2018 Daylight in buildings standard (CEN, 2018). Taking advantage of the necessity to carry out the simulations, the influence on the results of the following aspects was verified:
1. Different offset heights from the floor analysed: o 0 m: In order to verify DF reaching the floor o 0.85 m: Typical height for DF simulations, based on tasks needing high
levels of light at desk height, as offices and schools o 1.70 m: Being the eye-height for customers at the store
2. Shelves and items being sold: o Previous heights with shelves and items o Previous heights without shelves and items
3. Different simulation quality settings: o Previous iterations at Radiance quality accuracy low (aa = 0.25, ab = 2) o Previous iterations at Radiance quality accuracy medium (aa = 0.2, ab = 3) o Previous iterations at Radiance quality accuracy high (aa = 0.1, ab = 6)
3.3.2.5.2 Daylight autonomy The choice of a dynamic daylight performance metric was judged suitable to verify the optimal area of the department that should implement daylight harvesting. Since this project is based on the monitoring of an existing store, the objective was to evaluate the area in which the DHS had been implemented. For this purpose, the most useful metric according to literature (Reinhart et al., 2006) was the daylight autonomy (DA). Intuitively, DA gives an insight into how well daylight will penetrate space, although its results will depend on the target Eh set and the fraction of time analysed, in this case the real opening schedule. The target Eh value assigned for DA calculations is specified in the results section, as it is based on the measured Eh���� at each department. However, the methodology applied was to choose between one of the Eh benchmarks defined in the EN 17037:2018 Daylight in buildings standard (CEN, 2018), with a minimum compliance of 300 lux, a middle compliance of 500 lux and an optimal compliance of 750 lux. The choice of the target Eh for the DA calculation had to achieve a balance between maximizing the area of harvested luminaires (savings), and not generating disturbing contrasts (comfort) within that area while being representative of the real lighting usage at each department. In other words, the lower the target Eh, the greater the DHS area that reaches the same DA, resulting in greater energy savings. However, the risk of visual discomfort by contrast is increased, and vice versa when the Eh target increases.
3.3.2.5.3 Annual direct sun hours In order to assist in evaluating areas of potential risk of glare for customers, it was decided to calculate the annual direct sun hours, quantifying the number of hours that directly hit a horizontal surface at 1.70 m, mimicking the eye height of customers. Of the total number of hours that the store remains open during a year, areas with a high risk of glare were identified as those that receive more than 300 hours of direct sunlight, and glare free areas below 20 hours per year. Zones that receive between 20 and 300 hours were defined as at moderate risk, as the probability that a client will coincide in that time interval over an entire year is very small. In addition, this zone of direct sun occur mainly during part of the

Daylighting and Electric Lighting Integration in the Retail Sector – A Case Study of the IKEA Kaarst Store
34
winter solstice and part of the spring and autumn equinoxes, times of the year in which direct sun is not usually identified as a nuisance.
3.3.2.5.4 Daylight glare probability At the points where the main path of the customers crossed a high-risk area, as detailed in the previous chapter, the risk was verified by calculating the daylight glare probability (DGP). Once the points in the path with higher risk were selected, the height was set at 1.70 m and the camera was rotated to focus onto the window from which the direct sunlight was coming. This was done by means of daylight simulations which generated the HDR images with fish-eye lenses, needed to assess the perceived luminance values and, therefore, calculate the DGP. For every position and day selected, an interval of one capture per hour was generated and evaluated. The DGP performance obtained was classified according to the range categorization proposed in EN 17037 (CEN, 2018), which is shown in Table 8. Table 8: DGP results assessment criteria from EN 17037 “Daylighting in Buildings”(CEN, 2018).
DGP
Criterion
DGP ≤ 0.35 Glare is mostly not perceived 0.35 < DGP ≤ 0.4 Glare is perceived but mostly not disturbing
0.4 < DGP ≤ 0.45 Glare is perceived and often disturbing
DGP ≥ 0.45 Glare is perceived and mostly intolerable Indeed, the selection of the points from where to assess the risk or not for the glare to occur was not as evident as it could be e.g. in an office or school, where the position and main views of the occupants are predefined. In this study the occupants, who are the customers, can freely walk across the entire department and look at any direction. In the same way, they could also easily avoid the source of glare by simply rotating the view or moving slightly. Therefore, the evaluation focused on the main pathways along each department, as they are the areas of greatest transit for customers. Moreover, it is along these paths that the daylight glare might be particularly disturbing and disorienting to users.
3.3.2.5.5 View out The major difference between this case study and nearly all existing literature in retail monitoring is that it features numerous side windows in the sales and exhibition areas, thus allowing views both outside and inside. As already mentioned in the background and literature research chapter, the assessment of the views out will be supported in the assessment of three different parameters:
1. External distance of the view ≥ 20 m 2. Minimum of two layers included in the view from the 75% of the area. These two
layers being landscape and ground or sky 3. A view factor of 4 under the view out rating developed by HMG. See figure Figure
12.

Daylighting and Electric Lighting Integration in the Retail Sector – A Case Study of the IKEA Kaarst Store
35
Figure 12: On the left, thumbnails representing the view factor rating based on view angle, source (Heschong, 2003a). On the right the corresponding view angles to each view factor scenario. When the resulting view angle (highest between vertical or horizontal) falls in the grey zone, it would be rated up or down a level depending on, whether or not the view has a high vegetation content.
Parameters (1) and (2) define the quality of the view out, and they were assessed by means of a visual inspection during the first monitoring visit. The view factor assessment (3) sizes the effective view angle, so it could also be defined as the quantity of the view out. The view angle was assessed for the entire area of each of the departments studied, by means of a customized daylight simulation. The simulation process is detailed in the daylight simulation chapter. For the view angle simulation, a horizontal mesh of points representing the area of the studied department in the store was used. The mesh was defined with cells of 25 by 25 centimetres at an eye height of 1.70 m. The fact of using a denser number of points in the studied area was justified for being the view angle very sensitive to small changes in the position. Therefore, using bigger mesh cells (as the ones used for the DF) could be misleading. Additionally, this simulation is much less time-consuming compared to DF or DA, as the surface reflectances and, therefore, ambient bounces, are not considered. The objective is to account for the angle between the vectors that were not obstructed and crossed through the glazed surface (vectors in green in Figure 13) from every point. In Figure 13, the vectors that were generated at each point can be also seen, creating a vertical cone of vectors of 60 degrees, where the human horizontal view field is not limited, thus it can freely rotate 360-degree horizontally . In other words, allowing people to look all around in a horizontal manner.
View Factor Rating
View angle Min-Max (degrees)
Min-Max (degrees)
1 1 - 4 1 or 2 4 - 5 2 5 - 9 2 or 3 9 - 11 3 11 - 15 3 or 4 15 - 20 4 20 - 40 4 or 5 50 - 90 5 50 - 90

Daylighting and Electric Lighting Integration in the Retail Sector – A Case Study of the IKEA Kaarst Store
36
Figure 13: Illustration of the evaluation of the potential of external views from each point of the grid. By means of computer simulation, vectors are cast with a vertical cone of 60 degrees and 360 degrees horizontally. The vectors going through the window (with view out) are shown in green on the right 3D visualization as an illustrative example. (3D visualization courtesy of Chris Mackey). Note: The density of vectors has been reduced to make the visualization clearer.
Although the vertical angle of view is not limited to 60 degrees, literature supports that the visual comfort band and ergorama are approximately in the range of 40 to 60 degrees respectively (Dubois et al., 2019). For the purpose of this assessment, selecting a 60 degree vision cone proved to be especially useful, as L.Heschong's view factor method is based on measuring the effective angle of view, both horizontally and vertically, and attributes the maximum score starting at 50 degrees. This can be seen in figure 12, which shows how the view factors are rated from 1 to 5. Therefore, a 60-degree vertical and 360-degree horizontal angle allows the views of the room to be evaluated satisfactorily within the full range of this method while optimizing the number of vectors calculated. Finally, the justification for having chosen the view angle/factor procedure, over the "horizontal sight " procedure proposed in EN 17037 (CEN, 2018), is that for the first one, both vertical and horizontal view angles are accounted for as view to the outside, while the second only takes into account the horizontal. This is relevant in a scenario where the user is standing and moving, with freedom to adjust the vertical and horizontal field of view. Moreover, the height of the elements that can block the view is not homogeneous, thus by only assessing the horizontal sights, the results may be misleading. For a better understanding, Figure 14 shows the representation of how the vertical and horizontal view angles are accounted for in the proposed view out assessment.

Daylighting and Electric Lighting Integration in the Retail Sector – A Case Study of the IKEA Kaarst Store
37
Figure 14: Illustration of the view angle assessment method through horizontal and vertical view angles. (Illustration by the author).
To quantify the floor area that had access to a quality view of the exterior, this was defined as that which had a viewing factor of 4 or greater, meaning that it had a vertical or horizontal viewing angle of 20 degrees or greater, as detailed in Figure 12.
3.3.3 Circadian potential The circadian potential of the spaces was assessed based on the SPD measurements taken during daytime on different days for each department, as summarized in Table 7, at standing view-height. The assessment was performed at each of the points assigned to main path for costumers, looking at four different directions (see Table 4). This point-in-time well represented an average daylit scenario for the department. The procedure performed for the SPD measurements, as well as the time and sky conditions at which every set of measurements occurred, is detailed at the spectral distribution chapter. The SPDs were processed through the irradiance toolbox excel spreadsheet developed within the research paper “Measuring and using light in the melanopsin age” by (Lucas et al., 2014). Each of the measured SPDs was derived and the resulting equivalent melanopic lux (EML) was obtained. Thereafter, the ratio between the equivalent Melanopic and Photopic lux (M/P) was calculated, and the categories shown in Table 9 assigned. Table 9: Melanopic/photopic ratio and related non-visual effects. Values retrieved from the software Alfa (Solemma, 2018).
Melanopic lux/ Photopic lux Spectral Melanopic weighted Melanopsin non-visual Effect
M/P > 0.9 Intense Blue Alertness
0.35 < M/P < 0.9 Neutral Neutral
M/P < 0.35 Blue depletion Calming
These categories weight the non-visual effects of the measured or simulated light spectrum, derived from the ratio between melanopic and photopic lux. This simplifies the information about the predominant wavelength colour in the SPD as perceived by the human eye. As a reference, the daylight’s M/P ratio is set to 1.10. It is worth mentioning that the M/P ratio is

Daylighting and Electric Lighting Integration in the Retail Sector – A Case Study of the IKEA Kaarst Store
38
a normalisation and does not take into account the intensity delivered, only the SPD being analysed. This is useful when comparing the "quality" of the light independently of its "quantity", but it also has its limitations, since the variation in intensity, especially in sudden changes, can affect the visual comfort of the user.
3.3.4 User perspective In addition to the data obtained from the TEAs, different types of longitudinal OBEAs, namely closed and open-ended questionnaire surveys, were carried out for both customers and staff working in the store. The OBEAs were carried out in the two studied areas and at the cash line/exit. Customer surveys consisted of five-point rating scales with additional space for free comments. The surveys were accessible online through QR codes included in panels at the different areas for a period of two months. The QR codes were located on walls signs and roll-ups placed at the entrance and exit of each analysed area. By scanning the QR code, the client had access to a web-based questionnaire, which was automatically submitted once the last question was answered. Date and time of submission were automatically recorded. The survey was anonymous, but the respondent could voluntarily decide to submit gender and age. The survey was per area and not per customer, meaning that there is no possibility to know if who replied to the survey in an area was the same customer replying at the cash line/exit. The three different forms employed in the Costumers surveys are available in the following Appendixes : 8.4 Costumers survey - Living Room, 8.5 Costumers survey - Home Decoration and 8.6 Costumers survey - Overall shopping experience). Surveys at the two studies’ areas included questions on the overall evaluation of the lighting in the space and the views out, as well as self-reported mood, willingness to buy, thermal comfort and alertness. The survey at the exit included questions on the perceived shopping experience, and comparison with other ordinary stores of the same branch that were previously visited by the customer. In order to enhance maximum participation, flyers were distributed at the entrance, restaurant and exit, where the project was shortly described, and different zones studied with their corresponding QR code where shown, in order to encourage participation. (Figure 15).
Figure 15: Flyers with QR codes distributed to customers in the store.

Daylighting and Electric Lighting Integration in the Retail Sector – A Case Study of the IKEA Kaarst Store
39
Photographs illustrating how the OBEAs were implemented in situ can be seen in Figure 16.
Figure 16: Photographs of the panels and roll-ups installed in the three studied areas to promote participation from the clients in the three different surveys.
The survey of the employees consisted of open-ended questions. The questions were provided in a web-based questionnaire which was accessible through a link provided by e-mail. This form can be seen at the Appendix 8.7 Survey to the staff. Even in this case the answers were anonymous, but respondents were asked to provide their role (facility management, marketing, management or sales team). Employees were asked about lighting in the space, views, and the implications for their daily working experience, both in the studied areas and the overall store. Taking advantage that most of the staff had been working at the previous store in Kaarst, which was provided with little daylight, co-workers were asked to compare both the old and new store.

Daylighting and Electric Lighting Integration in the Retail Sector – A Case Study of the IKEA Kaarst Store
40
4 Results and discussion The results derived from the application of the proposed method will follow the same structure on which the monitoring protocol defined above is based, namely energy, photometry, circadian potential and user perspective. Table 10 gathers the main results obtained from the energy and photometry assessments in the two studied areas, with the aim of interpreting and comparing them at a glance. These and the rest of the results are further detailed throughout this chapter. Table 10: Summary of energy and photometric results, M = “Measured”, C = "Calculated", S = “Simulated”, E = “Extrapolated”.
Assessment Unit Living Room
Home Decoration
Benchmark (Reference)
Energy for lighting Power Density [W/m2] M 7.8 16.3 - LENI [kWh/m2 y] C 40.3 84 78.1
(EN 15193) Energy for Heating and Cooling Peak Load Cooling [W/m2] S 51.5 56.6 - Peak Load Heating [W/m2] S 11.3 13.5 - Energy Use Cooling [kWh/m2 y] S 19.5 26.3 - Energy Use Heating [kWh/m2 y] S 22.8 27.6 - Photometry Reflectances Floor/Wall/W.Frame
[%] M 66/ 86/ 90 24/ 91/ 83 20/ 50 / - (EN 17037)
Reflectances Furniture, products
[%] E 28 35 -
Horizontal Illuminance Daytime/Night-time
[lux] M 627/600 1456/1011 750 (EN 12464)
Cylindrical Illuminance 𝑝𝑝𝑝𝑝𝑝𝑝ℎ �̅�𝑥, Uniformity
[lux] M 175, 𝑈𝑈𝑈𝑈 = 0.6 770, 𝑈𝑈𝑈𝑈 = 0.3 >150, 𝑈𝑈𝑈𝑈 ≥ 0.1 (EN 12464)
Daylight Factor �̅�𝑥 Height 0.85 m Height 1.70 m
[%] S 0.9 0.5
1.5 1.2
4.4 (750 lux) - (EN 12464)
Daylight Autonomy [%] S 62 (DA300) 55 (DA750) >50 Annual Direct Sunlight Hours
[area %] S 27 > 30 hours 92 > 30 hours -
Daylight Glare Probability
[%] S 31 100 <35 (EN 17037)
View Out Factor [area %] S 41 with a view factor ≥ 4 52 with a view factor ≥ 3
95 with a view factor ≥ 4 97 with a view factor ≥ 3
50 with a view factor ≥ 3 (LEED V4/4.1)
Others
Window to Wall ratio [%] C 11 44

Daylighting and Electric Lighting Integration in the Retail Sector – A Case Study of the IKEA Kaarst Store
41
4.1.1 Energy The integration of daylighting and electric lighting by means of daylight harvesting led to energy savings. However, compared to having the lights fully on, these savings were limited. Indeed, energy use was reduced only by 1.1 and 0.6 𝑘𝑘𝑘𝑘ℎ/𝑚𝑚2𝑦𝑦 depending on the area (Table 11), most probably because the dimmed fixtures are already very efficient (138 𝑙𝑙𝑚𝑚/𝑘𝑘) and they have a low wattage (17 W per unit) (Table 2). It is worth mentioning that the calculated LENI value in the Living Room department is about half of the benchmark provided by EN15193:2007 (CEN, 2007). Table 11: Energy use for lighting through LENI in the studied zones with daylight integration and with no daylight integration.
Studied Area
Power Density
LENI*1 DHS
LENI*1 No DHS
LENI*1 E. Savings
LENI*2 Benchmark
[𝑘𝑘/𝑚𝑚2] [𝑘𝑘𝑘𝑘/𝑚𝑚2 𝑦𝑦] [𝑘𝑘𝑘𝑘/𝑚𝑚2 𝑦𝑦] [𝑘𝑘𝑘𝑘/𝑚𝑚2 𝑦𝑦] [𝑘𝑘𝑘𝑘/𝑚𝑚2 𝑦𝑦]
Living Room 7.8 40.3 41.4 1.1 78.1
Home Decoration 16.3 84 84.7 0.6 *1: EN 15193-1:2017, *2: EN15193:2007
On the other hand, the results at Home Decoration are clearly above the LENI upper limit defined for that type of building, which was predictable from the high figure of power density installed. In addition, the difference in luminaire density of the HD is mainly driven by LED spotlight type typologies, with a luminous efficacy (75 lm/W) that is almost half as efficient compared with the ambient ones (Table 2). Moreover, spotlights are not dimmable. During the visits, it was possible to verify that this increase in luminaires was based on two very specific points of the department, where many spot luminaires were concentrated, as well as the presence of the CCT tunable or HCL luminaires. The latter are the most powerful (54 W) per unit in the store, despite having the highest luminous efficacy (143 lm/W). This is because these HCL luminaires work by mixing two light sources in the same fixture, one of CCT 2700K and another of CCT 6500 K, which, when combined dynamically, provide the colour tuning by following the pre-established sun-like daily profile. An analysis was made on the impact of these groups of spotlight fixtures into the total energy consumption of the HD department. Table 12 shows the resulting LENI breakdown of the two groups of spotlights A and B, along with the HCL LEDs. Regarding the location of these within the department, it can be seen in Figure 15 that the group of spotlights (A) are hanging from the ceiling and turning all around a tower-shaped plant shelf in the corner of the department, just in front of the windows (Figure 7). Group B are all the LED spots which are lighting the shelves in front of the windows. It is noteworthy that by just removing one of these groupings, or reducing them slightly, the resulting LENI would be comfortably within the limits of EN15193:2007 (CEN, 2007).

Daylighting and Electric Lighting Integration in the Retail Sector – A Case Study of the IKEA Kaarst Store
42
Table 12: Energy use for lighting breakdown of the zones A and B with high concentration of LED spotlights and LED HCL panels.
Studied Area
LENI TOTAL
LENI Energy Savings Spots A OFF
LENI Energy Savings Spots B OFF
LENI Energy Savings HCL OFF
[kWh/m2 y] [𝑘𝑘𝑘𝑘/𝑚𝑚2 𝑦𝑦] [𝑘𝑘𝑘𝑘/𝑚𝑚2 𝑦𝑦] [𝑘𝑘𝑘𝑘/𝑚𝑚2 𝑦𝑦]
Home Decoration 84 13.08 19.03 20.54
Figure 17: Location of the groups of lighting fixtures A and B within the Home Decoration department.
With regard to the impact of windows on thermal loads and energy use in the two departments, Figure 16 shows the grouped results for heating and cooling. The actual and windowless scenarios were simulated, as detailed in the methodology chapter. In HD, the increased thermal conductivity of widely glazed façades, which also facilitates solar gains penetration, enhances the cooling load (57 W/m2) compared to LR (52 W/m2) in the real windows scenario. The heating load is also higher in HD with 13.5 W/m2 due to increased heat losses together with the Northwest orientation that limits the solar gains compared to the perfect south facing main window in LR contributing to a heating peak load of 11 W/m2.
A B B

Daylighting and Electric Lighting Integration in the Retail Sector – A Case Study of the IKEA Kaarst Store
43
Figure 18: Thermal load and energy use impact by the glazed surfaces.
Conversely, in a scenario without windows, cooling loads are higher in the LR department (48 W/m2), most likely because the department is south facing and located on the first floor, therefore with the roof on top. This is relevant, as both the façade and the roof receive a large amount of solar radiation, which results in a significantly higher quantity of heat flow towards the interior, compared to the HD department (42 W/m2). The latter, being on the ground floor and facing northwest, is better guarded against solar radiation. The above-mentioned characteristics are seemingly in balance at the heating load, where LR (7 W/m2) and HD (6 W/m2) are practically the same. Figure 18 also shows the results of annual primary energy use simulations, where it can be seen that in both departments the energy use for heating is greater than cooling, both with and without windows. The good performance of the LR department in terms of the used energy for heating is noteworthy, since after adding the windows, the annual energy increase is only 0.9 kW/m2 y. This is slightly less than the 1.1 kWh energy savings for lighting provided by daylight (Table 11). Consequently, at LR, the addition of modest windows does not lead to higher energy consumption during the cold months. It is not so in the summer months, where the absence of solar protection systems in windows facing south and east is one of the main reasons for raising the use of cooling from 15.2 to 19.5 kW/m2 y. In HD, the addition of large windows, with a WWR of 44% according to Table 4, doubles the use of energy for heating and also cooling, as shown in Figure 18.
4.1.2 Photometry Photometric evaluation provided results on a diverse amount of measured and/or computer-simulated assessments, as recapped in Table 10. During the first visit to the store, the main (fixed) surfaces’ reflectance were measured in situ and the most relevant results of are shown in Table 10. The average reflectance of the products sold in the two different departments required a post-processing, which results as follows:
• Products being sold in the Living Room department, average of 25 photographs: Reflectance = 28 %
2023
15
22
52
11
48
7
26 28
1316
57
13
42
6
0
10
20
30
40
50
60
Cooling Heating Cooling Heating
Windows No windows
Peak
Loa
d/ W
m-2
LR Energy use (kWh/m2·y) LR Peak load (W/m2) HD Energy use (kWh/m2·y) HD Peak load (W/m2)

Daylighting and Electric Lighting Integration in the Retail Sector – A Case Study of the IKEA Kaarst Store
44
• Products being sold in the Home Decoration department, average of 32 photographs: Reflectance = 35 %
4.1.2.1 Horizontal illuminance The average results of the on-site measured Horizontal Illuminance (Eh���) are displayed in Figure 19. In the LR area, the average illuminance for the grid assessment is virtually unchanged during daytime, with 627 lux, and during night-time only decreases to 600 lux, as the daylit area is small. Thus, daylighting is adding very little “quantity” of horizontal illuminance in the LR department. However, daylighting improves light uniformity in the space, raising from a uniformity (U = Eh, min / Eh��� , cfr CIE 17-552) (CIE, 2019) of 0.03 at night-time to 0.12 during daytime, since the electric lighting in front of the windows is very little.
Figure 19: Average horizontal illuminance with and without Daylight Contribution for the grid-based assessments.
On the contrary, daylighting in HD increases the average horizontal illuminance of the space by almost a third during daytime, reaching 1456 lux, in respect to the electric lighting scenario with an average of “only” 1011 lux. This means that daylight flowing through the existing windows contributes strongly to increasing the average measured horizontal illuminance. The uniformity remains practically unchanged, reducing from 0.21 to 0.20. The day and night measurements made for each department were recorded in a grid of points that allowed the Eh��� to be calculated for each of the four scenarios. Such measurements can be found in the Appendixes 8.2 and 8.3.
4.1.2.2 Cylindrical illuminance The measured cylindrical illuminance during daytime was between 106 lux to 180 lux along the pathway in the Living Room. At Home Decoration, the recorded values on the path were ranging from 259 lux to 1329 lux. Figure 20 includes all the measurements carried out for each set of points along the two departments.
627 600
1456
1011
0
500
1000
1500
2000
2500
Daytime Night-time Daytime Night-time
Living Room Home Decoration
Hor
izon
tal I
llum
inan
ce /
lux

Daylighting and Electric Lighting Integration in the Retail Sector – A Case Study of the IKEA Kaarst Store
45
Figure 20: Cylindrical illuminance measured for the LR (Left) and HD (Right) departments.
Daylight practically does not affect the result of (Ez) in LR, as the windows are located further away the main flow of customers. Conversely, in HD the cylindrical illuminance is boosted when customers are in the vicinity of the windows. This is in line with the measurements of horizontal illuminance, which showed lower light levels and more uniformity for the Living Room. In fact, Ez 's results along the path are very illustrative of how customers perceive the two departments and how natural light influences the amount of light perceived. In addition, a single diurnal measurement set was sufficient, and the number of measured points was approximately 80% lower compared to the ideal horizontal grid measurement of points. Another important aspect is that as the results are an average of the measured vertical illuminances, they are not so affected by spotlight high light intensities that they can confusingly alter the Eh measurements. Therefore, this is very useful in a retail context where the use of spotlights is common.

Daylighting and Electric Lighting Integration in the Retail Sector – A Case Study of the IKEA Kaarst Store
46
4.1.2.3 Daylight Simulations
4.1.2.3.1 Daylight factor Regarding daylight factor assessment, the average and median results are summarized in Table 13 below. Table 13: Daylight factor results at different heights and modelling of the furniture.
Analysis Height [m]
Average DF [%]
Median DF [%]
Living Room Home Decoration Living Room Home Decoration
No Furniture modelled
0 1.3 3.1 0.6 1.6
0.85 1.0 2.2 0.4 1.0 1.70 (eye-level) 0.6 1.5 0.3 0.8 Furniture modelled
0 0.7 1.5 0.2 0.3
0.85 0.9 1.5 0.3 0.5 1.70 (eye-level) 0.5 1.2 0.2 0.6
The average DF for the Living Room area at eye level is practically the same whether the furniture was modelled or not (DF of 0.5 and 0.6 respectively). This can be explained by the fact that most of the items sold are rather low, such as accessory tables, couches and armchairs that rarely exceed one meter in height. In fact, in areas near the windows, it was verified that due to the reflection of daylight beams on the furniture, some values of DF at 1.70 m were even higher compared with the modelled furniture scenario.
At the Home Decoration department, the simulated DF at eye level is 1.2 and 1.4 % with and without furniture respectively. Although the shelves in this section are significantly higher, most do not exceed the height of the customers' view. It is also noticeable that
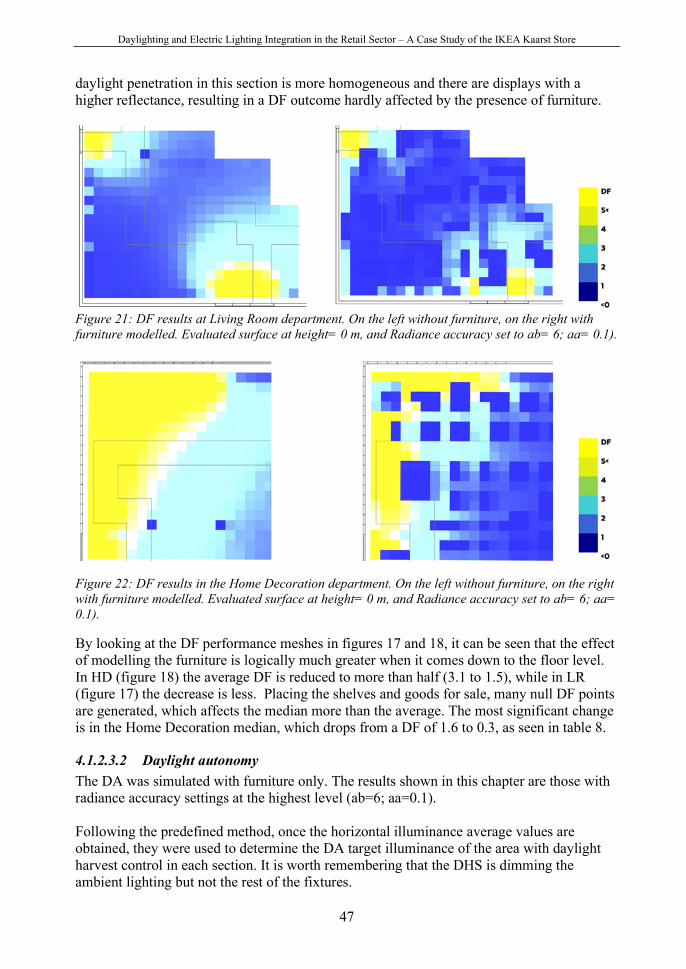
Daylighting and Electric Lighting Integration in the Retail Sector – A Case Study of the IKEA Kaarst Store
47
daylight penetration in this section is more homogeneous and there are displays with a higher reflectance, resulting in a DF outcome hardly affected by the presence of furniture.
Figure 21: DF results at Living Room department. On the left without furniture, on the right with furniture modelled. Evaluated surface at height= 0 m, and Radiance accuracy set to ab= 6; aa= 0.1).
Figure 22: DF results in the Home Decoration department. On the left without furniture, on the right with furniture modelled. Evaluated surface at height= 0 m, and Radiance accuracy set to ab= 6; aa= 0.1).
By looking at the DF performance meshes in figures 17 and 18, it can be seen that the effect of modelling the furniture is logically much greater when it comes down to the floor level. In HD (figure 18) the average DF is reduced to more than half (3.1 to 1.5), while in LR (figure 17) the decrease is less. Placing the shelves and goods for sale, many null DF points are generated, which affects the median more than the average. The most significant change is in the Home Decoration median, which drops from a DF of 1.6 to 0.3, as seen in table 8.
4.1.2.3.2 Daylight autonomy The DA was simulated with furniture only. The results shown in this chapter are those with radiance accuracy settings at the highest level (ab=6; aa=0.1). Following the predefined method, once the horizontal illuminance average values are obtained, they were used to determine the DA target illuminance of the area with daylight harvest control in each section. It is worth remembering that the DHS is dimming the ambient lighting but not the rest of the fixtures.

Daylighting and Electric Lighting Integration in the Retail Sector – A Case Study of the IKEA Kaarst Store
48
In Home Decoration 750 lux was chosen. Although the average results in this area are above 1500 lux during daytime, it is also true that in analysing the results, it must be remembered that these high average values come from fixtures that are not dimmable (Table 2). Since the objective of the DA calculation was to evaluate the area size with DHS in the context of each area, 750 lux were judged to be appropriate, i.e. benchmarking the optimal compliance of EN 17037:2018 Daylight in buildings standard (CEN, 2018). Indeed, selecting an illuminance 𝐷𝐷𝐷𝐷𝐻𝐻𝐻𝐻𝐻𝐻𝐻𝐻𝐻𝐻𝐻𝐻𝐻𝐻𝐻𝐻, which is around 50% of the expected total average illuminance output seems to be a good strategy for the ambient lighting, otherwise the size of the DHS would be too small. At the LR department, DALRtarget was set to 300 lux, being around half of the Eh��� measured (Figure 19), and benchmark recommended in EN 12464-1:2011 (CEN, 2011) to define a well daylit space. According to the measured illuminances in HD, the DAHDtarget of 750 lux defining an extremely well daylit space was selected for the DA assessments in that department.
Figure 23: DA350 assessment of the DHS zone in the Living Room department.
Figure 23 and Figure 24 illustrate the DA results, during opening hours, for LR (62%) and HD (55%) respectively. Both results seem acceptable but could be improved just by reshaping the areas. In the LR, the luminaires in the upper left corner of the harvested area could be connected to the fixed or “always ON” circuit, from which some other fixtures next to the lower left and upper right corner of the DHS area could be switched and connected to the DHS in return. This would improve the DA results by keeping, or even increasing, the same area.
62%

Daylighting and Electric Lighting Integration in the Retail Sector – A Case Study of the IKEA Kaarst Store
49
Figure 24: DA750 assessment of the DHS zone in the Home Decoration department.
On the other hand, the DHS area at Home Decoration HD, delimited in dashed lines in Figure 24, would appear to be well-shaped. However, it is detrimentally affected in the DA results by the presence of the large corner tower and other high-rise displays in front of the north windows.
4.1.2.3.3 Daylight glare probability In order to identify areas with higher glare risk, a preliminary analysis of area with direct sunlight was performed. As can be seen in Figure 25, in the LR department, only 27% of the surface receives more than 20 direct hours of sunshine per year. The opposite result was obtained in the department of Home Decoration where the percentage goes up to 92%.
Figure 25: Annual direct sun light hours at eye height (1.70 meters) for the Living Room (Left) and the Home Decoration departments (Right).
Overlaying these results to the suggested walking path and considering the period of the year in which the surveys were conducted, two positions along the paths with potential glare risk were identified, as shown in Figure 25. Daily simulations run for February 15th with one
55%
Risk of glare

Daylighting and Electric Lighting Integration in the Retail Sector – A Case Study of the IKEA Kaarst Store
50
hour time step for these points show the highest DGPs as in Figure 26 :
Figure 26: Highest DGP recorded on the path during the survey period at the studied departments.
Glare can be experienced only in the Home Decoration section, at 16:00. However, this setting does not seem to be a big concern, as the shelves in front of the windows are usually full of plants and these plants help to sift the sunlight, producing a pleasant greenish glow. This seems to be one of the reasons for the shelves being there. It seems that the path in both areas and the location of certain furniture has been studied with the aim of mitigating glare, which appears to be confirmed by the fact that the interior roll-up screens available in Home Decoration have hardly been used, as confirmed by the department's sales staff
4.1.2.3.4 View out Concerning the views out, the LR area obtained 39% of the area having a qualified good view-out (view factor 4 or higher), while at the HD the percentage reached 95% of the floor area. Consequently, it was observed that although in LR the glazed surface is 4 times smaller, the percentage of area with good view out is just 41 percent lower.
Figure 27: View out assessment on the two departments. Simulated with furniture and shelves.
The results of the view out assessment are shown in Figure 27, where the percentage of vectors able to go through the window from every point is displayed. View factor 4,

Daylighting and Electric Lighting Integration in the Retail Sector – A Case Study of the IKEA Kaarst Store
51
described in the method section, corresponds to a view factor angle of 20 degrees or greater, which translates to 2% of the full 360-degree field of view. Therefore, all the areas in green or blue in Figure 27 have the potential to enjoy a view factor of 4 or higher when looking to the closest window. The potential view out was also assessed when decreasing the view factor to 3, which translates into a minimum view angle of 11 degrees (Figure 12). This was done in order to verify that the LR area was fulfilling the LEED’s benchmark of 50% of the area with view factor ≥ 3, which proved to be successful; the result was 52% and 97% for LR and HD respectively (Table 10).
4.1.3 Circadian potential The M/P ratio was higher than 0.9 in most of the points of view where a window was within the visual field, even if the window was not close. Comparing the results of the two zones (Figure 28), it could be noticed that they were quite similar although the number and size of the windows are very different. It could therefore be deduced that a minimum daylight contribution makes the M/P ratio high, being Daylight’s M/P ratio 1.10 (International Well Building Institute, 2017a).
Figure 28: M/P ratio along the path for the Living Room (Left) and Home Decoration (Right) departments.
Figure 29: Spectral power distribution curves from points 188 and 196. The location of the points is highlighted in Figure 28.
However, it is essential that the view towards windows is unobstructed and electric lighting is minimized in such direction. Indeed, it was noticed that some areas of the Home
Daylighting and Electric Lighting Integration in the Retail Sector – A Case Study of the IKEA Kaarst Store
52
Decoration area, including electrically illuminated elements in the field of vision, had much lower M/P ratios despite being close to windows. This is illustrated in Figure 29, where the SPD assessments and derived EML are shown for point 188 and 196. These two views are looking perpendicularly at the window, as well as being at the same distance from it (Figure 28). The only difference is that in 188, an electrically illuminated object interferes with part of the visual field. The resulting photopic lux were halved to 188, but the most remarkable feature is that the M/P ratio went from 0.99 to 0.86 just by interposing the shelving.
4.1.4 Users’ perspective The surveys were responded to by the following number of individuals:
• Living Room area (LR): 42 customers and 6 co-workers • Home Decoration (HD): 48 customers and 6 co-workers • Cash/line overall shopping/working experience: 63 customers and 6 co-workers
Customers were asked to assess whether daylight was providing a good feeling or not. About 80% of the responses in the two areas were between “4-Agree” or “5-Totally agree”, showing that customers valued daylighting as something positive that improves the perceived atmosphere. In relation to the presence of daylight helping a better orientation, the answers were slightly more positive than negative, but with a large dispersion. One reason could be that the term “orientation” is probably not of immediate understanding for customers.
Among respondents, 95% in LR and 71% in HD agreed or totally agreed that daylight supports product presentation and the colours or material are better shown. Of the two customers who did not agree in the LR (5%), one commented that it was because "The interesting products are not in the daylight".
When asked whether they considered buying something after having visited the area, 33% of the customers in the LR said “no”, 31% said “something they had not planned to buy”, and 19% said “something they had already planned to buy”. On the other hand, at HD, 61% bought something they had not planned on buying, and only 5% bought something they had planned to buy. It may be that the greater amount of daylight helped to boost plant sales. Although it would have been of great interest, unfortunately we could get equivalent figures for the same area in traditional stores in the same chain. In fact, the relationship between daylighting and sales was beyond the scope of this study and deserves further study.
In Figure 30 it can be seen how, interestingly, customers were more satisfied with the temperature in the HD (21.8 °C) than in the LR (21.3 °C), despite being almost identical Considering current knowledge (Baker, 2000; Chinazzo et al., 2018), it may be speculated that the higher daylight penetration and greater visual connection with the outside in HD may affect thermal response.

Daylighting and Electric Lighting Integration in the Retail Sector – A Case Study of the IKEA Kaarst Store
53
Figure 30: Satisfaction of customers with the temperature in the area.
When asked if they appreciated having outside views, in LR 82% of the clients said ‘Yes’, and one commented "Nice to see sunlight entering and lighting the products". This comment is well supported by Figure 31, where some customers are spotted while exposing products to daylight before deciding on the purchase, a circumstance which occurred several times during the site visits.
Figure 31: Customers exposing products to daylight.
In HD the percentage rose to 89% although some customers were more critical about the quality of the view, e.g. "The view of the parking lot is not so great" or "The most beautiful view is obstructed". This supported the rather positive outdoor view results that the Living Room obtained in the simulations and suggested that even relatively small windows may positively impact the customers’ experience. It also reminds us that the view quantity should be supported by proper view quality.
As a concluding comparison, and once the clients were already familiar with the spaces, they were asked to describe the amount of perceived light, as summarised in Figure 32. Regarding electric light, the profile of responses was very similar between the two zones, despite much higher measured illuminances in HD.
0% 24%
40%32%
5%3% 14%
62%
17% 4%0%
20%
40%
60%
80%
1 (Too Warm) 2 3 4 5 (Too Cold)
Res
pons
es/ %
Living Room (Mean T = 21.3°C )Home Decoration (Mean T = 21.8°C )

Daylighting and Electric Lighting Integration in the Retail Sector – A Case Study of the IKEA Kaarst Store
54
Figure 32: How customers described the amount of light in the area.
Conversely, daylight appreciation differed much more, with most responses being “high” or “sufficient” at HD and rather spread in LR. Although in HD direct sun hours were abundant and the glare was potentially present, when asked about visual discomfort, there was no mention of discomfort due to daylight glare. There were indeed three customers who had complaints about the light emitted by LED spotlights. Since DGP has been developed for office space, it is possible that such metric cannot describe “discomfort” in a space where individuals performs different activities (shopping). On the contrary, many customers positively commented on the direct sun entering the space, “It's nice that the sun is coming in”.
Figure 33: Overall lighting atmosphere perceived by customers.
Figure 34: Planned time compared to the real time spent in the store by the customers.
0%
10%
20%
30%
40%
50%
Very
Hig
h
Hig
h
Suffi
cien
t
Low
Very
Low
Very
Hig
h
Hig
h
Suffi
cien
t
Low
Very
Low
Daylighting Electric Lighting
Res
pons
es /
%LivingRoom
HomeDecoration
39%
18%
29%
14%0%5%
32%27% 27%
9%0%
10%
20%
30%
40%
1 (Lively) 2 3 4 5 (Relaxed)
Res
pons
es /
%
Living RoomHome Decoration
23%
36%
14%
27%
5%
23%
47%
26%
0%
10%
20%
30%
40%
50%
< 30 min. 30 to 60 min. > 60 min. (No restaurant) > 60 min. (Restaurant)
Res
pons
es /
%
EntranceExit
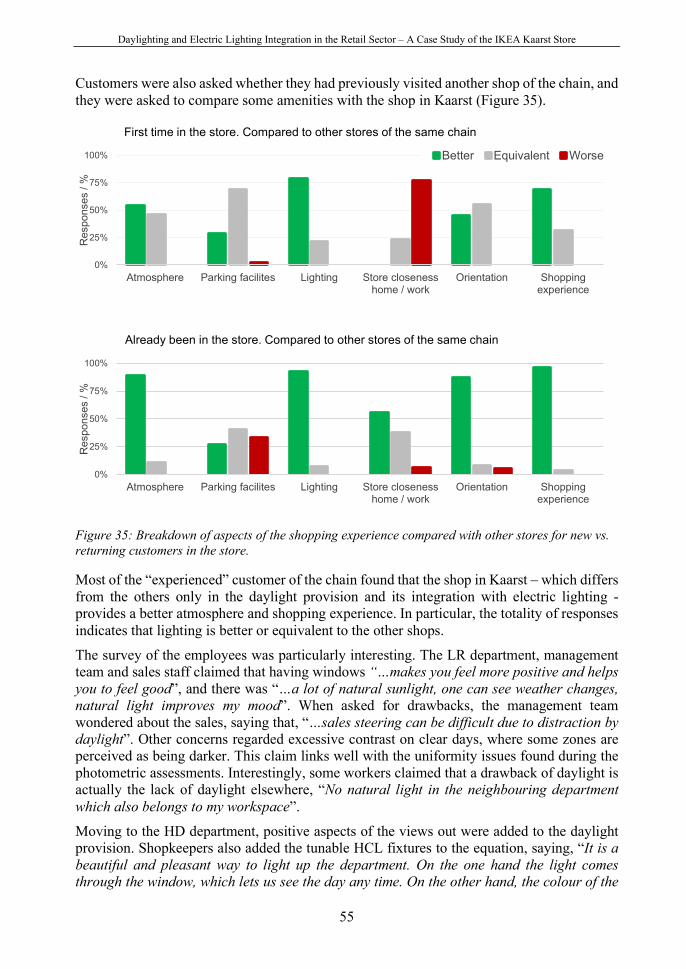
Daylighting and Electric Lighting Integration in the Retail Sector – A Case Study of the IKEA Kaarst Store
55
Customers were also asked whether they had previously visited another shop of the chain, and they were asked to compare some amenities with the shop in Kaarst (Figure 35).
Figure 35: Breakdown of aspects of the shopping experience compared with other stores for new vs. returning customers in the store.
Most of the “experienced” customer of the chain found that the shop in Kaarst – which differs from the others only in the daylight provision and its integration with electric lighting - provides a better atmosphere and shopping experience. In particular, the totality of responses indicates that lighting is better or equivalent to the other shops.
The survey of the employees was particularly interesting. The LR department, management team and sales staff claimed that having windows “…makes you feel more positive and helps you to feel good”, and there was “…a lot of natural sunlight, one can see weather changes, natural light improves my mood”. When asked for drawbacks, the management team wondered about the sales, saying that, “…sales steering can be difficult due to distraction by daylight”. Other concerns regarded excessive contrast on clear days, where some zones are perceived as being darker. This claim links well with the uniformity issues found during the photometric assessments. Interestingly, some workers claimed that a drawback of daylight is actually the lack of daylight elsewhere, “No natural light in the neighbouring department which also belongs to my workspace”.
Moving to the HD department, positive aspects of the views out were added to the daylight provision. Shopkeepers also added the tunable HCL fixtures to the equation, saying, “It is a beautiful and pleasant way to light up the department. On the one hand the light comes through the window, which lets us see the day any time. On the other hand, the colour of the
0%
25%
50%
75%
100%
Atmosphere Parking facilites Lighting Store closenesshome / work
Orientation Shoppingexperience
Res
pons
es /
%
First time in the store. Compared to other stores of the same chain
Better Equivalent Worse
0%
25%
50%
75%
100%
Atmosphere Parking facilites Lighting Store closenesshome / work
Orientation Shoppingexperience
Res
pons
es /
%
Already been in the store. Compared to other stores of the same chain

Daylighting and Electric Lighting Integration in the Retail Sector – A Case Study of the IKEA Kaarst Store
56
light adjusts during the course of the day”. The management team added that the windows “…create a real greenhouse feeling that supports the range. Gives great views of the outdoors”. However, they also said that, “Due to the long stretch of the windows, it is difficult to protect the plants and other items during sunny days”. Co-workers from the department also objected to overheating during summer, but a tolerable glare. In addition, the management team believed that there was a “…good contribution towards a pleasant shopping experience and the overall quality impression of the store”. The marketing team pointed out that the daylighting solution is, “Very pleasant for customers and employees. Very good feedback”, while shopkeepers added that, “Light makes customers happy. They don’t feel so locked up”.
Finally, when asked to make a comparison with the previous store in Kaarst, which was a traditional one, the staff replied that, “There was barely any daylight in the old store”, “In the old store I could never see any light during the day”, and, “No daylight, except for the lunch room and the checkout area”. They highlighted that this affected their daily work: “Today, my workplace is much more pleasant”, “I’m happier now”, and, “One is more positive and feels less at work”.

Daylighting and Electric Lighting Integration in the Retail Sector – A Case Study of the IKEA Kaarst Store
57
5 Conclusions This study described the case study of a furniture store integrating daylighting and electric lighting. The monitoring investigated energy use and lighting quality aspects by combining technical measurement and observations, as well as supplementary daylight simulations. The use of integrated lighting controls, such as daylight harvesting, could save some energy, although figures were lower than what is usually reported in literature. A reason could be the high efficiency of luminaires, which makes additional savings from controls rather marginal. Another reason is that only a few luminaires are actually daylight controlled. Also, since the monitoring is still going on in some areas, some preliminary data are suggesting that the daylight harvesting is saving much more energy in the self-serve area with skylights, which was not studied in this thesis. One possibility is that daylight harvesting works better with these type of daylighting solutions, where directionality of daylight is changing less. One way to increase savings is to provide the whole general lighting, including spotlights – which are the less efficient –, with daylight harvesting or daylight on-off. However, this should be carefully tested in respect to customers’ experience. The photometric assessment was used mostly to characterize lighting in the space. Despite both being provided with sidelight windows, the Living Room (LR) and Home Decoration (HD) departments showed pretty different daylight conditions, with the first having a lower maintained illuminance and higher contrast. This is clearly identified in the surveys, where high contrast is perceived negatively. The observations allowed a critical view of some of the objective photometric measures. For example, limited glare, which simulations showed to occur, seems not to be a problem, rather an opportunity, given the type of activity that individuals are carrying out. Therefore, a more "aggressive" daylighting design is possible, which could serve as a way of impressing customers with more pleasant environments. Windows, even of small size, may enhance the circadian potential of the space and outdoor views. In this sense, the location of the windows is more important than their size, as well as the geometry and integration of the interior layout. As an example, in one of the areas the ratio of windows, which quadrupled the other, was studied, but the amount of area with access to good outdoor views was slightly doubled. Although the circadian potential in the shop may be limited, as the exposure time is generally short, it is important that such considerations be included in future integrated lighting projects. The comparison with the experience in other stores of the same chain clearly shows that the introduction of daylighting solution is valued by customers. The overall perception of the store improved. Among the positive remarks, observing objects under natural light, namely with high colour rendering, and having a (good) view to the outside seem to be the most important for customers. The staff reported on a number of “soft” benefits of daylight, and their job satisfaction seems to be positively impacted. They also noticed the electric lighting solutions and they had positive remarks for the tunable HCL lighting, which could provide a clear link with the time of the day. For that specific solution, this study could not provide major conclusions on the circadian potential of such luminaire due to the number of confounding variables, which

Daylighting and Electric Lighting Integration in the Retail Sector – A Case Study of the IKEA Kaarst Store
58
is typical of an uncontrolled case study assessment. In addition, the staff remarked on some issues related to daylighting, such as the contrast generated with the smaller LR windows, and the overheating they experience during summer with the larger HD windows. However, despite such issues, they even proposed adding more windows to boost views-out and skylights to illuminate the core areas in the showroom. Overall, they valued daylighting as the most positive improvement in comparison to the older store. In conclusions, integrating daylighting and electric lighting saved energy for lighting, but also provided a number of co-benefits in support of both the shopping experience and the working environment for the staff. In the case of furniture store, the use of abundant daylight seems to be a valuable option for both customers and staff. However, there is little research, practical experience and, thus, guidance, existing on how to correctly integrate daylight in the lighting design of furniture shops. Knowledge in this sense is hoped to prompt incorporation of daylighting even in the architecture of the retail sector.
5.1 Lessons learned and future research
During this study, a number of lessons were learned, both from the analysis of the results, the fieldwork and from the method preparation. However, it is important to begin by remembering that everything learned is based on a single case study over a limited period of time (Spring Equinox). It should therefore be confirmed with a more in-depth analysis of the store throughout the year, including Kaarst and other stores. So, this chapter seeks to connect the most remarkable elements learned with further research, which are listed as follows:
a. While daylighting certainly impressed customers, the study, due to its methodology, did not offer evidence that sales are increased. However, it was found that customers spent much more time than planned in the shop and they bought more than intended in the Home Decoration (HD) department with abundant daylight. A future study may compare these figures for an equivalent shop with traditional architecture.
b. As mentioned in previous chapters, the importance of mixing environmental technical assessments (TEAs) and observed-based assessments (OBEAs) was noted. This was even more important in a building typology (retail) where daylight integration has been studied little. Therefore, metrics and assessment methods are neither adapted to nor informative for the designer. Many of the following points illustrate this.
c. The assessment of the risk of glare through simulated daylight glare probability (DGP), which in some cases indicated moderate or high risk, was not supported by the clients' feelings. Further research is needed to evaluate the appropriateness of using DGP for short time exposures and to explore alternative evaluation methods.
d. The customers valued having direct sunlight to examine colours and textures very positively, Living Room (LR) department being a clear example. This is something that should not be overlooked in future designs or renovations. The idea of providing a daylight corner, where customers can place the products they are interested in under natural light, is a proposal that deserves to be further investigated.

Daylighting and Electric Lighting Integration in the Retail Sector – A Case Study of the IKEA Kaarst Store
59
e. It was observed that the design of daylight harvesting systems is very sensitive in the case of south or west facing lateral windows. Both the number of luminaires connected to the DHS and the location of the light sensor that regulates it, come into dispute with the change in the directionality of the light, making these orientations more pronounced and uncomfortable. This created in many cases situations of contrast that neither the customers nor the marketing department valued positively. Possible solutions should be verified, either by incorporating (day)light sources in the darkest part, adding solar shading or limiting the size of the DHS controlled area.
f. This study introduced a path-based assessment, which proved very useful in the context of a furniture store. Coupled with metrics such as vertical and cylindrical illuminance, SPD or EML provide a very good characterisation of the quantity and quality of light perceived by customers. In fact, the correct design of the client's path may easily avoid potential issues such as glare, or may foster circadian potential and outdoor views. Therefore, the optimization of the path through simulations should be analysed in future projects.
g. Due to resource and methodological limitations, client surveys were based on forms accessible by QR codes. These worked very well when promoted through the distribution of flyers at the entrance and especially in the restaurant. Responses dropped sharply when there was no promotion. However, it proved to be a valid method and easily scalable.
h. After the analysis of energy use results, it was observed that savings from introducing intensity adjustment systems in high efficient and low wattage LED luminaires is very limited. The study concludes that in situations with minimal lateral windows, these systems are not very successful. On the other hand, a lot of savings potential was observed in the integration of daylight with spotlights, The potential to integrate natural light as a commercial claim is very promising both at the technical level (the need for a high rendering) and by the high use of energy required by spotlights. Future research in this direction should be; evaluating daylighting coupled with latest electric lighting technology, which could be of great interest to the retail sector.

Daylighting and Electric Lighting Integration in the Retail Sector – A Case Study of the IKEA Kaarst Store
60
6 Summary The retail sector is an important part of the global economy and is a major influence on our leisure time and quality of life. With the massive introduction of online commerce, many physical stores have seen their sales drop dramatically. The big retail chains are faced with large stores that do not invoice as much as they used to. In an effort to attract customers again, big retail players are exploring new ways to make their stores more attractive and enjoyable for customers and employees, as well as more sustainable. Daylight and natural ventilation were widely used in old industrial and commercial buildings, but with the cheapening of electric light and air conditioning systems, retail stores evolved into closed boxes. Now we realise the mistake of abandoning natural light, as science proves that it improves not only lighting conditions but also mood, health and can even reduce energy use. Daylight, therefore, is a great tool to improve the shopping and work experience in a store, and that is why in new stores or renovations, the integration of daylight in the design is, luckily, being reconsidered. In this thesis, a peculiar case study is presented; a pilot IKEA furniture store opened in Kaarst (Germany) in 2018 with the aim of testing daylight integrated design as a new strategy for the new chain store openings and retrofits. The solutions include skylights, wide windows and electric lighting that adjusts its intensity and colour with natural light. The results of the case study revealed that customers enjoyed the shopping experience much more compared with other chain stores, especially appreciating the fact that they could observe the products under natural light and have views of the outside. The latter was also highly valued by the employees, as the visual connection to the surroundings made working hours more pleasant. In fact, the integration of daylight was listed by all workers as the most positive improvement of the shop compared to the old one. Other interesting findings were also revealed by the research carried out in the different areas studied in the shop, such as the larger the windows were the more satisfied that customers were with the interior temperature. It was also found that certain control systems for lighting were saving much less energy than expected and that most of the knowledge, standards reference and methods commonly used for the evaluation of daylight integration were judged as a less than perfect fit for a furniture store. Consequently, the author had to devise alternative methods for the correct evaluation of the lighting in the different spaces. One of them was the collection of data based on the main route taken by the customers when walking through the store, instead of using the typical horizontal measuring grid for the entire surface. This saved a lot of time as the number of points was on average 80% lower and the results proved to be more useful and representative, as the height of the exhibitors and products varies greatly between departments. Therefore, the horizontal grid generated confusing values at certain points, which affected the average values; values that were not reliable with what the customer was perceiving. One of the most revealing parts of the study was the combination of measured or simulated technical evaluations with the reality perceived by customers and employees. For example, some simulations resulted in a very high level of discomfort due to daylight glare in some areas, while the customers interviewed in that very same position and time did not seem to be disturbed since they only experienced it for a few seconds. Quite the opposite was true in reality, as some clients affirmed that those rays of sun were pleasant and less annoying than

Daylighting and Electric Lighting Integration in the Retail Sector – A Case Study of the IKEA Kaarst Store
61
certain electric spotlights in some areas of the store. As one of the main conclusions, the monitoring suggests that objective and subjective evaluations should always be combined for a complete understanding of the project as a whole. The author's fieldwork during the three weeklong store visits included a wide variety of measurements of the quantity and quality of lighting, as well as light and temperature tracking, customer surveys, and interviews with store staff. Nearly 150 customer responses were collected and processed together with a total of six interviews that were conducted with different employees of the store, with different roles. A close collaboration with the facility management team of the store was also necessary to obtain the necessary data and documentation, as well as to share benefits and problems that the introduction of the new lighting control systems generated. As an anecdote, thanks to this thesis, many of the lighting systems that did not work properly were finally correctly adjusted by the manufacturer. The monitoring protocol was defined in collaboration with a research project of the international energy agency (SHC-IEA Task61, subtask D) of which this thesis was the first case study, so the defined method will be reused in the following buildings to be surveyed. IKEA expressed great interest in the monitoring method used, as well as in the results and findings obtained. These were presented to the design and marketing teams, so they could be taken into account in future projects. In designing stores that are more attractive to customers and that care for the wellbeing of their employees, natural light is a very powerful tool. This thesis describes a case study of a furniture store with a highly ambitious use of daylight. The study investigates energy use and quality aspects of lighting by combining technical measurements and observations, as well as daylight simulations. The study suggests that integrating daylighting saved energy for lighting, but also provided a number of co-benefits in support of both the shopping experience and the working environment for the staff.

Daylighting and Electric Lighting Integration in the Retail Sector – A Case Study of the IKEA Kaarst Store
62
7 References Alker, J., Malanca, M., Pottage, C., O’Brien, R., 2014. Health, Wellbeing & Productivity in
Offices. The next chapter for green building. World green building council, https://www.worldgbc.org/news-media/health-wellbeing-and-productivity-offices-next-chapter-green-building.
ANSI/ASHRAE/IES, 2016. 90.1:2016 Energy Standard for Buildings except Low-Rise Residential Buildings.
ASHRAE, 2017. 2017 ASHRAE Handbook -- Fundamentals (I-P) - [WWW Document]. URL https://www.techstreet.com/ashrae/standards/2017-ashrae-handbook-fundamentals-i-p-includes-cd-in-i-p-and-si-editions?product_id=1975069#full (accessed 3.1.18).
Aumann, D., Heschong, L., 2003. Daylight and Retail Sales. California Energy Comission. Baker, N., 2000. We are all outdoor animals. Archit. City Environ. Proc. PLEA 2000 July
2000 Camb. U. K. 553–555. Berson, D.M., Dunn, F.A., Takao, M., 2002. Phototransduction by Retinal Ganglion Cells
That Set the Circadian Clock. Science 295, 1070–1073. https://doi.org/10.1126/science.1067262
Bill Browning, Chris Garvin, Catie Ryan, Namita Kallianpurkar, Leslie Labruto, Siobhan Watson, Travis Knop, 2012. The Economics of Biophilia [WWW Document]. URL http://clients.edmullen.com/terrapin/ (accessed 9.28.19).
Bodart, M., De Herde, A., 2002. Global energy savings in offices buildings by the use of daylighting. Energy Build. 34, 421–429. https://doi.org/10.1016/S0378-7788(01)00117-7
Boissard, S., Fontoynont, M., 2009. Optimization of LED-based Light Blendings for Object Presentation. Color Res. Appl. 34, 310–320. https://doi.org/10.1002/col.20507
Brasche, S., Bischof, W., 2005. Daily time spent indoors in German homes – Baseline data for the assessment of indoor exposure of German occupants. Int. J. Hyg. Environ. Health 208, 247–253. https://doi.org/10.1016/j.ijheh.2005.03.003
BRE Global, 2016. BREEAM International New Construction 2016 [WWW Document]. URL https://www.breeam.com/BREEAMInt2016SchemeDocument/#_frontmatter/other_types.htm%3FTocPath%3D_____4 (accessed 10.7.19).
CBE, 2019. Occupant Survey Toolkit. Cent. Built Environ. URL https://cbe.berkeley.edu/resources/occupant-survey/ (accessed 9.28.19).
CEN, 2018. EN 17037:2018 Daylight in Buildings. CEN, 2017. EN 15193-1:2017 Energy performance of buildings – Energy requirements for
lighting – Part 1: Specifications, Module M9. CEN, 2011. EN 12464-1:2011 Light and lighting - Lighting of work places - Part 1: Indoor
work places. CEN, 2007. EN 15193:2007 Energy Performance of Buildings - Energy requirements for
lighting. CEN/SIS, 2018. SS-EN 17037:2018. Chellappa, S.L., Steiner, R., Blattner, P., Oelhafen, P., Götz, T., Cajochen, C., 2011. Non-
Visual Effects of Light on Melatonin, Alertness and Cognitive Performance: Can Blue-Enriched Light Keep Us Alert? PLOS ONE 6, e16429. https://doi.org/10.1371/journal.pone.0016429

Daylighting and Electric Lighting Integration in the Retail Sector – A Case Study of the IKEA Kaarst Store
63
Cheung, H.D., Chung, T.M., 2008. A study on subjective preference to daylit residential indoor environment using conjoint analysis. Build. Environ. 43, 2101–2111. https://doi.org/10.1016/j.buildenv.2007.12.011
Chinazzo, G., Wienold, J., Andersen, M., 2018. Combined effects of daylight transmitted through coloured glazing and indoor temperature on thermal responses and overall comfort. Build. Environ. 144, 583–597. https://doi.org/10.1016/j.buildenv.2018.08.045
Choi, J.-H., Beltran, L.O., Kim, H.-S., 2012. Impacts of indoor daylight environments on patient average length of stay (ALOS) in a healthcare facility. Build. Environ. 50, 65–75. https://doi.org/10.1016/j.buildenv.2011.10.010
Christoffersen, J., 2011. The importance of light to health and well-being [WWW Document]. ResearchGate. URL https://www.researchgate.net/publication/283459751_The_importance_of_light_to_health_and_well-being (accessed 10.1.19).
CIE, 2019. Termlist | eilv [WWW Document]. URL http://eilv.cie.co.at/termlist (accessed 7.29.19).
CIE, 2018. CIE S026/E:2018 System for Metrology of Optical Radiation for ipRGC-Influenced Responses to Light.
Craik, K.H., Feimer, N.R., 1987. Environmental assessment. Handb. Environ. Psychol. 2, 891–918.
Digital Illumination Interface Alliance, 2019. DALI - IEC 62386 standard [WWW Document]. URL https://www.digitalilluminationinterface.org/dali/ (accessed 9.20.19).
Dubois, M.-C., Blomsterberg, Å., 2011. Energy saving potential and strategies for electric lighting in future North European, low energy office buildings: A literature review. Energy Build. 43, 2572–2582. https://doi.org/10.1016/j.enbuild.2011.07.001
Dubois, M.-C., Erlendsson, Ö., 2015. IKEA Kaarst. Detailed daylight study. Dubois, M.-C., Gentile, N., Laike, T., Bournas, I., Alenius, M., 2019. Daylighting and
lighting under a Nordic sky. Studentlitteratur AB. Dubois, M.-C., Gentile, N, Naves, C, 2016. Monitoring protocol for lighting and daylighting
retrofits. A Technical Report of IEA SHC Task 50. Ecommerce Foundation, 2018. Ecommerce 2018 Global Report [WWW Document].
Ecommerce Found. URL https://www.ecommercefoundation.org/ (accessed 7.26.19).
EPA, 2002. Environmental Protection Agency [WWW Document]. URL www.epa.gov EuroCommerce, 2018. Retail and Wholesale in times of change. A manifesto for the new
European Comissioan and Parliament. European Commission, 2018. A European reatil sector fit for the 21st century. Eurostat, 2015. Setting up a european retail action plan. Figueiro, M.G., 2017. Disruption of Circadian Rhythms by Light During Day and Night.
Curr. Sleep Med. Rep. 3, 76–84. https://doi.org/10.1007/s40675-017-0069-0 Food Distributor, 2002. Food Distributor. Gentile, N., Dubois, M.-C., Osterhaus, W., Stoffer, S., Amorim, C.N.D., Geisler-Moroder,
D., Jakobiak, R., 2016. A toolbox to evaluate non-residential lighting and daylighting retrofit in practice. Energy Build. 123, 151–161. https://doi.org/10.1016/j.enbuild.2016.04.026
Daylighting and Electric Lighting Integration in the Retail Sector – A Case Study of the IKEA Kaarst Store
64
Gentile, N., Osterhaus, W., 2019. IEA SHC Task 61 / EBC Annex 77 Integrated solutions for daylighting and electric lighting - Subtask D: lab and field study performance tracking, in: ISES SWC 2019. Santiago, Chile, p. accepted for oral presentation.
Hattar, S., Liao, H.-W., Takao, M., Berson, D.M., Yau, K.-W., 2002. Melanopsin-Containing Retinal Ganglion Cells: Architecture, Projections, and Intrinsic Photosensitivity. Science 295, 1065–1070. https://doi.org/10.1126/science.1069609
Heschong, L., 2003a. Windows and Offices: A Study of Office Worker Performance and the Indoor Environment.
Heschong, L., 2003b. Windows and Classrooms: A Study of Student Performance and the Indoor Environment.
Heschong, L., 1999. Skylighting and Retail Sales. California Board for Energy Efficiency Third Party Program.
Heschong, L., Wright, D.R.L., Okura, S., 2002. Daylighting Impacts on Retail Sales Performance. J. Illum. Eng. Soc. 31, 21–25. https://doi.org/10.1080/00994480.2002.10748389
Hinks, D., Shamey, R., 2011. Review of retail store lighting: implications for colour control of products. Color. Technol. 127, 121–128. https://doi.org/10.1111/j.1478-4408.2011.00286.x
Inter IKEA, 2017a. Design principle: Daylight. A presentation of Daylight, one of 14 design principles for more sustainable IKEA stores.
Inter IKEA, 2017b. Design principle: Envelope openings. A presentation of Envelope openings, one of 14 design principles for more sustainable IKEA stores.
Inter IKEA, 2017c. Guide to Daylight at IKEA Kaarst. International Well Building Institute, 2017a. Circadian lighting design | WELL Standard
[WWW Document]. URL https://standard.wellcertified.com/light/circadian-lighting-design (accessed 7.26.19).
International Well Building Institute, 2017b. Appendix C: Tables | WELL Standard [WWW Document]. URL https://standard.wellcertified.com/tables#melanopicRatio (accessed 7.26.19).
Jamieson, M., 2014. A $3 Billion Opportunity: Energy Management in Retail Operations. Jonathan Reynolds, Richard Cuthbertson, 2014. Retail & Wholesale: Key sectors for the
european economy: Understanding the role of retailing and wholesaling within the European Union. University of Oxford. Institute of Retail Management.
Klepeis, N.E., Nelson, W.C., Ott, W.R., Robinson, J.P., Tsang, A.M., Switzer, P., Behar, J.V., Hern, S.C., Engelmann, W.H., 2001. The National Human Activity Pattern Survey (NHAPS): a resource for assessing exposure to environmental pollutants. J. Expo. Sci. Environ. Epidemiol. 11, 231–252. https://doi.org/10.1038/sj.jea.7500165
Knoop, M., Aktuna, B., Bueno, B., Darula, S., Deneyer, A., Diakite, A., Fuhrmann, P., Geisler-Moroder, D., Hubschneider, C., Johnsen, K., Kostro, A., Malikova, M., Matusiak, B., Prella, P., Pohl, W., Tao, L., Tetri, E., 2016. Daylighting and electric lighting retrofit solutions. Universitätsverlag der TU Berlin. http://dx.doi.org/10.14279/depositonce-5162
Kralikova, R., Wessely, E., 2019. Lighting Quality and its Effects on Productivity and Human Healts. ResearchGate.
Kruisselbrink, T., Dangol, R., Rosemann, A., 2018. Photometric measurements of lighting quality: An overview. Build. Environ. 138, 42–52. https://doi.org/10.1016/j.buildenv.2018.04.028

Daylighting and Electric Lighting Integration in the Retail Sector – A Case Study of the IKEA Kaarst Store
65
Küller, R., Lindsten, C., 1992. Health and behavior of children in classrooms with and without windows. J. Environ. Psychol. 12, 305–317. https://doi.org/10.1016/S0272-4944(05)80079-9
L. Edwards, P. Torcellini, 2002. A Literature Review of the Effects of Natural Light on Building Occupants. Natl. Renew. Energy.
Leslie, R.P., 2003. Capturing the daylight dividend in buildings: why and how? Build. Environ. 38, 381–385. https://doi.org/10.1016/S0360-1323(02)00118-X
Lockley, S.W., 2009. Circadian Rhythms: Influence of Light in Humans, in: Squire, L.R. (Ed.), Encyclopedia of Neuroscience. Academic Press, Oxford, pp. 971–988. https://doi.org/10.1016/B978-008045046-9.01619-3
Luca, F.D., Simson, R., Voll, H., Kurnitski, J., 2018. Daylighting and energy performance design for single floor commercial hall buildings. Manag. Environ. Qual. Int. J. https://doi.org/10.1108/MEQ-10-2017-0110
Lucas, R.J., Peirson, S.N., Berson, D.M., Brown, T.M., Cooper, H.M., Czeisler, C.A., Figueiro, M.G., Gamlin, P.D., Lockley, S.W., O’Hagan, J.B., Price, L.L.A., Provencio, I., Skene, D.J., Brainard, G.C., 2014. Measuring and using light in the melanopsin age. Trends Neurosci. 37, 1–9. https://doi.org/10.1016/j.tins.2013.10.004
McNeel, 2014. Grasshopper.Algorithmic Modelling for Rhino. Meeker, M. (Ed.), 2019. Internet Trends. Montoya, F.G., Peña-García, A., Juaidi, A., Manzano-Agugliaro, F., 2017. Indoor lighting
techniques: An overview of evolution and new trends for energy saving. Energy Build. 140, 50–60. https://doi.org/10.1016/j.enbuild.2017.01.028
Nakamura, S., Mukai, T., Senoh, M., 1994. Candela‐class high‐brightness InGaN/AlGaN double‐heterostructure blue‐light‐emitting diodes. Appl. Phys. Lett. 64, 1687–1689. https://doi.org/10.1063/1.111832
Nardelli, A., Deuschle, E., de Azevedo, L.D., 2017. Assessment of light emitting diodes technology for general lighting: A critical review.
National Renewable Energy Laboratory (NREL), 2018a. OpenStudio. National Renewable Energy Laboratory (NREL), 2018b. EnergyPlus. O’Brien, W., Schweiker, M., Day, J.K., 2019. Get the picture? Lessons learned from a
smartphone-based post-occupancy evaluation. Energy Res. Soc. Sci. 56, 101224. https://doi.org/10.1016/j.erss.2019.101224
Pandharipande, A., Caicedo, D., 2011. Daylight integrated illumination control of LED systems based on enhanced presence sensing. Energy Build. 43, 944–950. https://doi.org/10.1016/j.enbuild.2010.12.018
Pauley, S.M., 2004. Lighting for the human circadian clock: recent research indicates that lighting has become a public health issue. Med. Hypotheses 63, 588–596. https://doi.org/10.1016/j.mehy.2004.03.020
Perez, O., 2019. Lighting for Health and Well Being: What about ENERGY and QUALITY in Integrative Lighting / HCL?
Rea, M., 2017. Quantifying Circadian Light and Its Impact [WWW Document]. Archit. Light. URL https://www.archlighting.com/technology/quantifying-circadian-light-and-its-impact_o (accessed 7.26.19).
Rea, M.S., Bullough, J.D., Figueiro, M.G., 2002. Phototransduction for human melatonin suppression. J. Pineal Res. 32, 209–213. https://doi.org/10.1034/j.1600-079X.2002.01881.x

Daylighting and Electric Lighting Integration in the Retail Sector – A Case Study of the IKEA Kaarst Store
66
Reinhart, C.F., Mardaljevic, J., Rogers, Z., 2006. Dynamic Daylight Performance Metrics for Sustainable Building Design. Leukos 7–31.
Robert McNeel and Associates, 2019. Rhinoceros 3D. Robson, C., McCartan, K., 2016. Real world research, Fourth Edition. ed. WILEY. Sadeghipour Roudsari, M, 2013. Ladybug Tools. Sahin, L., Figueiro, M.G., 2013. Alerting effects of short-wavelength (blue) and long-
wavelength (red) lights in the afternoon. Physiol. Behav. 116–117, 1–7. https://doi.org/10.1016/j.physbeh.2013.03.014
Saunders, H.D., 2008. Fuel conserving (and using) production functions. Energy Econ. 30, 2184–2235. https://doi.org/10.1016/j.eneco.2007.11.006
Saunders, H.D., Tsao, J.Y., 2012. Rebound effects for lighting. Energy Policy, Special Section: Fuel Poverty Comes of Age: Commemorating 21 Years of Research and Policy 49, 477–478. https://doi.org/10.1016/j.enpol.2012.06.050
Schweizer, C., Edwards, R.D., Bayer-Oglesby, L., Gauderman, W.J., Ilacqua, V., Jantunen, M.J., Lai, H.K., Nieuwenhuijsen, M., Künzli, N., 2007. Indoor time–microenvironment–activity patterns in seven regions of Europe. J. Expo. Sci. Environ. Epidemiol. 17, 170–181. https://doi.org/10.1038/sj.jes.7500490
Seoul Semiconductor, 2018. Seoul Semiconductor | Technology | SunLike [WWW Document]. URL http://www.seoulsemicon.com/en/technology/Sunlike/ (accessed 11.29.19).
SGBC, BRE Global, 2018. Manualer och verktyg för certifiering i BREEAM-SE. Swed. Green Build. Counc. URL https://www.sgbc.se/certifiering/breeam-se/certifieringsstod-for-breeam-se/manualer-och-verktyg-for-certifiering-i-breeam-se/ (accessed 10.7.19).
Shanmugam, V., Wafi, A., Al-Taweel, N., Büsselberg, D., 2013. Disruption of circadian rhythm increases the risk of cancer, metabolic syndrome and cardiovascular disease. J. Local Glob. Health Sci. 2013, 3. https://doi.org/10.5339/jlghs.2013.3
Shellenberger, M., Nordhaus, T., 2014. Opinion | The Problem With Energy Efficiency. N. Y. Times.
Solemma, 2018. Solemma LLC | ALFA. Stopka, M., 2016. The Financial Benefits of Biophilic Design in the Workplace : A Review
and Summary of Current Research. Troch, P.D., 2016. Retail services [WWW Document]. Intern. Mark. Ind. Entrep. SMEs -
Eur. Comm. URL https://ec.europa.eu/growth/single-market/services/retail_en (accessed 9.27.19).
U.S. Department of Energy (DOE), 2011. Buildings energy data book. USGBC, 2019. LEED v4.1 | USGBC [WWW Document]. URL https://new.usgbc.org/leed-
v41#bdc (accessed 10.5.19). van Bommel, W., van den Beld, G., 2004. Lighting for work: a review of visual and
biological effects. Viola, A.U., James, L.M., Schlangen, L.J., Dijk, D.-J., 2008. Blue-enriched white light in
the workplace improves self-reported alertness, performance and sleep quality. Scand. J. Work. Environ. Health 34, 297–306. https://doi.org/10.5271/sjweh.1268
Ward Larson, G, Shakespeare, R., 1998. Rendering with Radiance: The Art and Science of Lighting Visualization. Morgan Kaufmann Publishers, Inc., San Francisco.
Williams, A., Atkinson, B., Garbesi, K., Rubinstein, F., Page, E., 2011. A Meta-Analysis of Energy Savings from Lighting Controls in Commercial Buildings. Leukos.

Daylighting and Electric Lighting Integration in the Retail Sector – A Case Study of the IKEA Kaarst Store
67
Xu, L., Pan, Y., Yao, Y., Cai, D., Huang, Z., Linder, N., 2017. Lighting energy efficiency in offices under different control strategies. Energy Build. 138, 127–139. https://doi.org/10.1016/j.enbuild.2016.12.006
Zele, A.J., Feigl, B., Adhikari, P., Maynard, M.L., Cao, D., 2018. Melanopsin photoreception contributes to human visual detection, temporal and colour processing. Sci. Rep. 8. https://doi.org/10.1038/s41598-018-22197-w

Daylighting and Electric Lighting Integration in the Retail Sector – A Case Study of the IKEA Kaarst Store
68
8 Appendix
8.1 SWOT Analysis
Daylit Areas Strenghts Weaknesses Opportunities Threats
01. Living Room
1 Window 6.2 * 2.4m
1 Glazed Door 2.8 * 2.8 m
South and West windows, high-priced products.
Colour rendering is important.
Modest size of windows. Risk of
frontal Glare.
First exhibition area. Ask about plans, such as expected visit
time.
Transition zone to the rest of the
showroom, many customers are not interested in the
product range and they will skip it
02. Kitchen
1 Window 14 * 2.8m
North facing windows
integrated in the interior kitchen
scenery.
No Daylight integration on the electrical lighting
circuit.
Customer can feel like in his own kitchen,
suitable to investigate effect
on sales.
Window area is obstructed from
the main customer path.
03. Bedroom
1 Window 12 * 2.8 m
North facing full height windows integrated in the interior bedroom
scenery.
The area will be undergoing remodelling
during the study, so it should be
avoided.
Customer can feel like in his own bedroom,
could be suitable to investigate if it
is positive for sales.
The effects of light may not
relevant, colour rendering more
tied to bed linen.
04. Children
1 Window 4 * 1.8 m
Only exposition zone with East
facing windows.
No Daylight integration on the electrical lighting
circuit.
Low-priced, colourful
products, light can have an
important role.
The glazed area may go unnoticed during peak hours due to location and
size.
05. Cookshop
2 Window 6.2 * 2.8 m
South facing window with visual contact towards street
level.
Lighting control system circuit not properly
sized, creating too high contrast
in the area.
To investigate the observer-
based assessment of these lighting
conditions.
Customers may easily bypass the
area due to different shortcuts previously present.
06. Textiles
1 Window 4.7 * 2.8 m
Goods present in the area
particularly related to daylight and
glare protection.
The system is cancelled due to faulty integration
of the sensor.
Direct interaction between people and adjustment
of daylight intensity
Customer can modify lighting conditions of the zone moving the
curtains. 07. Home
Decoration Fully glazed West and North façade
in the area. Circadian fixtures
installed.
Highly exposed to direct solar
radiation during peak times. Interior sun
shading.
Low-priced and greenery
products, where light could play a
major role.
Customers can be disturbed by
sunlight.
1 Window 16 * 2.4m
1 Glazed Door 2.8 * 2.8 m

Daylighting and Electric Lighting Integration in the Retail Sector – A Case Study of the IKEA Kaarst Store
69
08. Home Ranging
1 Glazed Door
2.8 * 2.8m 1 Window
13.7 * 2.4 m
North windows no exposed to glare issues. Products
range tend to have a neutral incidence.
Uniformly coloured low-
priced products where the quality of light is not as
relevant.
Last exhibition area in the store.
Area of entrance to the self-serve, so it might be difficult
to catch the attention of customers.
09. Self-Serve
6 Windows 10 * 2.8 m Skylights
45º tilt. North
Zone with abundant Daylight from Skylights and
Windows.
Extensive passage and
stock area, hard to define a
representative study subzone.
High daylight intensity. High
connection to the exterior.
Customers may be focused in finding goods rather than
appreciating scenery.
10. Exit
Linear skylight in the background driving daylight
into the area. Circadian fixtures.
There is no integration of Daylight with
lighting system.
Last area In the store. Possible to
ask total time spent and overall
shopping experience.
Clients may wish to leave after
completing their visit.

Daylighting and Electric Lighting Integration in the Retail Sector – A Case Study of the IKEA Kaarst Store
70
8.2 Living room Eh on-site measurements
Figure 36: Horizontal illuminance average measurements during daytime at the Living Room department.
Figure 37: Horizontal illuminance average measurements during night-time at Living Room department.

Daylighting and Electric Lighting Integration in the Retail Sector – A Case Study of the IKEA Kaarst Store
71
8.3 Home decoration Eh on-site measurements
Figure 38: Horizontal illuminance average measurements during daytime at the Home Decoration department.
Figure 39: Horizontal illuminance average measurements during night-time at the Home Decoration department.

Daylighting and Electric Lighting Integration in the Retail Sector – A Case Study of the IKEA Kaarst Store
72
8.4 Costumers survey - Living Room

Daylighting and Electric Lighting Integration in the Retail Sector – A Case Study of the IKEA Kaarst Store
73

Daylighting and Electric Lighting Integration in the Retail Sector – A Case Study of the IKEA Kaarst Store
74

Daylighting and Electric Lighting Integration in the Retail Sector – A Case Study of the IKEA Kaarst Store
75

Daylighting and Electric Lighting Integration in the Retail Sector – A Case Study of the IKEA Kaarst Store
76
8.5 Costumers survey - Home Decoration

Daylighting and Electric Lighting Integration in the Retail Sector – A Case Study of the IKEA Kaarst Store
77
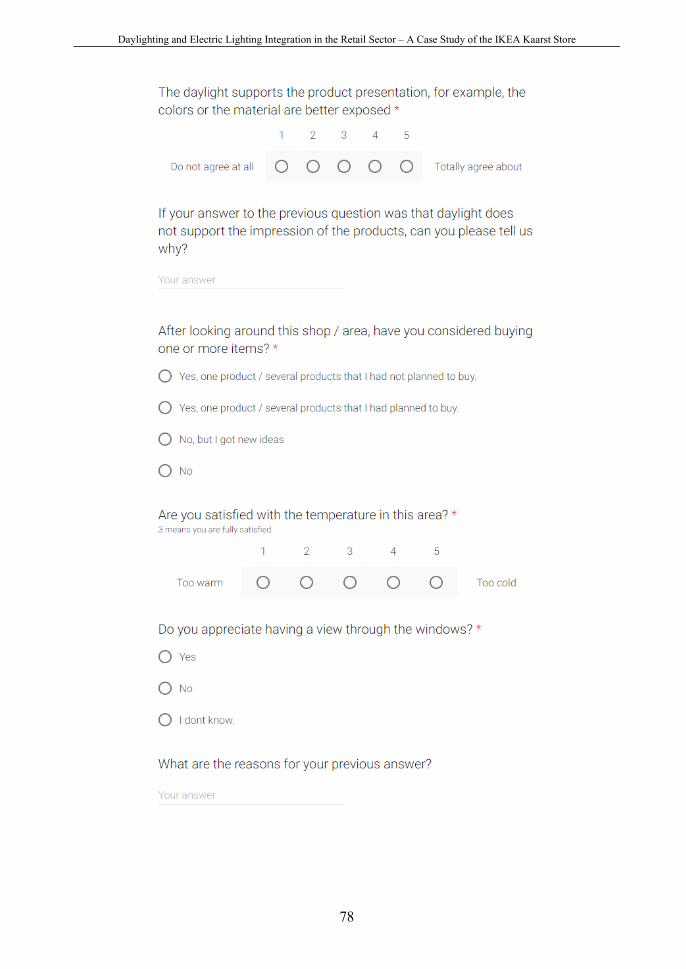
Daylighting and Electric Lighting Integration in the Retail Sector – A Case Study of the IKEA Kaarst Store
78

Daylighting and Electric Lighting Integration in the Retail Sector – A Case Study of the IKEA Kaarst Store
79

Daylighting and Electric Lighting Integration in the Retail Sector – A Case Study of the IKEA Kaarst Store
80
8.6 Costumers survey - Overall shopping experience

Daylighting and Electric Lighting Integration in the Retail Sector – A Case Study of the IKEA Kaarst Store
81

Daylighting and Electric Lighting Integration in the Retail Sector – A Case Study of the IKEA Kaarst Store
82

Daylighting and Electric Lighting Integration in the Retail Sector – A Case Study of the IKEA Kaarst Store
83

Daylighting and Electric Lighting Integration in the Retail Sector – A Case Study of the IKEA Kaarst Store
84
8.7 Survey to the staff

Daylighting and Electric Lighting Integration in the Retail Sector – A Case Study of the IKEA Kaarst Store
85

Daylighting and Electric Lighting Integration in the Retail Sector – A Case Study of the IKEA Kaarst Store
86

Daylighting and Electric Lighting Integration in the Retail Sector – A Case Study of the IKEA Kaarst Store
87

Daylighting and Electric Lighting Integration in the Retail Sector – A Case Study of the IKEA Kaarst Store
88
Dept of Architecture and Built Environment: Division of Energy and Building Design
Dept of Building and Environmental Technology: Divisions of Building Physics and Building Services


![Net Zero Energy Buildings – Lighting & Daylighting [NEED NEW COVER SLIDE]](https://img.dokumen.tips/doc/110x75/5697bf821a28abf838c85d2f/net-zero-energy-buildings-lighting-daylighting-need-new-cover-slide.jpg)