Embed Size (px)
Citation preview
Data Visualization Translating data into actionable insights for retailers
June 2016
D ATA A N A LY T I C S S E R I E S

1
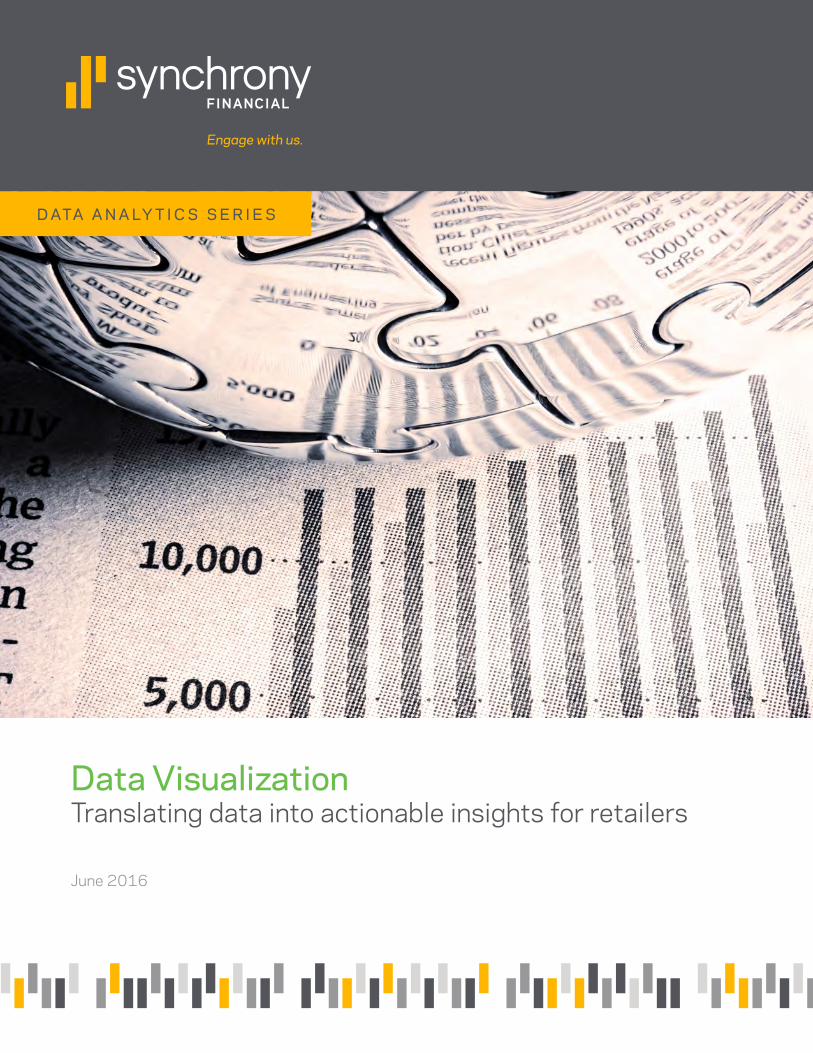
INTRODUCTION Data visualization is the presentation of data in a visual format. It allows users to easily identify behavioral patterns, trends and correlations through illustrative techniques and software. The key is to keep it simple and let the pictures, charts and graphs tell the story.
With the growth of big data and the desire to mine information from all customer interactions, data visualization can be a powerful tool to quickly observe trends and take action on the data observed. Data visualization makes it easier for executives and leaders across all disciplines to access key data and apply the insights to drive customer and business strategy.
Examples of visual data include heat maps, infographics and a combination of pictures and graphs. Each of these formats should be designed to answer strategic questions about the business so users can find what they need without having to dig into the raw data. An important element of data visualization is the ability to observe outliers or unique patterns that can be used to uncover marketing, customer and operational opportunities.
1
2
3
4
This white paper will discuss the format and application of data visualization tools such as:
Executive Dashboards
Pictures and Graphs
Sensitivity Modeling
Heat Maps
©2016 Synchrony Financial. All rights reserved. No reuse without express written consent from Synchrony Financial.
2
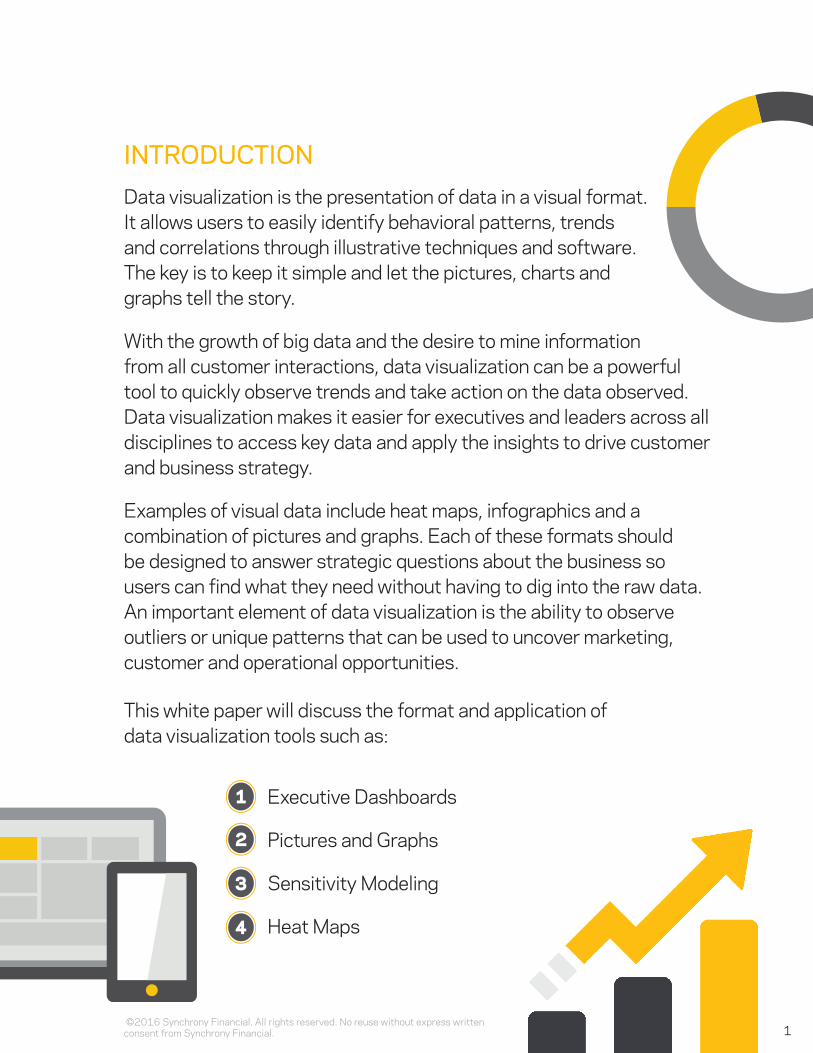
Dashboards are effective tools for displaying data, observing trends and monitoring business performance. By translating the data into a visual format, dashboards help users more clearly identify business insights, trends and performance gaps, if they exist—and to more easily share the results across the company. Armed with this data, users can effectively engage in a dialog with decision makers. Once all parties agree on the key metrics and reporting frequency, the data can then be used to help influence and improve future performance.
Another function of a dashboard is the ability to develop efficiency variables. This allows analysts to normalize the data across comparison groups and acquire a baseline. For example:
• Retail sales per number of stores in the region • Retail sales per register or number of associates • Number of products sold per number of stores in the region
Dashboards have become very user-friendly,
and more executives are starting to become
power users, able to ask the right questions to
drive strategy through data and analytics.
1EXECUTIVE DASHBOARD
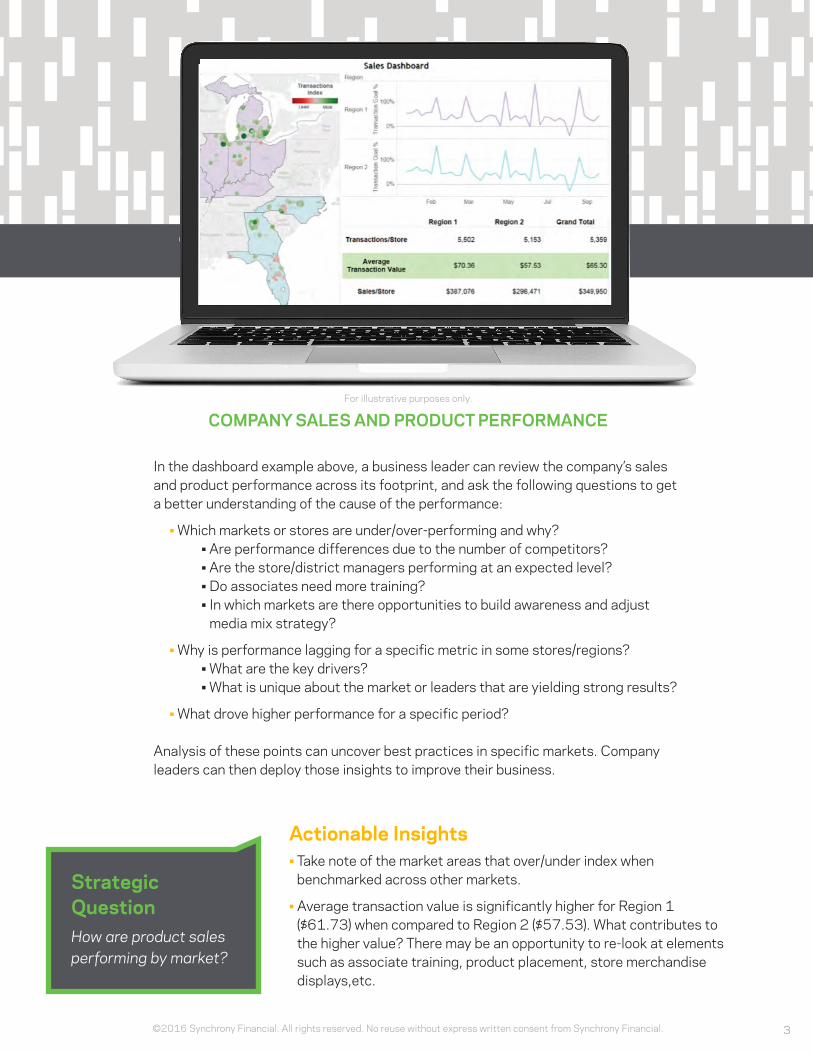
COMPANY SALES AND PRODUCT PERFORMANCE
©2016 Synchrony Financial. All rights reserved. No reuse without express written consent from Synchrony Financial. 3
In the dashboard example above, a business leader can review the company’s sales and product performance across its footprint, and ask the following questions to get a better understanding of the cause of the performance:
• Which markets or stores are under/over-performing and why? • Are performance differences due to the number of competitors? • Are the store/district managers performing at an expected level? • Do associates need more training? • In which markets are there opportunities to build awareness and adjust
media mix strategy?
• Why is performance lagging for a specific metric in some stores/regions? • What are the key drivers? • What is unique about the market or leaders that are yielding strong results?
• What drove higher performance for a specific period?
Analysis of these points can uncover best practices in specific markets. Company leaders can then deploy those insights to improve their business.
Actionable Insights • Take note of the market areas that over/under index when
benchmarked across other markets.
• Average transaction value is significantly higher for Region 1 ($61.73) when compared to Region 2 ($57.53). What contributes to the higher value? There may be an opportunity to re-look at elements such as associate training, product placement, store merchandise displays,etc.
EXECUTIVE DASHBOARD
Strategic Question How are product sales performing by market?
For illustrative purposes only.
©2016 Synchrony Financial. All rights reserved. No reuse without express written consent from Synchrony Financial.4
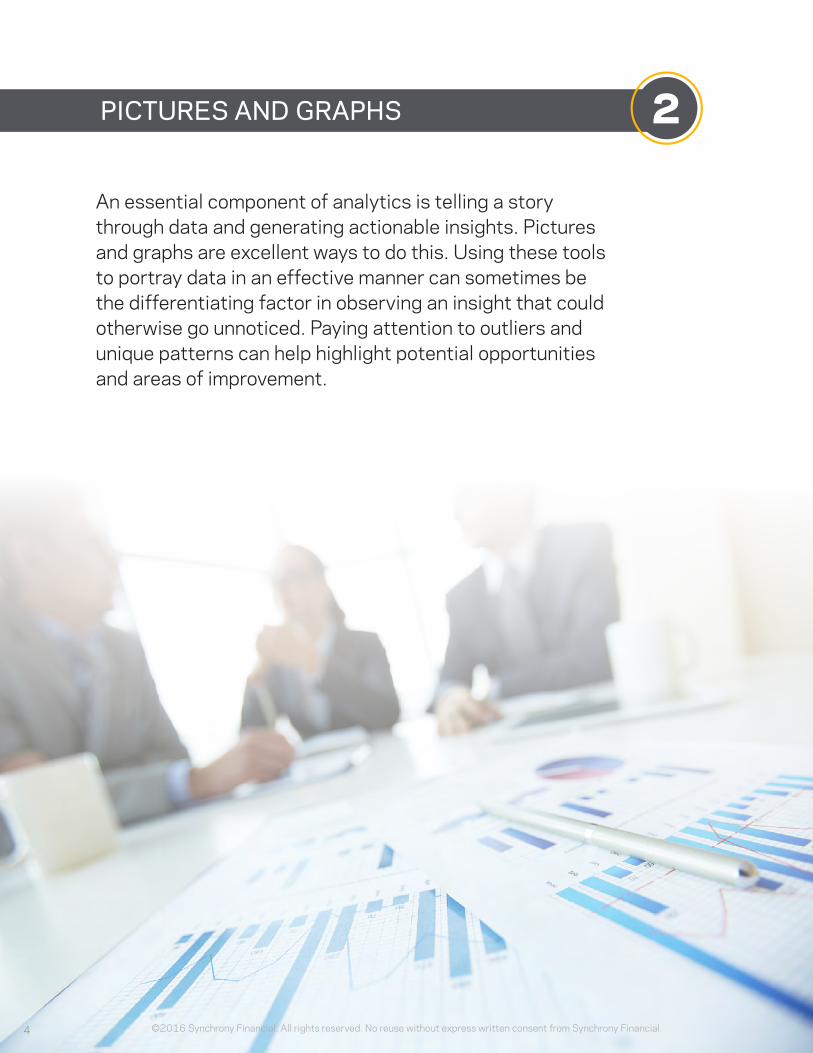
2PICTURES AND GRAPHS
An essential component of analytics is telling a story through data and generating actionable insights. Pictures and graphs are excellent ways to do this. Using these tools to portray data in an effective manner can sometimes be the differentiating factor in observing an insight that could otherwise go unnoticed. Paying attention to outliers and unique patterns can help highlight potential opportunities and areas of improvement.
Sales
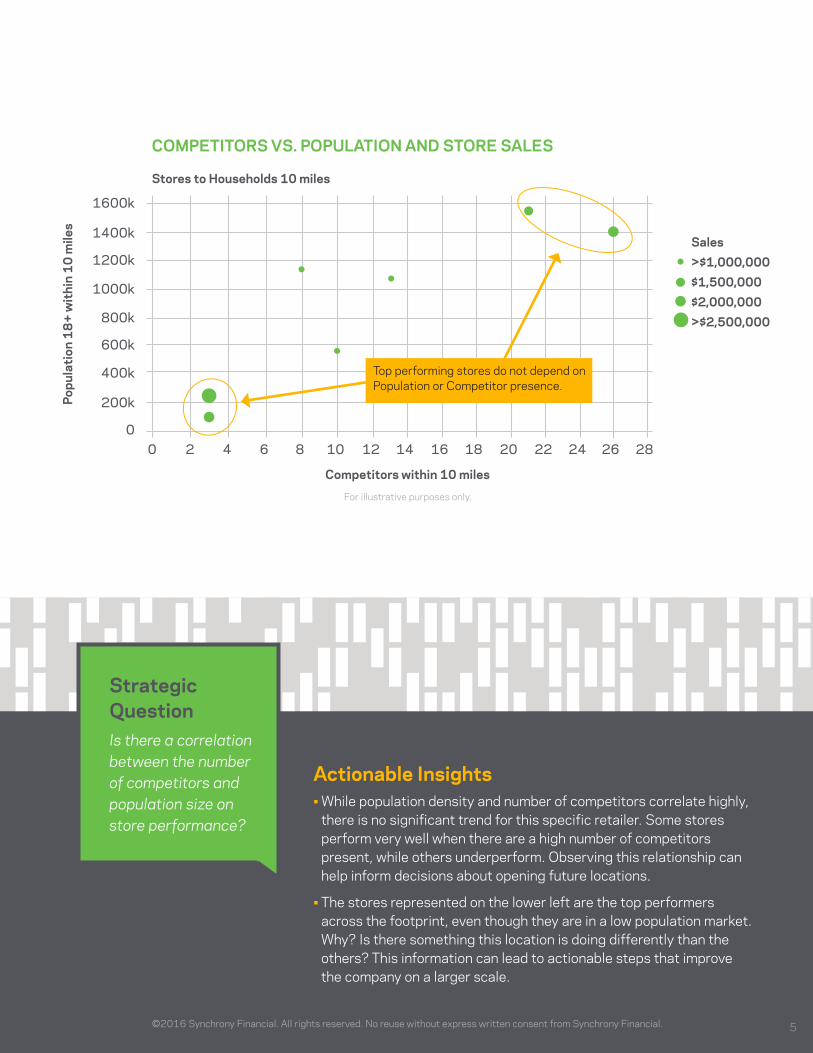
COMPETITORS VS. POPULATION AND STORE SALES
0
200k
0 2 4 6 8 10 12 14 16 18 20 22 24 26 28
400k
600k
800k
1000k
1200k
1400k
1600k
Competitors within 10 miles
Popu
lati
on 1
8+
wit
hin
10
mile
s
Stores to Households 10 miles
5©2016 Synchrony Financial. All rights reserved. No reuse without express written consent from Synchrony Financial.
Actionable Insights • While population density and number of competitors correlate highly,
there is no significant trend for this specific retailer. Some stores perform very well when there are a high number of competitors present, while others underperform. Observing this relationship can help inform decisions about opening future locations.
• The stores represented on the lower left are the top performers across the footprint, even though they are in a low population market. Why? Is there something this location is doing differently than the others? This information can lead to actionable steps that improve the company on a larger scale.
Top performing stores do not depend on Population or Competitor presence.
Strategic Question Is there a correlation between the number of competitors and population size on store performance?
Sales>$1,000,000 $1,500,000 $2,000,000 >$2,500,000
For illustrative purposes only.
©2016 Synchrony Financial. All rights reserved. No reuse without express written consent from Synchrony Financial.6
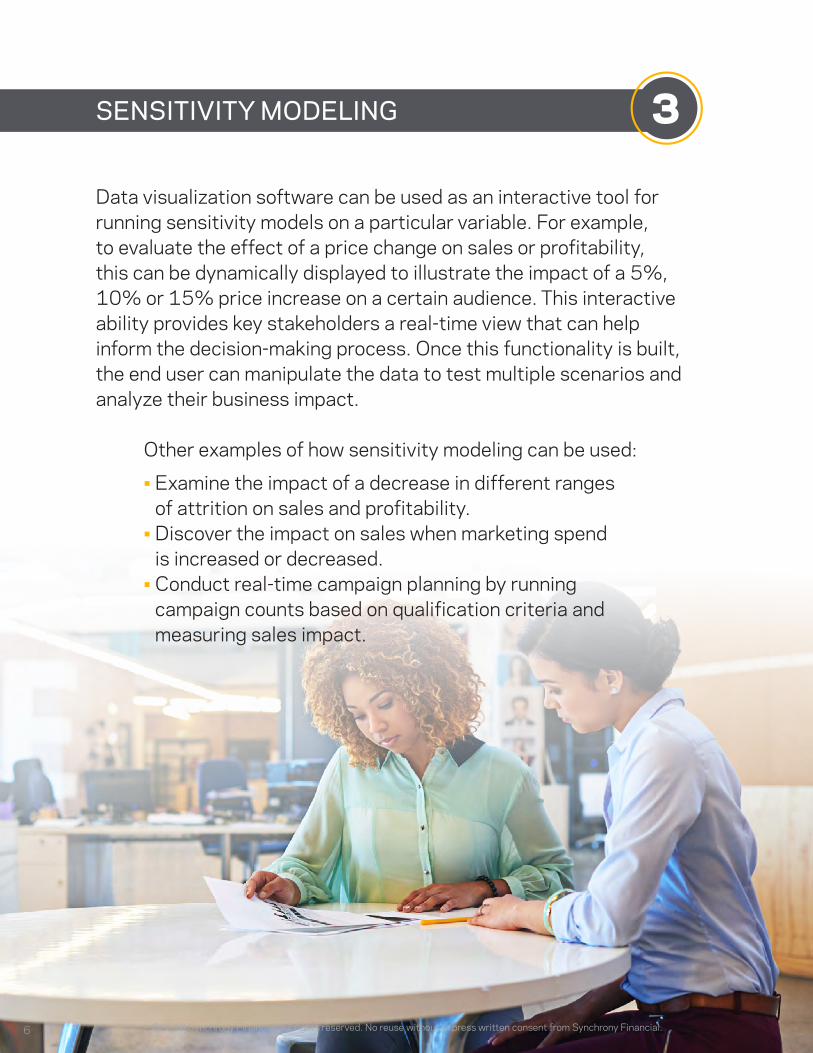
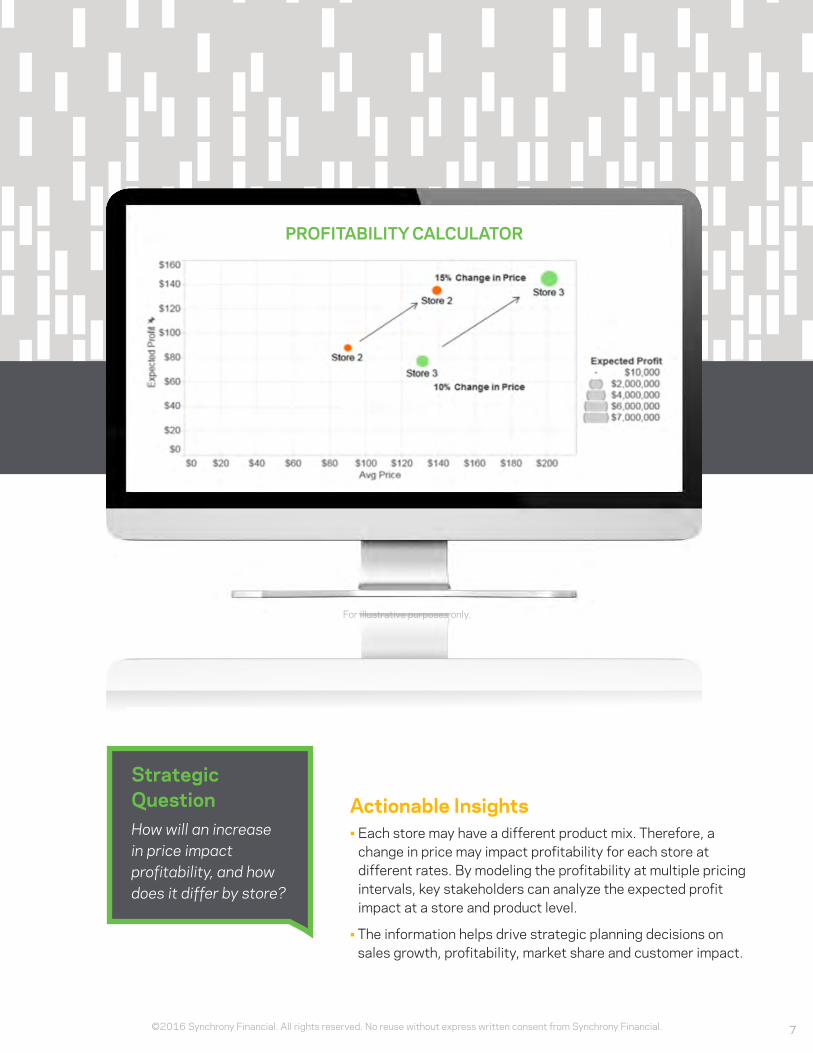
Data visualization software can be used as an interactive tool for running sensitivity models on a particular variable. For example, to evaluate the effect of a price change on sales or profitability, this can be dynamically displayed to illustrate the impact of a 5%, 10% or 15% price increase on a certain audience. This interactive ability provides key stakeholders a real-time view that can help inform the decision-making process. Once this functionality is built, the end user can manipulate the data to test multiple scenarios and analyze their business impact.
Other examples of how sensitivity modeling can be used:
• Examine the impact of a decrease in different ranges of attrition on sales and profitability.
• Discover the impact on sales when marketing spend is increased or decreased.
• Conduct real-time campaign planning by running campaign counts based on qualification criteria and measuring sales impact.
3SENSITIVITY MODELING
For illustrative purposes only.
7©2016 Synchrony Financial. All rights reserved. No reuse without express written consent from Synchrony Financial.
Strategic Question How will an increase in price impact profitability, and how does it differ by store?
Actionable Insights • Each store may have a different product mix. Therefore, a
change in price may impact profitability for each store at different rates. By modeling the profitability at multiple pricing intervals, key stakeholders can analyze the expected profit impact at a store and product level.
• The information helps drive strategic planning decisions on sales growth, profitability, market share and customer impact.
PROFITABILITY CALCULATOR
For illustrative purposes only.
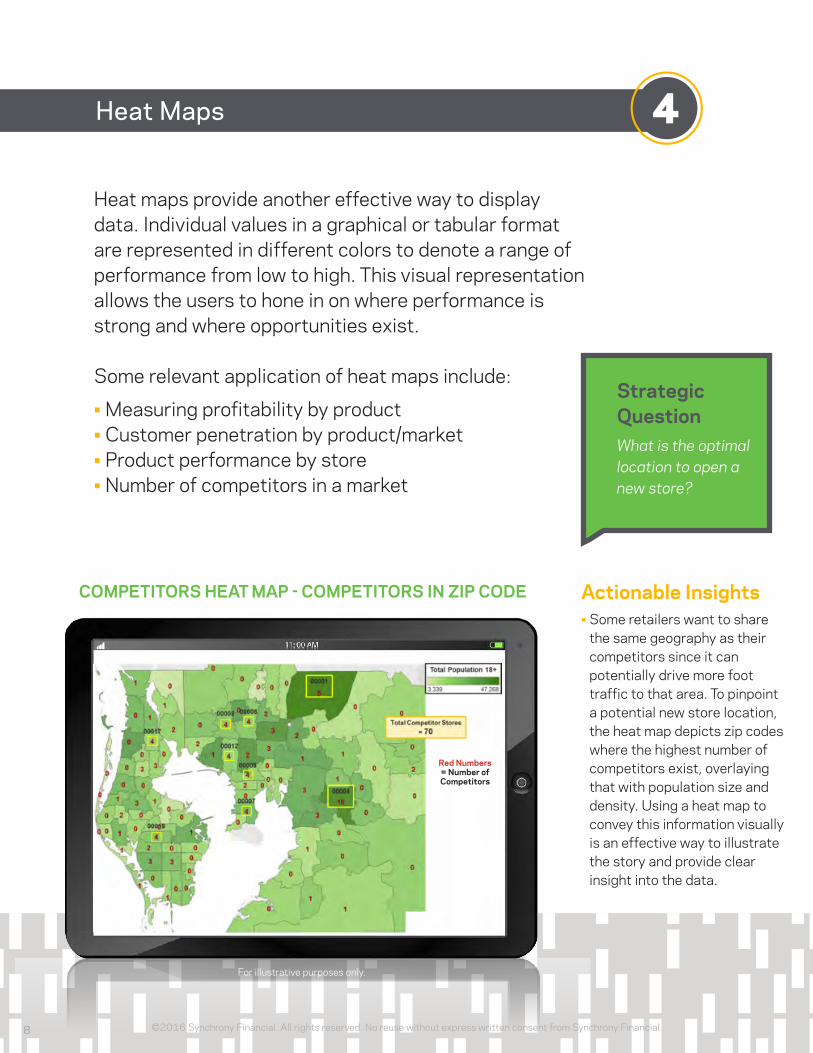
Actionable Insights • Some retailers want to share
the same geography as their competitors since it can potentially drive more foot traffic to that area. To pinpoint a potential new store location, the heat map depicts zip codes where the highest number of competitors exist, overlaying that with population size and density. Using a heat map to convey this information visually is an effective way to illustrate the story and provide clear insight into the data.
Strategic Question What is the optimal location to open a new store?
COMPETITORS HEAT MAP - COMPETITORS IN ZIP CODE
©2016 Synchrony Financial. All rights reserved. No reuse without express written consent from Synchrony Financial.8
4Heat Maps
Heat maps provide another effective way to display data. Individual values in a graphical or tabular format are represented in different colors to denote a range of performance from low to high. This visual representation allows the users to hone in on where performance is strong and where opportunities exist.
Some relevant application of heat maps include:
• Measuring profitability by product• Customer penetration by product/market• Product performance by store • Number of competitors in a market
Red Numbers = Number of Competitors
For illustrative purposes only.
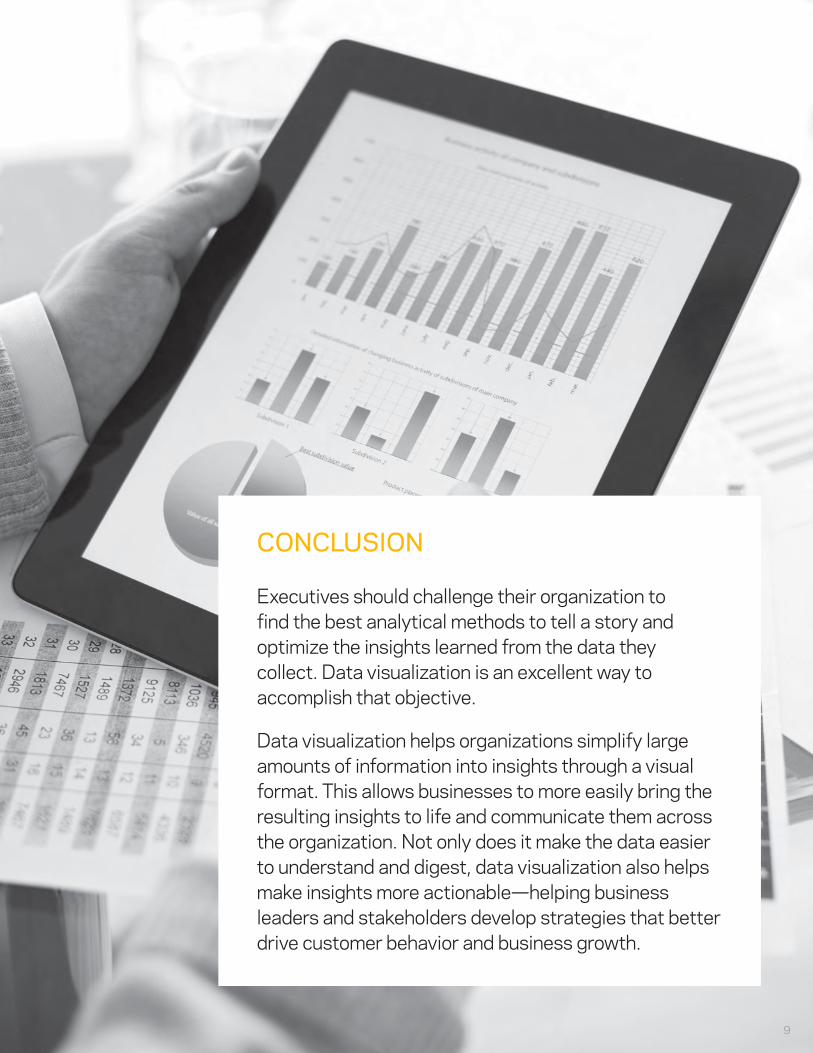
Executives should challenge their organization to find the best analytical methods to tell a story and optimize the insights learned from the data they collect. Data visualization is an excellent way to accomplish that objective.
Data visualization helps organizations simplify large amounts of information into insights through a visual format. This allows businesses to more easily bring the resulting insights to life and communicate them across the organization. Not only does it make the data easier to understand and digest, data visualization also helps make insights more actionable—helping business leaders and stakeholders develop strategies that better drive customer behavior and business growth.
CONCLUSION
9
Focus on what really matters.
Antonio Hudson—Assistant Vice President, Analytics Consulting Services David Liebskind—Vice President, Analytics Consulting Business Leader Sue Yasav—VP, Market and Research Insights
This content is subject to change without notice and offered for informational use only. You are urged to consult with your individual attorney, financial or other advisors with respect to any advice presented. Nothing contained herein shall be construed as legal advice or a legal opinion.
Synchrony Financial is one of the premier consumer financial services companies in the United States. Our roots in consumer finance trace back to 1932, and today we are the largest provider of private label credit cards in the United States, based on purchase volume and receivables. About Synchrony Connect Synchrony Connect is a value-added program that lets Synchrony Financial partners tap into our expertise in non-credit areas. It offers knowledge and tools that can help you grow, lead and operate your business. Grow Marketing, analytics and research expertise to help you drive business growth Lead Tools for leading your organization and developing yourself as a leader Operate Best practices around business strategy and optimizing cost Contact your Synchrony Financial representative or visit us at SynchronyFinancial.com or SynchronyBusiness.com to discover how we can help you grow your business.