Embed Size (px)
Citation preview
Data Mining Classification: Basic Concepts, Decision
Trees, and Model EvaluationLecture Notes for Chapter 4
Part I
Introduction to Data Miningby
Tan, Steinbach, KumarAdapted by Qiang Yang (2010)
© Tan,Steinbach, Kumar Introduction to Data Mining 4/18/2004 1
Classification: Definition• Given a collection of records (training set )
– Each record contains a set of attributes, one of the attributes is the class.
• Find a model for class attribute as a function of the values of other attributes.
• Goal: previously unseen records should be assigned a class as accurately as possible.– A test set is used to determine the accuracy of the model. Usually, the given data set is divided into training and test sets, with training set used to build the model and test set used to validate it.
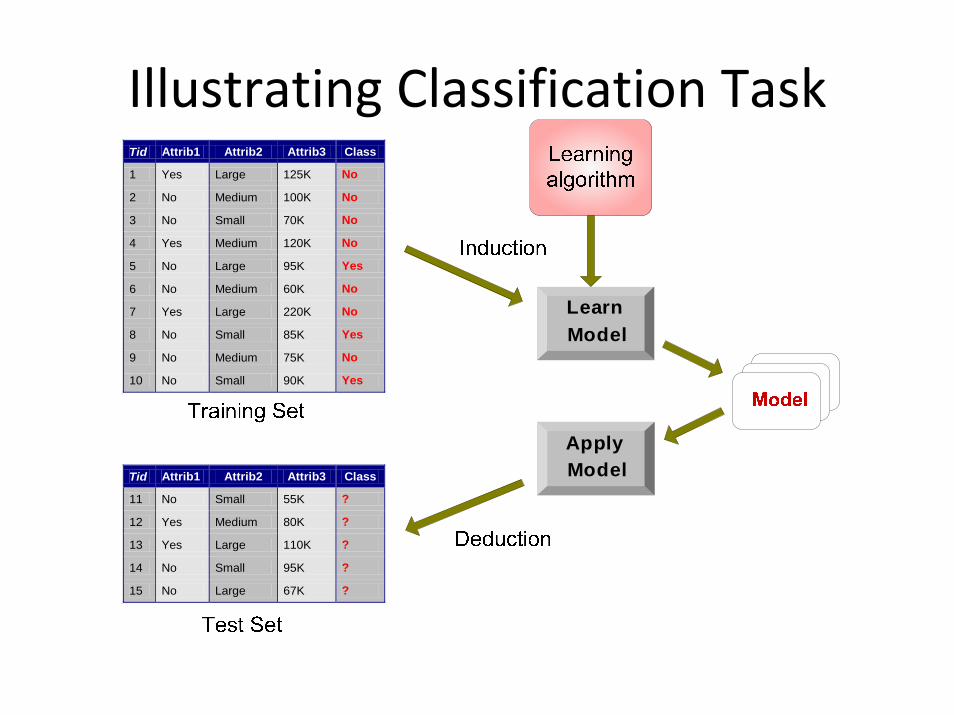
Illustrating Classification Task
Apply Model
Learn Model
Tid Attrib1 Attrib2 Attrib3 Class
1 Yes Large 125K No
2 No Medium 100K No
3 No Small 70K No
4 Yes Medium 120K No
5 No Large 95K Yes
6 No Medium 60K No
7 Yes Large 220K No
8 No Small 85K Yes
9 No Medium 75K No
10 No Small 90K Yes 10
Tid Attrib1 Attrib2 Attrib3 Class
11 No Small 55K ?
12 Yes Medium 80K ?
13 Yes Large 110K ?
14 No Small 95K ?
15 No Large 67K ? 10
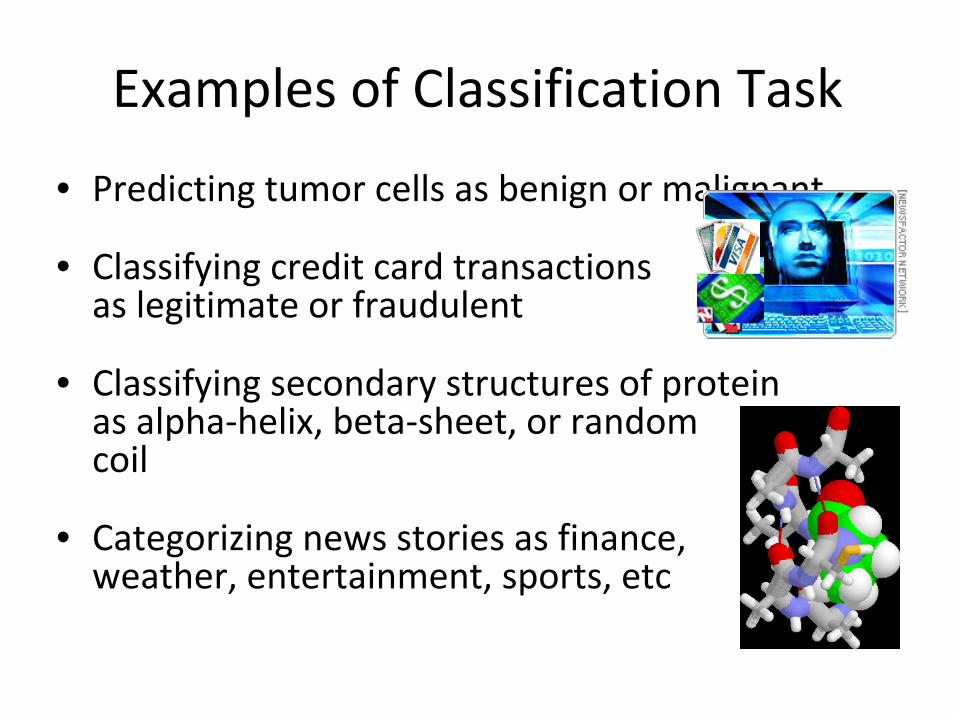
Examples of Classification Task
• Predicting tumor cells as benign or malignant
• Classifying credit card transactions as legitimate or fraudulent
• Classifying secondary structures of protein as alpha‐helix, beta‐sheet, or random coil
• Categorizing news stories as finance, weather, entertainment, sports, etc
Classification Techniques
• Decision Tree based Methods
• Rule‐based Methods
• Memory based reasoning
• Neural Networks
• Naïve Bayes and Bayesian Belief Networks
• Support Vector Machines
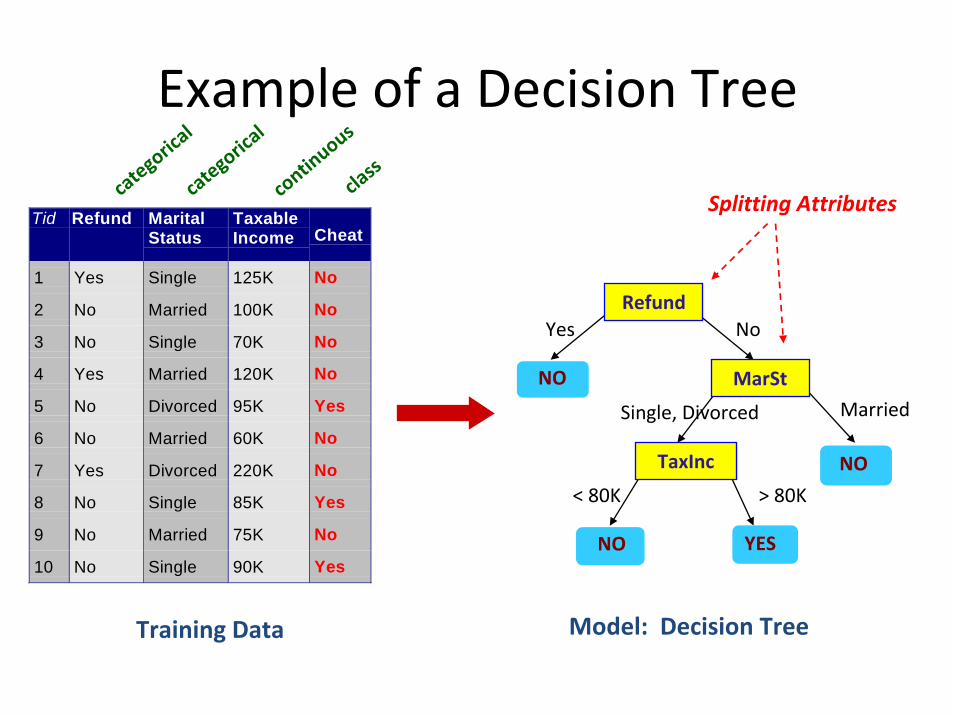
Example of a Decision Tree
Tid Refund MaritalStatus
TaxableIncome Cheat
1 Yes Single 125K No
2 No Married 100K No
3 No Single 70K No
4 Yes Married 120K No
5 No Divorced 95K Yes
6 No Married 60K No
7 Yes Divorced 220K No
8 No Single 85K Yes
9 No Married 75K No
10 No Single 90K Yes10
categorical
categorical
continuous
class
Refund
MarSt
TaxInc
YESNO
NO
NO
Yes No
MarriedSingle, Divorced
< 80K > 80K
Splitting Attributes
Training Data Model: Decision Tree
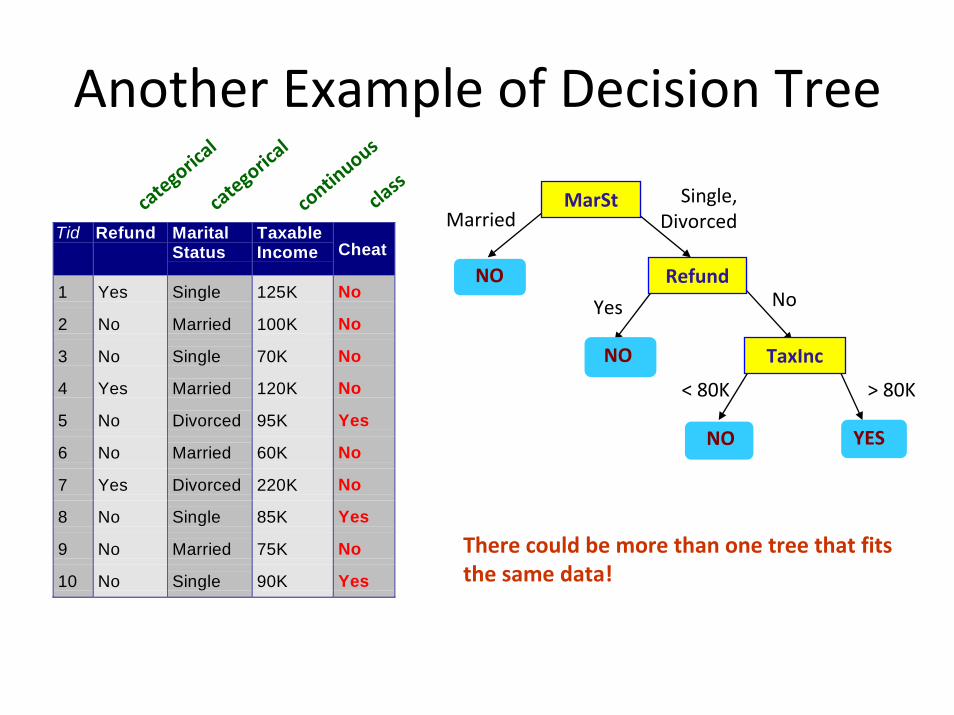
Another Example of Decision Tree
Tid Refund MaritalStatus
TaxableIncome Cheat
1 Yes Single 125K No
2 No Married 100K No
3 No Single 70K No
4 Yes Married 120K No
5 No Divorced 95K Yes
6 No Married 60K No
7 Yes Divorced 220K No
8 No Single 85K Yes
9 No Married 75K No
10 No Single 90K Yes10
categorical
categorical
continuous
class
MarSt
Refund
TaxInc
YESNO
NO
NO
Yes No
MarriedSingle,
Divorced
< 80K > 80K
There could be more than one tree that fits the same data!
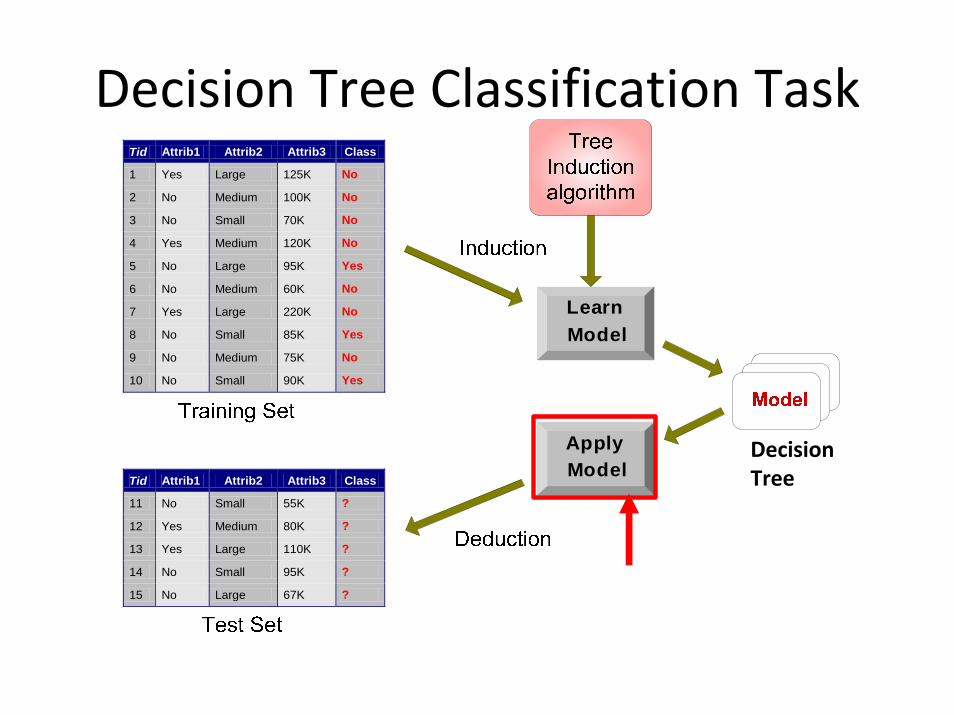
Decision Tree Classification Task
Apply Model
Learn Model
Tid Attrib1 Attrib2 Attrib3 Class
1 Yes Large 125K No
2 No Medium 100K No
3 No Small 70K No
4 Yes Medium 120K No
5 No Large 95K Yes
6 No Medium 60K No
7 Yes Large 220K No
8 No Small 85K Yes
9 No Medium 75K No
10 No Small 90K Yes 10
Tid Attrib1 Attrib2 Attrib3 Class
11 No Small 55K ?
12 Yes Medium 80K ?
13 Yes Large 110K ?
14 No Small 95K ?
15 No Large 67K ? 10
Decision Tree
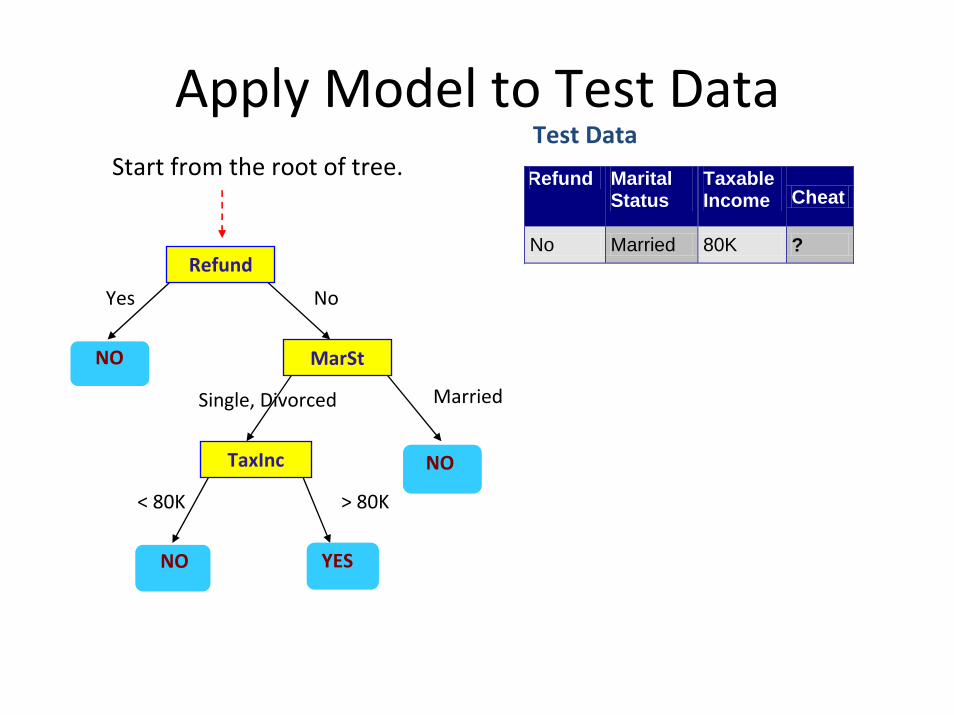
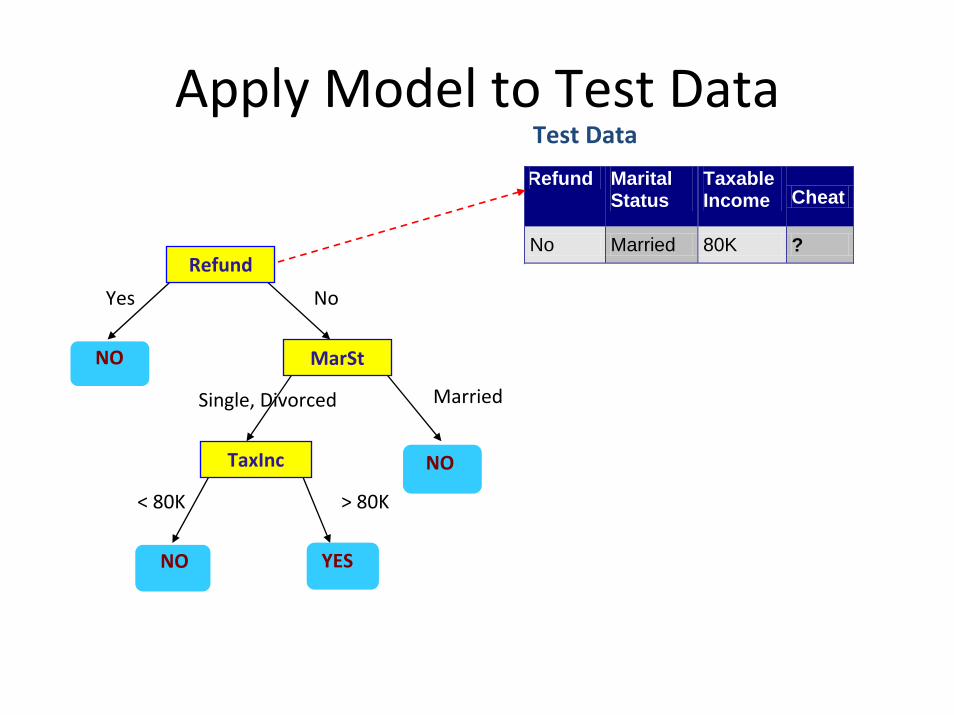
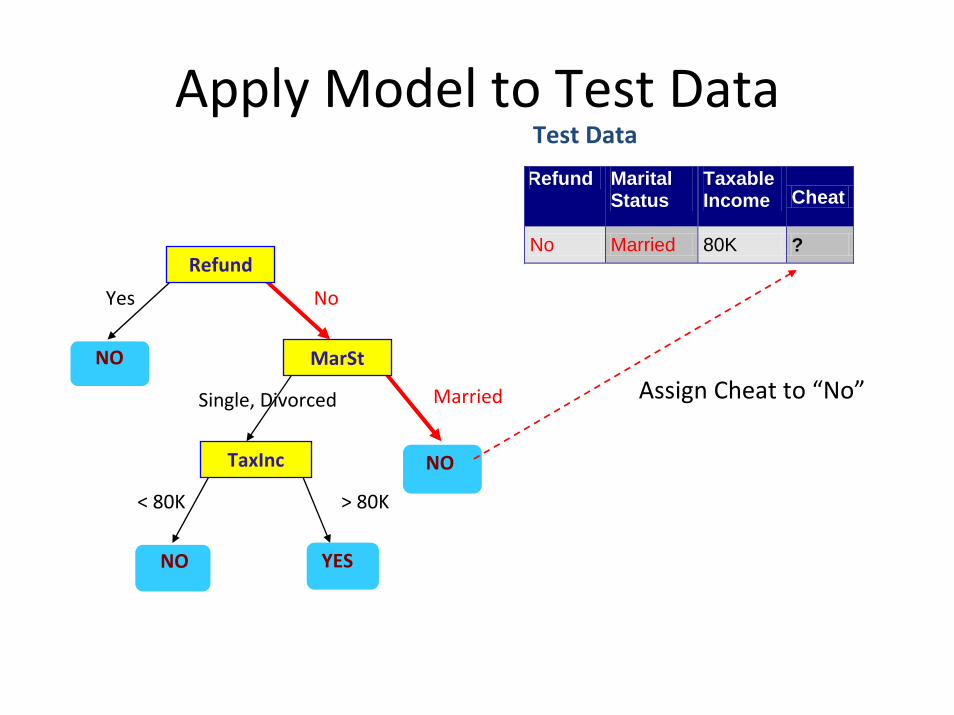
Apply Model to Test Data
Refund
MarSt
TaxInc
YESNO
NO
NO
Yes No
MarriedSingle, Divorced
< 80K > 80K
Refund Marital Status
Taxable Income Cheat
No Married 80K ? 10
Test DataStart from the root of tree.
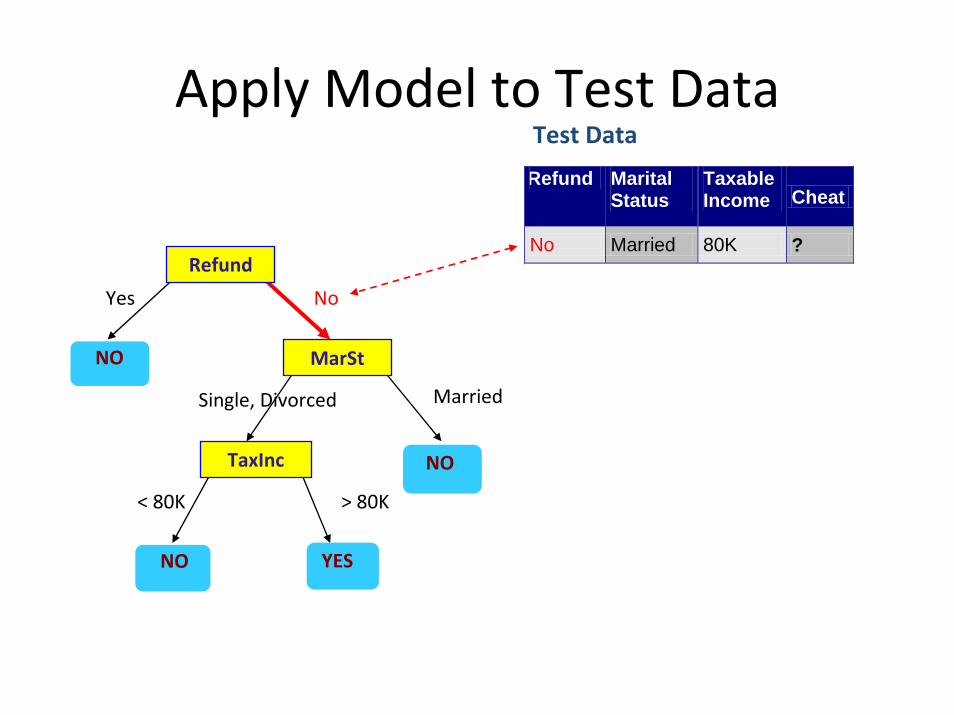
Apply Model to Test Data
Refund
MarSt
TaxInc
YESNO
NO
NO
Yes No
MarriedSingle, Divorced
< 80K > 80K
Refund Marital Status
Taxable Income Cheat
No Married 80K ? 10
Test Data
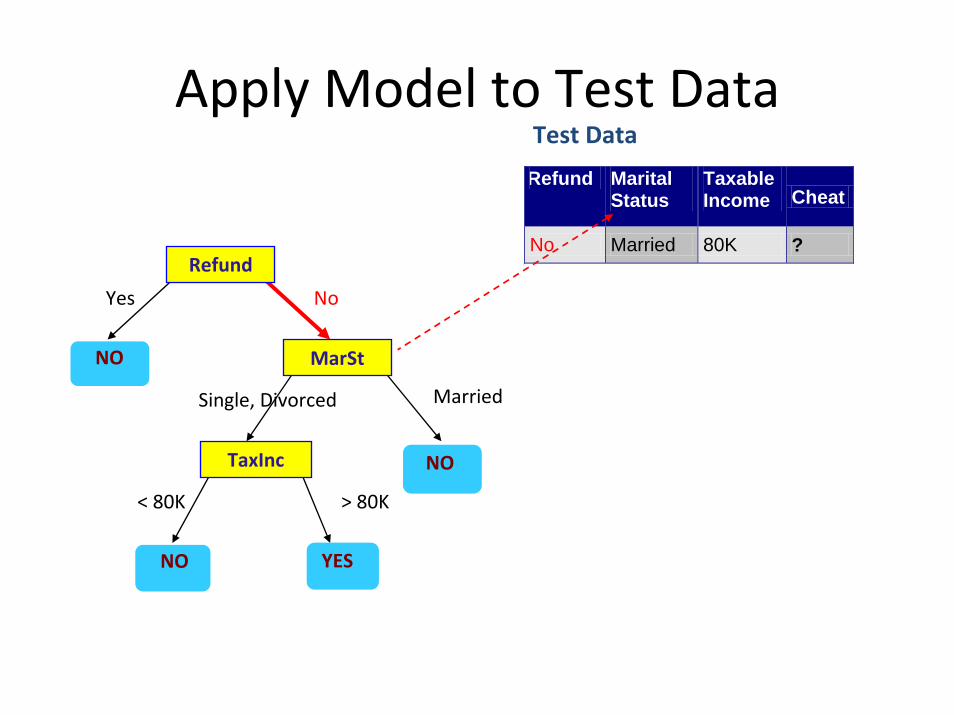
Apply Model to Test Data
Refund
MarSt
TaxInc
YESNO
NO
NO
Yes No
MarriedSingle, Divorced
< 80K > 80K
Refund Marital Status
Taxable Income Cheat
No Married 80K ? 10
Test Data
Apply Model to Test Data
Refund
MarSt
TaxInc
YESNO
NO
NO
Yes No
MarriedSingle, Divorced
< 80K > 80K
Refund Marital Status
Taxable Income Cheat
No Married 80K ? 10
Test Data
Apply Model to Test Data
Refund
MarSt
TaxInc
YESNO
NO
NO
Yes No
Married Single, Divorced
< 80K > 80K
Refund Marital Status
Taxable Income Cheat
No Married 80K ? 10
Test Data
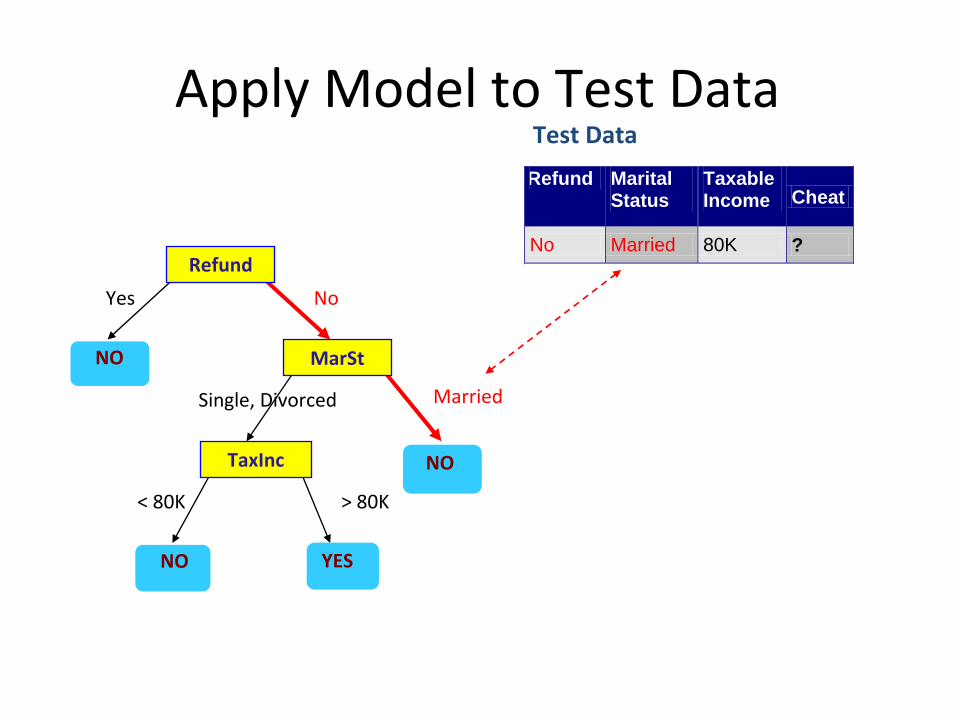
Apply Model to Test Data
Refund
MarSt
TaxInc
YESNO
NO
NO
Yes No
Married Single, Divorced
< 80K > 80K
Refund Marital Status
Taxable Income Cheat
No Married 80K ? 10
Test Data
Assign Cheat to “No”
Decision Trees as a Computer Program
• Rewrite the previous decision trees as a If‐then‐else statement
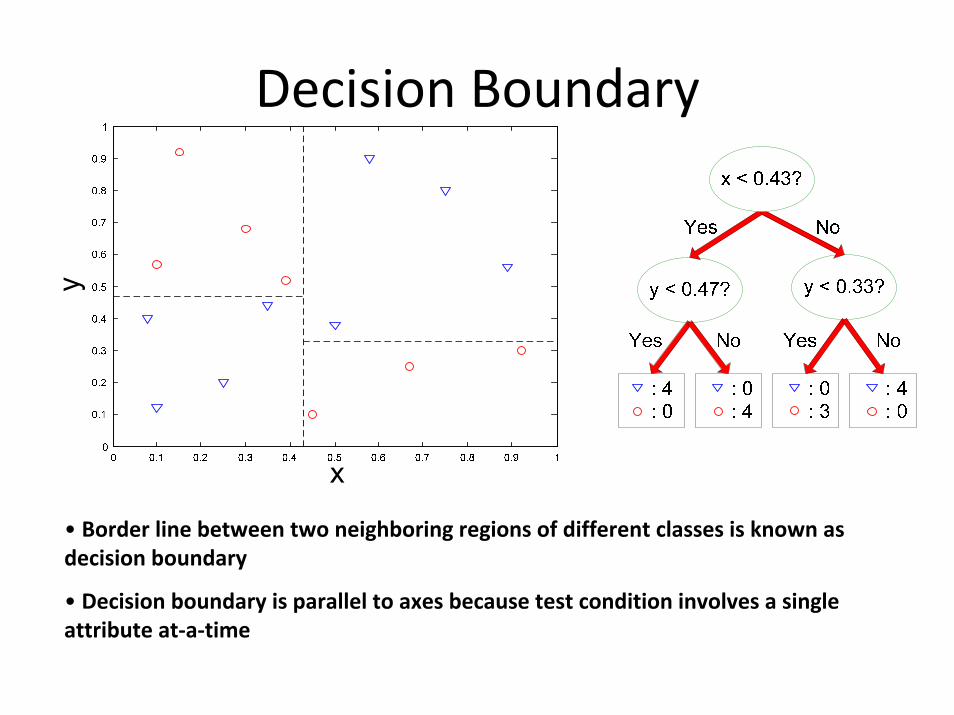
Decision Boundary
• Border line between two neighboring regions of different classes is known as decision boundary
• Decision boundary is parallel to axes because test condition involves a single attribute at‐a‐time
Interpretation of a Node in a Tree
• As a subset of a training data set
Tree Evaluation
• Test set– Ground truth, data labeling, mechanical Turk
• Confusion Matrix and cost matrix– True positive, true negative, false positive, false negative
• Accuracy
• Error rates
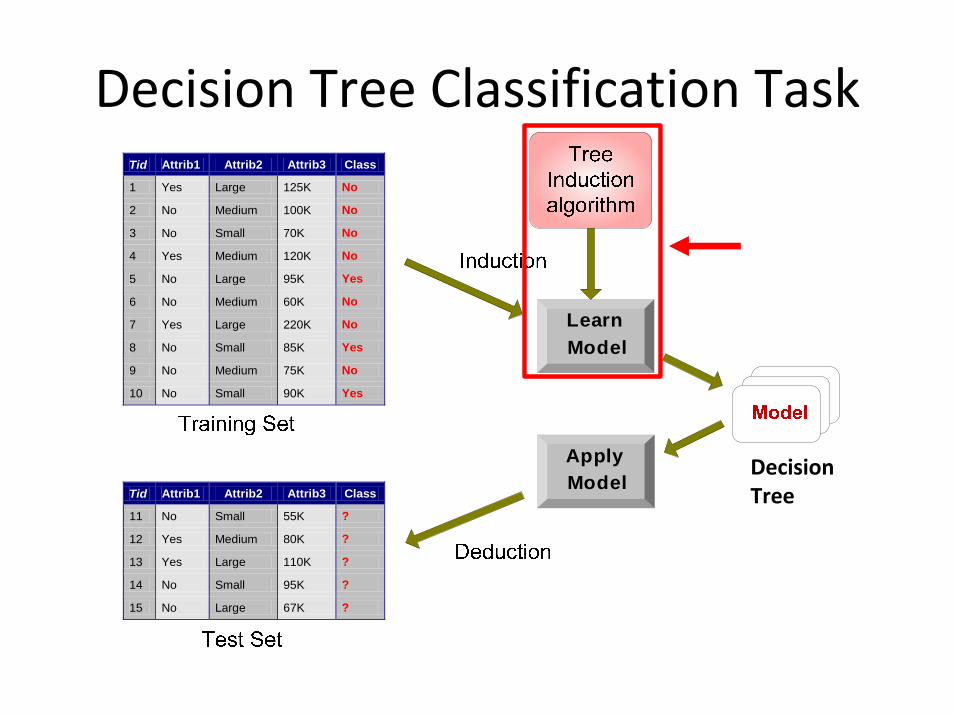
Decision Tree Classification Task
Apply Model
Learn Model
Tid Attrib1 Attrib2 Attrib3 Class
1 Yes Large 125K No
2 No Medium 100K No
3 No Small 70K No
4 Yes Medium 120K No
5 No Large 95K Yes
6 No Medium 60K No
7 Yes Large 220K No
8 No Small 85K Yes
9 No Medium 75K No
10 No Small 90K Yes 10
Tid Attrib1 Attrib2 Attrib3 Class
11 No Small 55K ?
12 Yes Medium 80K ?
13 Yes Large 110K ?
14 No Small 95K ?
15 No Large 67K ? 10
Decision Tree
Decision Tree Induction
• Many Algorithms:– CART (Classification and Regression Trees)
– ID3, C4.5, C5.0
– Other more scalable algorithms

Tree Induction
• Greedy strategy.– Split the records based on an attribute test that optimizes certain criterion.
• Issues– Determine how to split the records
• How to specify the attribute test condition?• How to determine the best split?
– Determine when to stop splitting– Determine how to cut back if tree is too deep
• What is wrong with a tree that is too deep?
How to Specify Test Condition?
• Depends on attribute types– Nominal– Ordinal– Continuous
• Depends on number of ways to split– 2‐way split– Multi‐way split
• Based on the number of discrete values
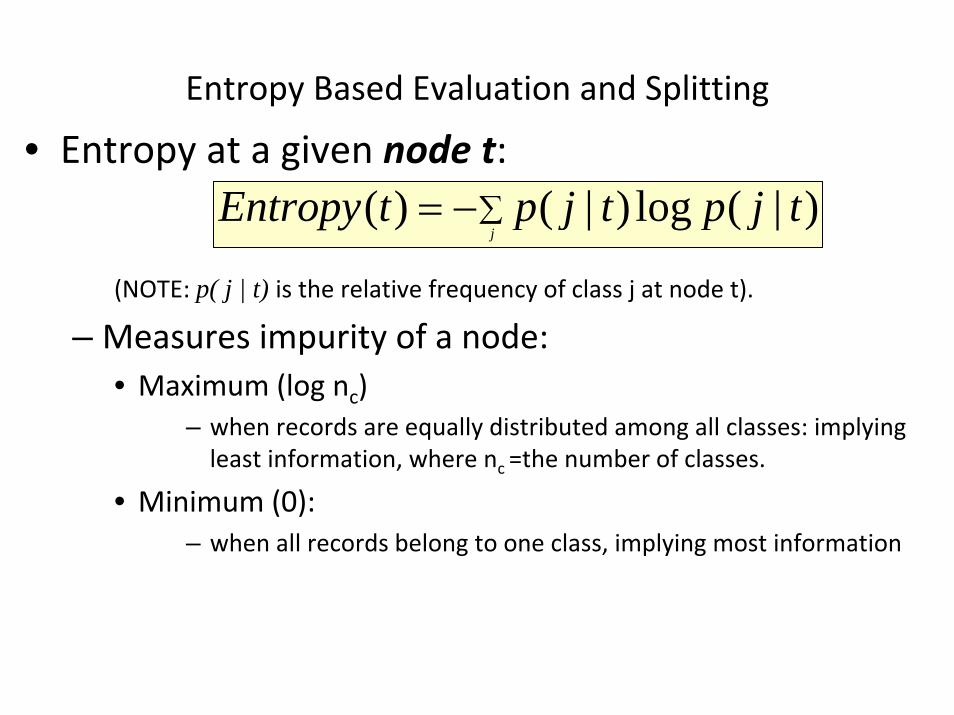
Entropy Based Evaluation and Splitting
• Entropy at a given node t:
(NOTE: p( j | t) is the relative frequency of class j at node t).
– Measures impurity of a node:• Maximum (log nc)
– when records are equally distributed among all classes: implyingleast information, where nc =the number of classes.
• Minimum (0): – when all records belong to one class, implying most information
∑−=j
tjptjptEntropy )|(log)|()(
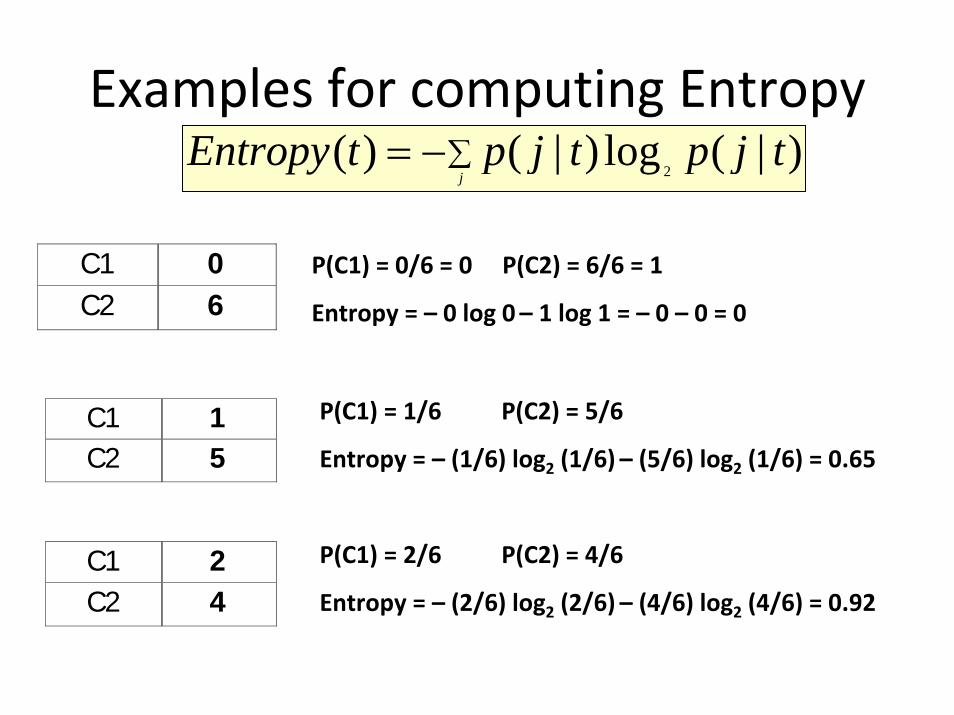
Examples for computing Entropy
C1 0 C2 6
C1 2 C2 4
C1 1 C2 5
P(C1) = 0/6 = 0 P(C2) = 6/6 = 1
Entropy = – 0 log 0– 1 log 1 = – 0 – 0 = 0
P(C1) = 1/6 P(C2) = 5/6
Entropy = – (1/6) log2 (1/6) – (5/6) log2 (1/6) = 0.65
P(C1) = 2/6 P(C2) = 4/6
Entropy = – (2/6) log2 (2/6) – (4/6) log2 (4/6) = 0.92
∑−=j
tjptjptEntropy )|(log)|()(2
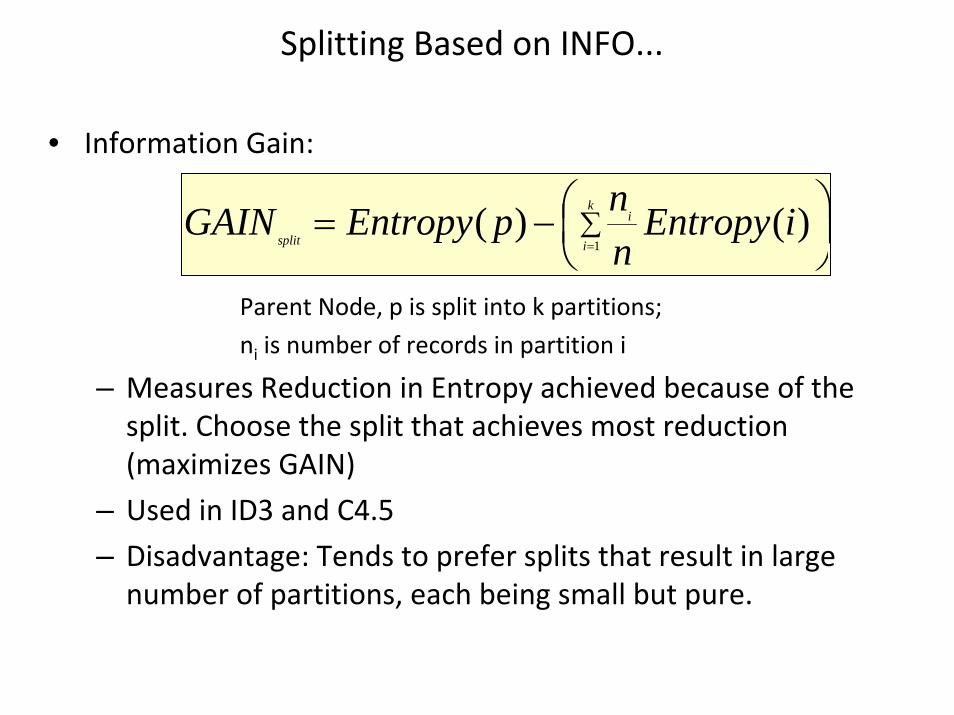
Splitting Based on INFO...
• Information Gain:
Parent Node, p is split into k partitions;
ni is number of records in partition i
– Measures Reduction in Entropy achieved because of the split. Choose the split that achieves most reduction (maximizes GAIN)
– Used in ID3 and C4.5
– Disadvantage: Tends to prefer splits that result in large number of partitions, each being small but pure.
⎟⎠⎞
⎜⎝⎛−= ∑
=
k
i
i
splitiEntropy
nnpEntropyGAIN
1)()(
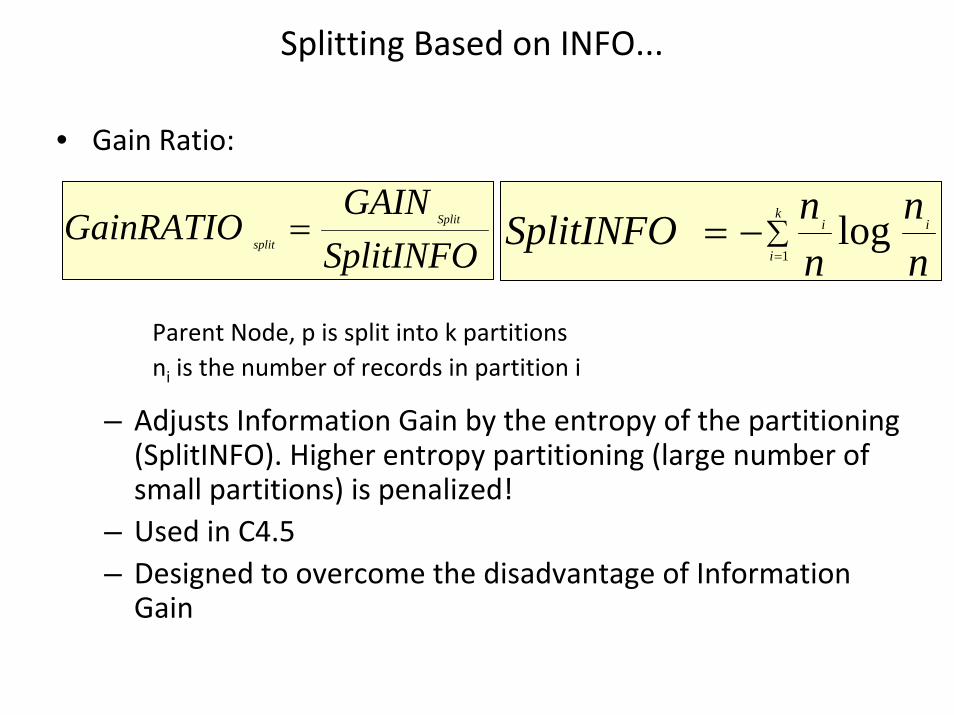
Splitting Based on INFO...
• Gain Ratio:
Parent Node, p is split into k partitionsni is the number of records in partition i
– Adjusts Information Gain by the entropy of the partitioning (SplitINFO). Higher entropy partitioning (large number of small partitions) is penalized!
– Used in C4.5– Designed to overcome the disadvantage of Information Gain
SplitINFOGAIN
GainRATIO Split
split= ∑
=−=
k
i
ii
nn
nnSplitINFO
1log
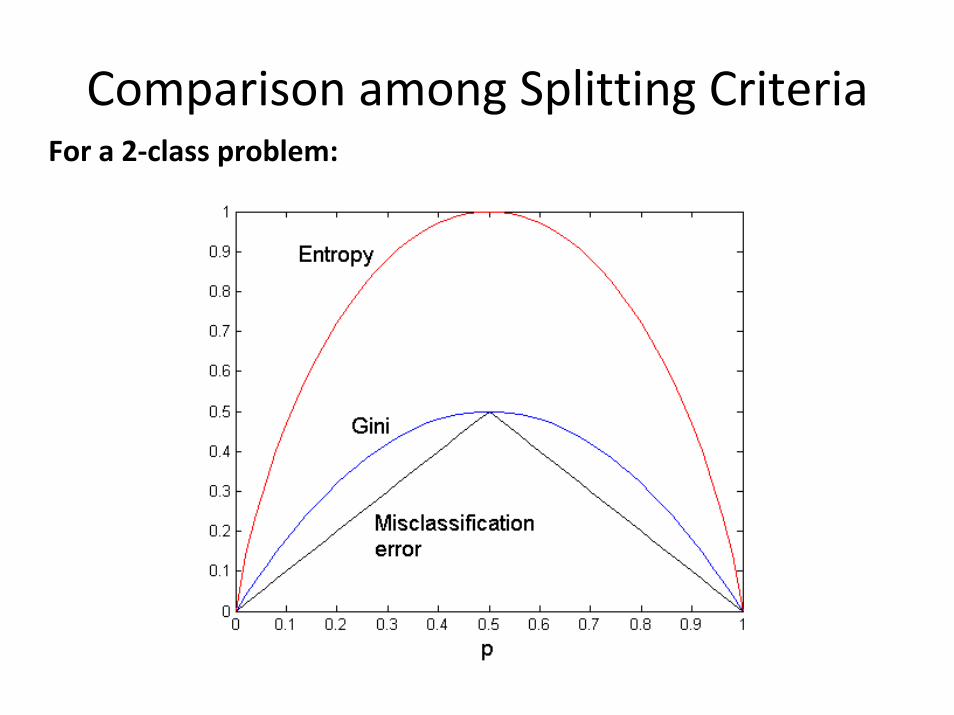
Comparison among Splitting CriteriaFor a 2‐class problem:
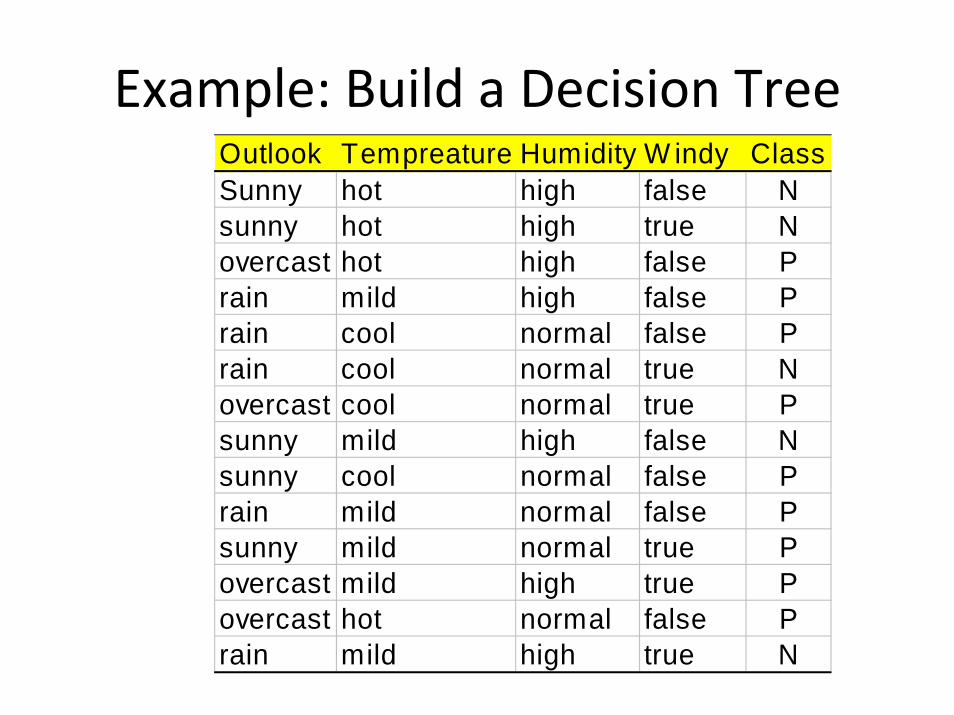
Outlook Tempreature Humidity W indy ClassSunny hot high false Nsunny hot high true Novercast hot high false Prain mild high false Prain cool normal false Prain cool normal true Novercast cool normal true Psunny mild high false Nsunny cool normal false Prain mild normal false Psunny mild normal true Povercast mild high true Povercast hot normal false Prain mild high true N
Example: Build a Decision Tree


![Most Important nodes in the Social Networks?home.cse.ust.hk/~qyang/621U/Slides/Most Influential Points in the... · Algorithms knowing Complete Network Structure: [2] Algorithms without](https://img.dokumen.tips/doc/110x75/5f279d5903758e51815ae50d/most-important-nodes-in-the-social-networkshomecseusthkqyang621uslidesmost.jpg)

![Using AUC and Accuracy in Evaluating Learning Algorithmshome.cse.ust.hk/~qyang/Teaching/537/Papers/AUC-evaluation.pdf · How does recent Support Vector Machine (SVM) [2], [8], [30]](https://img.dokumen.tips/doc/110x75/5e1e61c20091bc18df19e1b2/using-auc-and-accuracy-in-evaluating-learning-qyangteaching537papersauc-evaluationpdf.jpg)