Embed Size (px)
Citation preview
lournal of Computer Assisted Learning (1996) 12,130-145
Datu-logging: effects on practical science 1. Rogers' and P. Wi ld *university of Leicester & bughborough university
Abstract This paper describes an investigation into the processes and effects of using electronic data-logging in practical science. A pilot study of classical laboratory work in schools was compared with similar tasks performed with data-logging systems. A more detailed exploration of pupils' performance was then conducted through an extensive series of observations in a range of secondary schools. The results reinforce previous indications of the potential benefits of data-logging, but such benefits must be viewed in the curriculum context of the type of measurement activity and the pedagogical context of teaching and learning objectives. The paper concludes with a discussion of the latter issues.
Keywords: Data-logging; Information technology; Secondary schools; Science; Laboratory
Introduction
Since the early 1980s the use of computers in schools in the UK has developed from beginnings as an extension of the teaching of mathematics to a broad and sophisticated range of activities embracing the whole curriculum. In science, an important development has been the application of computers to laboratory work, involving measurements using sensors, interfaces and data-loggers. (Outside the UK this type of activity is often referred to as MBL - microcomputer-based laboratory.) Despite the fact that the software and hardware tools for this type of activity are now refined and very easy to use, school science departments have been rather slow to adopt data-logging technology (OFSTED, 1995). The reasons for this reticence are often cited as a mixture of limited funds, limited time and limited training opportunities for science teachers (NCET, 1993; Barton, 1994). It is also possible that limited awareness of the learning benefits has caused a failure to gain the professional commitment of teachers.
Recently, the adoption of this technology in schools has been encouraged by Government legislation and funding initiatives; with the introduction of the National Curriculum, specific targets for the use of IT were identified; a
Accepted: 15 February 1996
Correspondence: Laurence Ro ers, School of Education, University of Leicester, 21 University R M ~ , Leicester &EI ~ R F UK 130
Email: [email protected]
Data-logging: effects on practical science 131
DFE funded programme evaluating portable computers and a further programme of GEST' funding, have sponsored the purchase of equipment and the inauguration of many projects in schools exploring IT in science. These initiatives appear to have been driven by progressive professional opinion of the benefits of IT rather than by a core of research evidence. Indeed some of the meagre research evidence available appears to give only weak support to the learning benefits of IT (Hammond, 1994).
An improved understanding is needed both to justify funding and investment initiatives and to persuade professionals that the innovation is worthwhile on educational grounds. Accordingly, the aim of this study was to examine the use of data-logging methods in school science laboratories to look for evidence of the educational benefits claimed for the technology.
The theoretical base for the study
It is easier to describe data-logging activities (Frost, 1995) than to define their benefits to pupils' learning and understanding of science. Reports on the claimed benefits fall into two main categories. First, many reports really only refer to the technical features of hardware and software and their method of application rather than the measured outcomes and gains in learning. They are also mainly articulated through professional opinion and anecdotal evidence rather than through rigourous investigation. Two examples of such lists of advantages of data-logging are:
extend pupils' powers of observations; improve the quality of measurement; record data in informative ways; facilitate interpretation (comparing data etc.); provide calculating and analysing aids for investigating data; communicate results to bring out their significance; motivate pupils through prompt feedback.
enhance learning by extending the range of student investigations; usable by the novice; can encourage critical thinking skills by reducing the drudgery of data
can encourage learning from peers; may be an effective means of teaching graphing; may make the abstract 'concrete' through immediate feedback.
(Rogers, 1987)
collection;
(Thornton, 1987) Secondly, there are reports of research which has seriously attempted to evaluate the educational potential of data-logging and to identify the effect of the technology on skills associated with learning science. Amongst such skills, graphing skills have been strongly linked with the process of investigating scientific relationships (McKenzie & Padilla, 1986). Studies have shown that pupils' interpretation of graphs is significantly improved
The UK Department for Education (DFE) supported the Grant for Educational Support and Training (GET) initiative.
132 L. Rogers and P. Wild
when using MBL (Mokros & Tinker, 1987). It has been argued that special features of graphing software provide useful aids to help pupils overcome a variety of difficulties normally associated with manual methods of manipulating graphs (Rogers, 1992). It has been recognised that the use of IT encourages high order skills (HMI, 1989) and facilitates the development of scientific reasoning skills used in problem solving (Friedler, ef nl., 1990). Skills of graphical interpretation develop very quickly in real-time reporting where the graphic representation is promptly linked to events, and they also show strong links with reflection and interpretation (Brasell, 1985).
Unfortunately, much of the relevant research published to date pre-dates the rapid developments of microcomputer technology during the early 1990s. In particular, significant advances in software design have made available graphical user interfaces which have transformed the usability of computers in education. Also, in the UK, there have been great advances in the design of sensors and interfaces for data-logging which has made the technology much more accessible and available for use in regular classrooms. These changes call for a review of the existing research evidence and fresh research into classroom application.
The pilot study
The aim of the first phase of research was to test the notions of the value of data-logging by investigating the reality of classrooms where these methods were in use. An attempt was made to identify and measure the potential contributions of data-logging to the quality of learning from the practical work. In addition, the research sought to uncover attitudes and opinions of both pupils and teachers about the influence of IT.
The research was conducted in three secondary schools over a period of nine months and employed a range of techniques: observations of lessons, pretest and post-tests for pupils, interviews with pupils and discussion meetings with teachers. The age of pupils ranged from 12 to 15 and groups were chosen to represent a spread of ability. Lessons and topics were chosen in such a way that the work fitted into the curriculum with minimum disruption to the normal routine. Overall, the observations spanned a diversity of teaching styles and lesson organisation. In each situation, groups of pupils were observed on parallel tasks; some groups used IT whilst others used conventional non-IT measuring methods. The chief objective of the observations was to compare the performance of the two
A full description of the pilot study has already been reported (Rogers & Wild, 1994). This paper restates the principal pilot findings and shows how these were used to design the main study.
types of group.
Pupils ’ tests In each school, teachers devised tests to assess their objectives of the lessons containing the practical activities. The topics of the lessons ranged from heating and cooling, motion measurements and electrical measurements.
Data-logging: effects on practical science 133
Most of the lessons contained an element of graphical presentation and analysis. In most cases similar tests were given to pupils before and after the practical activity. In some cases standard endaf-module tests were used as well. In only one of the three schools did the results of the pretests and post-tests show any significant bias in favour of the IT groups. An interesting feature of this case was that the main demand in the tests focussed very strongly on the analysis of graphs. This is significant because it is in graph work that computer software offers many facilities for manipulating and obtaining information. Thus the enriched experience gained from the use of the computer appeared to have a beneficial effect on pupils' test performances. In contrast, for the tests used in the other two schools, the use of the computer appeared to confer no advantage. Close scrutiny of the design of these tests showed that they tended to reward knowledge and skills which were not particularly amplified by the use of the computer.
Lesson observations During a number of selected lessons, groups of pupils were observed systematically using a schedule to analyse the time spent on various types of task. Comparing the time profiles of IT and non-IT groups there was a trend whereby IT groups spent more time in discussing their data, and they tended to move on to discussion and extension questions sooner in lessons. This changed emphasis towards discussion and thinking activity supports the generally agreed view amongst the teachers that IT had proved to be a valuable tool for promoting an investigative approach.
Teaching style For the researchers, one of the most significant outcomes of the pilot study was the indication that positive teaching strategies were needed for exploiting the opportunities afforded with IT. For example, it may be claimed that the increase in time pupils spent on discussing results was not assured through the use of IT alone; the teacher had a crucial role in developing pupils' skill to discuss effectively. The software merely provided the tool for prompting discussion and inquiry and its success had to be developed through a classroom culture which encouraged pupils to ask questions and explore their ideas. As another example, the teacher can develop a new approach to graphwork responding to the fact that the computer generates the graph with such ease and flexibility.
Indicators from the pilot study The most positive effects of IT indicated by the pilot study relate to the character of pupils' activity rather than measures of their achievement. It was difficult to draw any firm conclusions about the quality of learning within the time scale of the lesson activities in the study. However the apparent shift in emphasis from the mechanical aspects of measurement towards discussion and thinking activity, and the need to review lesson objectives when using IT deserved further detailed investigation.
134 L. Rogers and P. Wild
The main study - observations of practical lessons
The main phase of research aimed to test the hypothesis that pupils using IT spend more time discussing and evaluating their results compared with pupils using conventional measuring methods. Evidence was gathered through observations of groups of pupils in practical lessons in eight schools over a period of 18 months. A systematic schedule for making observations was devised and used by five researchers who visited a variety of lessons involving the use of IT methods and conventional methods of measurement.
Design of the observation schedule The purpose of the schedule was to systemise observations to find out the frequency and approximate duration of different types of pupil activity in the lessons which might, but not necessarily, include the use of IT. It was designed to be applied to the mainstream of practical lessons where pupils are organised into working groups of about three or four.
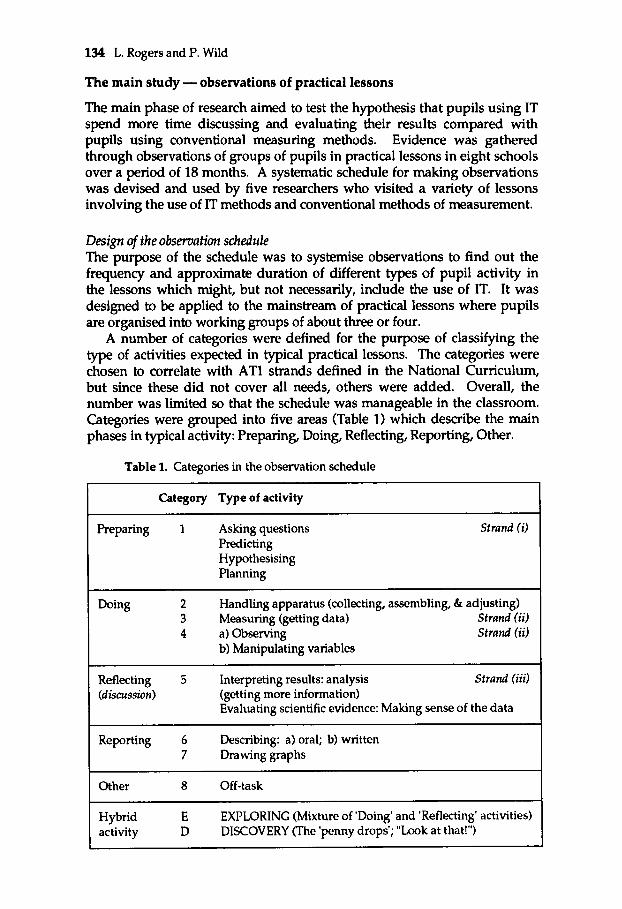
A number of categories were defined for the purpose of classifying the type of activities expected in typical practical lessons. The categories were chosen to correlate with AT1 strands defined in the National Curriculum, but since these did not cover all needs, others were added. Overall, the number was limited so that the schedule was manageable in the classroom. Categories were grouped into five areas (Table 1) which describe the main phases in typical activity: Preparing, Doing, Reflecting, Reporting, Other.
Table 1. Categories in the observation schedule
Category Type of activity
Preparing 1 Asking questions Predicting Hypothesising Planning
Strand (I)
Doing 2 Handling apparatus (collecting, assembling, & adjusting) 3 Measuring (getting data) Strand (i i) 4 a)Observing Strand (i i)
b) Manipulating variables ~~
Reflecting 5 Interpreting results: analysis Strand (iii) (discussion) (getting more information)
Evaluating scientific evidence: Making sense of the data
Reporting 6 Describing: a) oral; b) written 7 Drawing graphs
Other 8 Off-task
Hybrid E EXPLORING (Mixture of 'Doing' and 'Reflecting' activities) activity D DISCOVERY (The 'penny drops'; "Look at that!")
Data-logging: effects on practical science 135
In the traditional style of directed practical work the sequence is often linear but for an investigation style of working the sequence is more likely to be cyclical in which the reflection phase leads to further preparing and doing. These phases were further subdivided to create the main categories which were recorded on a grid record for each lesson.
The interpretation of the categories were discussed at length by the five researchers to gain a consensus and a common set of guidelines was agreed. Category 3 (Measuring) was intended to focus on the skill of getting data. With conventional measuring instruments this involves obtaining numerical readings and recording them. However, with the computer, pupils are more likely to be observing in some manner (4a), or reflecting (5) or other (8). Category 4a (Observing) described qualitative rather than quantitative outcomes. Category 4b (Manipulating variables) involved pupils making decision about and altering parameters in an experiment.
For category 5 (Reflecting) , it was necessary to give a clearer focus to the term 'discussion' to identify in particular the reflective type of discussion associated with scientific thinking (interpreting, evaluating, predicting, hypothesising, asking questions, etc.). This was to be distinguished from discussion associated with operational matters such as the logistics of handling apparatus (category 2) and obtaining results (category 3).
The main purpose of the research was to focus on pupils' activity but it was recognised that, inevitably, the teacher's activity permeates the lesson as they naturally take a lead through asking questions, explaining, giving instructions, prompting, providing help, giving hints etc. For the purpose of the observation record, the time when the teacher assumed the leadership role was identified and these instances were excluded from the main analysis. Further information about the context of the lesson was also recorded: ability of groups, gender, topic, teacher, previous IT experience.
Results from the classroom observations
Collection and analysis of the data Eight schools agreed to participate in the study on the basis that researchers would be invited to visit and observe practical lessons on occasions when IT happened to be in use. Thus classes were chosen for observation on the basis of convenience rather than through a statistical sampling process. None of the observed lessons were specially staged for the study; all occurred as part of the normal curriculum and were taught by their normal teacher. Each school had prepared its own materials and retained its usual autonomy over the planning and conduct of individual lessons. The method of using IT was totally at the discretion of each class teacher. The researchers took no part in determining the approach adopted in lessons; their role was simply to observe particular groups of pupils during lessons. Pupils were in the age range from 11 to 16 years. In general the groups were chosen to represent a cross section of pupils in each class. Where it was possible to observe a sequence of lessons, the same groups of pupils were observed. All pupils had previous experience of using computers and most had used data-loggers
136 L. Rogers and P. Wild
before, but some were using data-loggers for the first time. Observations were not confined to groups using IT; about one third of the observations were of conventional measurement methods.
Total number of pupil groups observed: 70 49 21
Number of lessons observed: 26 Cumulative time on observations: 48 hours
Number of groups using IT: Number of groups not using IT:
The accumulated data was analysed to obtain a profile of the time pupils spent on each category of activity expressed as a percentage of the total observed time. The profile was further analysed to compare the patterns of activity in the following conditions:
Use of IT compared with conventional measurement Effect of IT on experiments on the topic of motion Effect of IT on experiments on heating and cooling Effect of IT when an investigative approach is emphasized
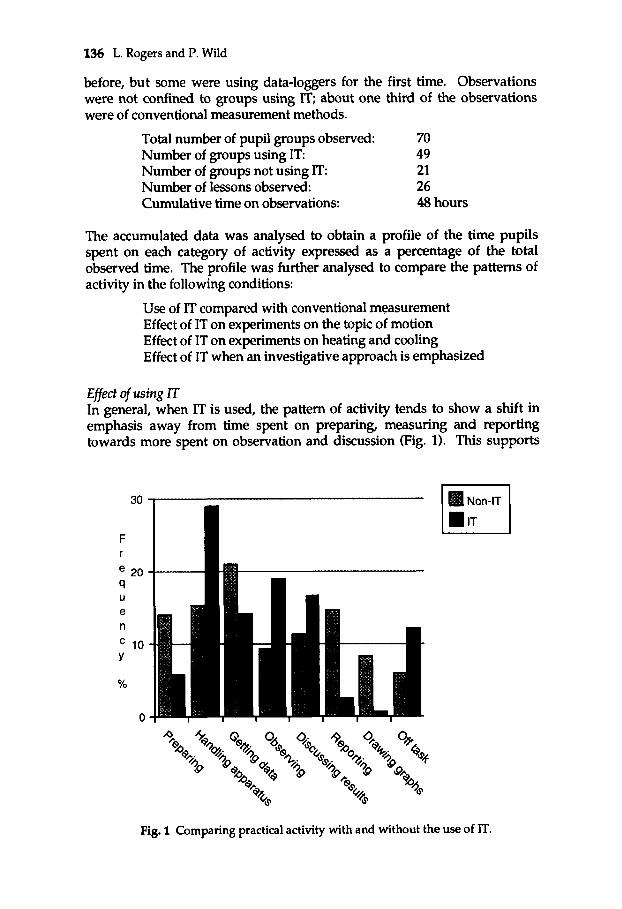
Effect of using ZT In general, when IT is used, the pattern of activity tends to show a shift in emphasis away from time spent on preparing, measuring and reporting towards more spent on observation and discussion (Fig. 1). This supports
30
F r
9
e n
Y
%
20
U
10
0
Fig. 1 Comparing practical activity with and without the use of IT.
Data-logging: effects on practical science 137
well the findings of the pilot study and earlier expressions of professional opinion (HMI, 1989; Rogers, 1987). However, it is perhaps surprising that more time is also spent on handling apparatus. This finding seems to be contrary to the impression expressed by some teachers that the data-logging process manages too much for pupils and reduces the amount of 'hands-on' activity. Some of this additional activity must be associated with setting up the computer and logging equipment as well as the laboratory apparatus, but this may be offset in part by the reduced time spent on gathering data.
The profile also shows a greater time spent off-task for IT groups. This might suggest that pupils failed to profit from the time saved from not having to draw graphs manually. Some of the observations indicated that occasional equipment failure or logistical problems (such as a queue of pupils waiting for the single printer in the laboratory) were responsible, but these did not account for all of the time. It seems appropriate to evaluate the targets set for the pupils and consider how they might use the spare time to better exploit the opportunities for analysis offered by the software. This point will be revisited in the final discussion.
Although the main observation focus was on the distribution of time for the categories of activity, some other descriptive comments on pupils' achievements were noteworthy:
There was a clear differentiation in activity depending on IT or non-IT experiments. Pupils using IT/laptops moved quickly on to observation, variable manipulation and discussion, despite initial lack of familiarity with apparatus and software.
The facility of automatic data-logging and graphical representation, allowed for a more focused approach to variable changes and discussion of results. The print-outs available gave the pupils easily accessible material and insight ready for a good write-up for homework.
The non-IT experiments involved activities concentrated in the hypothesis, handling of equipment and data collection sections. Outcomes in terms of data collection were varied to say the least. Some groups managed (by skilful division of labour) to get tabulated data ready for representation and interpretation, but others barely reached this vital stage.
Effect of type of experiment The pattern of activity (Fig. 2) is shown to depend upon the type of experiment. Superficially, the context of the topic of the experiment reveals obvious differences in the type of apparatus used, the skills needed for its manipulation and the nature of the tasks being set. Within the range of observations two types of activity occurred most frequently; experiments involving heating or cooling and experiments involving timing measurements. The distinctive differences between them are:
138 L. Rogers and P. Wild
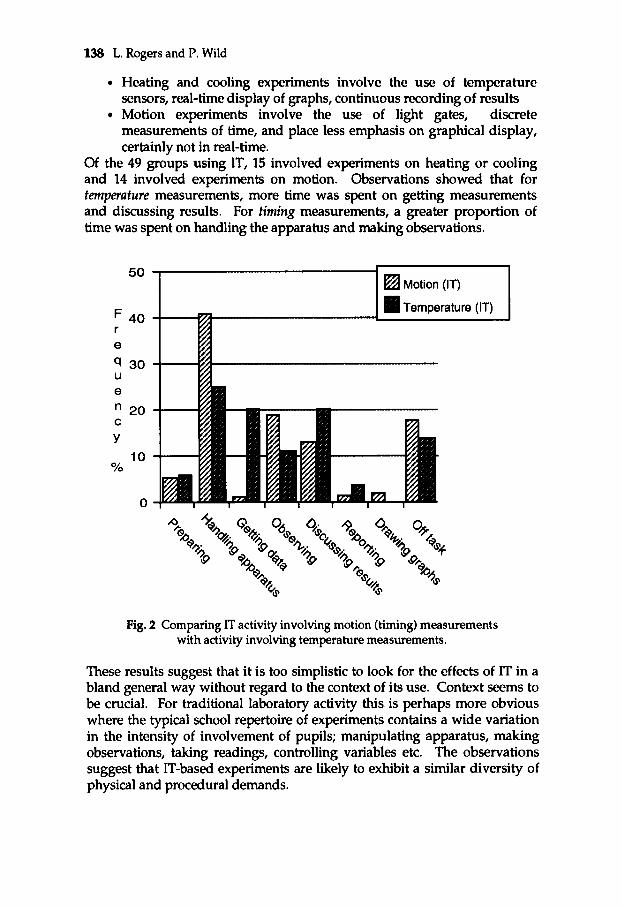
Heating and cooling experiments involve the use of temperature sensors, real-time display of graphs, continuous recording of results Motion experiments involve the use of light gates, discrete measurements of time, and place less emphasis on graphical display, certainly not in real-time.
Of the 49 groups using IT, 15 involved experiments on heating or cooling and 14 involved experiments on motion. Observations showed that for temperature measurements, more time was spent on getting measurements and discussing results. For timing measurements, a greater proportion of time was spent on handling the apparatus and making observations.
50
40 r e
q 30
e
" 20 U
C
Y
% 10
0
Fig. 2 Comparing IT activity involving motion (timing) measurements with activity involving temperature measurements.
These results suggest that it is too simplistic to look for the effects of IT in a bland general way without regard to the context of its use. Context seems to be crucial. For traditional laboratory activity this is perhaps more obvious where the typical school repertoire of experiments contains a wide variation in the intensity of involvement of pupils; manipulating apparatus, making observations, taking readings, controlling variables etc. The observations suggest that IT-based experiments are likely to exhibit a similar diversity of physical and procedural demands.
Data-logging: effects on practical science 139
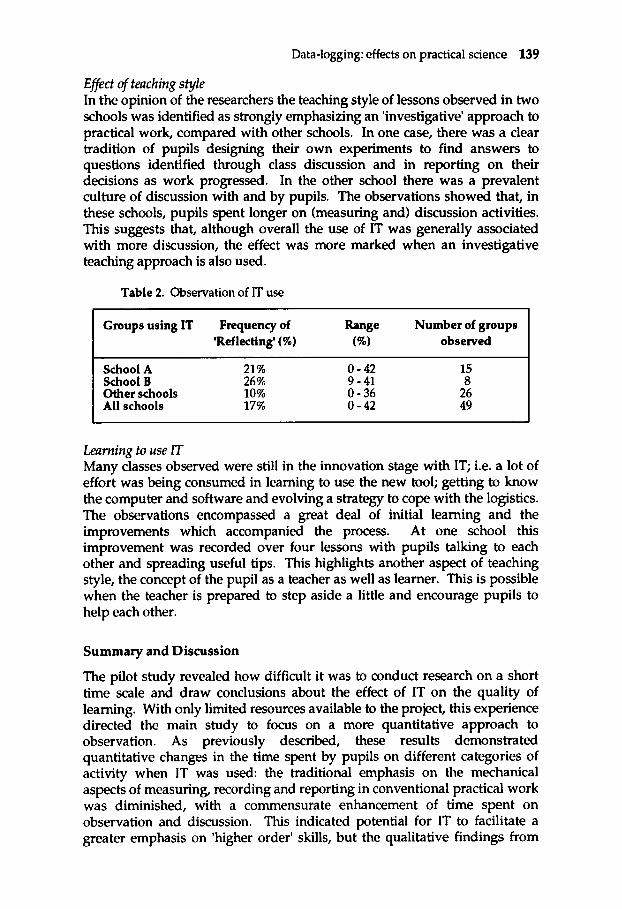
Effect of teaching style In the opinion of the researchers the teaching style of lessons observed in two schools was identified as strongly emphasizing an 'investigative' approach to practical work, compared with other schools. In one case, there was a clear tradition of pupils designing their own experiments to find answers to questions identified through class discussion and in reporting on their decisions as work progressed. In the other school there was a prevalent culture of discussion with and by pupils. The observations showed that, in these schools, pupils spent longer on (measuring and) discussion activities. This suggests that, although overall the use of IT was generally associated with more discussion, the effect was more marked when an investigative teaching approach is also used.
Table 2. Observation of IT use
Groups using IT Frequency of Range Number of groups 'Reflecting' ( % ) (%I observed
School A 21 % 0 - 4 2 15 School B 26% 9 - 41 8 Other schools 10% 0 - 3 6 26 All schools 17% 0 - 4 2 49
Learning to use ZT Many classes observed were still in the innovation stage with IT; i.e. a lot of effort was being consumed in learning to use the new tool; getting to know the computer and software and evolving a strategy to cope with the logistics. The observations encompassed a great deal of initial learning and the improvements which accompanied the process. At one school this improvement was recorded over four lessons with pupils talking to each other and spreading useful tips. This highlights another aspect of teaching style, the concept of the pupil as a teacher as well as learner. This is possible when the teacher is prepared to step aside a little and encourage pupils to help each other.
Summary and Discussion
The pilot study revealed how difficult it was to conduct research on a short time scale and draw conclusions about the effect of IT on the quality of learning. With only limited resources available to the project, this experience directed the main study to focus on a more quantitative approach to observation. As previously described, these results demonstrated quantitative changes in the time spent by pupils on different categories of activity when IT was used: the traditional emphasis on the mechanical aspects of measuring, recording and reporting in conventional practical work was diminished, with a commensurate enhancement of time spent on observation and discussion. This indicated potential for IT to facilitate a greater emphasis on 'higher order' skills, but the qualitative findings from
140 L. Rogers and P. Wild
the study indicated that the noted effects were much more context dependent than had been originally expected. The principal contextual factors were:
the quality of exploitation of the computer tools; the physical nature of the topic under investigation; learning objectives; learning style (pupil autonomy; investigation).
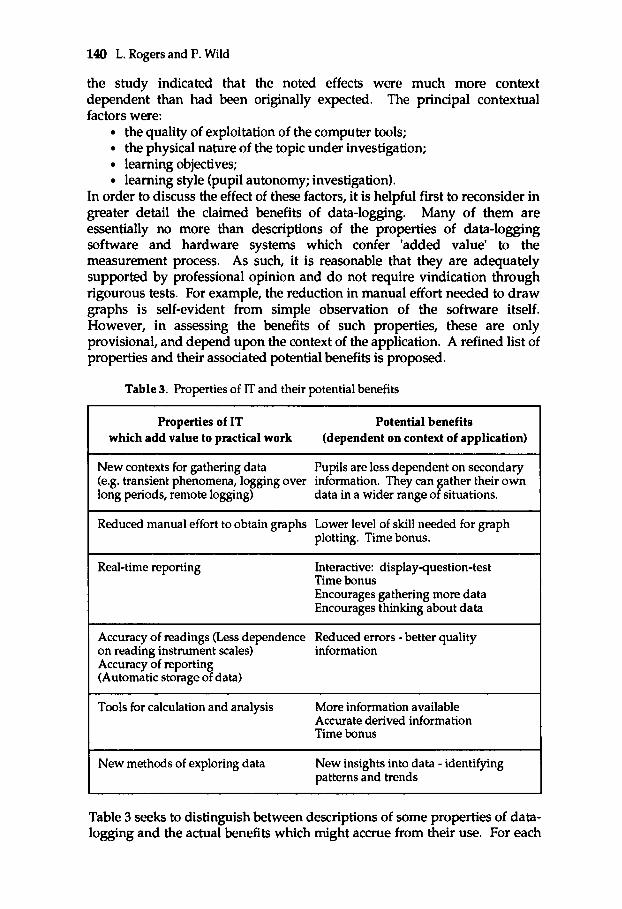
In order to discuss the effect of these factors, it is helpful first to reconsider in greater detail the claimed benefits of data-logging. Many of them are essentially no more than descriptions of the properties of data-logging software and hardware systems which confer 'added value' to the measurement process. As such, it is reasonable that they are adequately supported by professional opinion and do not require vindication through rigourous tests. For example, the reduction in manual effort needed to draw graphs is self-evident from simple observation of the software itself. However, in assessing the benefits of such properties, these are only provisional, and depend upon the context of the application. A refined list of properties and their associated potential benefits is proposed.
Accuracy of readings (Less dependence Reduced errors - better quality on reading instrument scales) information Accuracy of reporting (Automatic storage of data)
Tools for calculation and analysis More information available Accurate derived information Time bonus
New insights into data - identifylng patterns and trends
I ' New methods of exploring data
Table 3. Properties of IT and their potential benefits
Properties of IT Potential benefits which add value to practical work (dependent on context of application)
New contexts for gathering data Pupils are less dependent on secondary (e.g. transient phenomena, logging over information. They can gather their own long periods, remote logging) data in a wider range of situations.
Reduced manual effort to obtain graphs Lower level of skill needed for graph plotting. Time bonus.
Real-time reporting Interactive: displayquestion-test Time bonus Encourages gathering more data Encourages thinking about data
Table 3 seeks to distinguish between descriptions of some properties of data- logging and the actual benefits which might accrue from their use. For each
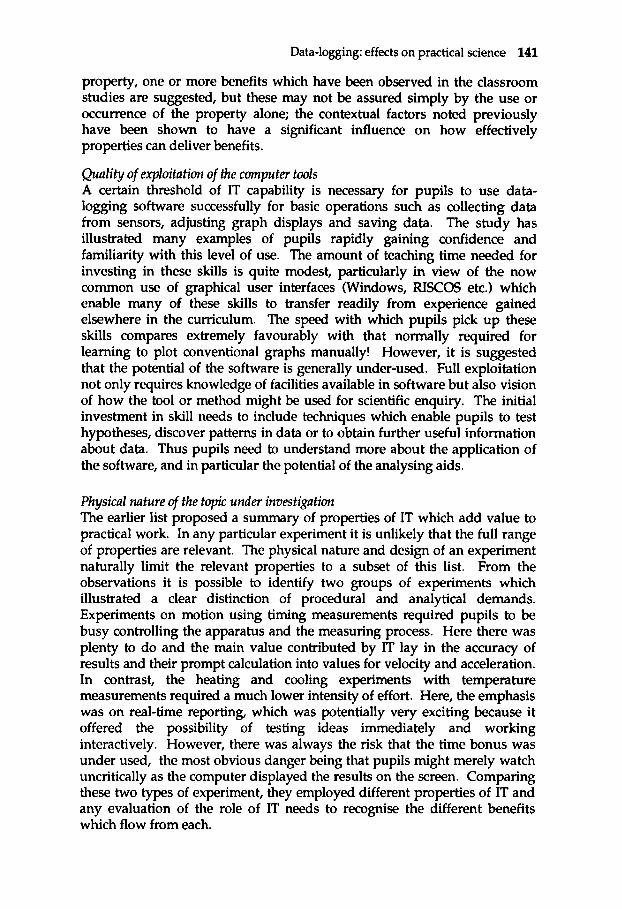
Data-logging: effects on practical science 141
property, one or more benefits which have been observed in the classroom studies are suggested, but these may not be assured simply by the use or occurrence of the property alone; the contextual factors noted previously have been shown to have a significant influence on how effectively properties can deliver benefits.
Quality of exploitation of the computer tools A certain threshold of IT capability is necessary for pupils to use data- logging software successfully for basic operations such as collecting data from sensors, adjusting graph displays and saving data. The study has illustrated many examples of pupils rapidly gaining confidence and familiarity with this level of use. The amount of teaching time needed for investing in these skills is quite modest, particularly in view of the now common use of graphical user interfaces (Windows, RISCOS etc.) which enable many of these skills to transfer readily from experience gained elsewhere in the curriculum. The speed with which pupils pick up these skills compares extremely favourably with that normally required for learning to plot conventional graphs manually! However, it is suggested that the potential of the software is generally under-used. Full exploitation not only requires knowledge of facilities available in software but also vision of how the tool or method might be used for scientific enquiry. The initial investment in skill needs to include techniques which enable pupils to test hypotheses, discover patterns in data or to obtain further useful information about data. Thus pupils need to understand more about the application of the software, and in particular the potential of the analysing aids.
Physical nature of the topic under investigation The earlier list proposed a summary of properties of IT which add value to practical work. In any particular experiment it is unlikely that the full range of properties are relevant. The physical nature and design of an experiment naturally limit the relevant properties to a subset of this list. From the observations it is possible to identify two groups of experiments which illustrated a clear distinction of procedural and analytical demands. Experiments on motion using timing measurements required pupils to be busy controlling the apparatus and the measuring process. Here there was plenty to do and the main value contributed by IT lay in the accuracy of results and their prompt calculation into values for velocity and acceleration. In contrast, the heating and cooling experiments with temperature measurements required a much lower intensity of effort. Here, the emphasis was on real-time reporting, which was potentially very exciting because it offered the possibility of testing ideas immediately and working interactively. However, there was always the risk that the time bonus was under used, the most obvious danger being that pupils might merely watch uncritically as the computer displayed the results on the screen. Comparing these two types of experiment, they employed different properties of IT and any evaluation of the role of IT needs to recognise the different benefits which flow from each.
142 L. Rogers and P. Wild
It is not difficult to extrapolate this idea to the distinctively different modes of logging and construe that each has particular benefits. For example, 'real-time' logging (immediate reporting of results) contrasts with 'remote' logging where data is accumulated away from the computer and viewed retrospectively. Similarly, 'rapid collection' of data (short transients etc.) contrasts with 'longer term collection' lasting hours or days. The latter types of IT usage, such as collecting environmental data continuously for a week, have no traditional counterpart, making comparison and evaluation difficult (Hammond, 1994).
A further aspect of the physical context of the experiment concerns the properties of the sensors used. For example when a temperature probe is placed in a liquid it normally takes a certain time for it to adjust to the ambient temperature. This of course is also true of conventional mercury thermometers but the difference is that data-logging collects the data in such detail that the effect is much more obvious. Similarly, the effect of stirring a liquid with a temperature probe can be dramatic and there were instances where neighbouring groups of pupils obtained apparently different graphs from similar experiments. At first sight the data appeared to be of doubtful quality. In fact the reverse was true; much more information was captured, offering more opportunities for thinking about the science involved. This suggests that it is appropriate to have a broader view of what is useful information and a strategy for taking advantage from it.
Learning objectives The table of potential benefits (Table 3) contains several instances of a 'time bonus' i.e. where the use of IT confers a saving of time compared with conventional methods. It is a necessary challenge for the teacher to rethink lesson objectives and manage pupils' activity to take advantage of this which can only be considered a benefit if the time gained is put to use in a profitable and purposeful way. Unfortunately the time profiles generally indicated an increase in the amount of off-task time when using IT. This is not to suggest that all off-task activity is necessarily bad; pupils' concentration can be improved after a rest or a change (Merry, 1995). However, from the observations, which partly drew upon listening to snatches of pupils' conversation, it seemed that much off-task talk was unproductive.
In general, most of the proposed properties of IT (data-logging) make it appropriate to set more ambitious objectives for pupils' activity. For example. the reduced effort in obtaining graphs gives pupils of lower ability better access to this visual medium for analysing data. At all levels the graph can be seriously considered as a starting point for activity rather than the culmination of a lesson's work; the data can be represented in such a variety of ways, the graph becomes a tool for exploring and thinking about the data (Rogers, 1995). Software tools for calculation and analysis reduce formerly tedious and repetitive tasks and transform them into creative opportunities. For example, in an experiment to find out how the mass of a trolley affects its acceleration on a slope, the prompt calculation of
Data-logging: effects on practical science 143
acceleration from time measurements enables pupils to repeat, many times over, the cycle of changing the mass, predicting the effect on the acceleration, and then measuring acceleration. Thus many more cycles of predict-and-test are possible in a lesson.
In setting new objectives, teachers need a good knowledge and understanding about what IT is particularly good at achieving, and a clear rationale for the purpose of activities so that sound judgements can be made about the appropriate rather than indiscriminate application of IT. Finally, assessment objectives also need to be adapted to reflect revised learning objectives.
Learning style An underlying theme in the list of properties of IT is the enrichment of pupils' practical work. New contexts for gathering data, new tools for calculation and analysis, new methods of examining data, together with prompt graph display, real-time reporting and improved accuracy, all offer potential to encourage pupils to explore and ask questions about data. Exploration is a key aspect of exploiting the software tools. To encourage exploration it is important to develop pupils' self-confidence to find out for themselves. This is not simply an issue of acquiring knowledge and skill with the software, it is fundamentally a matter of teaching and learning style. If pupils have the habit of waiting to be told what to do next, this is very limiting. It is much more desirable for them to become used to taking initiative. It is suggested that a strategy which prompts and enables them to ask lots of questions about the data and its interpretation is most likely to succeed. For example, pupils might be encouraged to compare sets of data; they can look at each other's graphs, discuss the differences and similarities or compare their graph with that of sample data. Hopefully, as discussed earlier, they might learn to take a broader view of what constitutes relevant and useful information. As Goldstein has remarked: "Teachers must be careful not to allow pupils to develop the habit of ignoring signals." Discussion and asking questions are facilitated by small group work which is the traditional strategy for organising practical work in the school laboratory. The time profiles have shown, that discussion occurs even more frequently when the computer is introduced to group work. In addition, discussion is often better focussed when it is prompted by real-time reporting because of the immediate context of the results being revealed.
Overall, an investigative approach tends to embody what pupils need to take advantage of the benefits of IT. This does not imply stylised whole investigations as the only suitable methodology; it rather indicates an attitude towards scientific inquiry which is not exclusive to practical work, but which can permeate a variety of learning activity in science. In the study, this is supported by the time profiles for the two schools deemed to have emphasised this approach. Decisions taken by teachers on matters of teaching and learning style are also bound up with decisions on learning objectives. A deterministic approach to experiments, in which the goals consist of obtaining single outcomes such as a physical constant or the
In particular they need to cope with the time bonus.
144 L. Rogers and P. Wild
verification of a known relationship, is not one which encourages exploration. Instead, objectives should be sought which encourage pupils to search for meaning in scientific data and make links with relevant scientific knowledge.
Despite the apparent emphasis here on pupil autonomy, there is also an underlying theme of the crucial role of the teacher in determining the style of learning and in providing the appropriate conditions. Indeed, throughout the study of the implications of using IT tools, the teacher emerges as a key figure. This is in common with the findings other related studies. For example, the management of small group work requires sensitive handling by the teacher if pupils' discussions are to be both creative and yet a disciplined activity (Cowie & Rudduck, 1992). One of the most recent studies of how children learn science has underlined the importance of teacher's interventions for introducing the cultural tools of science and for providing the support and guidance for pupils to make sense of these themselves (Driver et al., 1994).
Conclusions
This study has shown that the use of IT changes the time profile of activity in practical lessons. The greater proportion of time involved in observation and discussion suggests more thought and reflection. Clearly the quality and nature of these need further detailed investigation, but if thought and reflection can be successfully promoted through the use of IT, the prize of better scientific understanding is possibly within reach. It has been argued that the properties of data-logging provide ample encouragement for thinking, but have concluded that the magnitude and quality of this benefit depend upon their application and the conditions surrounding their use. Another recent major project has successfully used computer simulations in science to promote more sophisticated reasoning and conceptual change (Hennessy et al., 1995). Here the simulations were used as a partial substitute for practical work. One might speculate that an even greater improvement might be possible with a blend of data-logging activity for the practical component of the lessons. Some of the application factors which enable data-logging to deliver benefits have been suggested, and attention has been drawn to the beneficial effect of a learning style which embraces an investigative approach.
At this stage it is proposed that teachers adopt the following strategies which seem to offer the most promise from data-logging:
gain a full awareness of the potential of software tools; review and redefine objectives of practical activity; give pupils freedom to explore; encourage a questioning approach.
The next phase of research needs to examine more carefully these application factors rather than the technical properties of data-logging itself.
Data-logging: effects on practical science 145
References Barton, R. (1993) Computers and Practical Science: Why isn't everyone doing it?
Schaol Science Review, 75,271,7540. Brasell, H. (1985) The Effect of Real-Time Lab. Graphing on Learning Graphic
Representation of Distance and Time. ]oumal of Research in Science Teaching, 24, 4, 385-395.
Cowie, H. & Rudduck, J. (1992) What is cooperative group work? In Teaching and Learning Technology (eds. R. McCorrnick, P. Murphy & M. Harrison) pp. 230-242. Addison-Wesley, London.
Driver, R., Asoko, H., Leach, J., Mortimer, E. & Scott, P. (1994) Constructing Scientific Knowledge in the classroom. Educational Researcher, 23,7,5-12.
Friedler, Y., Nachmias, R. & Linn, M. (1990) Learning Scientific Reasoning Skills in a Microcomputer Based Lab. Journal of Research in Science Teaching, 27,2,173 - 191.
Frost, R. (1995) The IT in Science book of Data logging and control. Available from the Association for Science Education Booksales, Hatfield, UK.
Hammond, M. (1994) Measuring the impact of IT on learning. Journal of Computer Asskted Learning, 10,4,251-260.
Hennessy, S., Twigger, D., Driver, R., O'Shea, T., O'Malley, C., Byard, M., Draper, S., Hartley, R., Mohammed, R. & Scanlon, E. (1995) A classroom intervention using a computeraugmented cumculum for mechanics. International Journal of Science Education, 17,2,189-206.
HMI(1989) Cum'culum Matters 15: Information Technology from 5 to 16. HMSO, London.
McKenzie, D.L. & Padilla, M.J. (1986) The construction and Validation of the tests of graphing in science. Journal of Research in Science Teaching, 23,7,571-79.
Merry, R. (1995) Take some notice of me! In Beginning teuching ; beginning learning (ed. J. Moyles) pp. 8487. Open University Press, Milton Keynes.
Mokros, J.R. & Tinker, R. (1987) The Impact of Microcomputer Based Labs on Children's Ability to Interpret Graphs. Journal of Research in Science Teaching, 24,4,
NCET (1993) Evaluation ofIT in Science. National Council for Educational Technology, Warwick, UK.
OFSTED(1995) Science: A Ratipw of Inspection Findings 1993/7994 (p. 7). HMSO, London.
Rogers, L.T. (1987) The computer-assisted laboratory. Physics Education, 22, 4, 219- 224.
Rogers, L.T. (1992) A study of pupils' skills of graphical interpretation with reference to the use of duta-logging techniques. Paper presented at NATO Advanced Workshop: Microcomputer Based Labs Educational Research and Standards, University of Amsterdam.
Rogers, L.T. & Wild, P. (1994) The Use of IT in Practical Science - a practical study in three schools. School Science Review, 75,273,21-28.
Rogers, L.T. (1995) The computer as an aid for exploring graphs. School Science
Thornton, R.K. (1987) Tools for scientific thinking - microcomputer-based
369-383.
Re~iew, 76,276'31-39.
laboratories for physics teaching. Physics Education, 22,4,230-238.