Embed Size (px)
Citation preview

Data InterpretationACCESS for ELLs®
The Rhode Island Department of Education
Presented byBob MeaselELL Specialist
Office of Instruction, Assessment, and Curriculum

We’re going to cover…
The WIDA ELP standards and assessment framework
Organization of the standards and assessment
Data produced by the ACCESS for ELLs®
How to interpret the data produced by the ACCESS test
How the data inform instruction
Accountability under Title III

ELPSSummative
The WIDA ELP standards and assessment frameworkResearch on second
language development
FormativeInstruction
ELP Assessment(ACCESS for ELLs®)
Assessment Data
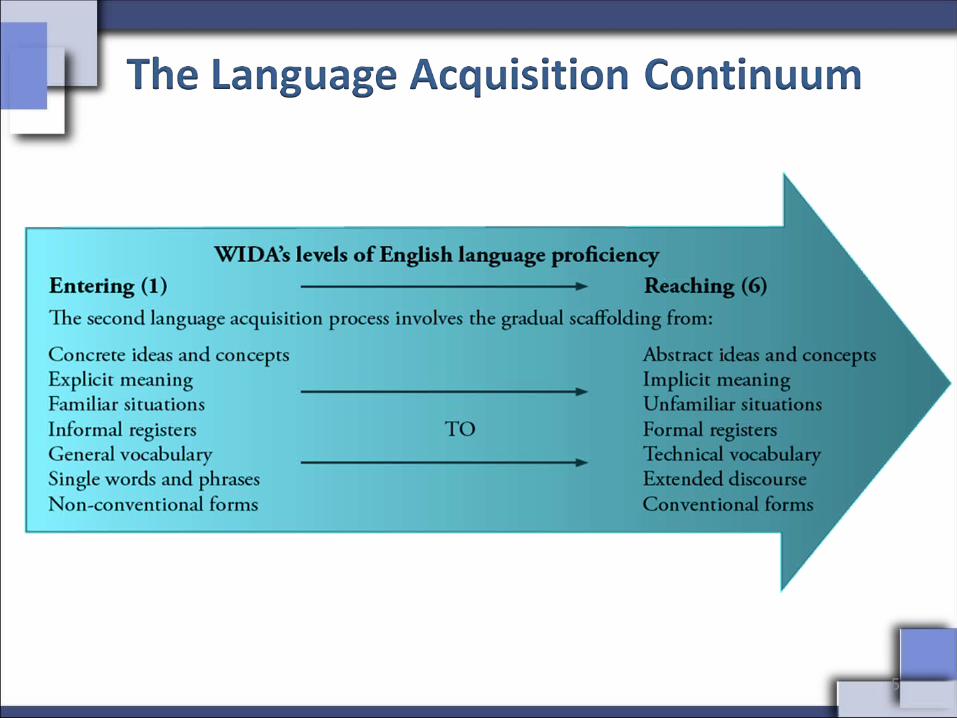
Performance Definitions

The WIDA ELPS
5

6
Framework for Formative and Summative Assessment
English Language Proficiency Standards
Language Domains (R,W,S,L)
Grade Level Clusters
ELP Levels
Model Performance Indicators
Model Performance Indicators (MPIs) are the lowest level of expression of the Standards and where test items begin
Content Areas (S&I, ELA, MA, SC, SS)

`
ELP Levels

`
ELP Levels
ENTERING
BEGINNING
DEVELOPING
EXPANDING
1
2
3
4
5
6 REACHING
BRIDGING


The ACCESS for ELLs® is divided into five glade level clusters:
K 1-2 3-5 6-8 9-12

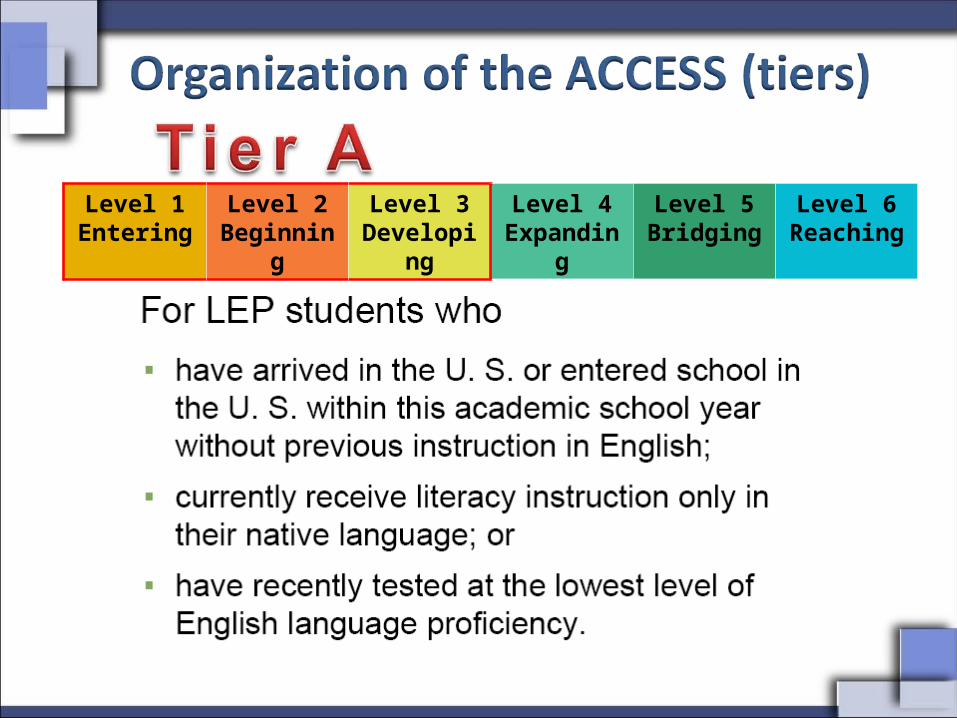
Each grade level cluster except kindergarten is divided into three tiers (A, B, & C)
Tiers were developed to avoid:
•attempting to assess high levels of ELP for students at low levels of ELP
•assessing low levels of ELP for students at high levels of ELP

Level 1Entering
Level 2Beginning
Level 3Developing
Level 4Expanding
Level 5Bridging
Level 6Reaching
Level 1Entering
Level 2Beginning
Level 3Developing
Level 4Expanding
Level 5Bridging
Level 6Reaching

Level 1Entering
Level 2Beginning
Level 3Developing
Level 4Expanding
Level 5Bridging
Level 6Reaching

Level 1Entering
Level 2Beginning
Level 3Developing
Level 4Expanding
Level 5Bridging
Level 6Reaching

There are only two effects that the wrong tier can have for a student
Bottom line…
Tiers do NOT affect a students’ score
1. A low level student scores zero because he/she cannot answer any questions
2. A high level student scores perfect and caps out

K
1-2
3-5
6-8
9-12

K
1-2
3-5
6-8
9-12

Tier ATier BTier C
1-2
Each test has four sections: Listening, Reading, Writing, and Speaking

20
Framework for Formative and Summative Assessment
English Language Proficiency Standards
Language Domains (R,W,S,L)
Grade Level Clusters
ELP Levels
Model Performance Indicators
Model Performance Indicators (MPIs) are the lowest level of expression of the Standards and where test items begin
Content Areas (S&I, ELA, MA, SC, SS)

Model Performance Indicators
Model Performance Indicators (MPIs) are the lowest level of expression of the Standards and where test items begin


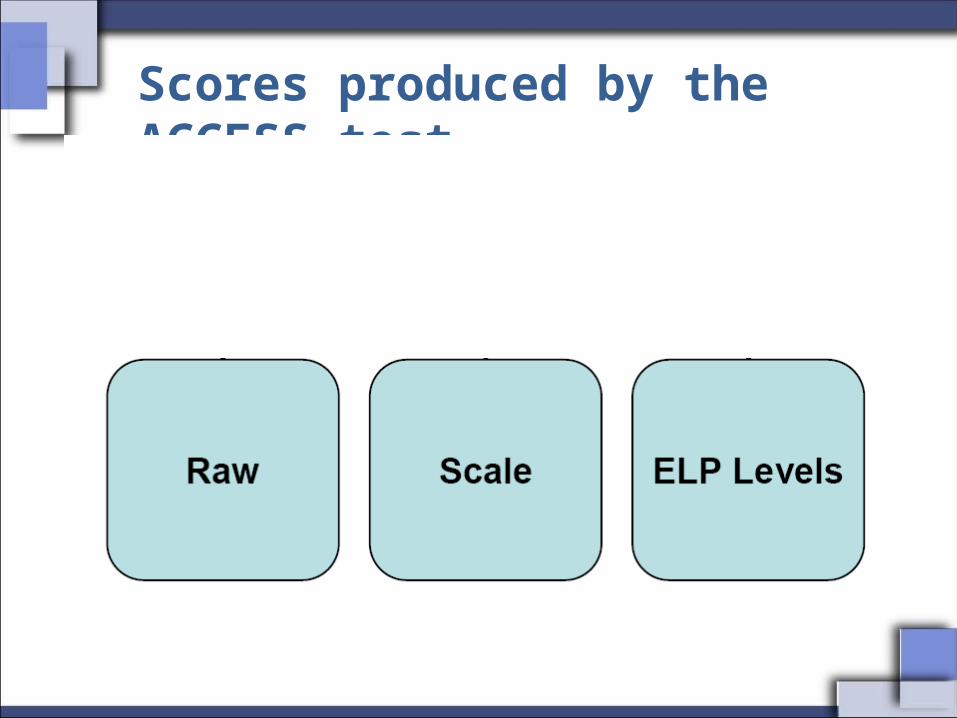
Scores produced by the ACCESS test

Scores produced by the ACCESS test
The raw score is simply the number of correct responses in each section out of the number possible
• Psychometrically derived measures of proficiency
• Range from 100 to 600
• Single vertical scale applies to all grades and test forms
• Vertically equated scale scores take into account grade level differences

Scores produced by the ACCESS test
• Socially derived interpretation of the scale score
• Range from 1.0 to 6.0
• First number indicates the proficiency level into which the student’s scale score places him or her (e.g. 2 = Beginning)
• Second number indicates how far, in tenths, the student’s scale score places him or her between the lower and the higher cut score of the proficiency level (e.g. 2.5 = 5/10 or ½ of the way between the cut score for level 2 and level 3)
NEVER, NEVER, NEVER, Round up!

Scores produced by the ACCESS test
Some examples….

Scores produced by the ACCESS test
Some examples….

Scores produced by the ACCESS test

Scores produced by the ACCESS test

Composite Scores
=
=
=
=
Listening(50%)
Listening(30%)
Reading(50%)
Listening(15%)
Speaking(50%)
Reading(70%)
Writing(50%)
Speaking(15%)
Reading(35%)
Writing(35%)
+
+
+
+

Score reports for ACCESS

Parent / Guardian Report

Parent / Guardian Report

TeacherReport

Student Roster Report

School Frequency Report

School Frequency Report

ACTIVITY• At your table, examine the score report
that is assigned to your table.
• Answer the four guiding questions on the next slide.
• Record your notes to share with the group afterwards.

ACTIVITY - Guiding Questions
-What is the purpose of the report?
-What data are available?
-How can the data be used?

TEACHER REPORT
291|------♦----|369291|------♦----|369

How the data inform instruction
At your table, have a look at the sample ACCESS teacher report. Discuss what the data are indicating.
What implications does this have for instruction? For curriculum?
Now let’s have a look at how the WIDA ELPS framework comes into the equation….

ELPSSummative
Research on second language development
FormativeInstruction
ELP Assessment(ACCESS for ELLs®)
Assessment Data
Performance Definitions
How the data inform instruction
CAN-DO Descriptors
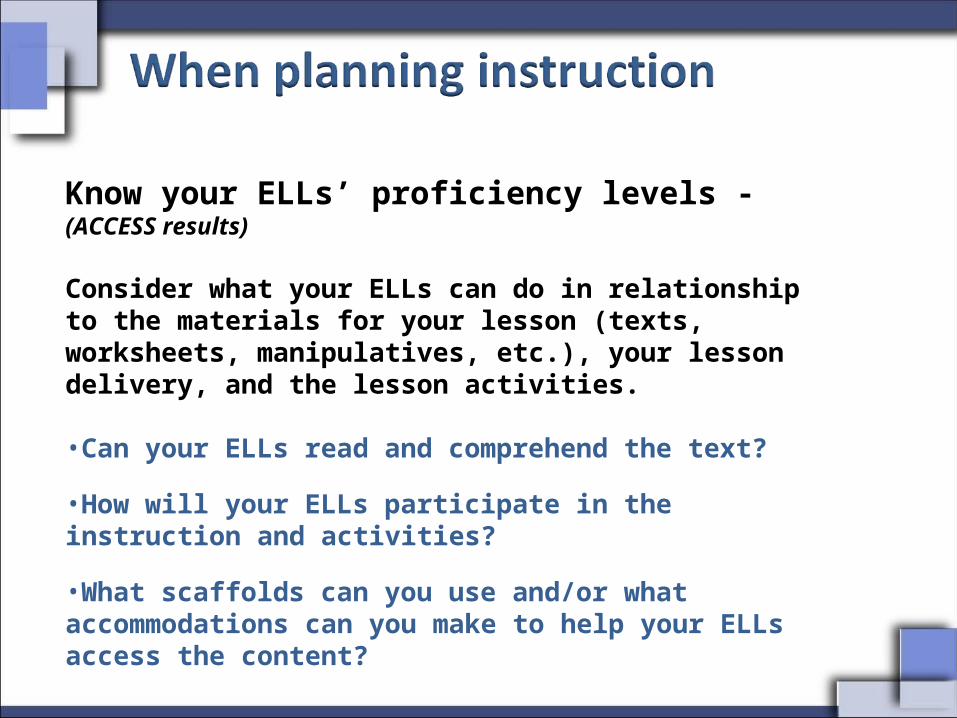
Know your ELLs’ proficiency levels - (ACCESS results)
Consider what your ELLs can do in relationship to the materials for your lesson (texts, worksheets, manipulatives, etc.), your lesson delivery, and the lesson activities.
•Can your ELLs read and comprehend the text?
•How will your ELLs participate in the instruction and activities?
•What scaffolds can you use and/or what accommodations can you make to help your ELLs access the content?

How much growth is enough?
A couple of simple rules to keep in mind….
•Lower is faster•Higher is slower
That is to say, that research shows us that students at higher proficiency levels and higher grades grow slower than students at lower proficiency levels and lower grades.
For example, an eleventh grader at level 4.5 will make much smaller gains in a year than a second grader at level 2.1.

How much growth is enough?
Refer to the handout entitled WIDA Focus on Growth. This is a product of research conducted by H Gary Cook at WCER. It provides growth profiles for students by grade and proficiency level. It also provides levels of average growth for districts.

How much growth is enough?
First, find the column for the PL band that your
student’s first score falls into.
Second, calculate the growth from the first score to the second. In this case,
we’re using the scale scores.
Third, plot the growth on the y-axis over the initial proficiency
level column (x-axis).


Rhode Island Exit CriteriaThere are three required criteria to exit an ELL from the ESL/BLE program:
1. 1. ACCESS for ELLs® Literacy Composite score ≥ 4.5 AND Comprehension Composite score ≥ 5.0
ORNECAP Reading score ≥ Level 3

Rhode Island Exit CriteriaThere are three required criteria to exit an ELL from the ESL/BLE program:
2. 2. Any three of the following criteria:Passing grades in all core content classes (as reflected on mid-year or end-of-year report card)ESL/bilingual Education teacher recommendation At least two general education core content teacher recommendationsAt least three writing samples demonstrating skill not more than one year below grade levelScore on a district reading assessment not more than one year below grade level as defined by the publisher or the district
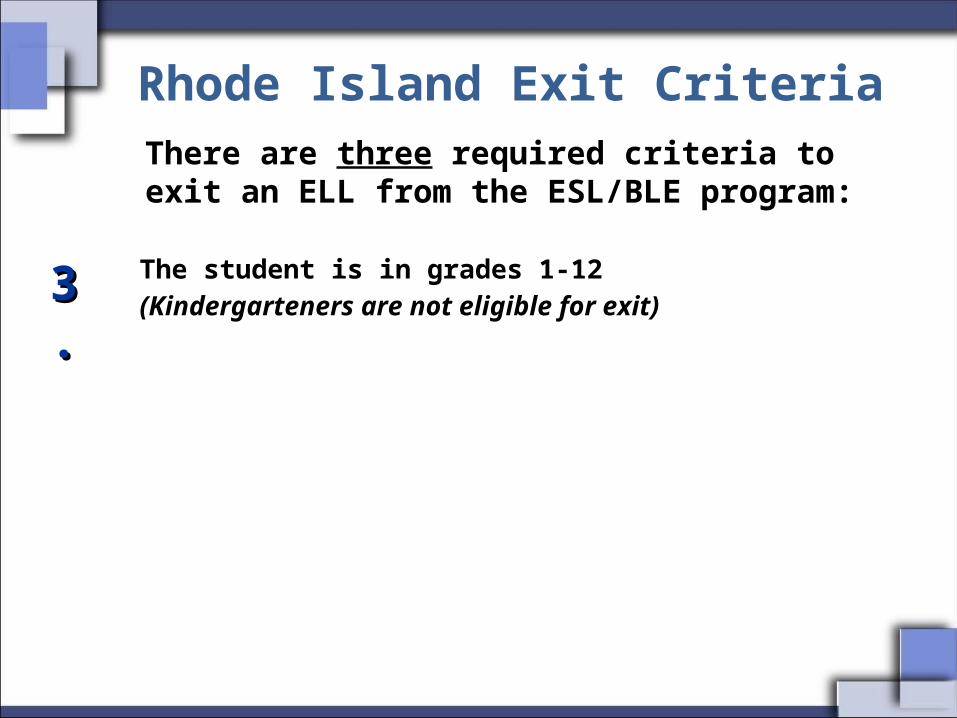
Rhode Island Exit CriteriaThere are three required criteria to exit an ELL from the ESL/BLE program:
3. 3. The student is in grades 1-12 (Kindergarteners are not eligible for exit)
And now onto…

Accountability Systems
NECAP• All ELLs are required to take
the Mathematics, Science, and Writing NECAP
• Recently arrived ELLs can be given a one-time exemption from the Reading NECAP
ACCESS for ELLs® • All ELLs are required to take
the ACCESS each year (K-12)

Accountability Under Title III
• annual increases in the number or percentage of children making progress in learning English;
• annual increases in the number or percentage of children attaining English proficiency by the end of each school year, as determined by a valid and reliable assessment of English proficiency; and
• making adequate yearly progress for limited English proficient children

Growth expectation:Gain of ≥0.5 ACCESS for ELLs® overall composite level for an individual student
Starting point target:27% of students making a gain of ≥0.5 ACCESS for ELLs® overall composite level
Ending point target:56% of students making a gain of ≥0.5 ACCESS for ELLs® overall composite level
Confidence interval: 95%Years from starting to ending:
2009-2010 to 2017-2018(nine test administrations in an eight year span)
Annual increases:
2010.target of 27%2011.target of 30%2012.target of 33%2013.target of 36%2014.target of 40%2015.target of 44%2016.target of 48%2017.target of 52%2018.target of 56%
AMAO 1

AMAO 2
Definition of “attainment”:
ACCESS for ELLs® composite score ≥ 4.5. Scores from both Tier B and Tier C will be acceptable. For the Kindergarten ACCESS, the instructional score will be used.
Starting point target:
18% of LEP students served by a subgrantee will score at or above the proficient level
Ending point target:34% of LEP students served by a subgrantee will score at or above the proficient level
Confidence interval: 95%Years from starting to ending:
2009-2010 to 2017-2018
Annual increases:
2010.target of 18%2011.target of 19%2012.target of 20%2013.target of 21%2014.target of 23%
2015.target of 25%2016.target of 28%2017.target of 31%2018.target of 34%


59
Bob MeaselELL Specialist
Office of Instruction, Assessment, and AccountabilityRhode Island Department of Education
255 Westminster StreetProvidence, RI 02903
[email protected] Voice: 222-401-8480Fax: 401-222-3605
Additional professional development on this topic, as well as others related to ESL, may be arranged by contacting: