Embed Size (px)
Citation preview
applied sciences
Article
Data-Driven Deformation Reliability of RetainingStructures in Deep Excavations ConsideringMeasurement Error
Li Xu 1, Yang Xu 1 , Cao Wang 1,2,3,* and Kairui Feng 4
1 College of Civil Engineering, Fuzhou University, Fuzhou 35018, Fujian, China;[email protected] (L.X.); [email protected] (Y.X.)
2 School of Civil Engineering, The University of Sydney, Sydney, NSW 2006, Australia3 Department of Civil Engineering, Monash University, Clayton, VIC 3800, Australia4 Department of Civil and Environmental Engineering, Princeton University, Princeton, NJ 08540, USA;
[email protected]* Correspondence: [email protected]
Received: 1 November 2019; Accepted: 10 December 2019; Published: 12 December 2019
Abstract: The deflections of retaining structures during deep excavation should be controlled belowa predefined threshold in an attempt to mitigate the deformation-posed damage to the surroundingbuildings and infrastructure facilities. In this paper, a new approach is presented to conductingdeformation reliability assessments of retaining structures. The method is based on an extensionof the classical first-passage reliability problem and is applied on the spatial scale of the retainingstructures. With the proposed method, the in situ monitoring data and the associated measurementerror can be easily incorporated, which accordingly improves the assessment accuracy. Moreover,the proposed method has a closed-form solution, which is beneficial for the computation efficiencyand its practical application. The method was applied to assess the retaining structure reliability in afoundation excavation of a subway station in Fuzhou, China. The accuracy of the analytical resultswas verified through a comparison with those of Monte Carlo simulation. It was shown that theproposed method can represent well, the deformation-based safety level of retaining structures.
Keywords: deep excavation; deformation reliability; retaining structures; monitored data; measurementerror; safety assessment
1. Introduction
The past decades have witnessed rapid growth in the number and scale of deep foundation pitprojects in subway constructions around the world. Once a foundation pit accident (e.g., collapse ofretaining structures) occurs, the consequence is often catastrophic, with ripple effects to the safety ofadjacent buildings and underground pipelines [1–4]. In order to prevent such accidents, an importantgoal in the design and construction of foundation pits is to control the deformation of the soil andthe retaining structures. Considering the uncertainties arising from the relevant parameters in thedeformation process, the reliability approaches based on probability theory should be used to capturethe randomness and variability of these parameters, yielding a probabilistic estimate of the safety levelof the foundation excavations [5–9].
A significant number of studies are available in the literature regarding the deformation reliabilityassessment of retaining structures in foundation excavations. For example, Luo et al. [10] investigatedthe influence of statistical parameter uncertainty on the probability of serviceability failure in bracedexcavations based on the Bootstrap method. Wang et al. [11] conducted the probabilistic evaluationof serviceability failure in a braced excavation using the moment methods and the finite element
Appl. Sci. 2019, 9, 5466; doi:10.3390/app9245466 www.mdpi.com/journal/applsci
Appl. Sci. 2019, 9, 5466 2 of 16
platform PlaxisTM, and discussed the effect of spatial variability of soil parameters on the probabilityof serviceability failure. Goh and Kulhawy [12] calculated the reliability index of braced retainingwalls by approximating the nonlinear limit state surface through a neural network model. Khosrojerdiet al. [13] evaluated the lateral deformation of geosynthetic reinforced soil walls and abutmentsbased on some selected methods. Sayed et al. [14] studied the reliability of reinforced retainingwalls based on finite element modeling. The response surface approach was utilized to represent theperformance function, coupling the first order reliability method to compute the reliability index. Manyof the existing studies have performed reliability assessments of retaining structures in foundationpits based on finite element software, where the computational cost could be dramatically high.Another approach is to establish a relationship between the retaining structure deformation andsome key factors such as the wall deformation mode, wall stiffness, soil properties, adjacent buildingcharacteristics, and others [15–18]. However, these relationships are often empirically formulatedand contain many unknown parameters to calibrate, which would become difficult in the presenceof limited data and significant uncertainties. Alternatively, the direct use of in situ observed datacould improve the accuracy and efficiency of structural reliability assessment [19–25]. For instance,Zhang et al. [22] investigated the impact of deep excavation on the adjacent metro shield tunnelsusing health monitoring data on the deformation. Qi and Zhou [24] developed a procedure for theBayesian back-analysis of retaining wall reliability, making use of the deflection data monitored atmultiple locations. However, the incorporation of measurement error (ME) associated with datacollection [26,27] in the deformation reliability assessment of retaining structures has been limiteddiscussed in previous studies. In fact, uncertain errors involved in the measurement of observationscould deteriorate the quality of the data, and hence, the estimates of structural reliability [28–30].
This paper presents a method for deformation reliability analysis of retaining structures based onin situ monitoring data. The failure of a retaining structure is defined as a displacement at any depthexceeding the predefined threshold, which could differ from the engineering practice focusing on thedeformations at the monitored depths only. By noting that the deformation distribution along thevertical direction of a retaining structure is a one-dimensional problem, this paper extends the classicalfirst-passage reliability approach [31–33] from the temporal scale to the spatial scale. A closed-formsolution is proposed for the deformation reliability assessment of retaining structures consideringthe potential failure risks at any depth. The impact of ME arising from data collection is explicitlyincorporated in the proposed deformation reliability method. A case study is presented to demonstratethe applicability of the proposed method.
2. Deformation of Retaining Structures
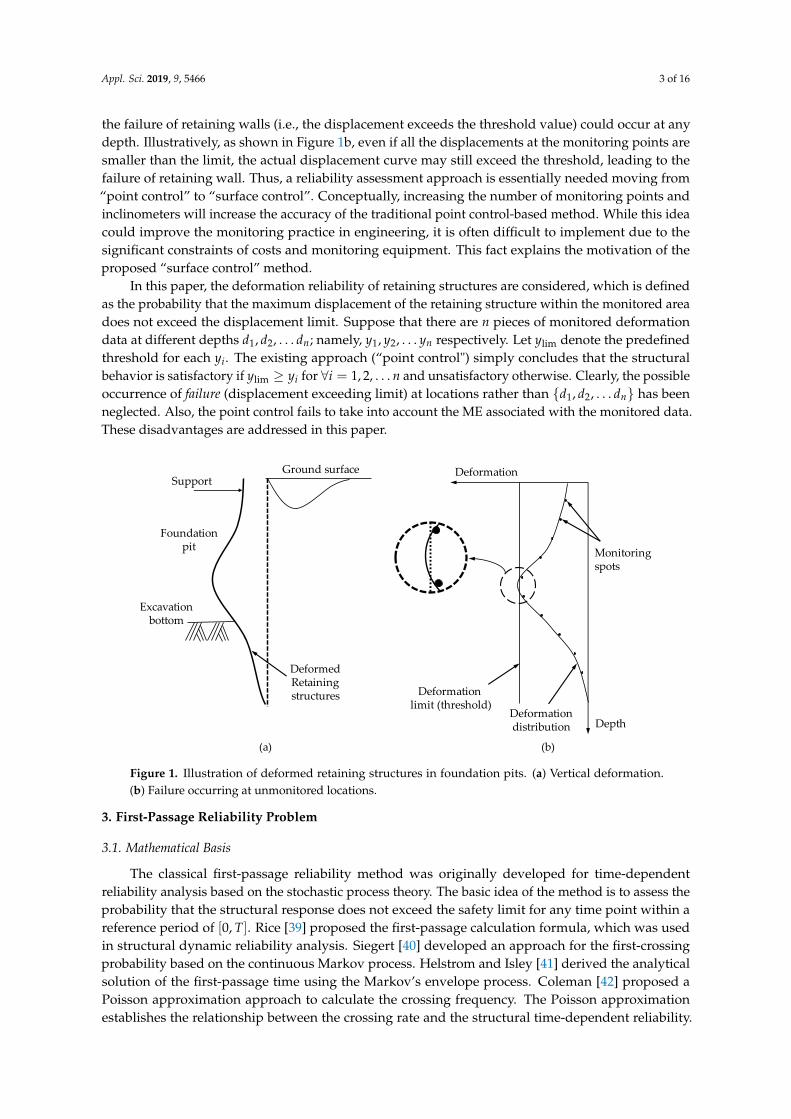
The excavation of deep foundation pits in urban areas will inevitably result in the deformationof the soil and the retaining structures (e.g., retaining walls). Excessive deformation will triggersignificant damage to adjacent buildings and infrastructure facilities. During the excavation process,the soil in the pit is removed and the earth pressure at the two sides of the retaining wall would bechanged. The earth pressure on the outer side of the wall changes from static earth pressure to activeearth pressure, and thus the difference in earth pressure between the inner and outer sides will lead tothe horizontal deformation of the wall [34–36]. When the wall is supported at the top, as is often thecase in engineering practice, the overall deformation of the wall along the vertical direction wouldbehave in a “concave” way [37], as illustrated in Figure 1a (adopted from [38]).
A threshold for the lateral displacement is often used to determine the behaviour of the deformedretaining wall, which would be dependent on the excavation depth of the pit. When the deformationof the wall is monitored at some selected depths, the wall is deemed as satisfactory if all the monitoreddeformations do not exceed the predefined threshold, and vice versa. This method is relativelystraightforward and reflects the current engineering practice for the performance evaluation ofretaining structures in foundation pits, providing a simple yet useful tool for decision-makers.This approach only concerns the deformation at some certain depths (where monitored). In fact,
Appl. Sci. 2019, 9, 5466 3 of 16
the failure of retaining walls (i.e., the displacement exceeds the threshold value) could occur at anydepth. Illustratively, as shown in Figure 1b, even if all the displacements at the monitoring points aresmaller than the limit, the actual displacement curve may still exceed the threshold, leading to thefailure of retaining wall. Thus, a reliability assessment approach is essentially needed moving from“point control” to “surface control”. Conceptually, increasing the number of monitoring points andinclinometers will increase the accuracy of the traditional point control-based method. While this ideacould improve the monitoring practice in engineering, it is often difficult to implement due to thesignificant constraints of costs and monitoring equipment. This fact explains the motivation of theproposed “surface control” method.
In this paper, the deformation reliability of retaining structures are considered, which is definedas the probability that the maximum displacement of the retaining structure within the monitored areadoes not exceed the displacement limit. Suppose that there are n pieces of monitored deformationdata at different depths d1, d2, . . . dn; namely, y1, y2, . . . yn respectively. Let ylim denote the predefinedthreshold for each yi. The existing approach (“point control") simply concludes that the structuralbehavior is satisfactory if ylim ≥ yi for ∀i = 1, 2, . . . n and unsatisfactory otherwise. Clearly, the possibleoccurrence of failure (displacement exceeding limit) at locations rather than d1, d2, . . . dn has beenneglected. Also, the point control fails to take into account the ME associated with the monitored data.These disadvantages are addressed in this paper.
Deformation
Monitoring spots
Deformation limit (threshold)
DepthDeformation distribution
Deformed Retaining structures
Foundationpit
Support
(a) (b)
Excavation bottom
Ground surface
Figure 1. Illustration of deformed retaining structures in foundation pits. (a) Vertical deformation.(b) Failure occurring at unmonitored locations.
3. First-Passage Reliability Problem
3.1. Mathematical Basis
The classical first-passage reliability method was originally developed for time-dependentreliability analysis based on the stochastic process theory. The basic idea of the method is to assess theprobability that the structural response does not exceed the safety limit for any time point within areference period of [0, T]. Rice [39] proposed the first-passage calculation formula, which was usedin structural dynamic reliability analysis. Siegert [40] developed an approach for the first-crossingprobability based on the continuous Markov process. Helstrom and Isley [41] derived the analyticalsolution of the first-passage time using the Markov’s envelope process. Coleman [42] proposed aPoisson approximation approach to calculate the crossing frequency. The Poisson approximationestablishes the relationship between the crossing rate and the structural time-dependent reliability.
Appl. Sci. 2019, 9, 5466 4 of 16
However, the computational accuracy depends on the assumption that the structural response exceedsthe safety limit independently with a small probability. Cramér [43] showed that the solution totime-dependent reliability based on the Poisson process assumption is asymptotically accurate whenthe safety limit tends to infinity. Later on, the first-crossing reliability approach was extensively appliedin the estimate of structural time-dependent safety level [31,32,44–46].
In this paper, the classical time-dependent reliability approach is extended, with somemodifications, to estimate the deformation reliability of retaining structures, by noting that the spatialdistribution of the deformation along the vertical direction is also a one-dimensional problem.
Mathematically, within a length of [0, X] of interest, the limit state function Z(x) takes the form of
Z(x) = R(x)− S(x), (1)
where x denotes the location, S(x) is the structural deformation at x, and R(x) is the deformationlimit at x. If Z(x) ≥ 0 holds for all applicable x ∈ [0, X], then the retaining structure is deemed assatisfactory. Typically, R(x) can be treated as deterministic (or simply a constant in some occasions,e.g., ylim, as discussed in Section 2). Taking into account the uncertainty associated with the processS(x), the probability of Z(x) ≥ 0, ∀x ∈ [0, X] is the deformation reliability, denoted by
L(X) = P(Z(x) ≥ 0, ∀x ∈ [0, X]), (2)
where P( ) is the probability of the event in the bracket. Recall that the traditional “point control”approach (c.f. Section 2) simply gives
Lpc(X) = P(Z(x) ≥ 0, ∀x ∈ [0, X]) =n
∏i=1
I(yi ≥ ylim), (3)
where I( ) is an indicative function, which returns 1 if the statement in the bracket is true and0 otherwise.
Now we apply the first-passage reliability approach to estimate Equation (2). We assume thatS(x) is a weakly stationary Gaussian process. For the purpose of further derivation, we let
Ω(x) = R(x)−E(S(x)), Y(x) = S(x)−E(S(x)), (4)
where E( ) denotes the mean value of the variable in the bracket. With this, Y(x) is a zero-meanstationary Gaussian process, as schematically shown in Figure 2. Thus, Equation (2) becomes
L(X) = P(Ω(x)−Y(x) ≥ 0, ∀x ∈ [0, X]). (5)
The up-crossing rate of Y(x) with respect to Ω(x) at location x, ν+(x), is estimated according to
limdx→0
ν+(x)dx = Pr
Ω(x) > Y(x)⋂
Ω(x + dx) < Y(x + dx)
= Pr
Ω(x + dx)− Y(x)dx < Y(x) < Ω(x)
=∫ ∞
Ω(x)
[Y(x)− Ω(x)
]fYY
[Ω(x), Y(x)
]dY(x)dx
, (6)
where Y(x) and Ω(x) are the differentials of Y(x) and Ω(x) respectively. RearrangingEquation (6) yields
ν+(x) =∫ ∞
Ω(x)
(Y− Ω
)fYY
(Ω, Y
)dY. (7)
Appl. Sci. 2019, 9, 5466 5 of 16
Since Y(x) is a stationary Gaussian process, Y(x) and Y(x) are mutually independent. Thus,it follows,
fYY(x, x) =1
2πσYσYexp
−1
2
(x2
σ2Y+
x2
σ2Y
), (8)
where σY and σY are the standard deviations of Y(x) and Y(x), respectively. Combining Equations (7)and (8) gives
ν+(x) =1
2πσYexp
[−Ω2(x)
2σ2Y
]·
σY exp
(− Ω2(x)
2σ2Y
)−√
2πΩ(x)[
1−Φ(
Ω(x)σY
)], (9)
where Φ( ) is the cumulative density function (CDF) of a standard normal distribution. Assume thatthe upcrossings of Y(x) to Ω(x) are temporally independent and are rare, with which the Poissonprocess can be used to describe the occurrence of the upcrossings. Let NX be the number of upcrossingswithin the length [0, X], and it follows,
Pr(NX = i) =1i!
∫ X
0ν+(x)dx
i
exp−∫ X
0ν+(x)dx
, i = 0, 1, 2, . . . . (10)
By noting the fact that the structural deformation reliability within [0, X] equals the probability ofNX = 0, one has
L(X) = [1− P(0)] exp−∫ X
0ν+(x)dx
, (11)
where P(0) is the failure probability (the probability of deformation exceeding the limit) at x = 0.Specifically, as P(0) is typically small enough, it follows that ([31–33])
L(X) = exp−∫ X
0ν+(x)dx
. (12)
A similar form of Equation (12) (with the terms X and x denoting time) has been extensively usedfor the estimate of structural time-dependent reliability [31,32,44–46]. In this paper, Equation (12) isadopted with modifications to assess the deformation reliability of retaining structures.
Based on Equation (12), combining the concept of “point control”, the deformation reliability,Lnme(X), is formulated as follows,
Lnme(X) = exp−∫ X
0ν+(x)dx
·
n
∏i=1
I(yi ≥ ylim). (13)
By comparing Equations (3) and (13), it can be seen that the proposed method in Equation (13) hasmoved the deformation limit state from “point control” to “surface control”. Note that the subscript“nme” in Equation (13) means that Lnme(X) has not (n) considered the measurement (m) error (e). Theimpact of ME on the deformation reliability is addressed later, in Section 4.3.
Appl. Sci. 2019, 9, 5466 6 of 16
Monitored area
Depth (x)0
Y(x)
Ω(x)
Ω(x), Y(x)
Depth (x)
R(x), S(x) Limit for R(x)
Expectation of S(x)
S(x)
Y(x)
Ω(x) Y(x+dx)
Ω(x +dx)
ν+(x)
x+dxx
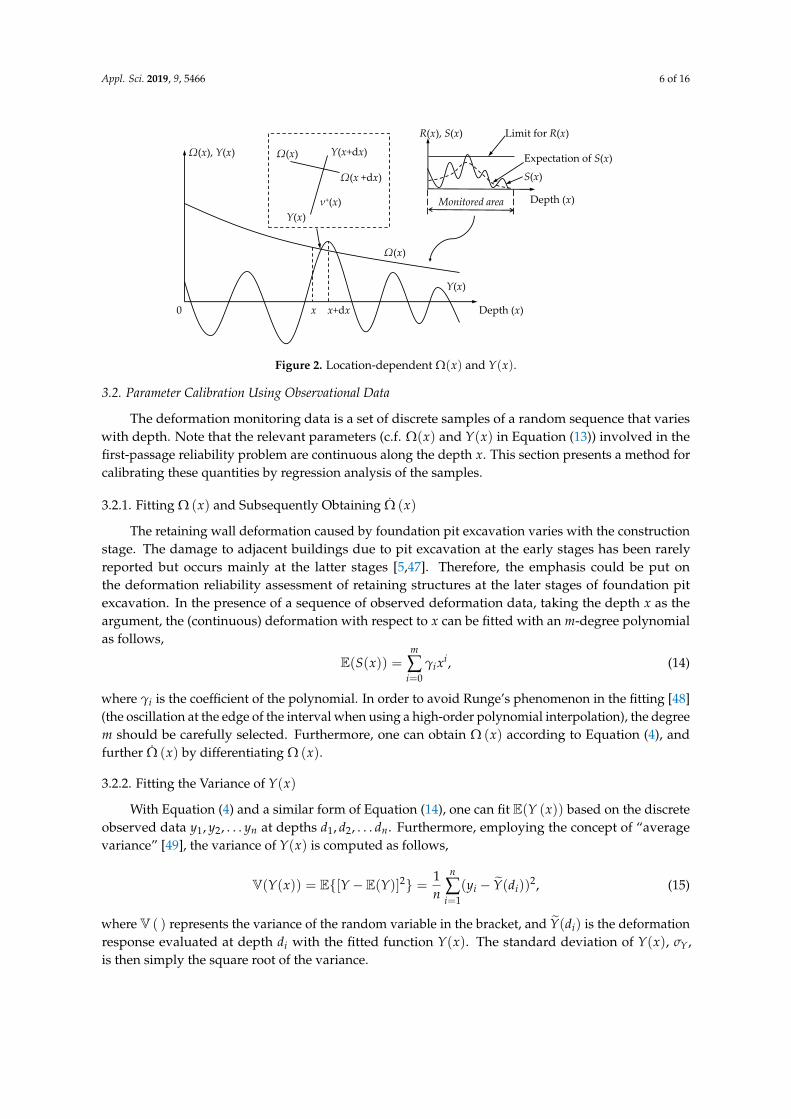
Figure 2. Location-dependent Ω(x) and Y(x).
3.2. Parameter Calibration Using Observational Data
The deformation monitoring data is a set of discrete samples of a random sequence that varieswith depth. Note that the relevant parameters (c.f. Ω(x) and Y(x) in Equation (13)) involved in thefirst-passage reliability problem are continuous along the depth x. This section presents a method forcalibrating these quantities by regression analysis of the samples.
3.2.1. Fitting Ω (x) and Subsequently Obtaining Ω (x)
The retaining wall deformation caused by foundation pit excavation varies with the constructionstage. The damage to adjacent buildings due to pit excavation at the early stages has been rarelyreported but occurs mainly at the latter stages [5,47]. Therefore, the emphasis could be put onthe deformation reliability assessment of retaining structures at the later stages of foundation pitexcavation. In the presence of a sequence of observed deformation data, taking the depth x as theargument, the (continuous) deformation with respect to x can be fitted with an m-degree polynomialas follows,
E(S(x)) =m
∑i=0
γixi, (14)
where γi is the coefficient of the polynomial. In order to avoid Runge’s phenomenon in the fitting [48](the oscillation at the edge of the interval when using a high-order polynomial interpolation), the degreem should be carefully selected. Furthermore, one can obtain Ω (x) according to Equation (4), andfurther Ω (x) by differentiating Ω (x).
3.2.2. Fitting the Variance of Y(x)
With Equation (4) and a similar form of Equation (14), one can fit E(Y (x)) based on the discreteobserved data y1, y2, . . . yn at depths d1, d2, . . . dn. Furthermore, employing the concept of “averagevariance” [49], the variance of Y(x) is computed as follows,
V(Y(x)) = E[Y−E(Y)]2 = 1n
n
∑i=1
(yi − Y(di))2, (15)
where V ( ) represents the variance of the random variable in the bracket, and Y(di) is the deformationresponse evaluated at depth di with the fitted function Y(x). The standard deviation of Y(x), σY,is then simply the square root of the variance.
Appl. Sci. 2019, 9, 5466 7 of 16
3.2.3. Fitting the Variance of Y(x)
Based on the monitored deformation data y1, y2, . . . yn at depths d1, d2, . . . dn, the samples of Yare first approximated by
yi+1−yidi+1−di
for i = 0, 1, 2, . . . n− 1, where y0 = 2y1 − y2 and d0 = 2d1 − d2.
With this, E(Y (x)) is fitted using a polynomial expression similar to Equation (14). Subsequently, byreferring to Equation (15), the variance of Y(x) is determined by
V(Y) = E[Y−E(Y)]2 = 1n
n
∑i=1
(yi − yi−1
di − di−1− ˜Y(di)
)2, (16)
where ˜Y(di) is the fitted function Y(x) evaluated at depth di.
3.2.4. Test of Fitting Accuracy
In order to evaluate the accuracy of the fitting-based prediction of the quantities, the coefficient ofdetermination (R-square) is a frequently-used tool [50], which is computed as follows,
R2 = 1− ∑ni=1 (yi − yi)
2
∑ni=1 (yi − y)2 , (17)
where yi is the fitted value, and y = 1n ∑n
i=1 yi. This coefficient varies within [0, 1]. A value of R2
approaching 1 indicates a well-fitted prediction model.
4. Reliability Assessment Considering ME
4.1. Measurement of Retaining Structure Deformation
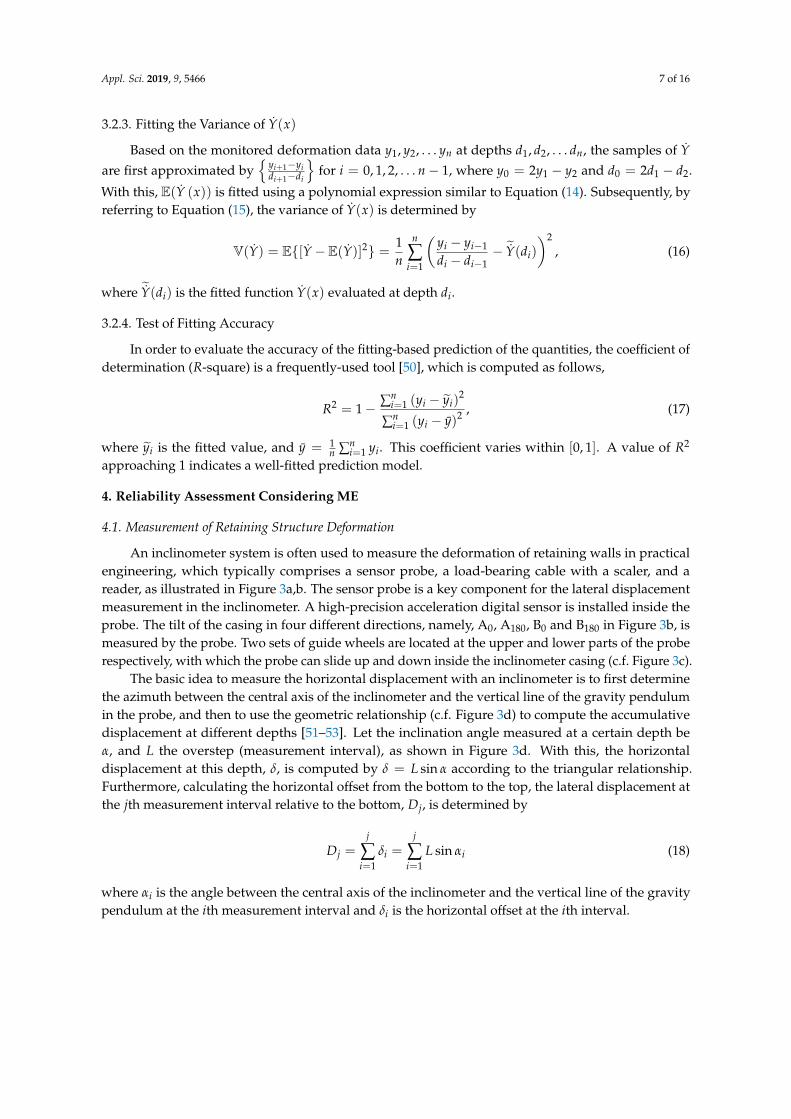
An inclinometer system is often used to measure the deformation of retaining walls in practicalengineering, which typically comprises a sensor probe, a load-bearing cable with a scaler, and areader, as illustrated in Figure 3a,b. The sensor probe is a key component for the lateral displacementmeasurement in the inclinometer. A high-precision acceleration digital sensor is installed inside theprobe. The tilt of the casing in four different directions, namely, A0, A180, B0 and B180 in Figure 3b, ismeasured by the probe. Two sets of guide wheels are located at the upper and lower parts of the proberespectively, with which the probe can slide up and down inside the inclinometer casing (c.f. Figure 3c).
The basic idea to measure the horizontal displacement with an inclinometer is to first determinethe azimuth between the central axis of the inclinometer and the vertical line of the gravity pendulumin the probe, and then to use the geometric relationship (c.f. Figure 3d) to compute the accumulativedisplacement at different depths [51–53]. Let the inclination angle measured at a certain depth beα, and L the overstep (measurement interval), as shown in Figure 3d. With this, the horizontaldisplacement at this depth, δ, is computed by δ = L sin α according to the triangular relationship.Furthermore, calculating the horizontal offset from the bottom to the top, the lateral displacement atthe jth measurement interval relative to the bottom, Dj, is determined by
Dj =j
∑i=1
δi =j
∑i=1
L sin αi (18)
where αi is the angle between the central axis of the inclinometer and the vertical line of the gravitypendulum at the ith measurement interval and δi is the horizontal offset at the ith interval.
Appl. Sci. 2019, 9, 5466 8 of 16
electrical cable
cable connector
guide wheel
guide wheel
rubber bottom
TopA0
A0
A180
B180 B0
Disp. = Lsin
Stepover L
Total disp. = ΣLsin
Bas
elin
e
incl
ino
met
er c
asin
g
(a) (b)
(c) (d)
Figure 3. Inclinometers used to measure the lateral displacement of retaining walls. (a,b) Elevationand top view of a typical inclinometer probe [54]. (c) A tube (PVC plastic, ABS plastic or aluminium) isinstalled serving as the inclinometer casing for the purpose of ground measurement. (d) Measurementof lateral displacement [51].
4.2. Sources of ME
The ME inevitably arises from the observed data in practice. In terms of the lateral displacementdata monitored by an inclinometer, the ME could be caused by inclinometer accuracy and humanerror. The former consists of bias-shift error, sensitivity drift, rotation error, depth positioning errorand others [51,55,56]. For example, the bias-shift error (also known as zero-shift error) is due tothe initial checksum at the probe (c.f. A0 and A180 in Figure 3b) not being zero. Ideally, the sum ofthe readings of A0 and A180 should be zero with identical numbers but opposite signs. However,there is often a slight bias at the initial readings due to the imperfection of the probe. Details for othertypes of ME can be found elsewhere [51,55]. It was argued in [51] that the systematic error due toinclinometer accuracy, which accumulates arithmetically with the number of measurement intervals,is more important and significant than the random error (human error). As such, in this paper, onlythe ME due to inclinometer accuracy is considered. Taking into account its randomness by nature, theME is represented by a random variable. The impact of ME on the deformation reliability of retainingstructures is formulated in the next Section.
Appl. Sci. 2019, 9, 5466 9 of 16
4.3. Deformation Reliability Incorporating ME
Recall Equation (13), which gives the deformation reliability of retaining structures withoutconsidering the potential impact of ME. Taking into account the systematic error in the measurementof lateral displacement, which dominates in ME [51], we let ∆i denote the error associated with theith (from the bottom to the top) measurement interval, which is a random variable representing theuncertainty of the measurement. Since the monitored data at different depths are obtained with thesame inclinometer, and the ME accumulates with the number of measurement intervals, it is reasonableto assume that each ∆i is fully correlated and follows a normal distribution. With this, it follows that
∆i = kiε, i = 1, 2, 3, . . . n, (19)
where ε is a random variable that reflects the accuracy of the inclinometer, and ki is a scaler(i = 1, 2, . . . n) that reflects the accumulation of the ME with the number of measurement intervals.With Equation (19),
σ∆i = kiσε, (20)
where σ• denotes the standard deviation of • = ∆i and ε. Let A denote the accuracy of the inclinometer.With a confidence level of 95%, it follows that
2σ∆i = Adi ⇒ σ∆i =Adi2
. (21)
Notice that the coefficient “2” in Equation (21) is explained by the 95% confidence level; that is,Φ(2)− Φ(−2) ≈ 95%. Similarly, if the confidence level is 99%, then the coefficient “2” should bereplaced by Φ−1(1− 99%) ≈ 2.58.
Combing Equations (20) and (21) gives
Adi2
= kiσε ⇒ ki =Adi2σε
. (22)
Furthermore, in the presence of ME, the application of “point control” (c.f. Section 2 andEquation (3)) gives
Lpc(X) = P (y1 + ∆1 ≤ ylim ∩ y2 + ∆2 ≤ ylim ∩ . . . yn + ∆n ≤ ylim)
= P (y1 + k1ε ≤ ylim ∩ y2 + k2ε ≤ ylim ∩ . . . yn + knε ≤ ylim)
= P(
ε ≤ ylim − y1
k1∩ ε ≤ ylim − y2
k2∩ . . . ε ≤ ylim − yn
kn
)
= Φ
n
mini=1
ylim−yiki
σε
Equation (22)========= Φ
(2
nmini=1
ylim − yiAdi
) . (23)
Clearly, if ylim − yi ≥ 0 for ∀i = 1, 2, . . . n and A → 0 (i.e., infinite accuracy) in Equation (23),then Lpc(X)→ 1. On the other hand, if min(ylim − yi) < 0 and A→ 0, then Lpc(X)→ 0. These factsimply that Equation (23) is a generalized case of Equation (3). Furthermore, similar to Equation (13),the deformation reliability in the presence of ME is formulated as follows,
Lme(X) = exp−∫ X
0ν+(x)dx
·Φ(
2n
mini=1
ylim − yiAdi
). (24)
The comparison between Equations (13) and (24) shows that the measurement accuracy of theinclinometer (A) has been explicitly incorporated in the deformation reliability of retaining structures.The applicability and accuracy of Equation (24) is demonstrated in the following.
Appl. Sci. 2019, 9, 5466 10 of 16
Notice that the proposed method (Equation (13) or (24)) only needs the computational costs ofcalculating a one-fold integral, which enables the deformation reliability assessment to be performedefficiently compared with the traditional finite element-based approaches. Thus, the proposed methodis promising to be adopted for use in practical engineering.
5. Case Study
5.1. Background
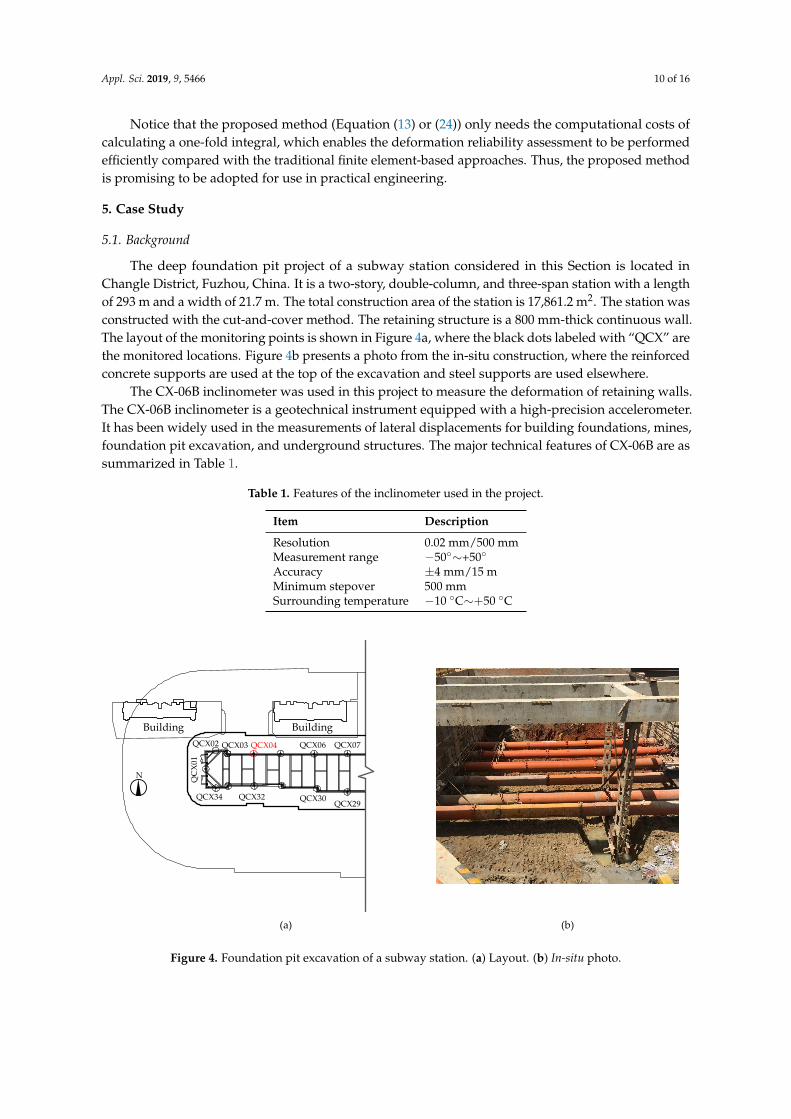
The deep foundation pit project of a subway station considered in this Section is located inChangle District, Fuzhou, China. It is a two-story, double-column, and three-span station with a lengthof 293 m and a width of 21.7 m. The total construction area of the station is 17,861.2 m2. The station wasconstructed with the cut-and-cover method. The retaining structure is a 800 mm-thick continuous wall.The layout of the monitoring points is shown in Figure 4a, where the black dots labeled with “QCX” arethe monitored locations. Figure 4b presents a photo from the in-situ construction, where the reinforcedconcrete supports are used at the top of the excavation and steel supports are used elsewhere.
The CX-06B inclinometer was used in this project to measure the deformation of retaining walls.The CX-06B inclinometer is a geotechnical instrument equipped with a high-precision accelerometer.It has been widely used in the measurements of lateral displacements for building foundations, mines,foundation pit excavation, and underground structures. The major technical features of CX-06B are assummarized in Table 1.
Table 1. Features of the inclinometer used in the project.
Item Description
Resolution 0.02 mm/500 mmMeasurement range −50∼+50
Accuracy ±4 mm/15 mMinimum stepover 500 mmSurrounding temperature −10 C∼+50 C
(a) (b)
Building Building
QCX29QCX30
QCX01
QCX34
QCX03 QCX06 QCX07
N
QCX04QCX02
QCX32
Figure 4. Foundation pit excavation of a subway station. (a) Layout. (b) In-situ photo.
Appl. Sci. 2019, 9, 5466 11 of 16
5.2. Deformation Reliability Assessment
We illustratively chose the monitored data at location QCX04 (c.f. Figure 4a) to performdeformation reliability assessment. The horizontal displacements measured at different depths oneach day are shown in Table 2. Note that the depths in Table 2 were calculated from the bottom, whichwould equal 43.5 m at the top (ground surface).
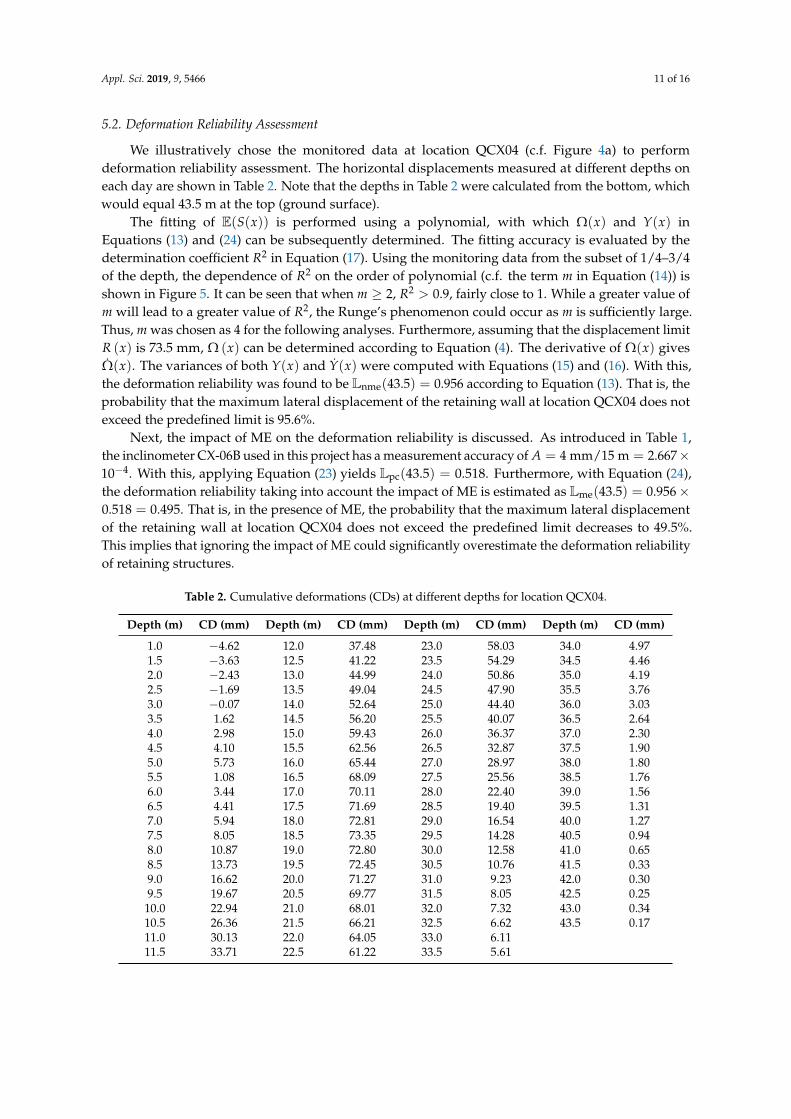
The fitting of E(S(x)) is performed using a polynomial, with which Ω(x) and Y(x) inEquations (13) and (24) can be subsequently determined. The fitting accuracy is evaluated by thedetermination coefficient R2 in Equation (17). Using the monitoring data from the subset of 1/4–3/4of the depth, the dependence of R2 on the order of polynomial (c.f. the term m in Equation (14)) isshown in Figure 5. It can be seen that when m ≥ 2, R2 > 0.9, fairly close to 1. While a greater value ofm will lead to a greater value of R2, the Runge’s phenomenon could occur as m is sufficiently large.Thus, m was chosen as 4 for the following analyses. Furthermore, assuming that the displacement limitR (x) is 73.5 mm, Ω (x) can be determined according to Equation (4). The derivative of Ω(x) givesΩ(x). The variances of both Y(x) and Y(x) were computed with Equations (15) and (16). With this,the deformation reliability was found to be Lnme(43.5) = 0.956 according to Equation (13). That is, theprobability that the maximum lateral displacement of the retaining wall at location QCX04 does notexceed the predefined limit is 95.6%.
Next, the impact of ME on the deformation reliability is discussed. As introduced in Table 1,the inclinometer CX-06B used in this project has a measurement accuracy of A = 4 mm/15 m = 2.667×10⁻⁴. With this, applying Equation (23) yields Lpc(43.5) = 0.518. Furthermore, with Equation (24),the deformation reliability taking into account the impact of ME is estimated as Lme(43.5) = 0.956×0.518 = 0.495. That is, in the presence of ME, the probability that the maximum lateral displacementof the retaining wall at location QCX04 does not exceed the predefined limit decreases to 49.5%.This implies that ignoring the impact of ME could significantly overestimate the deformation reliabilityof retaining structures.
Table 2. Cumulative deformations (CDs) at different depths for location QCX04.
Depth (m) CD (mm) Depth (m) CD (mm) Depth (m) CD (mm) Depth (m) CD (mm)
1.0 −4.62 12.0 37.48 23.0 58.03 34.0 4.971.5 −3.63 12.5 41.22 23.5 54.29 34.5 4.462.0 −2.43 13.0 44.99 24.0 50.86 35.0 4.192.5 −1.69 13.5 49.04 24.5 47.90 35.5 3.763.0 −0.07 14.0 52.64 25.0 44.40 36.0 3.033.5 1.62 14.5 56.20 25.5 40.07 36.5 2.644.0 2.98 15.0 59.43 26.0 36.37 37.0 2.304.5 4.10 15.5 62.56 26.5 32.87 37.5 1.905.0 5.73 16.0 65.44 27.0 28.97 38.0 1.805.5 1.08 16.5 68.09 27.5 25.56 38.5 1.766.0 3.44 17.0 70.11 28.0 22.40 39.0 1.566.5 4.41 17.5 71.69 28.5 19.40 39.5 1.317.0 5.94 18.0 72.81 29.0 16.54 40.0 1.277.5 8.05 18.5 73.35 29.5 14.28 40.5 0.948.0 10.87 19.0 72.80 30.0 12.58 41.0 0.658.5 13.73 19.5 72.45 30.5 10.76 41.5 0.339.0 16.62 20.0 71.27 31.0 9.23 42.0 0.309.5 19.67 20.5 69.77 31.5 8.05 42.5 0.25
10.0 22.94 21.0 68.01 32.0 7.32 43.0 0.3410.5 26.36 21.5 66.21 32.5 6.62 43.5 0.1711.0 30.13 22.0 64.05 33.0 6.1111.5 33.71 22.5 61.22 33.5 5.61
Appl. Sci. 2019, 9, 5466 12 of 16
1 2 3 4 50 . 0
0 . 2
0 . 4
0 . 6
0 . 8
1 . 0
R2
mFigure 5. Dependence of the R-squared on the fitting order (c.f. m in Equation (14)).
5.3. Verification of the Proposed Method
In order to verify the accuracy of the proposed method in Equation (24), the Monte Carlosimulation method is used. The analytical and simulated reliabilities are expected to agree well witheach other to demonstrate the applicability of Equation (24). The basic idea of the simulation-basedapproach is to generate a set of random lateral displacements distributed along the vertical direction ofthe retaining wall, and compare each of them with the predefined threshold to determine the structuralstate (failure or survival). For the jth simulation run (j = 1, 2, . . . q, where q is sufficiently large),the procedure is summarized as follows.
1. Let rj = 1, which becomes 0 if the jth sampled scenario of lateral deformation leads to structuralfailure (i.e., maximum lateral displacement exceeds the threshold).
2. Calculate the displacement distribution along the vertical direction of the retaining wall at aninterval of 5 mm (excluding the monitoring points) using Equation (14).
3. Generate a set of correlated zero-mean normal random variables with a standard deviation ofσY using the Nataf transformation method [32], and add them to the sample values from Step 2respectively. This is to obtain a set of displacement values that are approximately continuous alongthe depth and have the same statistical characteristics as those used in the analytical approach.
4. Sample a realization of normally distributed ε with a mean value of 0 and a standard deviation ofσε. Use Equation (22) to compute ki and subsequently utilize Equation (21) to calculate each ∆i,where i = 1, 2, . . . n.
5. The sampled data at depth di is calculated as yi + ∆i for i = 1, 2, . . . n.6. Combining those sampled data in Steps 3 and 5, for each of them, if the displacement exceeds the
predefined limit, then set rj = 0.7. Record rj.
With q simulation runs, the simulated deformation reliability is approximated by 1q ∑
qj=1 rj.
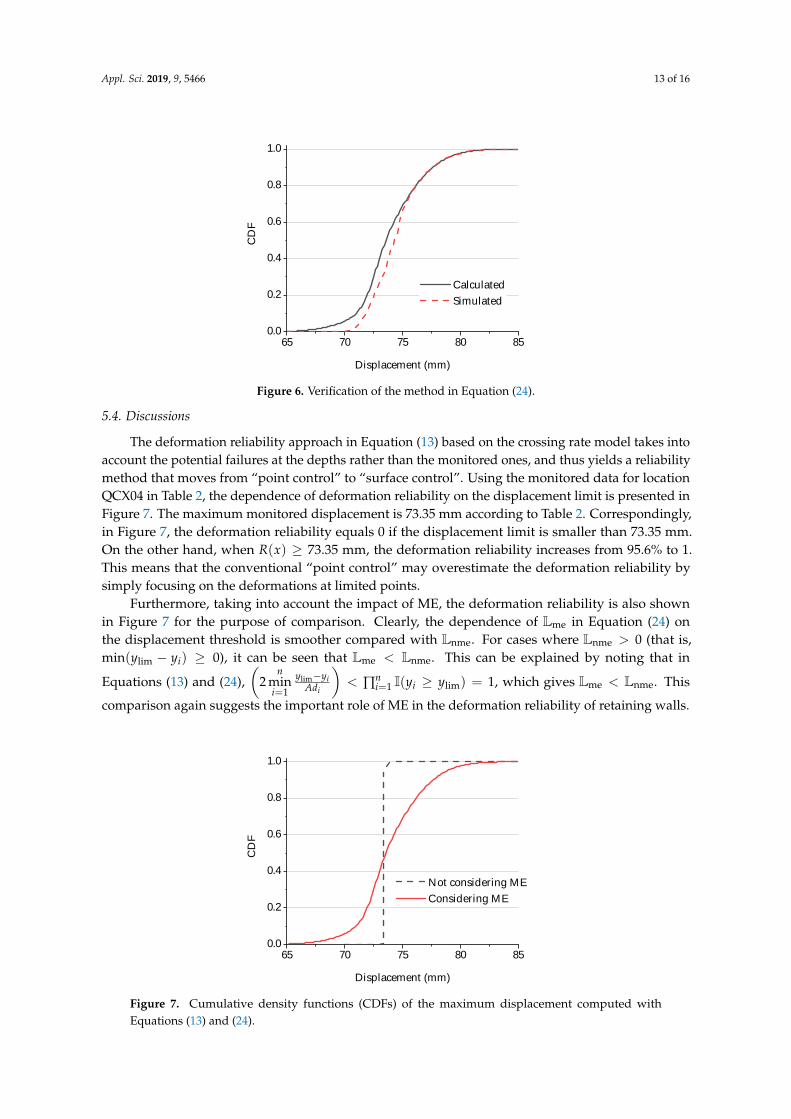
The analytical and simulation-based reliabilities with different displacement thresholds arepresented in Figure 6 for the purposes of comparison. The number of simulation runs is q = 106 foreach case. It can be seen that at the upper tail (e.g., ≥ 73 mm), the results from both approaches agreewell with each other, which indicates the accuracy of the proposed method in Equation (24). At thelower tail, the reliability associated with the analytical approach is slightly greater than that of thesimulation-based approach due to the impact of Poisson assumption in the analytical formulation(c.f. Section 3.1). Nonetheless, as the emphasis is on the behavior at the upper tail for most engineeringcases, the proposed reliability assessment method in Equation (24) can be used to reasonably estimatethe deformation safety level of retaining structures.
Appl. Sci. 2019, 9, 5466 13 of 16
6 5 7 0 7 5 8 0 8 50 . 0
0 . 2
0 . 4
0 . 6
0 . 8
1 . 0
CDF
D i s p l a c e m e n t ( m m )
C a l c u l a t e d S i m u l a t e d
Figure 6. Verification of the method in Equation (24).
5.4. Discussions
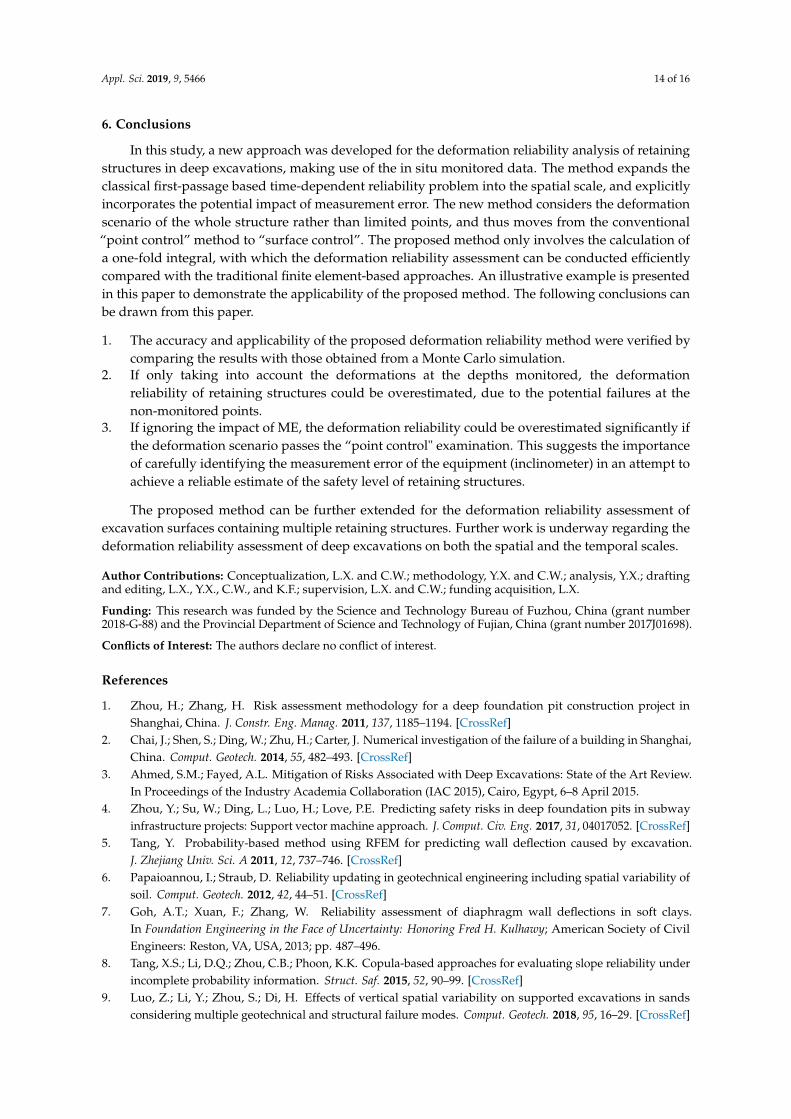
The deformation reliability approach in Equation (13) based on the crossing rate model takes intoaccount the potential failures at the depths rather than the monitored ones, and thus yields a reliabilitymethod that moves from “point control” to “surface control”. Using the monitored data for locationQCX04 in Table 2, the dependence of deformation reliability on the displacement limit is presented inFigure 7. The maximum monitored displacement is 73.35 mm according to Table 2. Correspondingly,in Figure 7, the deformation reliability equals 0 if the displacement limit is smaller than 73.35 mm.On the other hand, when R(x) ≥ 73.35 mm, the deformation reliability increases from 95.6% to 1.This means that the conventional “point control” may overestimate the deformation reliability bysimply focusing on the deformations at limited points.
Furthermore, taking into account the impact of ME, the deformation reliability is also shownin Figure 7 for the purpose of comparison. Clearly, the dependence of Lme in Equation (24) onthe displacement threshold is smoother compared with Lnme. For cases where Lnme > 0 (that is,min(ylim − yi) ≥ 0), it can be seen that Lme < Lnme. This can be explained by noting that in
Equations (13) and (24),(
2n
mini=1
ylim−yiAdi
)< ∏n
i=1 I(yi ≥ ylim) = 1, which gives Lme < Lnme. This
comparison again suggests the important role of ME in the deformation reliability of retaining walls.
6 5 7 0 7 5 8 0 8 50 . 0
0 . 2
0 . 4
0 . 6
0 . 8
1 . 0
CDF
D i s p l a c e m e n t ( m m )
N o t c o n s i d e r i n g M E C o n s i d e r i n g M E
Figure 7. Cumulative density functions (CDFs) of the maximum displacement computed withEquations (13) and (24).
Appl. Sci. 2019, 9, 5466 14 of 16
6. Conclusions
In this study, a new approach was developed for the deformation reliability analysis of retainingstructures in deep excavations, making use of the in situ monitored data. The method expands theclassical first-passage based time-dependent reliability problem into the spatial scale, and explicitlyincorporates the potential impact of measurement error. The new method considers the deformationscenario of the whole structure rather than limited points, and thus moves from the conventional“point control” method to “surface control”. The proposed method only involves the calculation ofa one-fold integral, with which the deformation reliability assessment can be conducted efficientlycompared with the traditional finite element-based approaches. An illustrative example is presentedin this paper to demonstrate the applicability of the proposed method. The following conclusions canbe drawn from this paper.
1. The accuracy and applicability of the proposed deformation reliability method were verified bycomparing the results with those obtained from a Monte Carlo simulation.
2. If only taking into account the deformations at the depths monitored, the deformationreliability of retaining structures could be overestimated, due to the potential failures at thenon-monitored points.
3. If ignoring the impact of ME, the deformation reliability could be overestimated significantly ifthe deformation scenario passes the “point control" examination. This suggests the importanceof carefully identifying the measurement error of the equipment (inclinometer) in an attempt toachieve a reliable estimate of the safety level of retaining structures.
The proposed method can be further extended for the deformation reliability assessment ofexcavation surfaces containing multiple retaining structures. Further work is underway regarding thedeformation reliability assessment of deep excavations on both the spatial and the temporal scales.
Author Contributions: Conceptualization, L.X. and C.W.; methodology, Y.X. and C.W.; analysis, Y.X.; draftingand editing, L.X., Y.X., C.W., and K.F.; supervision, L.X. and C.W.; funding acquisition, L.X.
Funding: This research was funded by the Science and Technology Bureau of Fuzhou, China (grant number2018-G-88) and the Provincial Department of Science and Technology of Fujian, China (grant number 2017J01698).
Conflicts of Interest: The authors declare no conflict of interest.
References
1. Zhou, H.; Zhang, H. Risk assessment methodology for a deep foundation pit construction project inShanghai, China. J. Constr. Eng. Manag. 2011, 137, 1185–1194. [CrossRef]
2. Chai, J.; Shen, S.; Ding, W.; Zhu, H.; Carter, J. Numerical investigation of the failure of a building in Shanghai,China. Comput. Geotech. 2014, 55, 482–493. [CrossRef]
3. Ahmed, S.M.; Fayed, A.L. Mitigation of Risks Associated with Deep Excavations: State of the Art Review.In Proceedings of the Industry Academia Collaboration (IAC 2015), Cairo, Egypt, 6–8 April 2015.
4. Zhou, Y.; Su, W.; Ding, L.; Luo, H.; Love, P.E. Predicting safety risks in deep foundation pits in subwayinfrastructure projects: Support vector machine approach. J. Comput. Civ. Eng. 2017, 31, 04017052. [CrossRef]
5. Tang, Y. Probability-based method using RFEM for predicting wall deflection caused by excavation.J. Zhejiang Univ. Sci. A 2011, 12, 737–746. [CrossRef]
6. Papaioannou, I.; Straub, D. Reliability updating in geotechnical engineering including spatial variability ofsoil. Comput. Geotech. 2012, 42, 44–51. [CrossRef]
7. Goh, A.T.; Xuan, F.; Zhang, W. Reliability assessment of diaphragm wall deflections in soft clays.In Foundation Engineering in the Face of Uncertainty: Honoring Fred H. Kulhawy; American Society of CivilEngineers: Reston, VA, USA, 2013; pp. 487–496.
8. Tang, X.S.; Li, D.Q.; Zhou, C.B.; Phoon, K.K. Copula-based approaches for evaluating slope reliability underincomplete probability information. Struct. Saf. 2015, 52, 90–99. [CrossRef]
9. Luo, Z.; Li, Y.; Zhou, S.; Di, H. Effects of vertical spatial variability on supported excavations in sandsconsidering multiple geotechnical and structural failure modes. Comput. Geotech. 2018, 95, 16–29. [CrossRef]
Appl. Sci. 2019, 9, 5466 15 of 16
10. Luo, Z.; Atamturktur, S.; Juang, C.H. Bootstrapping for characterizing the effect of uncertainty in samplestatistics for braced excavations. J. Geotech. Geoenviron. Eng. 2012, 139, 13–23. [CrossRef]
11. Wang, L.; Luo, Z.; Gong, W.; Khoshnevisan, S.; Juang, C.H. Moment methods for assessing the probability ofserviceability failure in braced excavations. In Proceedings of the Geo-Congress 2014: Geo-Characterizationand Modeling for Sustainability, Atlanta, GA, USA, 23–26 February 2014; pp. 3293–3302.
12. Goh, A.; Kulhawy, F. Reliability assessment of serviceability performance of braced retaining walls using aneural network approach. Int. J. Numer. Anal. Methods Geomech. 2005, 29, 627–642. [CrossRef]
13. Khosrojerdi, M.; Xiao, M.; Qiu, T.; Nicks, J. Evaluation of prediction methods for lateral deformation of GRSwalls and abutments. J. Geotech. Geoenviron. Eng. 2016, 143, 06016022. [CrossRef]
14. Sayed, S.; Dodagoudar, G.; Rajagopal, K. Finite element reliability analysis of reinforced retaining walls.Geomech. Geoengin. Int. J. 2010, 5, 187–197. [CrossRef]
15. Goldberg, D.; Jaworski, W.; Gordon, M. Lateral Support Systems and Underpinning; Technical report, DCReport FHWA-RD-75-128; Federal Highway Administration: Washington, DC, USA, 1976.
16. Ou, C.Y.; Hsieh, P.G.; Chiou, D.C. Characteristics of ground surface settlement during excavation.Can. Geotech. J. 1993, 30, 758–767. [CrossRef]
17. Finno, R.J.; Voss, F.T., Jr.; Rossow, E.; Blackburn, J.T. Evaluating damage potential in buildings affected byexcavations. J. Geotech. Geoenviron. Eng. 2005, 131, 1199–1210. [CrossRef]
18. Roboski, J.; Finno, R.J. Distributions of ground movements parallel to deep excavations in clay.Can. Geotech. J. 2006, 43, 43–58. [CrossRef]
19. Hashash, Y.M.; Finno, R.J. Development of new integrated tools for predicting, monitoring, and controllingground movements due to excavations. Pract. Period. Struct. Des. Constr. 2008, 13, 4–10. [CrossRef]
20. Ran, L.; Yi, T.H.; Ye, X.W.; Dong, X.B. Long-term deformation monitoring of metro-tunnel airshaft excavationduring construction stage. Int. J. Distrib. Sens. Netw. 2012, 8, 972893. [CrossRef]
21. Yang, Y.; Lü, J.; Huang, X.; Tu, X. Sensor monitoring of a newly designed foundation pit supporting structure.J. Cent. South Univ. 2013, 20, 1064–1070. [CrossRef]
22. Zhang, H.B.; Chen, J.J.; Fan, F.; Wang, J.H. Deformation monitoring and performance analysis on the shieldtunnel influenced by adjacent deep excavations. J. Aerosp. Eng. 2015, 30, B4015002. [CrossRef]
23. Li, X.; Zhang, L.; Jiang, S. Updating performance of high rock slopes by combining incremental time-seriesmonitoring data and three-dimensional numerical analysis. Int. J. Rock Mech. Min. Sci. 2016, 83, 252–261.[CrossRef]
24. Qi, X.H.; Zhou, W.H. An efficient probabilistic back-analysis method for braced excavations using walldeflection data at multiple points. Comput. Geotech. 2017, 85, 186–198. [CrossRef]
25. Carlà, T.; Macciotta, R.; Hendry, M.; Martin, D.; Edwards, T.; Evans, T.; Farina, P.; Intrieri, E.; Casagli, N.Displacement of a landslide retaining wall and application of an enhanced failure forecasting approach.Landslides 2018, 15, 489–505. [CrossRef] [PubMed]
26. Christian, J.T. Geotechnical engineering reliability: How well do we know what we are doing? J. Geotech.Geoenviron. Eng. 2004, 130, 985–1003. [CrossRef]
27. Abdulai, M.; Sharifzadeh, M. Uncertainty and Reliability Analysis of Open Pit Rock Slopes: A CriticalReview of Methods of Analysis. Geotech. Geol. Eng. 2019, 37, 1223–1247. [CrossRef]
28. Der Kiureghian, A.; Ditlevsen, O. Aleatory or epistemic? Does it matter? Struct. Saf. 2009, 31, 105–112.[CrossRef]
29. Sankararaman, S.; Mahadevan, S. Model validation under epistemic uncertainty. Reliab. Eng. Syst. Saf. 2011,96, 1232–1241. [CrossRef]
30. Mullins, J.; Ling, Y.; Mahadevan, S.; Sun, L.; Strachan, A. Separation of aleatory and epistemic uncertainty inprobabilistic model validation. Reliab. Eng. Syst. Saf. 2016, 147, 49–59. [CrossRef]
31. Engelund, S.; Rackwitz, R.; Lange, C. Approximations of first-passage times for differentiable processesbased on higher-order threshold crossings. Probabilistic Eng. Mech. 1995, 10, 53–60. [CrossRef]
32. Melchers, R. Structural Reliability Analysis and Prediction; Wiley: New York, NY, USA, 1999.33. Wang, C.; Zhang, H.; Beer, M. Structural time-dependent reliability assessment with new power spectral
density function. J. Struct. Eng. 2019, 145, 04019163. [CrossRef]34. Nakai, T.; Xu, L.; Yamazaki, H. 3D and 2D model tests and numerical analyses of settlements and earth
pressures due to tunnel excavation. Soils Found. 1997, 37, 31–42. [CrossRef]
Appl. Sci. 2019, 9, 5466 16 of 16
35. Gao, W.; Dou, Y.M.; Zhou, X.L.; Peng, F.L. Studies on displacements and earth pressures of pit-retainingstructure during excavation by steps. Chin. J. Geotech. Eng. 2006, 28, 1455–1459.
36. Ou, C.Y. Deep Excavation: Theory and Practice; CRC Press: London, UK, 2014.37. Boone, S.J. Design of Deep Excavations in Urban Environments. Ph.D. Thesis, University of Toronto,
Toronto, Japan, 2004.38. Hsiao, C.L. Wall and Ground Movements in a Braced Excavation in Clays and Serviceability Reliability of
Adjacent Buildings. Ph.D. Thesis, Clemson University, Clemson, SC, USA, 2007.39. Rice, S.O. Mathematical analysis of random noise. Bell Syst. Tech. J. 1944, 23, 282–332. [CrossRef]40. Siegert, A.J. On the first passage time probability problem. Phys. Rev. 1951, 81, 617. [CrossRef]41. Helstrom, C.; Isley, C. Two notes on a Markoff envelope process. IRE Trans. Inf. Theory 1959, 5, 139–140.
[CrossRef]42. Coleman, J.J. Reliability of aircraft structures in resisting chance failure. Oper. Res. 1959, 7, 639–645.
[CrossRef]43. Cramér, H. On the intersections between the trajectories of a normal stationary stochastic process and a high
level. Arkiv för Matematik 1966, 6, 337–349. [CrossRef]44. Schall, G.; Faber, M.H.; Rackwitz, R. The ergodicity assumption for sea states in the reliability estimation of
offshore structures. J. Offshore Mech. Arct. Eng. 1991, 113, 241–246. [CrossRef]45. Rackwitz, R. Computational techniques in stationary and non-stationary load combination—A review and
some extensions. J. Struct. Eng. 1998, 25, 1–20.46. Li, C.Q.; Melchers, R.E. Time-dependent reliability analysis of corrosion-induced concrete cracking.
ACI Struct. J. 2005, 102, 543–549.47. Hsiao, E.C.; Schuster, M.; Juang, C.H.; Kung, G.T. Reliability analysis and updating of excavation-induced
ground settlement for building serviceability assessment. J. Geotech. Geoenviron. Eng. 2008, 134, 1448–1458.[CrossRef]
48. Cheney, W.; Light, W. A Course in Approximation Theory; Brooks/Cole Publishing Company: Pacific Grove,CA, USA, 2000.
49. Wang, C.; Li, Q.; Zou, A.; Zhang, L. A realistic resistance deterioration model for time-dependent reliabilityanalysis of aging bridges. J. Zhejiang Univ. Sci. A 2015, 16, 513–524. [CrossRef]
50. Draper, N.R.; Smith, H. Applied Regression Analysis; John Wiley & Sons: Hoboken, NJ, USA, 1998.51. Stark, T.D.; Choi, H. Slope inclinometers for landslides. Landslides 2008, 5, 339–350. [CrossRef]52. Goh, A.; Wong, K.; Teh, C.; Wen, D. Pile response adjacent to braced excavation. J. Geotech. Geoenviron. Eng.
2003, 129, 383–386. [CrossRef]53. Finno, R.J.; Calvello, M. Supported excavations: Observational method and inverse modeling. J. Geotech.
Geoenviron. Eng. 2005, 131, 826–836. [CrossRef]54. Peng, L. Data Processing System Development and Monitoring Results Analysis Methods Research of
Borehole Inclinometer. Master’s Thesis, Chengdu University of Technology, Chengdu, China, 2011.55. Xiong, G.; Zhang, Q. Observation accuracy and applied study of inclinometer. Hydro-Sci. Eng. 1990,
3, 287–296. doi:10.16198/j.cnki.1009-640x.1990.03.007. [CrossRef]56. Mikkelsen, P.E. Advances in inclinometer data analysis. In Proceedings of the Symposium on field
Measurements in Geomechanics, FMGM, Oslo, Norway, 15–18 September 2003.
c© 2019 by the authors. Licensee MDPI, Basel, Switzerland. This article is an open accessarticle distributed under the terms and conditions of the Creative Commons Attribution(CC BY) license (http://creativecommons.org/licenses/by/4.0/).


![Basic Study on Deformation Evaluation of Steel Wire … et al..pdfconcrete retaining wall design standards [3]. Hence, in the fields of agricultural and civil engineering works in](https://img.dokumen.tips/doc/110x75/5ea53701bfdfc45714313ed2/basic-study-on-deformation-evaluation-of-steel-wire-et-alpdf-concrete-retaining.jpg)