Embed Size (px)
DESCRIPTION
formation and evaluation
Citation preview

Data Analysis Techniques
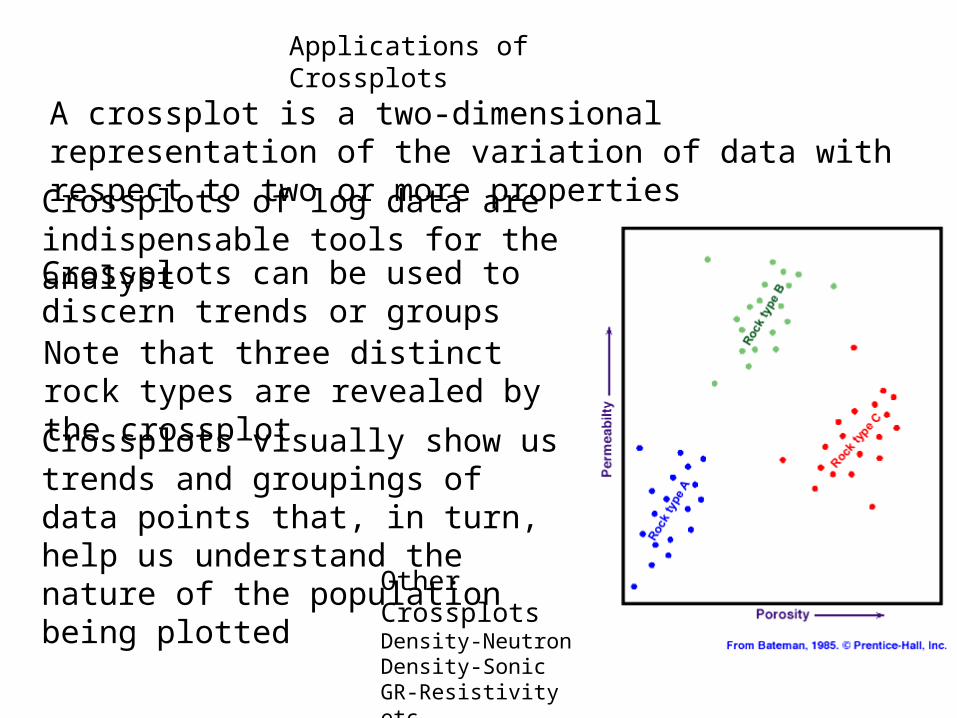
Applications of Crossplots
Crossplots of log data are indispensable tools for the analyst
A crossplot is a two-dimensional representation of the variation of data with respect to two or more properties
Crossplots can be used to discern trends or groupsNote that three distinct rock types are revealed by the crossplot
Crossplots visually show us trends and groupings of data points that, in turn, help us understand the nature of the population being plotted
Other CrossplotsDensity-NeutronDensity-SonicGR-Resistivity etc
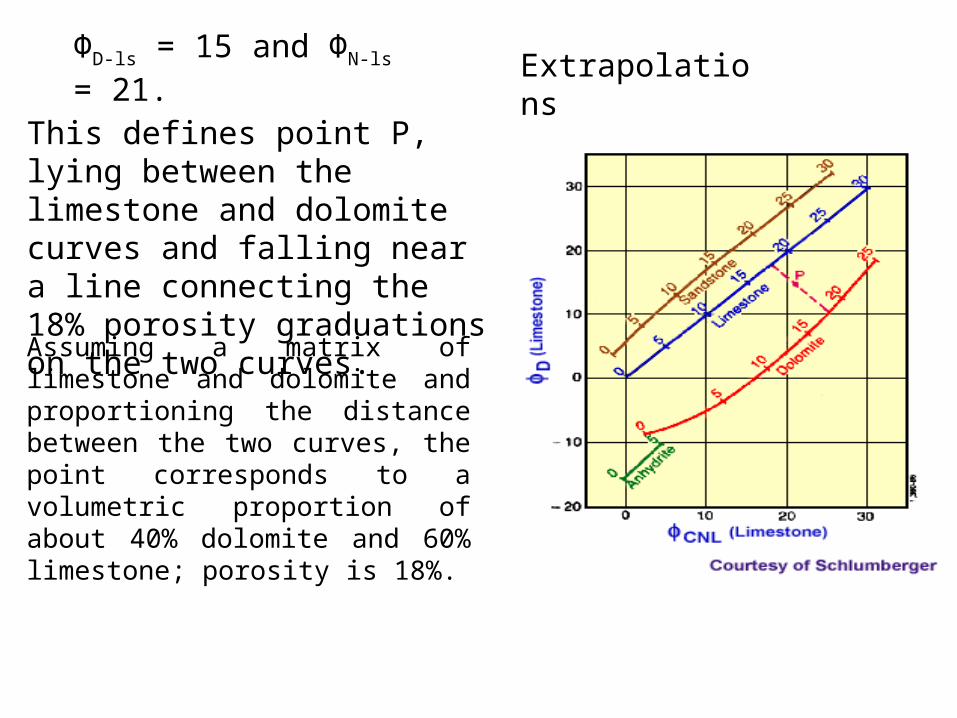
ΦD-ls = 15 and ΦN-ls = 21.
This defines point P, lying between the limestone and dolomite curves and falling near a line connecting the 18% porosity graduations on the two curves.
Assuming a matrix of limestone and dolomite and proportioning the distance between the two curves, the point corresponds to a volumetric proportion of about 40% dolomite and 60% limestone; porosity is 18%.
Extrapolations
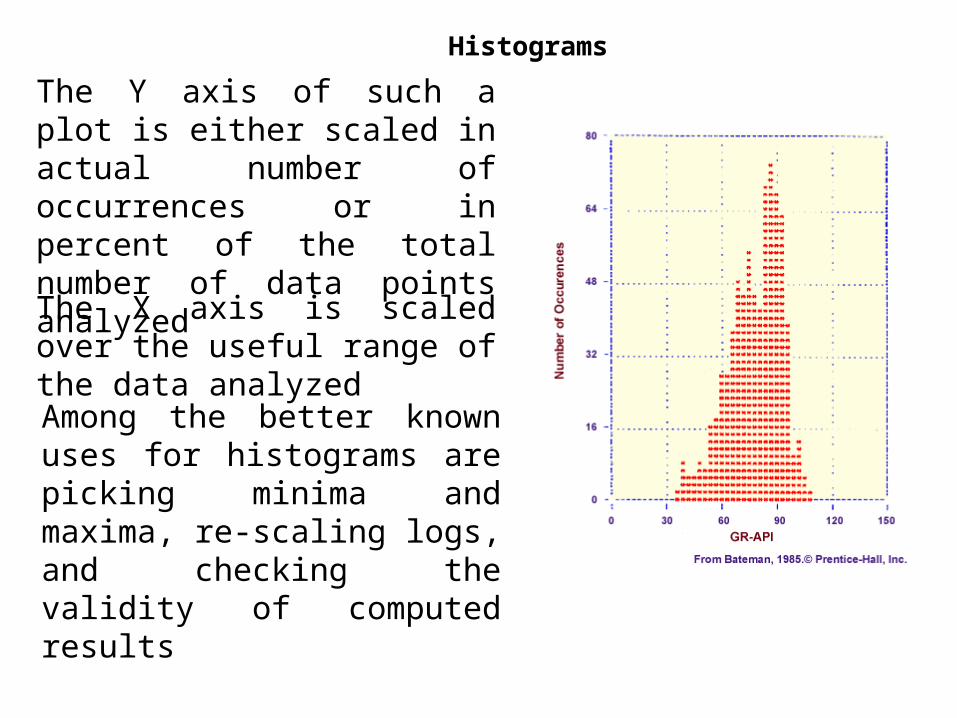
Histograms
The Y axis of such a plot is either scaled in actual number of occurrences or in percent of the total number of data points analyzed
The X axis is scaled over the useful range of the data analyzed
Among the better known uses for histograms are picking minima and maxima, re-scaling logs, and checking the validity of computed results
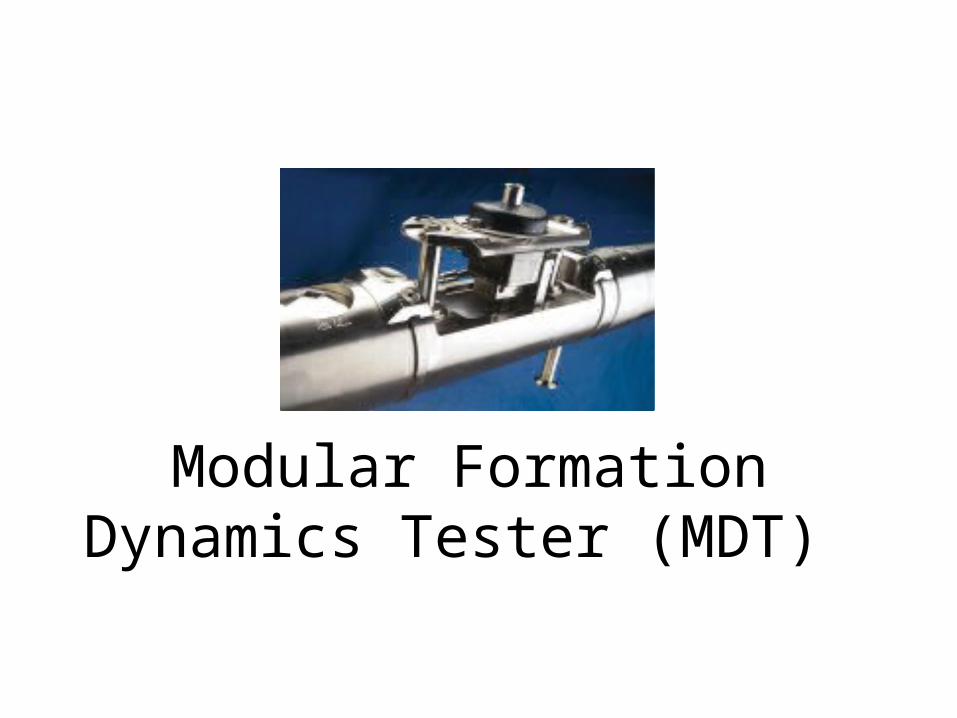
Modular Formation Dynamics Tester (MDT)
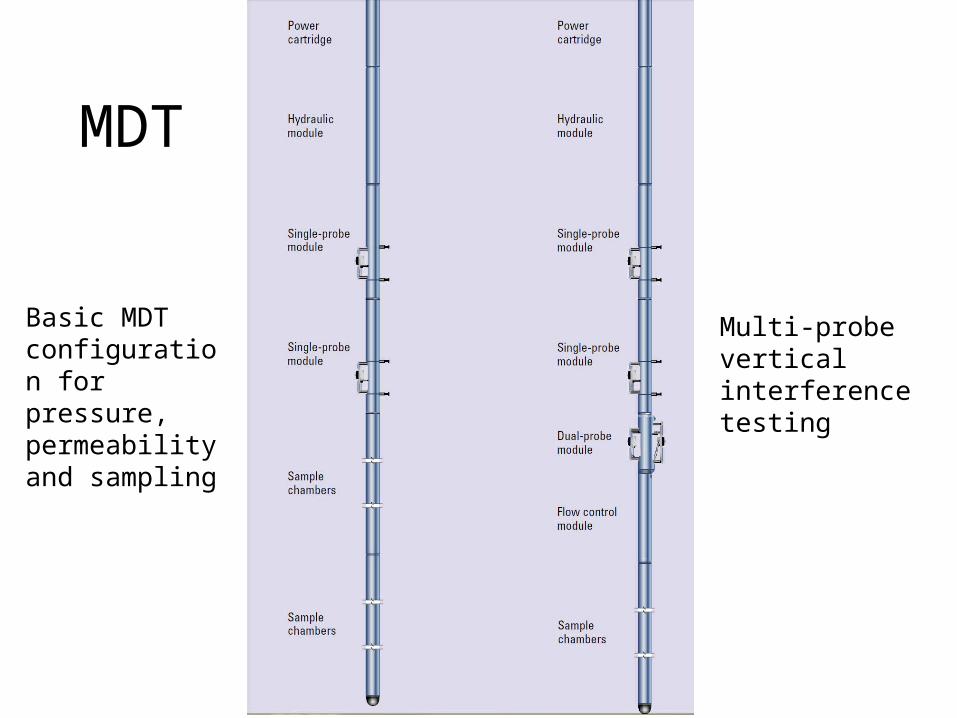
MDT
Basic MDT configuration for pressure, permeability and sampling
Multi-probe vertical interference testing
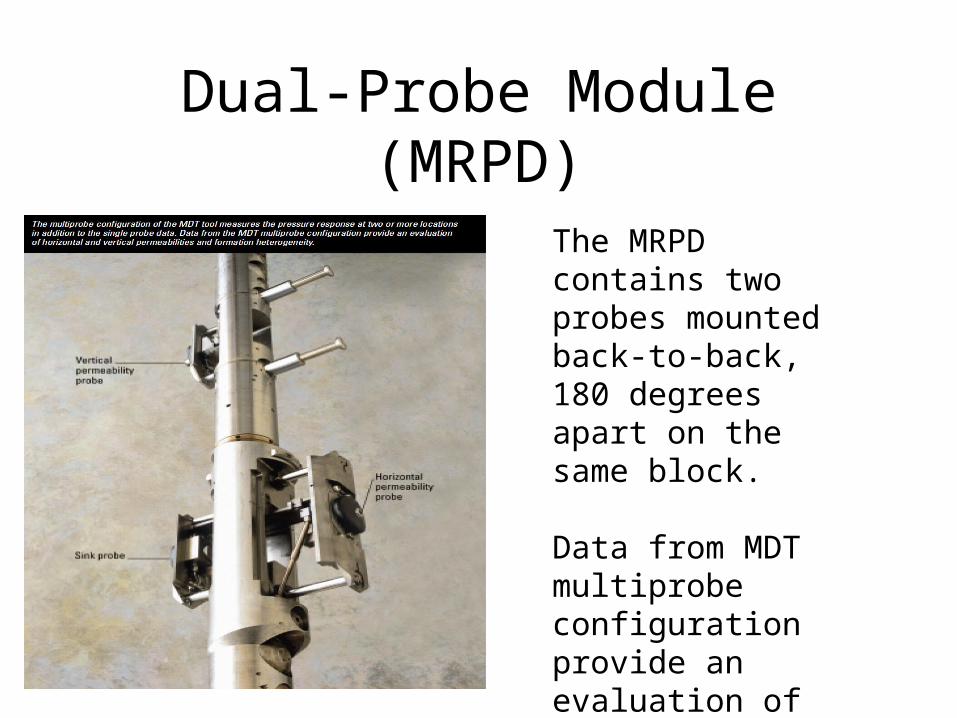
Dual-Probe Module (MRPD)
The MRPD contains two probes mounted back-to-back, 180 degrees apart on the same block.
Data from MDT multiprobe configuration provide an evaluation of horizontal and vertical permeabilities and formation heterogeneity
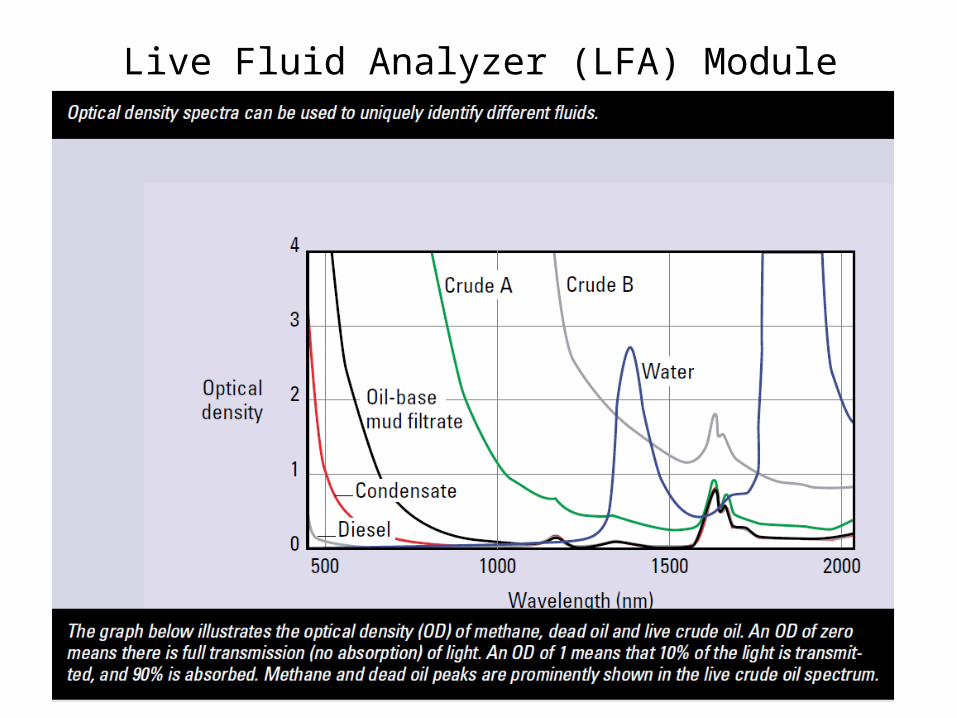
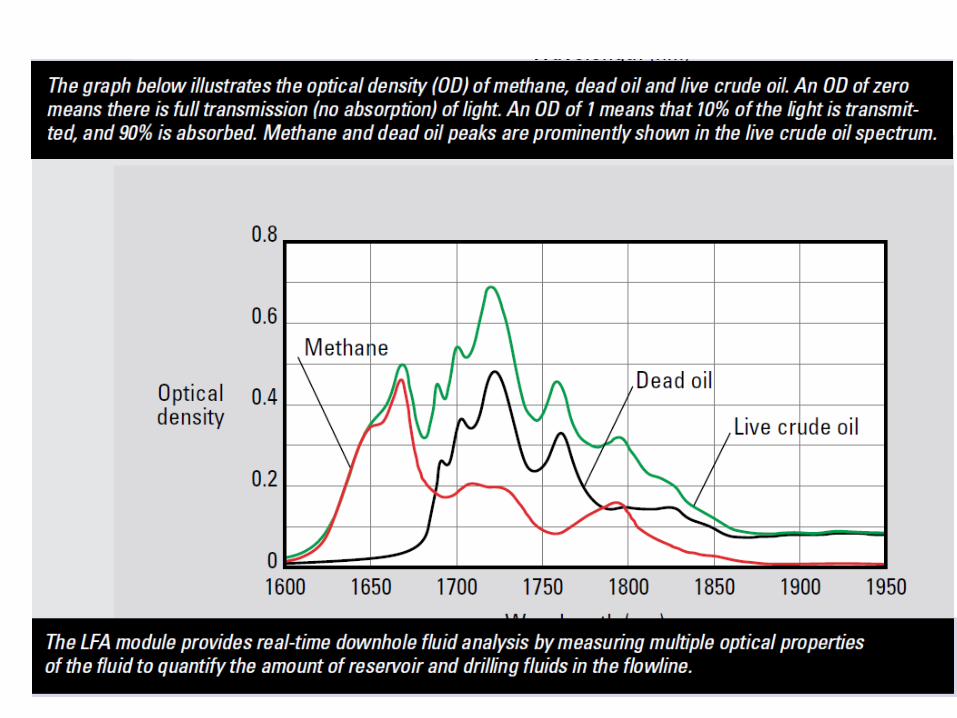
Live Fluid Analyzer (LFA) Module
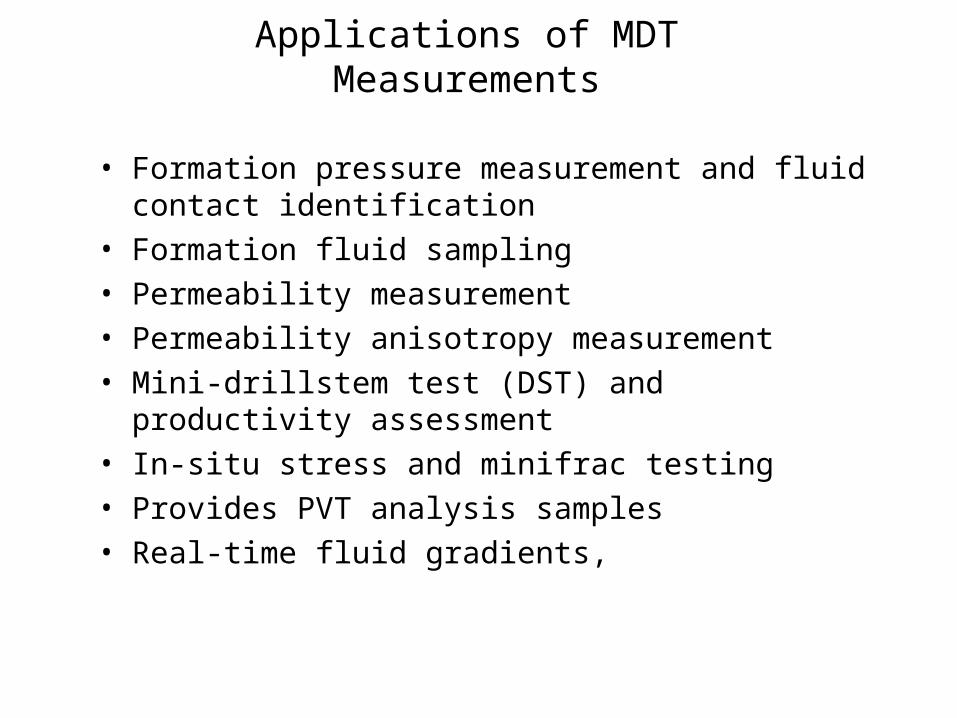
Applications of MDT Measurements
• Formation pressure measurement and fluid contact identification
• Formation fluid sampling
• Permeability measurement
• Permeability anisotropy measurement
• Mini-drillstem test (DST) and productivity assessment
• In-situ stress and minifrac testing
• Provides PVT analysis samples
• Real-time fluid gradients,
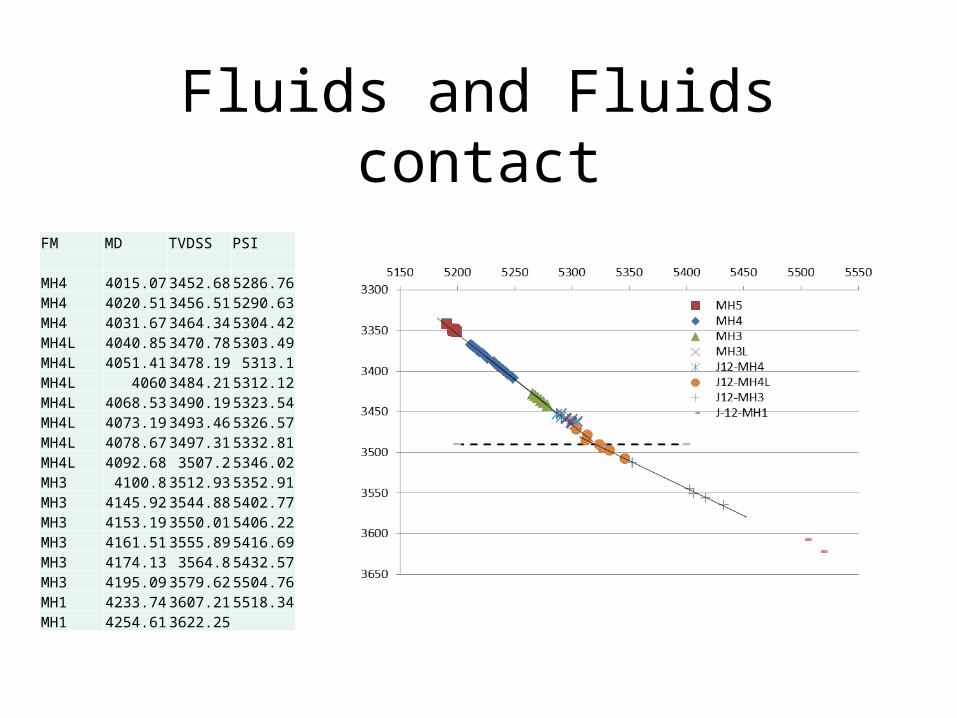
Fluids and Fluids contact
FM MD TVDSS PSI
MH4 4015.07 3452.68 5286.76MH4 4020.51 3456.51 5290.63MH4 4031.67 3464.34 5304.42MH4L 4040.85 3470.78 5303.49MH4L 4051.41 3478.19 5313.1MH4L 4060 3484.21 5312.12MH4L 4068.53 3490.19 5323.54MH4L 4073.19 3493.46 5326.57MH4L 4078.67 3497.31 5332.81MH4L 4092.68 3507.2 5346.02MH3 4100.8 3512.93 5352.91MH3 4145.92 3544.88 5402.77MH3 4153.19 3550.01 5406.22MH3 4161.51 3555.89 5416.69MH3 4174.13 3564.8 5432.57MH3 4195.09 3579.62 5504.76MH1 4233.74 3607.21 5518.34MH1 4254.61 3622.25
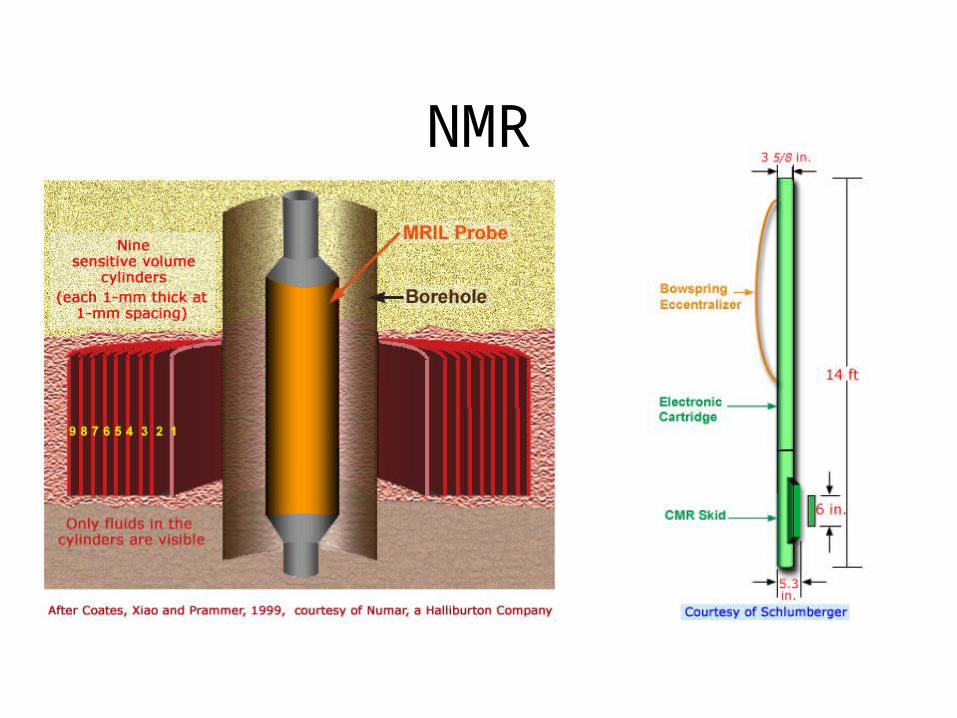
NMR
NMR FundamentalsNuclear Magnetic Resonance refers to the way nuclei respond to a magnetic field.
Many nuclei have magnetic moment – they behave like spinning bar magnets.
The spinning bar magnet can interact with externally applied magnetic fields producing measureable signals.
Hydrogen has a relatively large magnetic moment compared to other elements
Since hydrogen makes up significant component of both water and hydrocarbons in the pore spaces of rocks, the magnetic moment of hydrogen can provide useful information about the pore space and the fluid in the pore space
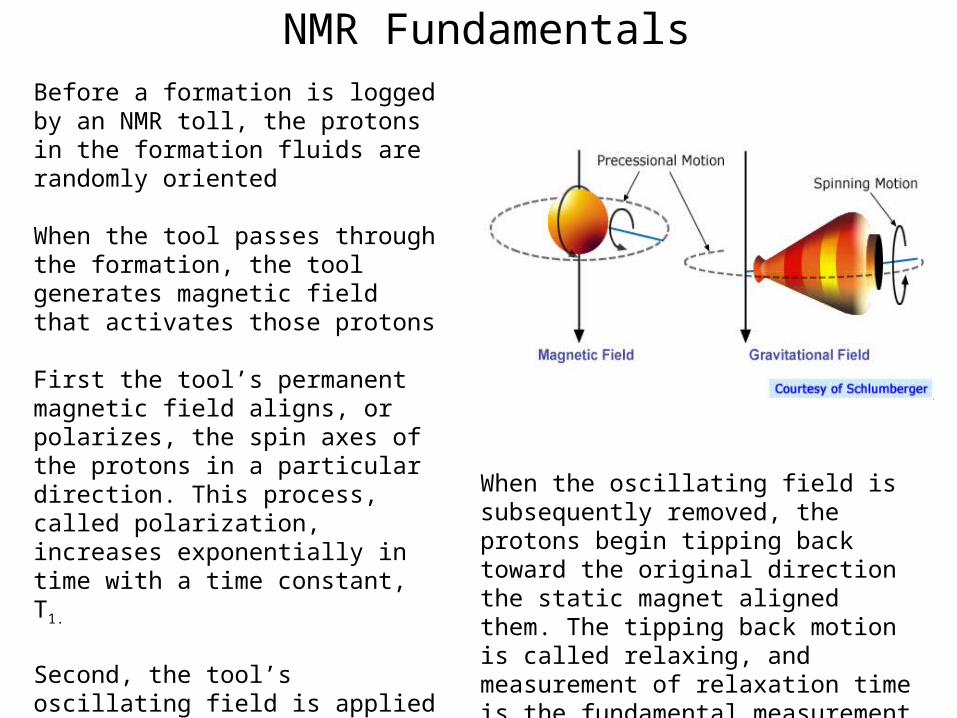
NMR FundamentalsBefore a formation is logged by an NMR toll, the protons in the formation fluids are randomly oriented
When the tool passes through the formation, the tool generates magnetic field that activates those protons
First the tool’s permanent magnetic field aligns, or polarizes, the spin axes of the protons in a particular direction. This process, called polarization, increases exponentially in time with a time constant, T1.
Second, the tool’s oscillating field is applied to tip these protons away from their new equilibrium position. Precession occurs as a body rotating about one axis slowly rotates around second axis
When the oscillating field is subsequently removed, the protons begin tipping back toward the original direction the static magnet aligned them. The tipping back motion is called relaxing, and measurement of relaxation time is the fundamental measurement of NMR logging tools
NMR
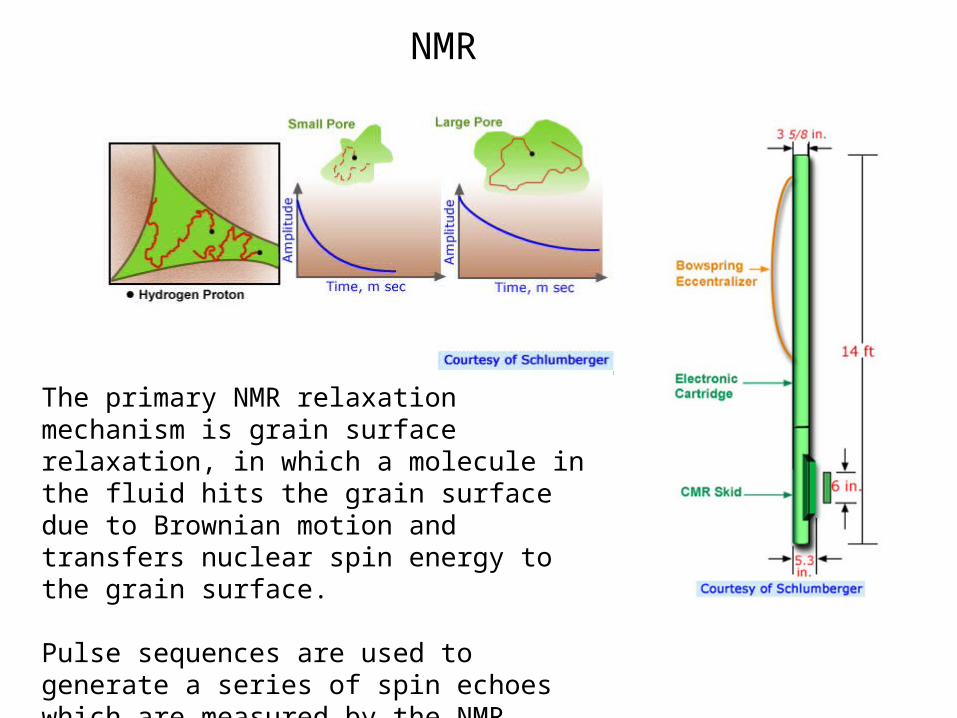
The primary NMR relaxation mechanism is grain surface relaxation, in which a molecule in the fluid hits the grain surface due to Brownian motion and transfers nuclear spin energy to the grain surface.
Pulse sequences are used to generate a series of spin echoes which are measured by the NMR logging tool. Spin-echo trains constitute the raw NMR Data
Amplitude of Spin Echoes Vs Time
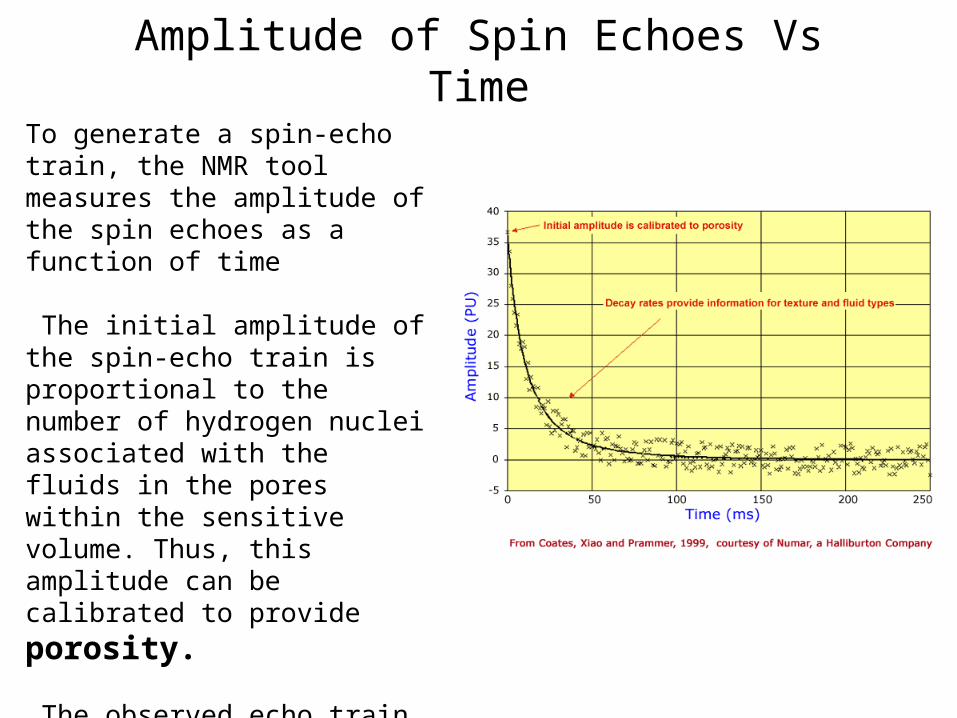
To generate a spin-echo train, the NMR tool measures the amplitude of the spin echoes as a function of time
The initial amplitude of the spin-echo train is proportional to the number of hydrogen nuclei associated with the fluids in the pores within the sensitive volume. Thus, this amplitude can be calibrated to
provide porosity.
The observed echo train can be linked both to data-acquisition parameters and to properties of the pore fluids located in the measurement volumes.
Pore Fluid Effects
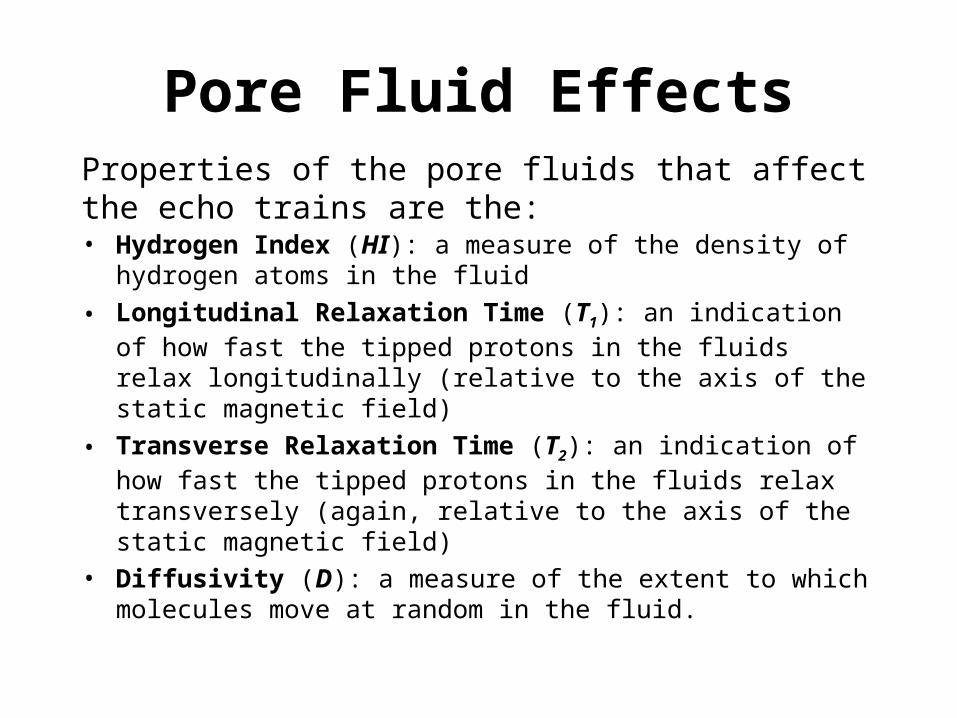
• Hydrogen Index (HI): a measure of the density of hydrogen atoms in the fluid
• Longitudinal Relaxation Time (T1): an indication of how fast the tipped protons in the fluids relax longitudinally (relative to the axis of the static magnetic field)
• Transverse Relaxation Time (T2): an indication of how fast the tipped protons in the fluids relax transversely (again, relative to the axis of the static magnetic field)
• Diffusivity (D): a measure of the extent to which molecules move at random in the fluid.
Properties of the pore fluids that affect the echo trains are the:
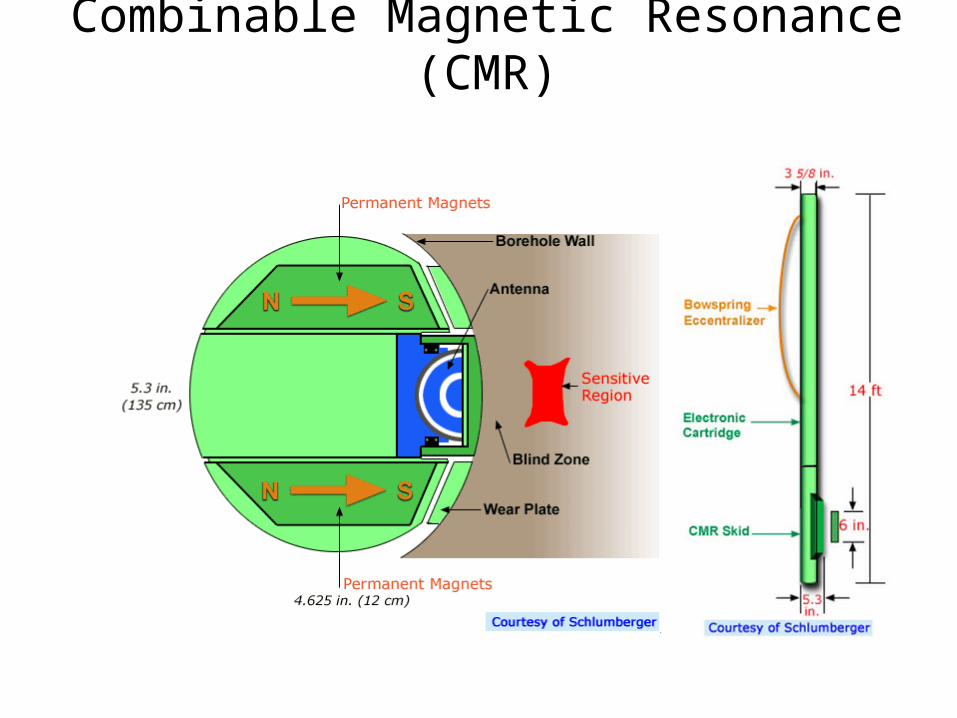
Combinable Magnetic Resonance (CMR)
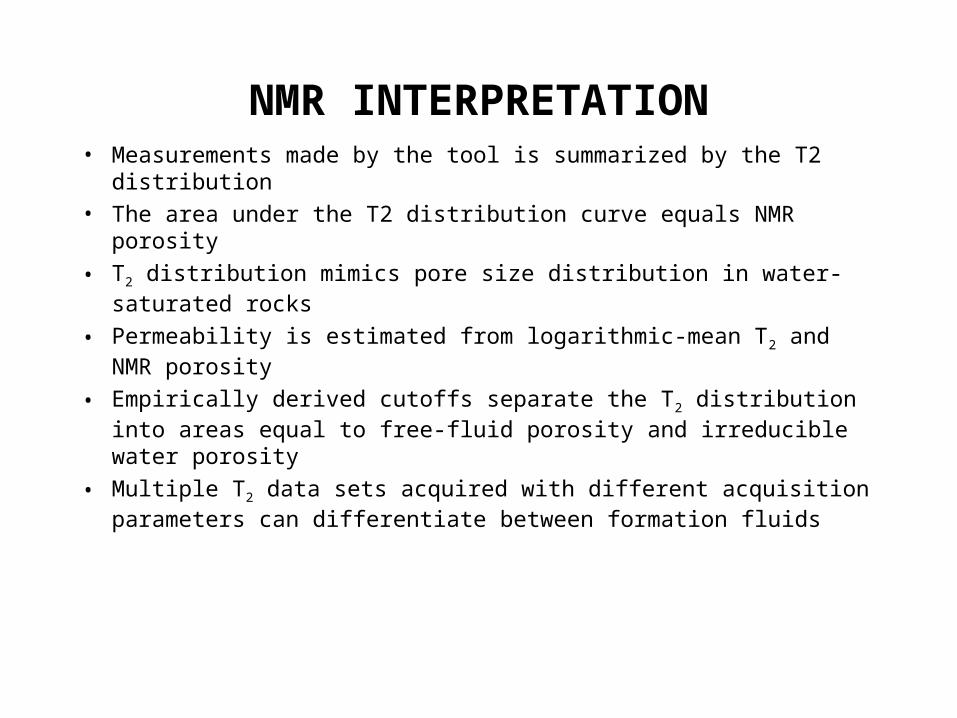
NMR INTERPRETATION• Measurements made by the tool is summarized by the T2 distribution
• The area under the T2 distribution curve equals NMR porosity
• T2 distribution mimics pore size distribution in water-saturated rocks
• Permeability is estimated from logarithmic-mean T2 and NMR porosity
• Empirically derived cutoffs separate the T2 distribution into areas equal to free-fluid porosity and irreducible water porosity
• Multiple T2 data sets acquired with different acquisition parameters can differentiate between formation fluids
NMR T2 Distribution
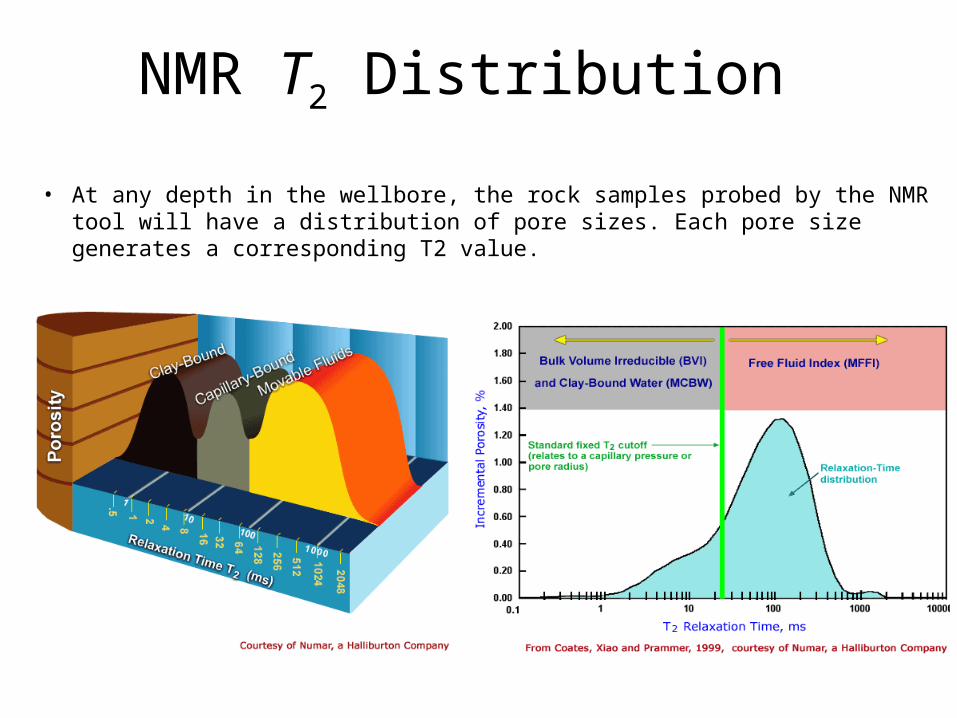
• At any depth in the wellbore, the rock samples probed by the NMR tool will have a distribution of pore sizes. Each pore size generates a corresponding T2 value.

Fluid Identification• The locations of signals from different types of fluids in the T2 distribution
can often be predicted or, if measured data are available, identified.