Embed Size (px)
Citation preview
Darvas Box Trading
How Nicolas Darvas made $2,000,000.00
Frank Watkins

1
The Nicolas Darvas story is unique for many reasons. It is a true story, well documented and authenticated at the time of his interview with Time Magazine. Darvas did not have inside information or work within the financial industry, nor was he some sort of financial whiz kid; in fact, he was one half of the world’s highest paid ballroom dancing team.
The difference is that Darvas was always working on the ultimate trading plan, incorporating risk management rules that would finally lead him to amass a small fortune within a few years.
2
Table of Contents
TABLE OF CONTENTS................................................................................................2
TABLE OF FIGURES.....................................................................................................3
BACKGROUND.............................................................................................................4 THE DARVAS STORY: A SYNOPSIS.........................................................................5 Darvas the Gambler....................................................................................5 No pets Rex....................................................................................................5 Darvas the Fundamentalist......................................................................6 His First Crisis................................................................................................8 Darvas the Technician................................................................................9 The World Tour...........................................................................................11 Broking Terminology...............................................................................11 The theory starts to work.......................................................................12 The Second Crisis......................................................................................12 Making Two Million Dollars...................................................................13 “REDISCOVERING” DARVAS..................................................................................14 Will Trading Darvas Style Work for You?............................................14 DARVAS IN PRACTICE ............................................................................................16 Your First Darvas Scan.............................................................................16 Darvas Box Construction........................................................................17 Choosing Your Stocks ..............................................................................18 Do Your Homework..................................................................................19 Calculating the Breakeven Level.........................................................19 Optimising the Breakeven Level.........................................................19 Analysing the Trade..................................................................................20 Placing Your Order....................................................................................21 Managing Your Trade...............................................................................21 Pyramiding the Position.........................................................................23 Will it Work in Today’s Market?.............................................................24
3
Table of Figures
Figure 1 Darvas’ Pyramiding Boxes...................................................................10
Figure 2 Selecting the Darvas Scan..................................................................16
Figure 3 Darvas Scanner Dialogue Box............................................................16 Figure 4 Anatomy of a Darvas Box....................................................................17 Figure 5 Darvas Box Sequence #1.....................................................................18 Figure 6 Darvas Box Sequence #2.....................................................................22 Figure 7 Darvas Box Sequence #3.....................................................................23 Figure 8 Darvas Box Sequence #4.....................................................................24

4
Background
The Darvas story is unique in that there is no mystery as to how he made his fortune. Unlike other theories put forward by so-called market gurus there is no need to spend years attempting to unravel some mystical form of analysis. You can trade like Darvas today! Simple, practical and logical is the best way to describe “The Darvas Box Theory”.
Darvas’ story and his trading technique were described in his first book. His method, like all good systems is simple and founded in logic. All that is required is the discipline to follow it. Darvas’ discipline was remarkable. This coupled with his ability to analyse himself as well as the market was the root of his trading success. Through his self-analysis he came to realize that “his ears were his worst enemy”.
He amassed his fortune without the help of computers, mobile phones, fax machines or any of the communications technology we have at our disposal today. He only had access to end-of-day data. All of his trading decisions were made outside trading hours, not sitting watching a live data screen all day. Starting with a purchase of only $3000 worth of stock, Darvas amassed a fortune of over $2.2 million dollars. This was in 1959 and would be equivalent to over $20 million dollars today.
A truly remarkable aspect of the Nicolas Darvas story is that he was travelling extensively on a world tour when he developed his trading plan. He was isolated from all external influences such as telephone, newspapers, brokers and other sources of so-called useful information.
Let’s look at how Darvas succeeded.

5
The Darvas Story: A SynopsisDarvas the Gambler
Darvas did not set out to be a gambler; in fact he took his investing very seriously. “Darvas the gambler” is Darvas’ own description of himself once he realized that his approach to investing was no better than gambling. His story begins in November 1952 in Canada when he and his partner were asked to appear in a Canadian nightclub. Rather than pay in the normal fashion, Darvas was offered 6000 shares in a company named Brilund, a stock that was quoted at 50 cents at the time.
Despite not being able to keep to the arrangement, Darvas bought the stock anyway and paid $3000. Thinking no more about the shares, Darvas was idly skimming the financial press some 2 months later and saw Brilund quoted at $1.92. I believe that Darvas was “hooked” from that moment on. An $8000 profit in two months would make most people salivate.
Working in nightclubs led Darvas to meet various wealthy people whom he asked for advice.
“So I asked them, do you know a good stock? Oddly enough, everybody did seem to know one. It was surprising. Apparently I was the only man in America who did not have his own first hand stock market information. I listened eagerly to what they had to say and religiously followed their
tips. What ever I was told to buy, I bought. It took me a long time to discover that this is one method that never works.”
Darvas sought the services of a broker and spent the next year happily buying and selling stocks. In his words he “…jumped in and out of the market like a grasshopper.”
No pets Rex
This is not a reference to dogs and cats, rather a very strong warning for all traders. Darvas developed a special liking for some stocks, some because they were given to him and others because

6
he started making money with them. They became “pets”, and he sang their praises but this mentality lasted until he realized that the pet stocks were causing the biggest losses. As with most people who have traded, Darvas found that he was taking small profits and holding onto large losses.
While Darvas was excited by the whole industry, delighted with each small win and overlooking his losses, he was not generally trading profitably.
“It was a period of wild foolish gambling with no effort to find the reasons for my operations. I followed hunches. I went by god-sent names, rumours of uranium finds, oil strikes, anything anyone told me. When there were constant losses an occasional small gain would give me hope, like the carrot before the donkey’s nose.”
By the end of 1953, the original stake of $3,000, plus the $8,000 profit from Brilund, had been whittled down to $5,800. Disillusioned but undaunted Darvas decided to give up the Canadian market. He moved to the greener pastures of New York and the allure of Wall Street.
Darvas the Fundamentalist
Darvas severed all ties with the Canadian market and decided to start afresh. He topped up his account to a nice round $10,000. After doing his homework Darvas finally decided to dip his toes into the Wall Street market and start trading. His first step was an obvious one and something that no doubt most people have tried without much success.
He rang his new broker and:
“Trying to be the old financial hand, simply asked what was good. I realize now this enquiry was more suitable for a butcher but the broker was up to it. He suggested several safe stocks.”
A few of those stocks began to rise immediately and Darvas was sure that he was on the right track with his new broker. Darvas felt that the broker’s advice was no longer in the “hot tip” category but

7
was valid news based on sound logic and current economic events. Darvas continued to trade constantly. Unfortunately his early success was due primarily to a bull market rather than any wonderful broker research or other insight into the market. It would have been difficult not to choose the odd stock that was rising.
Buoyed by his apparent success Darvas began to study books on market terminology and how to trade successfully. He subscribed to as many newsletters and tip sheets as he could find. He became a voracious reader of all things financial. Slowly he began to question the validity of these newsletters. They often contradicted each other; a buy in one tip sheet or newsletter was a sell in another.
Compounding his problems Darvas began to realize that brokerage became a major part of each transaction as he jumped in and out of stocks. This led to the realization that many of the old market adages were of no relevance, like “you cannot go broke taking a profit.” Of course you can, if your profits are smaller than your losses. Another is “buy cheap, sell dear.” This seemed like sound logic to Darvas so off he went to buy “cheap” stocks, or stocks that were a bargain and undervalued. Darvas found that these stocks “stuck to his fingers like tar.”
Through all these experiences Darvas began to reach certain conclusions. Unlike most potential traders he learned from each series of mistakes. Darvas began to outline some rules that would ultimately be part of the overall plan that led to his great success.
1. I should not follow advisory services. They are not infallible, either in Canada or on Wall Street.
2. I should be cautious with broker’s advice. They can be wrong.
3. I should ignore Wall Street sayings, no matter how ancient and revered.
4. I should not trade over-the-counter – only in listed stocks where there is always a buyer when I want to sell.
8
5. I should not listen to rumours, no matter how well founded they may appear.
6. The fundamental approach worked better for me than gambling. I should study it. (How I Made $2,000,000 In the Market, p.34)
For months Darvas studied company fundamental information, sifting through dividends, net tangible assets, market capitalization, assets, liabilities and price-earnings ratios. He developed a “wish list” of what he wanted a company to have. Stocks that the experts liked, stocks with a strong cash position but selling below book value and companies who had never cut their dividend.
His First Crisis
After an enormous amount of research Darvas decided the steel industry would be the one to make him rich. Playing it safe he decided to buy a stock in the steel sector and paying a good dividend. Further research led Darvas to the purchase of 1000 Jones and Laughlin shares because:
1. It belonged to a strong industry group.
2. It paid almost 6% dividend.
3. Its price-earning ratio was better than any other stock in that group.
Darvas had such faith in his analysis that he mortgaged a block of land, borrowed against an insurance policy and bought on a 70% margin. His cost was $52,652.30 (1000 shares at $52 ¼.) This purchase was made on 23rd September 1955.
On 26th September 1955 this fool proof theory began to unravel as Jones and Laughlin started to drop. Like most traders he was stunned, paralysed like a rabbit caught in a spotlight. What to do?

9
Based on all the best work Darvas could come up with, J&L was “worth $75.00”.
Most traders and brokers decide to hang on when a crisis hits. Darvas was no different. He employed the BHP method (Buy, Hold and Pray). As prices continued to slide he was almost too scared to check the latest quote.
Finally Darvas decided to sell, his loss was over $9,000. At least at this point Darvas was different from most traders I have seen. He did take a loss but, most importantly, he preserved some of his capital. Many traders wait five or ten years for some sort of recovery. More often than not, they wait until the company enters bankruptcy.
Gambling, tips, research, investigation, whatever Darvas tried did not work. He became desperate. Three years had gone by.
Eventually, Darvas noticed a stock - Texas Gulf Producing. He knew nothing about it and had heard no rumours. He simply noticed that the price was rising. Darvas bought Texas Gulf and recouped half the losses from the J&L disaster.
“What, I asked myself, was the value of examining company reports, studying the industry outlook, the rating, the price-earnings ratio? The stock that saved me from disaster was one about which I knew nothing. I picked it for one reason only - it seemed to be rising. Was this the answer…could it be?”
Darvas the Technician
It was time for further reassessment. Darvas admitted that he had tried fundamental analysis without success. However technical analysis had led to profits. He decided to try the successful approach again. He noticed a stock called M&M Woodturning, none of the financial information services could tell him anything and his broker had never heard of it. He remained interested because the price action reminded him of Texas Gulf Producing.
In December 1955 the stock rose from about $15.00 to $23.50. After a five-week lull in activity, the price began to climb again, accompanied by an increase in volume. Darvas bought at $26.60. The

10
price continued its rise and Darvas sold at $33.00. Again, he knew nothing of the stock other than the price was rising. Following his sale of M&M Woodturning Darvas found a newspaper report that a takeover was being secretly negotiated.
This was a major breakthrough. Darvas was ecstatic, feeling like an insider without being one. This experience convinced Darvas that a purely technical approach was logical. Studying price action and volume could get positive results.
Darvas began buying stocks solely on the basis of an increase in volume and price. Sometimes this was successful and sometimes not. He found that on occasions he would buy a stock only to see it immediately begin to fall, and as soon as he sold, prices would advance. Sounds familiar doesn’t it? As Darvas continued to study books and charts, he realized that price movement was not random, in fact once stocks had a defined upward or downward trend, that trend tended to continue for some time.
Within those trends, stocks moved in a series of patterns or what Darvas called “boxes”. This was the beginning of the “Darvas Box Theory” which was to lead him to millions of dollars.
“This is how I applied my theory: When the boxes of a stock in which I was interested stood like a pyramid, on top of each other, and my stock was in the highest box, I started to watch it. It could bounce between the top and bottom of the box and I was perfectly satisfied. Once I had decided on the dimensions of the box, the stock could do what ever it liked but only within that frame. In fact if it did not bounce up and down I was worried. No bouncing, no movement meant it was not a lively stock”.
36
34
37
35
41
39
4342
Figure 1: Darvas’ Pyramiding Boxes

11
Darvas bought his shares when prices broke out of the top of the box. While this method greatly improved his entry levels, this system still did not lead to each trade being correct and profitable. At this point Darvas realized that there was no sure thing in the market. He also realized that he could not take chances, he would need to reduce risks as far as possible. With this in mind Darvas decided to employ an automatic stop loss system.
Further reflection led Darvas to re-define his objectives.
• Rightstocks
• Righttime
• Smalllosses
• Bigprofits
His best weapons were:
• Priceandvolume
• Boxtheory
• Automaticbuyorder
• Automaticstop-losssellorder.
The World Tour
At this stage Darvas faced a new dilemma, he signed a two-year contract for a world dancing tour. How could he continue to trade? Through discussions with his broker, Darvas agreed on one tool. The broker would airmail the weekly Barron’s financial publication to Darvas. From this Darvas could study prices and follow any rising stocks. Each day the broker would send a cable to Darvas with the open, high, low and close of stocks that Darvas was interested in.
Darvas felt this was like playing poker but he could not hear the betting, he could not see what was going on. However he did hold the
12
cards.
Broking Terminology
Automatic buy order:
The way in which an automatic buy order works is quite simple. In Darvas’ case his entry needed to be at a level when prices burst upwards through the top of a period of consolidation, or the top of the Darvas box. If the top of a box was $35.00, Darvas would give his broker an instruction to buy the stock any time in the future that the stock traded at say $35.25 cents. This order may have been transacted weeks later, if at all. If the price did not continue to advance the purchase was not made. This method ensured that at least at the time of entry, prices were rising.
Automatic stop-loss sell order:
At the time of entering a stock, Darvas would place an order to sell if prices traded below a certain level. The advantages of this strategy are enormous; it means that all risk is defined prior to purchasing any stock.
The theory starts to work
In November 1957 while touring in Saigon, Darvas noticed a stock called Lorillard. There was a bear market at the time but this stock was rising. The stock had risen from $17.00 in the first week of October then consolidated between $24 and $27. Volume had increased from around 10,000 per week to 126,000. Darvas made a series of trades in the stock, finally selling them at $57.50 for a profit of $21,052.95.
This was clearly the turning point for Darvas. Using the same theory he made his first “big kill” on a stock called E.L. Bruce, a profit of over $295,000.
In January 1959 Darvas returned to New York with profits totalling more than $500,000.

13
The Second Crisis
Darvas was back in the thick of things, wined and dined by brokers who were amazed at his success, reading everything and listening to hot tips all over again. In the space of a month he lost $100,000 and was devastated by this huge setback. Darvas took a short break in Paris to re-group. Once again the human factor had taken over, logic went out the window and emotions ran high. Emotions and ego need to be strictly controlled in order to achieve success in trading.
Making Two Million Dollars
In late February 1959, fresh from a trip to Paris, he returned to New York and made a determined effort to re-use the method that had worked so well. He locked himself away, asked his brokers to send him telegrams as they had in the past. The rest as they say, is history. By July 1959 Nicolas Darvas had amassed over two million dollars.
Ultimately the story of Darvas success leaked out, he was interviewed by Time Magazine and convinced to write a book that went on to sell over 200,000 copies in eight weeks. I would strongly recommend Darvas’ book “How I Made $2,000,000 In The Stock Market” to anyone trading stocks.

14
“Rediscovering” Darvas
For many years I have tried to teach novice traders about planning and managing their trades in a disciplined fashion. I consider discipline and timing to be the essence of successful trading; enter and exit at the right time and always have a plan. My plan always includes an entry and exit strategy and a cardinal rule to never, ever, trade without a stop-loss. My own personal trading mantra is simple “Only own rising stocks.” Over the years I’ve seen people buy stocks that are clearly in a downward price trend. The reason given for this strategy is usually that they are trying to buy when the stock is cheap to maximize the return when the stock price starts to rise. This is one sure way to lose your trading capital. This method just does not work.
A problem with novice traders has always been maintaining the discipline needed to trade successfully. How could I ensure that my students would trade with a comprehensive plan? To help with this problem, the software package I designed incorporates a “Combo” scan that will find me rising stocks that exhibit certain volume, and price characteristics. My scan solved the entry problem, making it easy to find the right stocks. However, the exit timing and stop-loss setting still proved problematic. A Pro Trader member brought Nicolas Darvas’ technique to my attention and I quickly realized that this was a solution to the problem. To my amazement, Darvas’ entry criteria for his boxes fitted my “Combo” scan so closely that our software developers used it as the entry criteria for a “Darvas Box” scan that I quickly commissioned.
Will Trading Darvas Style Work for You?
My Darvas software was designed to drastically reduce any costly learning experiences. Most people lose thousands of dollars in their early attempts to find financial freedom through the stock market. What is potentially worse than losing thousands of dollars is the wasted time. Darvas served a five-year apprenticeship with no teacher. Traders today have the benefit of computers and software and can be trading successfully in a matter of days.
You need an understanding of why you need a plan. A major obstacle to successful trading is the trader’s emotions. Listening to
15
hot tips, blindly following brokers, tipster’s letters and allowing greed to affect a trading decision is the downfall of most new entrants to the market.
Apart from the obvious profits, a trading plan will remove emotion. A good plan:
• Willbringdiscipline to your trading.
• Willhelpyoumanage risk. Having a system makes you define the risk on each trade. If you don’t define the risk then how can you control it?
• Willbringyouconsistency.
• Shouldlimit your losses and let your profits run.
• Shouldallowyoutoparticipate in major moves and trends.
Nicolas Darvas’ trading technique fulfils these criteria.

16
Darvas in Practice
Your First Darvas Scan
Scanning for Darvas boxes is simple. Select “Scan for Darvas Boxes” from the Scanning menu.
Figure 2 : Selecting the Darvas Scan
You will be presented with the Darvas scan dialogue box. Clicking “Scan” will start the scanner and in a a few seconds the results are available in the “Search Results” box.
Figure 3: Darvas Scanner Dialogue Box

17
Darvas Box Construction
Figure 4: Anatomy of a Darvas Box
A Darvas Box represents a graphical trading plan. Our buy order is placed on a break of the box top with our initial stop-loss set at the price at the box bottom. The height of the box represents our risk level per share (excluding brokerage).
Let me clear up some points of confusion about Darvas boxes. I must admit that when I first read his book, I assumed that Darvas was looking for 3 points of resistance, and then for some support level. This interpretation is incorrect. The sequence for correct Darvas Box construction is as follows:
1. There must be some volume activity in the stock, i.e. a volume spike of a specified level before the first box forms.
2. The stock must be in an upward trend on entering the first box.
3. The top of the box is found when a price is reached that is an x-day high price (e.g. 200-day high) and then this price is not touched or exceeded for a specified number of days (Darvas usually used 3 days). This point is important. Darvas was not looking for 3 days of resistance, he was looking for a confirmed top of the trading range.
Box top
Box bottom
Risk level

18
4. After a box top is confirmed, the bottom is found in the same manner but in reverse. i.e., once a low has formed and not been exceeded for 3 days, this becomes the bottom of the box.
5. When the top and bottom are confirmed we have a box. Now we may calculate an initial stop-loss level based on the price at the bottom of the box.
Another source of confusion regarding box construction is where the top and the bottom of the box form on the same day. This is actually referred to in Darvas’ book. It’s in the section at the back taking the form of a Q and A session. This, in my opinion, is the part of the book containing the most relevant information on box construction (the main text of the book is a bit vague on this). It is valid for the top and bottom to form on the same day. Darvas considered this to be quite rare, but our analysis shows that on the contrary it’s quite common. In Darvas’ defence, he didn’t have the luxury of scanning software.
Choosing Your Stocks
Something to consider when trading using Darvas boxes is your choice of stocks. Darvas did not trade cheap stocks, his adage was “buy dear, sell dearer”. He was trading stocks priced at over $30 per share in the 1950s; he was not interested in cheap, speculative stocks.
Another characteristic of Darvas’ trading was his attention to the price movement behaviour of stocks; this was how he came to develop the box theory. His research led him to look for stocks with a specific signature to their price movement patterns. His preference was for stocks that made strong definite movements through the box top. Stocks making new price highs incorporating some slight retracements, possibly leading to the creation of a new box. The following figure is an example of such a stock pattern.

19
Figure 5: Darvas Box Sequence #1
Darvas’ preference was for stocks in what were then newly emerging hi-tech industries such as Hewlett-Packard, or for companies with innovative product development such as filter tipped cigarettes. Remember, this was the mid-1950s!
Do Your Homework
Darvas’ box technique gives us a ready-made trading plan. However, this is only part of the planning process. There are other factors to consider before we enter the trade. Many trades are unsuccessful for the reason that no thought is given to the simple task of calculating a breakeven level for the trade. The breakeven level is the price that must be reached by the stock so that a stop-loss placed at this level will result in a no loss trade. Any price achieved beyond this point must result in a profit for this trade if we exit at this price.
20
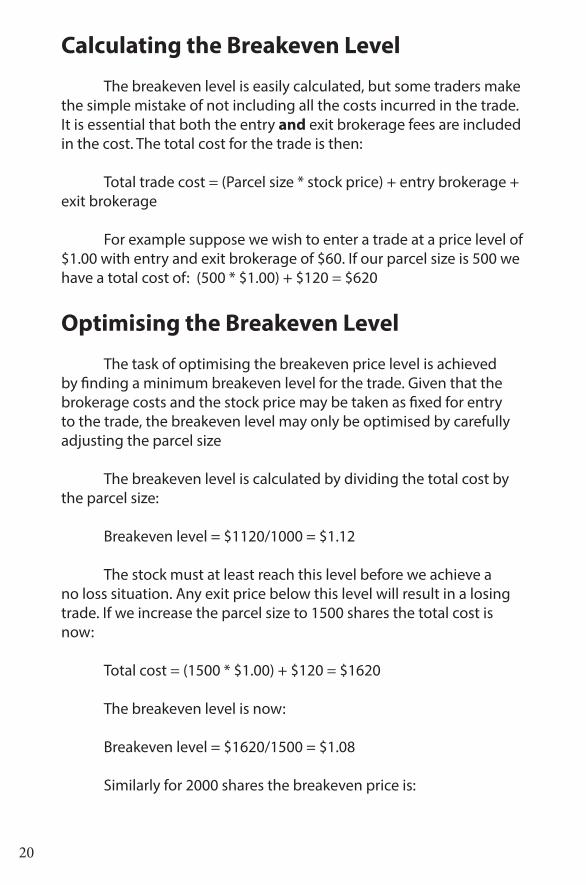
Calculating the Breakeven Level
The breakeven level is easily calculated, but some traders make the simple mistake of not including all the costs incurred in the trade. It is essential that both the entry and exit brokerage fees are included in the cost. The total cost for the trade is then:
Total trade cost = (Parcel size * stock price) + entry brokerage + exit brokerage
For example suppose we wish to enter a trade at a price level of $1.00 with entry and exit brokerage of $60. If our parcel size is 500 we have a total cost of: (500 * $1.00) + $120 = $620
Optimising the Breakeven Level
The task of optimising the breakeven price level is achieved by finding a minimum breakeven level for the trade. Given that the brokerage costs and the stock price may be taken as fixed for entry to the trade, the breakeven level may only be optimised by carefully adjusting the parcel size
The breakeven level is calculated by dividing the total cost by the parcel size:
Breakeven level = $1120/1000 = $1.12
The stock must at least reach this level before we achieve a no loss situation. Any exit price below this level will result in a losing trade. If we increase the parcel size to 1500 shares the total cost is now:
Total cost = (1500 * $1.00) + $120 = $1620
The breakeven level is now:
Breakeven level = $1620/1500 = $1.08
Similarly for 2000 shares the breakeven price is:
21
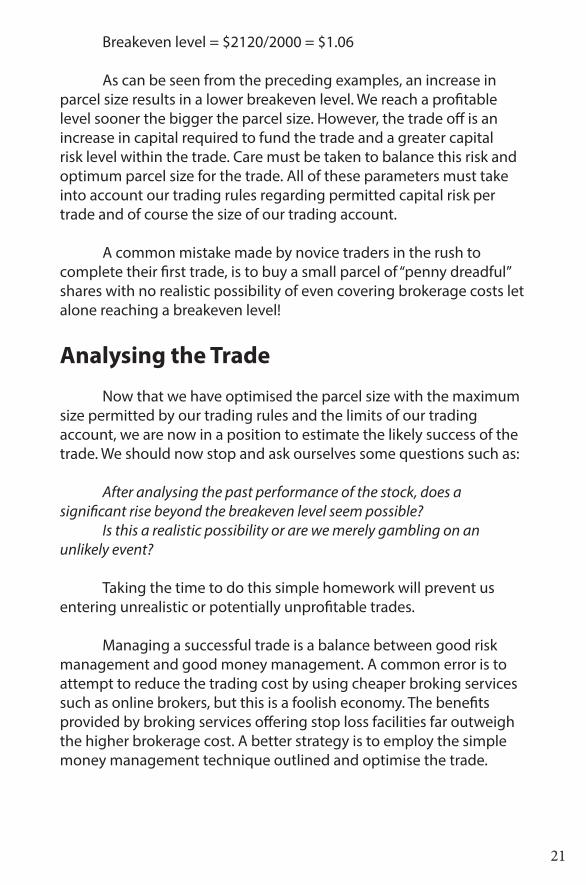
Breakeven level = $2120/2000 = $1.06
As can be seen from the preceding examples, an increase in parcel size results in a lower breakeven level. We reach a profitable level sooner the bigger the parcel size. However, the trade off is an increase in capital required to fund the trade and a greater capital risk level within the trade. Care must be taken to balance this risk and optimum parcel size for the trade. All of these parameters must take into account our trading rules regarding permitted capital risk per trade and of course the size of our trading account.
A common mistake made by novice traders in the rush to complete their first trade, is to buy a small parcel of “penny dreadful” shares with no realistic possibility of even covering brokerage costs let alone reaching a breakeven level!
Analysing the Trade
Now that we have optimised the parcel size with the maximum size permitted by our trading rules and the limits of our trading account, we are now in a position to estimate the likely success of the trade. We should now stop and ask ourselves some questions such as:
After analysing the past performance of the stock, does a significant rise beyond the breakeven level seem possible?
Is this a realistic possibility or are we merely gambling on an unlikely event?
Taking the time to do this simple homework will prevent us entering unrealistic or potentially unprofitable trades.
Managing a successful trade is a balance between good risk management and good money management. A common error is to attempt to reduce the trading cost by using cheaper broking services such as online brokers, but this is a foolish economy. The benefits provided by broking services offering stop loss facilities far outweigh the higher brokerage cost. A better strategy is to employ the simple money management technique outlined and optimise the trade.

22
Placing Your Order
Once you have found a stock that has formed a Darvas box and your breakeven analysis deems it a viable trade, what next? The Darvas box provides you with a graphical trading plan, an entry level, an exit level, and a risk level. Your first actions should be to place an order to purchase the stock once the stock trades at a price just above the price at the box top and at the same time place an initial stop-loss to exit the trade when the stock trades at a price just below the price at the bottom of the box.
Do NOT wait for a break of the box top before placing your order. Buying after the break of a box is folly as you are reacting to the market, not pre-empting it. You will find yourself chasing the stock price and enter at a much higher level than necessary.
Do NOT buy when the stock has not yet penetrated the box top. A comment often made is “If I’m going to buy the stock, why not get it at a cheaper price before it breaks the box top?” The answer is that only the break of the box proves that the stock is a worthwhile trade. Before the break it is only a possible candidate. It could just as easily drop in price; remember we only want stocks that are going up.
Managing Your Trade
A key aspect of Darvas’ trades was his use of a trailing stop-loss to manage his trading risk. Using extremely tight stops, Darvas minimised his capital losses. However, this strategy meant he would “stop out” of more trades. He was willing to accept the possibility of brokerage losses rather than expose an unacceptable level of his trading capital to the market. When trading like Darvas we must accept this risk also.
Let us assume that we are now engaged in a trade. We’ve placed our order and an initial stop-loss. The stock price has broken through the box top and our order is executed. What next? All we can do now is adjust the stop-loss level. This is done with the caveat that we may NEVER lower the stop-loss level, so all we may do is move it up. Where we move it to is the issue and this is determined by the price movement.

23
Figure 6: Darvas Box Sequence #2
If, as in Figure 6, the stock moves weakly out of the box top without making strong, definite gains, a strategy may be to trail our stop up so as to maintain our maximum risk level. If our initial risk level was 10%, we move our stop up so as to maintain this maximum risk level. Remember, this was the risk level that was acceptable when we formed our trading plan, so we should stick to our plan and maintain this maximum risk level. Our aim is to get our stop-loss up to, and hopefully beyond our breakeven point. Once the stop reaches the breakeven point we have a no-lose trade. Always remember that once the price starts to move upwards, if we don’t move our stop-loss up also, we are increasing our risk level. All positive price movement is not just changing numbers, it is your money. If the price rises and you don’t move your stop, you are exposing more and more of your capital to the market.
24
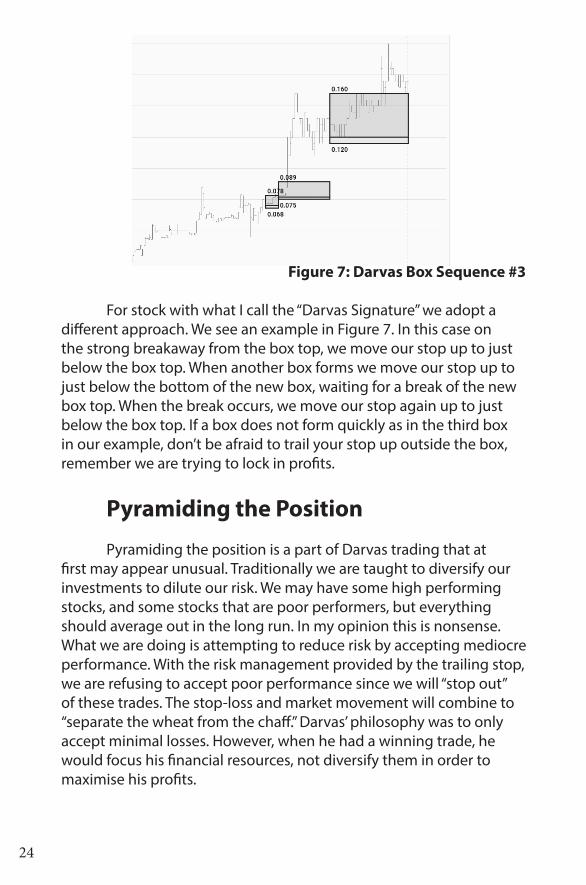
Figure 7: Darvas Box Sequence #3
For stock with what I call the “Darvas Signature” we adopt a different approach. We see an example in Figure 7. In this case on the strong breakaway from the box top, we move our stop up to just below the box top. When another box forms we move our stop up to just below the bottom of the new box, waiting for a break of the new box top. When the break occurs, we move our stop again up to just below the box top. If a box does not form quickly as in the third box in our example, don’t be afraid to trail your stop up outside the box, remember we are trying to lock in profits.
Pyramiding the Position
Pyramiding the position is a part of Darvas trading that at first may appear unusual. Traditionally we are taught to diversify our investments to dilute our risk. We may have some high performing stocks, and some stocks that are poor performers, but everything should average out in the long run. In my opinion this is nonsense. What we are doing is attempting to reduce risk by accepting mediocre performance. With the risk management provided by the trailing stop, we are refusing to accept poor performance since we will “stop out” of these trades. The stop-loss and market movement will combine to “separate the wheat from the chaff.” Darvas’ philosophy was to only accept minimal losses. However, when he had a winning trade, he would focus his financial resources, not diversify them in order to maximise his profits.

25
Figure 8: Darvas Box Sequence #4
In Figure 8 we see our plan would be to buy a break of $2.59 with an initial stop-loss set at $2.45. Upon the break of the first box we would quickly trail our stop-loss up to just below the box top at about $2.58. On the formation of the new box, we trail our stop up to $2.64, and place an order to buy another parcel of this stock on a break of $2.93. If it never breaks the $2.93 level, we never buy the new parcel of shares. If it does it means the stock is making new high prices so we are attempting to concentrate more of our financial resources into a rising stock. A point to remember however is that if we wish to use the pyramiding technique we must do our homework in terms of breakeven analysis for each individual box trade.
Will it Work in Today’s Market?
The first common comment we encounter is
“The market is far more volatile today, Darvas did not have today’s volatility to contend with.”
While there is undoubtedly more volatility in today’s markets, the methods that Darvas used to define his boxes incorporated the volatility of the day, making his method applicable then, now and in the future.
“Darvas was fortunate that he was trading during an era of great change, the space race was on and the computer age was about to begin.”
26
The facts are that there is always a “new” era of change about to dawn on us. Technology is always advancing. We feel that the Internet has a long way to go, as do most forms of communication, but the real advances have yet to come in the area of health, biotechnology, waste disposal and genetically modified food just to name a few possibilities.
“Darvas was lucky, he made most of his money in a bull market.”
As with most people, the harder Darvas worked the “luckier” he got. The bull market was almost incidental. He would have made his fortune anyway. It may have taken him longer if the bull market did not come along. The real issue here is that Darvas kept his fortune at the end of the bull market because his unique trailing stop loss method had him out of stocks when the market duly crashed.
It is my opinion that with modern software packages, that Darvas trading is as valid today as it was over 40 years ago, perhaps even more so. Good risk management and trade planning will always be at the heart of successful trading. As an experienced trader I can’t but marvel at the discipline and self-analysis that made Darvas such an exemplary trader. Since discovering Darvas, my first scan every day is for Darvas boxes. I hope you embrace Darvas’ techniques as I have, I am sure it will be of great benefit in your trading endeavours. Good luck, and good trading!
Frank Watkins

27
Pro Trader successfully incorporated a Darvas scanning function into their software in 2002.
“There is no doubt in my mind that clients who use the Darvas scanner are consistently more profitable than those who don’t. The Darvas system is by far-and-away the best trading method for beginners and the more experienced.”
- Frank Watkins
For more information or to trial the software, go to
www.protrader.com.au
or email Frank at

28
Other Books by Frank Watkins:
Exploding the Myths: What your broker doesn’t know or won’t tell you!
Getting Started in the Share Market
StockPicker:Finding Profitable Trades Fast with ProTrader
The 50 Best Trading Tips of All Time
The 5 Phase Trade:Profit from Trading the Spec Stocks