Embed Size (px)
Citation preview
[Type text]
Dams and Energy
Sectors Interdependency
Study
September 2011
September 2011 Page 2
Abstract
The U.S. Department of Energy (DOE) and the U.S. Department of Homeland Security (DHS)
collaborated to examine the interdependencies between two critical infrastructure sectors – Dams
and Energy.1 The study highlights the importance of hydroelectric power generation, with a
particular emphasis on the variability of weather patterns and competing demands for water
which determine the water available for hydropower production. In recent years, various regions
of the Nation suffered drought, impacting stakeholders in both the Dams and Energy Sectors.
Droughts have the potential to affect the operation of dams and reduce hydropower production,
which can result in higher electricity costs to utilities and customers. Conversely, too much water
can further complicate the operation of dams in ways that can be detrimental to hydropower
production and to the infrastructure of the dams.
Discussions with dam owners and operators revealed that the storage capacity and conveyance
flexibility of most conventional hydroelectric facilities were designed to accommodate local or
regional historical patterns of hydrologic variability. Thus, episodic low water conditions, as
opposed to long-term drought conditions, are not critical contributors to reduced hydropower
production; however, the requirements for providing sufficient water for irrigation,
environmental protection, transportation, as well as community and industrial uses are already in
conflict in many places. Low water conditions (e.g., drought) and high water conditions (e.g.,
flood) resulting from extreme weather variability can strain the operation of dams and heighten
the degree of competition for available water.
Although hydroelectric facilities are a type of asset that falls under the auspices of the Dams
Sector, they are also an important element to the Energy Sector because the electric power they
generate is critical to maintaining the reliability of the Nation‘s electricity supply. Therefore, this
joint effort underscores the value of a cross-sector partnership model in the identification and
discussion of issues significant to dam and utilities owners and operators, through which can
help enhance their resilience against the potential impacts associated with the variability of
weather patterns and extreme fluctuations of water flow.
1 The term ―critical infrastructure‖ has the meaning given to that term in section 1016(e) of the USA PATRIOT Act
of 2001. Dams and Energy are two of the original 17 critical infrastructure sectors identified by Homeland Security
Presidential Directive 7, which established the United States national policy for identification and prioritization of
critical infrastructure for protection from terrorist attacks. The Critical Manufacturing Sector was added later.
September 2011 3
Acknowledgements
This report was developed by Ms. Tiffany Choi, ICF International; in collaboration with Ms.
Laura P. Keith, SRA International, Inc.; and Ms. Elizabeth Hocking, Argonne National
Laboratory. Dr. Kenneth Friedman, Office of Electricity Delivery and Energy Reliability,
Infrastructure Security and Energy Restoration, U.S. Department of Energy (DOE) and Dr.
Enrique Matheu, Chief, Dams Sector Branch, Sector-Specific Agency Executive Management
Office, Office of Infrastructure Protection, National Protection and Programs Directorate, U.S.
Department of Homeland Security (DHS), served as the DOE and DHS team leads, respectively.
DHS and DOE would like to acknowledge the following public and private owners and operators
and stakeholders for their contributions to the report:
Ameren Services Company
Colorado River Energy Distributors Association
Tennessee Valley Authority
U.S. Army Corps of Engineers
U.S. Bureau of Reclamation
Xcel Energy
September 2011 4
Table of Contents
Abstract ................................................................................................................................... 2
Acknowledgements ................................................................................................................. 3
Table of Contents .................................................................................................................... 4
Section 1: Introduction ............................................................................................................ 5
Section 2: Hydroelectric Power in the United States .............................................................. 7
2.1 Importance of Hydroelectric Dams for Power Generation ......................................... 7
2.2 Hydroelectric Power Capacity vs. Generation ............................................................ 9
2.3 Variability of Weather and Hydroelectric Power Generation ................................... 11
2.4 Historical Hydroelectric Power Generation .............................................................. 12
2.5 Largest Hydro Dams ................................................................................................. 13
Section 3: Operation of Hydroelectric Dams in Selected Major Watersheds ....................... 15
3.1 The Columbia River System ..................................................................................... 16
3.2 The Colorado River System ...................................................................................... 21
3.3 The Tennessee River System .................................................................................... 27
Section 4: Discussions with Hydroelectric Facility Owners and Operators ......................... 29
4.1 Low Water Condition Accommodations .................................................................. 30
4.2 High Water Condition Impacts ................................................................................. 31
4.3 Competing Demands for Water ................................................................................ 31
Appendix A. Acronyms ........................................................................................................ 33
Appendix B. Glossary of Terms ........................................................................................... 34
Appendix C. Study Methodology ......................................................................................... 35
Appendix D. Impacts of Droughts on Utilities ..................................................................... 36
Appendix E. 2009 Sandia Report.......................................................................................... 37
Appendix F. Sources and References ................................................................................... 40
September 2011 5
Section 1: Introduction
The National Infrastructure Protection Plan (NIPP) provides an overarching framework for the
protection and resilience efforts for the Nation‘s 18 critical infrastructure sectors.2 Through the
NIPP framework, each of the 18 sectors has developed public-private partnerships at an
unprecedented level, providing a mechanism for critical infrastructure stakeholders to share
cross-sector concerns and to collaborate on enhancing the protection and resilience posture of
their critical infrastructure. This study complements the ongoing efforts of two critical
infrastructure sectors—Energy and Dams—by examining the hydropower component of their
close interdependency.3
The Department of Energy (DOE) and the Department of Homeland Security (DHS) are the
designated Sector-Specific Agencies (SSAs) for the Energy and Dams Sectors, respectively. As
the SSAs, DOE and DHS support and coordinate the protection and resilience activities for the
Dams and Energy Sectors‘ critical infrastructure as defined below:
Dams Sector assets include dam projects, hydropower generation facilities, navigation
locks, levees, dikes, hurricane barriers, mine tailings and other industrial waste
impoundments, and other similar water retention and water control facilities.4
Energy Sector, as delineated by Homeland Security Presidential Directive 7 (HSPD-7),
includes the production, refining, storage, and distribution of oil, gas, and electric power,
except for hydroelectric and commercial nuclear power facilities.5
Although hydroelectric facilities are a type of asset that falls under the auspices of the Dams
Sector, they are also an important element to the Energy Sector because the electric power they
generate is critical to maintaining the reliability of the Nation‘s electricity supply. In preparing
for this report, the SSAs for the Energy and Dams Sectors collaborated to examine the two
sectors‘ shared concerns and interests in hydroelectric power generation. Chief among these
concerns is the fact that hydroelectric power generation is affected by extreme fluctuations of
water flow, as well as long-term issues surrounding the management and uses of water supply to
generate hydroelectricity. In recent years, various regions of the Nation suffered droughts
affecting stakeholders in both the Dams and Energy Sectors.6 Although recent drought
conditions have not caused a serious problem in terms of electricity supply and reliability, they
have the potential to affect the operation of dams by decreasing hydropower production, which
could result in higher electricity costs to utilities and customers.7 Other weather-related variables
2 The term ―critical infrastructure‖ has the meaning given to that term in section 1016(e) of the USA PATRIOT Act
of 2001. Also see the National Infrastructure Protection Plan, U.S. Department of Homeland Security (DHS),
http://www.dhs.gov/xlibrary/assets/NIPP_Plan.pdf, accessed December 22, 2010. 3 See Appendix C for study methodology.
4 2010 Dams Sector-Specific Plan, DHS, http://www.dhs.gov/xlibrary/assets/nipp-ssp-dams-2010.pdf, accessed
December 22, 2010. 5 2010 Energy Sector-Specific Plan, U.S Department of Energy (DOE),
http://www.oe.energy.gov/DocumentsandMedia/Energy_SSP_2010.pdf, accessed December 22, 2010. 6 See Appendix B for the meaning of drought and other technical terms used in this report. See Appendix D for
examples of effects of drought on utilities. 7 2010 Dams Sector-Specific Plan, p. 13. For more information about the possible effects of droughts, see
―Apalachicola-Chattahoochee-Flint (ACF) Drought: Federal Reservoir and Species Management,‖ Congressional
September 2011 6
such as air temperature, precipitation, and runoff conditions also impact future water supplies
and demands, and may impose operational constraints on dams and utilities that rely on
hydroelectric power generation.8
The report investigates how different variables might affect the operation of hydroelectric
facilities and the supply of hydroelectric power, especially in times of drought and other extreme
weather events. Such variables include:
The relationship between hydroelectric power generation and the variability of hydrology
and weather patterns;
Operation of major reservoirs and streamflow regulations at these reservoirs; and
Management for flood control, fish habitat protection, and power generation.
In addition, this joint effort underscores the value of the partnership model across sectors in the
identification and discussion of the challenges and concerns that constitute priority issues for
dam and utilities owners and operators. The ultimate goal of this effort is to help the two sectors
enhance their resilience against the potential impacts associated with the variability of weather
patterns and extreme fluctuations of water flow.
Limitations of the Study
To maintain the focus of the study, this report is limited to issues that specifically relate to
electric power generation at hydroelectric dams. Specifically, this study examines issues
pertinent to overall management of reservoirs and streamflows at dams that are affected by the
variability of weather patterns. In-depth analysis of certain topics considered outside of the scope
of the study is omitted from the report. These include: climate change, new hydropower
technologies, renewable energy credits, the value of hydropower‘s avoided greenhouse gas
emissions, and the effects of reduced hydropower generation on the overall power market.
There are three types of hydroelectric power plants: conventional, pumped storage, and diversion
facilities. The focus of this report is on the conventional hydroelectric facilities, which are the
most common type of hydroelectric power plant.9 The U.S. Energy Information Administration
(EIA) defines a conventional hydroelectric power plant as a plant in which all of the power is
produced from natural streamflow as regulated by available storage.10
Most pumped storage
units have closed-loop systems in which water can be stored and reused; therefore, electricity
production at pumped storage is more resistant to drought or changing weather patterns. For this
Research Service, RL34250, Updated May 1, 2008, http://assets.opencrs.com/rpts/RL34250_20071114.pdf and ―An
Analysis of the Effects of Drought Conditions on Electric Power Generation in the Western United States,‖ National
Energy Technology Laboratory, DOE/NETL-2009/1365, April 2009,
http://www.netl.doe.gov/technologies/coalpower/ewr/water/pdfs/final%20-%20WECC%20drought%20analysis.pdf,
both accessed January 7, 2011. 8 Addressing Climate Change in Long-Term Water Resources Planning and Management, the U.S. Army Corp. of
Engineers (USACE) and the Bureau of Reclamation (Reclamation), U.S. Department of Interior (DOI), January
2011, http://www.usbr.gov/climate/userneeds/, accessed March 31, 2011. 9 Throughout this report, ―hydroelectric power,‖ ―hydropower,‖ and ―hydroelectricity‖ are used interchangeably.
10 The U.S. Energy Information Administration (EIA), Glossary, http://www.eia.doe.gov/glossary/index.cfm,
accessed January 26, 2011.
September 2011 7
reason, the discussion of and data on hydroelectric power generation provided in this report
excludes generation from pumped storage, unless noted otherwise.
While the operation of thermoelectric plants is significantly affected by the availability of water,
they are not the subject of this report. A 2009 report from Sandia National Laboratories – New
Mexico entitled, Energy and Water Sector Policy Strategies for Drought Mitigation, examined
the use of water in the electricity production process and how different technologies can affect a
plant‘s water requirements and raise environmental concerns.11
Appendix E provides a brief
summary of this discussion from the Sandia report.
Finally, it should be noted that there is a tremendous amount of ongoing and proposed activity
relating to hydroelectric power, as well as broader water management and supply issues. It is not
the purpose of this study to consider or catalogue all such efforts. Appendix F provides
references related to dams and hydroelectricity that may provide further background information.
Section 2: Hydroelectric Power in the United States
This section provides an overview of hydroelectric power generation in the United States to
demonstrate the significance of hydroelectric dams in the Energy Sector. The following
subsections provide a national overview of
hydroelectric power generation, including its key
benefits, historical capacity and generation data, the
variability of weather and hydropower production,
recent changes to hydropower generation, and a list of
the 20 largest hydroelectric dams in the United States.
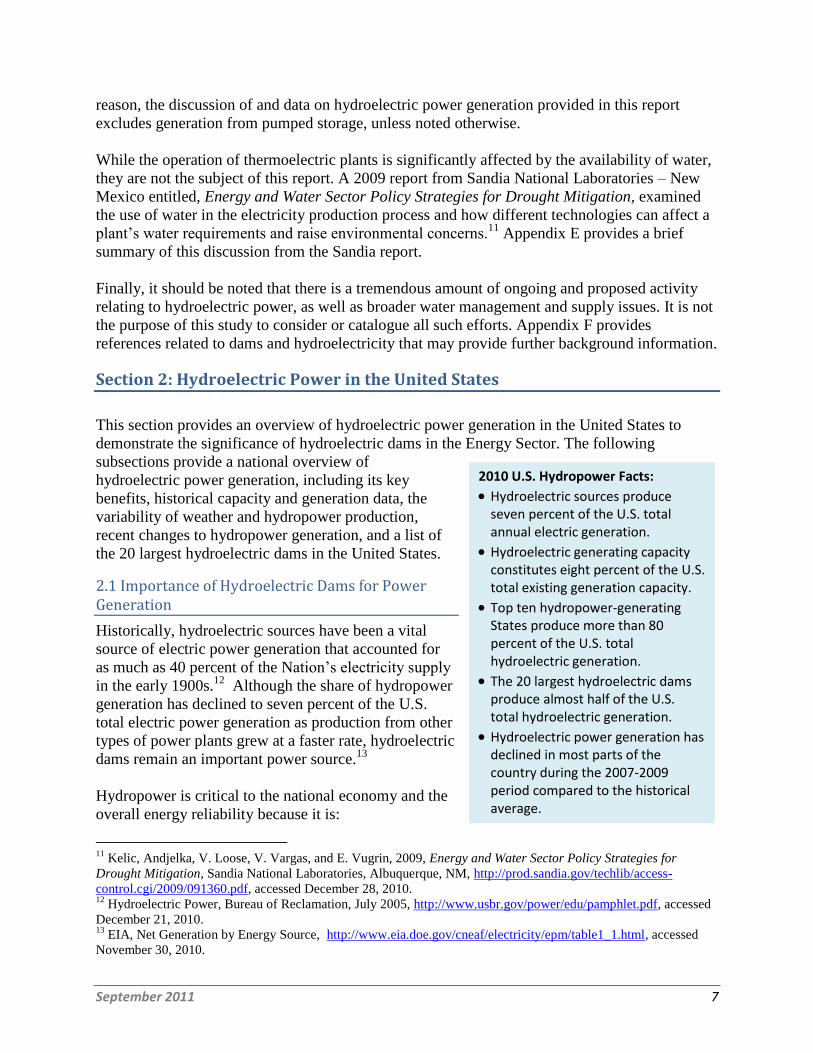
2.1 Importance of Hydroelectric Dams for Power Generation
Historically, hydroelectric sources have been a vital
source of electric power generation that accounted for
as much as 40 percent of the Nation‘s electricity supply
in the early 1900s.12
Although the share of hydropower
generation has declined to seven percent of the U.S.
total electric power generation as production from other
types of power plants grew at a faster rate, hydroelectric
dams remain an important power source.13
Hydropower is critical to the national economy and the
overall energy reliability because it is:
11
Kelic, Andjelka, V. Loose, V. Vargas, and E. Vugrin, 2009, Energy and Water Sector Policy Strategies for
Drought Mitigation, Sandia National Laboratories, Albuquerque, NM, http://prod.sandia.gov/techlib/access-
control.cgi/2009/091360.pdf, accessed December 28, 2010. 12
Hydroelectric Power, Bureau of Reclamation, July 2005, http://www.usbr.gov/power/edu/pamphlet.pdf, accessed
December 21, 2010. 13
EIA, Net Generation by Energy Source, http://www.eia.doe.gov/cneaf/electricity/epm/table1_1.html, accessed
November 30, 2010.
2010 U.S. Hydropower Facts:
Hydroelectric sources produce seven percent of the U.S. total annual electric generation.
Hydroelectric generating capacity constitutes eight percent of the U.S. total existing generation capacity.
Top ten hydropower-generating States produce more than 80 percent of the U.S. total hydroelectric generation.
The 20 largest hydroelectric dams produce almost half of the U.S. total hydroelectric generation.
Hydroelectric power generation has declined in most parts of the country during the 2007-2009 period compared to the historical average.
September 2011 8
The least expensive source of electricity, as it does not require fossil fuels for generation;
An emission-free renewable source, accounting for over 65 percent of the U.S. total
annual net renewable generation;14
Able to shift loads to provide peaking power (it does not require ramp-up time like
combustion technologies); and
Often designated as a black start source that can be used to restore network
interconnections in the event of a blackout.
Hydroelectric power is derived from the force of moving water. It is considered a ―renewable‖
source, because the water on the earth is continuously replenished by precipitation.15
A typical
hydro plant serves multiple functions and consists of three parts: a power plant where the
electricity is produced, a dam that can be opened or closed to control water flow, and a reservoir
where water can be stored. 16
The water behind a dam flows through an intake and pushes against
blades in a turbine, causing them to turn and produce electricity. The amount of electricity that
can be generated depends on how far the water drops and how much water moves through the
system.
In addition to providing clean electricity production, hydropower serves an essential purpose of
enhancing electric grid reliability. Hydropower can rapidly adjust output to meet changing real-
time electricity demands and provide ―black start‖ capability to help restore power during a
blackout event. Black start capability is defined as the ability to start generation without an
outside source of power.17
Because hydropower plants are the only major generators that can
dispatch power to the grid immediately when all other energy sources are inaccessible, they
provide essential back-up power during major electricity disruptions such as the 2003 blackout.18
With black start capability, hydropower facilities can resume operations in isolation without
drawing on an outside power source and help restore power to the grid.
Figure 1 is a snapshot of hydropower generation in the United States today. The 10 highlighted
States together produce more than 80 percent of the Nation‘s total hydroelectric power. The
numeric values represent each State‘s dependence on hydro sources for electricity generation.
For example, hydro sources in Maine, South Dakota, and Vermont each contribute less than two
percent of the Nation‘s hydroelectric generation; however, their dependence on hydro sources is
14
Electricity Net Generation from Renewable Energy by Energy Use Sector and Energy Source, EIA,
http://www.eia.doe.gov/cneaf/solar.renewables/page/table3.html, accessed January 7, 2011. 15
It is important to note that each State treats and defines renewable energy differently. As of March 2011, 29 States
have policies in place to provide certain incentives for ―eligible renewable sources‖ (ERS) (see
http://www.dsireusa.org/documents/summarymaps/RPS_map.pptx). However, electricity generation from large
hydropower facilities or those that were operational prior to the implementation of the Renewable Portfolio
Standards (RPS) often do not qualify as an ERS. For example, in Washington State, hydro sources generally do not
qualify as an ERS, except for incremental electricity produced from efficiency improvements at hydropower
facilities owned by qualifying utilities if the improvements were completed after March 31, 1999. See
http://www.leg.wa.gov/Senate/Committees/EWE/Documents/RenewableEnergy.pdf, accessed April 4, 2011. 16
Hydropower, the National Energy Education Development Project,
http://www.need.org/needpdf/infobook_activities/SecInfo/HydroS.pdf, accessed November 20, 2010. 17
Hydropower and the World's Energy Future, International Hydropower Association, November 2000,
http://www.ieahydro.org/reports/Hydrofut.pdf, accessed May 4, 2011. 18
―Hydropower is Reliable,‖ National Hydropower Association, http://hydro.org/why-hydro/reliable/, accessed May
4, 2011.
September 2011 9
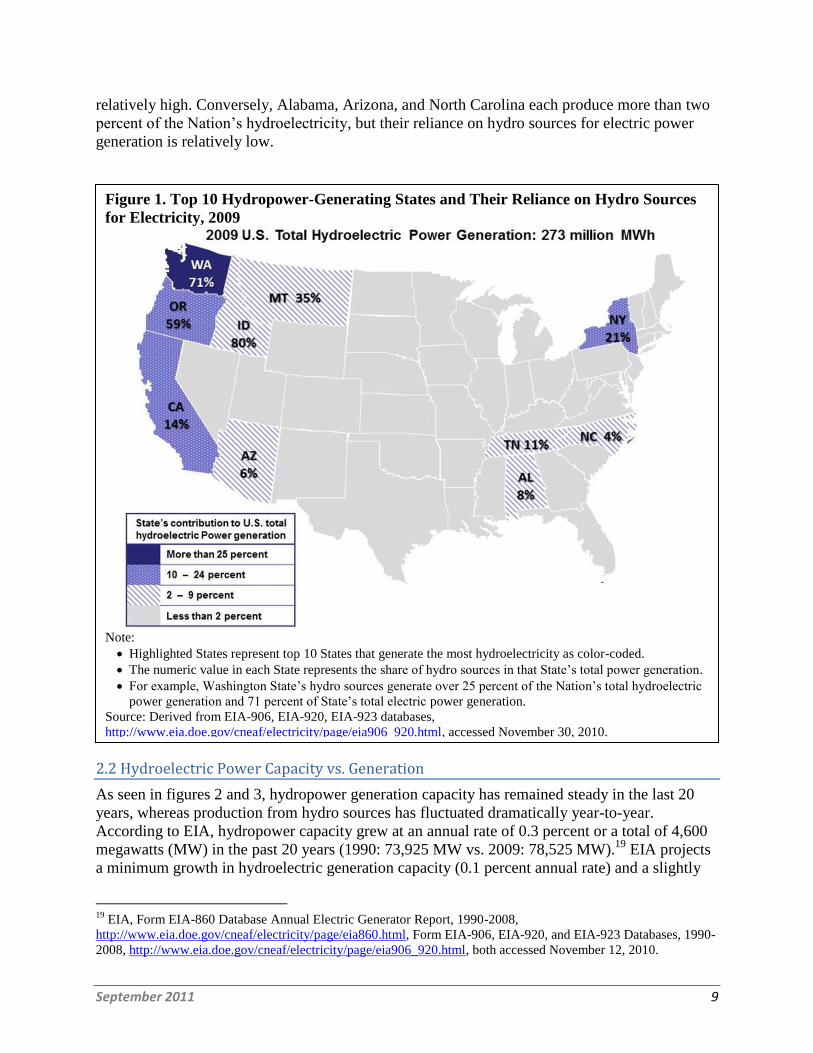
relatively high. Conversely, Alabama, Arizona, and North Carolina each produce more than two
percent of the Nation‘s hydroelectricity, but their reliance on hydro sources for electric power
generation is relatively low.
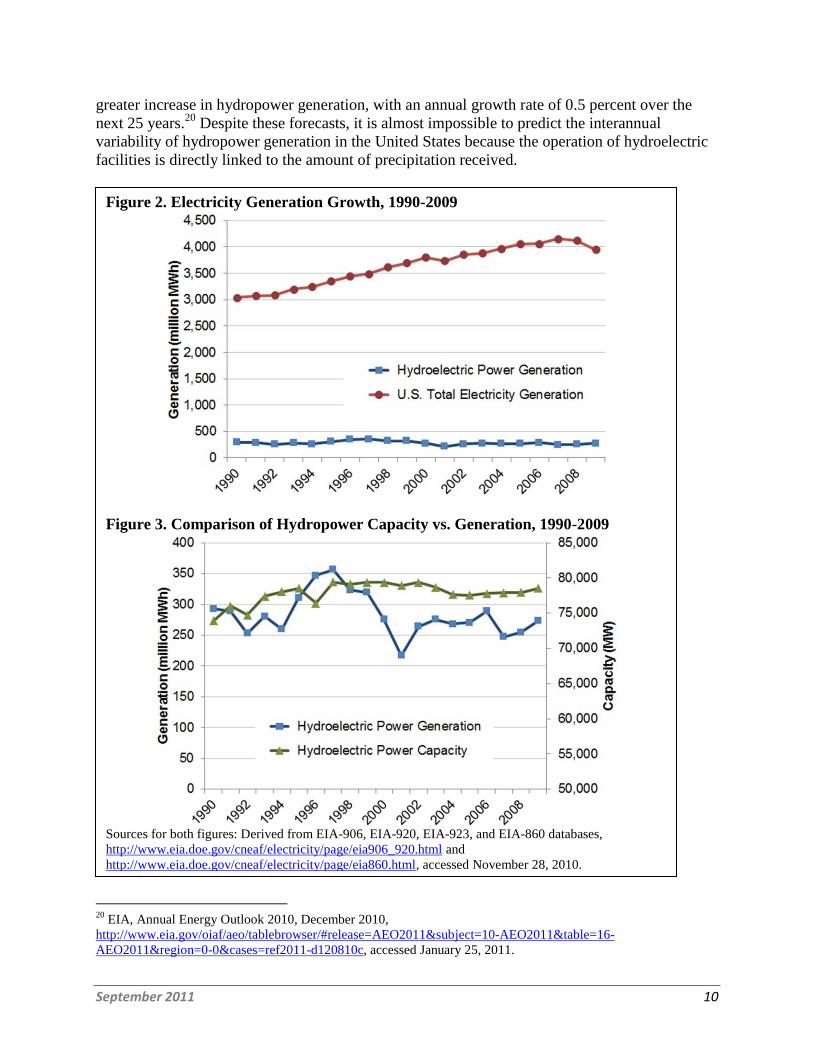
2.2 Hydroelectric Power Capacity vs. Generation
As seen in figures 2 and 3, hydropower generation capacity has remained steady in the last 20
years, whereas production from hydro sources has fluctuated dramatically year-to-year.
According to EIA, hydropower capacity grew at an annual rate of 0.3 percent or a total of 4,600
megawatts (MW) in the past 20 years (1990: 73,925 MW vs. 2009: 78,525 MW).19
EIA projects
a minimum growth in hydroelectric generation capacity (0.1 percent annual rate) and a slightly
19
EIA, Form EIA-860 Database Annual Electric Generator Report, 1990-2008,
http://www.eia.doe.gov/cneaf/electricity/page/eia860.html, Form EIA-906, EIA-920, and EIA-923 Databases, 1990-
2008, http://www.eia.doe.gov/cneaf/electricity/page/eia906_920.html, both accessed November 12, 2010.
Figure 1. Top 10 Hydropower-Generating States and Their Reliance on Hydro Sources
for Electricity, 2009
Note:
Highlighted States represent top 10 States that generate the most hydroelectricity as color-coded.
The numeric value in each State represents the share of hydro sources in that State‘s total power generation.
For example, Washington State‘s hydro sources generate over 25 percent of the Nation‘s total hydroelectric
power generation and 71 percent of State‘s total electric power generation.
Source: Derived from EIA-906, EIA-920, EIA-923 databases,
http://www.eia.doe.gov/cneaf/electricity/page/eia906_920.html, accessed November 30, 2010.
September 2011 10
greater increase in hydropower generation, with an annual growth rate of 0.5 percent over the
next 25 years.20
Despite these forecasts, it is almost impossible to predict the interannual
variability of hydropower generation in the United States because the operation of hydroelectric
facilities is directly linked to the amount of precipitation received.
20
EIA, Annual Energy Outlook 2010, December 2010,
http://www.eia.gov/oiaf/aeo/tablebrowser/#release=AEO2011&subject=10-AEO2011&table=16-
AEO2011®ion=0-0&cases=ref2011-d120810c, accessed January 25, 2011.
Figure 2. Electricity Generation Growth, 1990-2009
Figure 3. Comparison of Hydropower Capacity vs. Generation, 1990-2009
Sources for both figures: Derived from EIA-906, EIA-920, EIA-923, and EIA-860 databases,
http://www.eia.doe.gov/cneaf/electricity/page/eia906_920.html and
http://www.eia.doe.gov/cneaf/electricity/page/eia860.html, accessed November 28, 2010.
September 2011 11
2.3 Variability of Weather and Hydroelectric Power Generation
Hydroelectric power generation depends on the availability of local water sources that are
susceptible to changes in local hydrology and weather patterns. Operational policies (i.e., flood
control as the primary mission) and regulatory compliance (e.g., instream flow requirements for
fish protection) are important factors in hydropower generation, as are multiple competing water
uses such as water supply, irrigation, and recreation. In other words, the operation of a
hydroelectric facility is affected by the amount of water available in a river basin where the
facility is located, as well as competing uses of water that are specific to each river.21
(See
section 3 for discussion on the operational and regulatory issues impacting water uses and
streamflows.)
In the past century, total precipitation has increased by about seven percent averaged across the
United States.22
However, year-to-year fluctuation in natural weather and climate patterns can
produce a period that does not follow the long-term trends (see figure 3). The interannual
variability of hydropower generation in the United States is very high—a drop of 59 million
megawatt hours (MWh) (or 21 percent of the U.S. total hydropower generation) was seen from
2000 to 2001. Sensitivity of hydroelectric power generation to changes in precipitation and river
discharge is high; in the range of 1.0+ (a sensitivity level of 1.0 means that one percent change in
precipitation results in one percent change in generation).23
Although it is evident that
precipitation is a determining factor in available hydropower generation for a given period of
time, the variability of weather patterns impose uncertainty in the operation of hydroelectric
facilities.
Hydropower operations are also affected indirectly by the changes in air temperatures, humidity,
and wind patterns which change water quality and reservoir dynamics.24
For example, reservoirs
with large surface areas (such as Lake Mead in the lower Colorado River) are more likely to
experience greater evaporation, which affects the availability of water for all uses including
hydropower. In addition, altering snowfall patterns and associated runoff from snowpack melt
are a matter of concern, particularly in the Pacific Northwest, where snows are melting earlier
and the proportion of precipitation in the form of snow is decreasing.25
21
Energy Demands on Water Resources, Report to Congress on the Interdependency of Water and Energy, DOE,
December 2006. 22
Gutowski, W.J., G.C. Hegerl, G.J. Holland, T.R. Knutson, L.O. Mearns, R.J. Stouffer, P.J. Webster, M.F. Wehner,
and F.W. Zwiers, 2008: Causes of observed changes in extremes and projections of future changes. In: Weather and
Climate Extremes in a Changing Climate: Regions of Focus: North America, Hawaii, Caribbean, and U.S. Pacific
Islands [Karl, T.R., G.A. Meehl, C.D. Miller, S.J. Hassol, A.M. Waple, and W.L. Murray (eds.)]. Synthesis and
Assessment Product 3.3. U.S. Climate Change Science Program, Washington, DC, pp. 81-116. 23
Bull, S. R., D. E. Bilello, J. Ekmann, M. J. Sale, and D. K. Schmalzer, 2007: Effects of climate change on energy
production and distribution in the United States in Effects of Climate Change on Energy Production and Use in the
United States. A Report by the U.S. Climate Change Science Program and the Subcommittee on Global Change
Research. Washington, DC. 24
Ibid. 25
Bates, B.C., Z.W. Kundzewicz, S. Wu, and J.P. Palutikof (eds.), 2008: Climate Change and Water. Technical
paper of the Intergovernmental Panel on Climate Change (IPCC). IPCC Secretariat, Geneva, Switzerland, available
at http://www.ipcc.ch/pdf/technical-papers/climate-change-water-en.pdf, accessed June 29, 2011.
September 2011 12
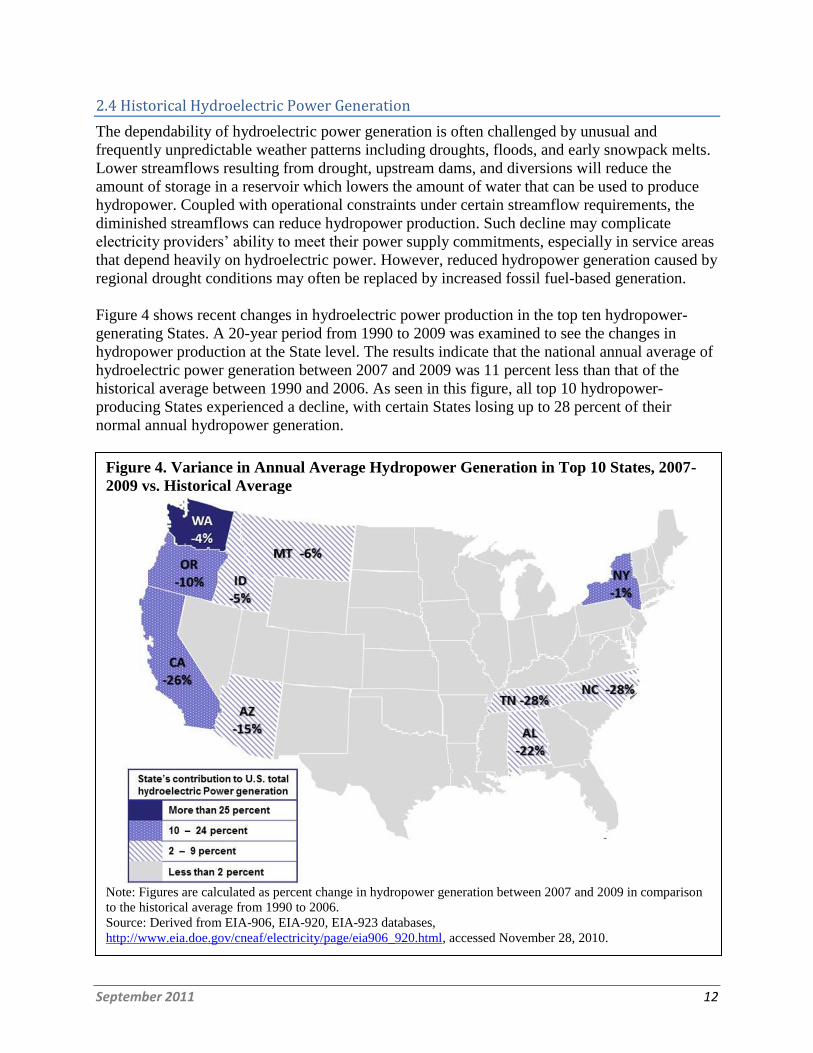
2.4 Historical Hydroelectric Power Generation
The dependability of hydroelectric power generation is often challenged by unusual and
frequently unpredictable weather patterns including droughts, floods, and early snowpack melts.
Lower streamflows resulting from drought, upstream dams, and diversions will reduce the
amount of storage in a reservoir which lowers the amount of water that can be used to produce
hydropower. Coupled with operational constraints under certain streamflow requirements, the
diminished streamflows can reduce hydropower production. Such decline may complicate
electricity providers‘ ability to meet their power supply commitments, especially in service areas
that depend heavily on hydroelectric power. However, reduced hydropower generation caused by
regional drought conditions may often be replaced by increased fossil fuel-based generation.
Figure 4 shows recent changes in hydroelectric power production in the top ten hydropower-
generating States. A 20-year period from 1990 to 2009 was examined to see the changes in
hydropower production at the State level. The results indicate that the national annual average of
hydroelectric power generation between 2007 and 2009 was 11 percent less than that of the
historical average between 1990 and 2006. As seen in this figure, all top 10 hydropower-
producing States experienced a decline, with certain States losing up to 28 percent of their
normal annual hydropower generation.
Figure 4. Variance in Annual Average Hydropower Generation in Top 10 States, 2007-
2009 vs. Historical Average
Note: Figures are calculated as percent change in hydropower generation between 2007 and 2009 in comparison
to the historical average from 1990 to 2006.
Source: Derived from EIA-906, EIA-920, EIA-923 databases,
http://www.eia.doe.gov/cneaf/electricity/page/eia906_920.html, accessed November 28, 2010.
September 2011 13
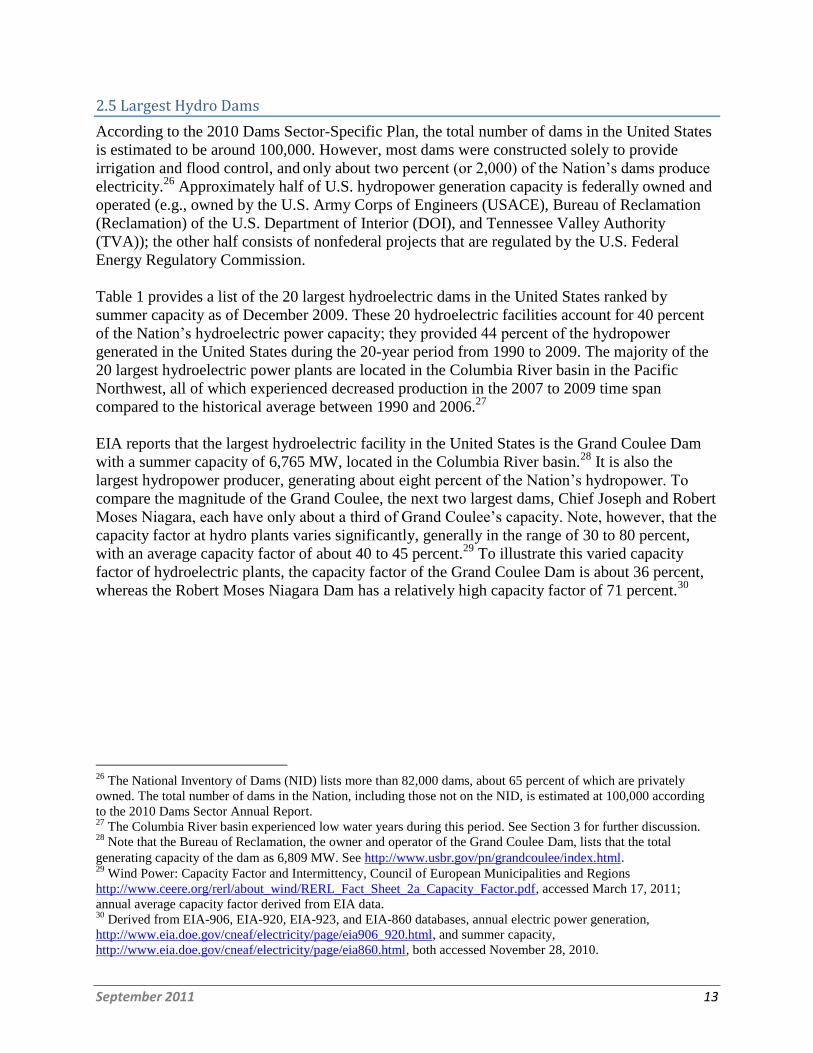
2.5 Largest Hydro Dams
According to the 2010 Dams Sector-Specific Plan, the total number of dams in the United States
is estimated to be around 100,000. However, most dams were constructed solely to provide
irrigation and flood control, and only about two percent (or 2,000) of the Nation‘s dams produce
electricity.26
Approximately half of U.S. hydropower generation capacity is federally owned and
operated (e.g., owned by the U.S. Army Corps of Engineers (USACE), Bureau of Reclamation
(Reclamation) of the U.S. Department of Interior (DOI), and Tennessee Valley Authority
(TVA)); the other half consists of nonfederal projects that are regulated by the U.S. Federal
Energy Regulatory Commission.
Table 1 provides a list of the 20 largest hydroelectric dams in the United States ranked by
summer capacity as of December 2009. These 20 hydroelectric facilities account for 40 percent
of the Nation‘s hydroelectric power capacity; they provided 44 percent of the hydropower
generated in the United States during the 20-year period from 1990 to 2009. The majority of the
20 largest hydroelectric power plants are located in the Columbia River basin in the Pacific
Northwest, all of which experienced decreased production in the 2007 to 2009 time span
compared to the historical average between 1990 and 2006.27
EIA reports that the largest hydroelectric facility in the United States is the Grand Coulee Dam
with a summer capacity of 6,765 MW, located in the Columbia River basin.28
It is also the
largest hydropower producer, generating about eight percent of the Nation‘s hydropower. To
compare the magnitude of the Grand Coulee, the next two largest dams, Chief Joseph and Robert
Moses Niagara, each have only about a third of Grand Coulee‘s capacity. Note, however, that the
capacity factor at hydro plants varies significantly, generally in the range of 30 to 80 percent,
with an average capacity factor of about 40 to 45 percent.29
To illustrate this varied capacity
factor of hydroelectric plants, the capacity factor of the Grand Coulee Dam is about 36 percent,
whereas the Robert Moses Niagara Dam has a relatively high capacity factor of 71 percent.30
26
The National Inventory of Dams (NID) lists more than 82,000 dams, about 65 percent of which are privately
owned. The total number of dams in the Nation, including those not on the NID, is estimated at 100,000 according
to the 2010 Dams Sector Annual Report. 27
The Columbia River basin experienced low water years during this period. See Section 3 for further discussion. 28
Note that the Bureau of Reclamation, the owner and operator of the Grand Coulee Dam, lists that the total
generating capacity of the dam as 6,809 MW. See http://www.usbr.gov/pn/grandcoulee/index.html. 29
Wind Power: Capacity Factor and Intermittency, Council of European Municipalities and Regions
http://www.ceere.org/rerl/about_wind/RERL_Fact_Sheet_2a_Capacity_Factor.pdf, accessed March 17, 2011;
annual average capacity factor derived from EIA data. 30
Derived from EIA-906, EIA-920, EIA-923, and EIA-860 databases, annual electric power generation,
http://www.eia.doe.gov/cneaf/electricity/page/eia906_920.html, and summer capacity,
http://www.eia.doe.gov/cneaf/electricity/page/eia860.html, both accessed November 28, 2010.

September 2011 14
Table 1. 20 Largest Hydroelectric Dams in the United States
Plant Name Owner State Initial
Operating Year
Summer Capacity
(MW)
Comparison of Historical Avg. Annual Generation
(MWh)
Difference in Avg. Gen. (%) 2007-2009 vs.
1990-2006
Capacity Factor
2009 1990-2006 2007-2009 2009
Grand Coulee USBR WA 1941 6,765 21,170,076 21,596,413 2% 35%
Chief Joseph USACE WA 1955 2,456 11,454,051 10,684,406 -7% 45%
Robert Moses Niagara
NYPA NY 1961 2,353 14,543,029 14,021,163 -4% 71%
John Day USACE OR 1969 2,160 9,958,204 8,703,430 -13% 44%
Hoover Dam USBR AZ-NV
1936 2,079 4,429,576 3,723,415 -16% 20%
The Dalles USACE OR 1957 1,823 6,988,641 6,320,308 -10% 38%
Glen Canyon Dam
USBR AZ 1964 1,312 4,297,797 3,680,952 -14% 32%
Rocky Reach PUD WA 1961 1,254 6,003,149 5,808,323 -3% 49%
Bonneville USACE OR 1938 1,093 4,919,740 4,503,497 -8% 47%
Wanapum PUD WA 1963 1,044 5,019,250 4,790,141 -5% 39%
Boundary Seattle WA 1967 1,040 3,861,324 3,674,757 -5% 48%
McNary USACE OR 1953 991 6,061,311 5,211,778 -14% 59%
Priest Rapids PUD WA 1959 932 4,605,956 4,642,458 1% 52%
Wells PUD WA 1967 840 4,303,039 3,963,250 -8% 51%
Lower Granite USACE WA 1975 810 2,479,234 2,042,004 -18% 34%
Little Goose USACE WA 1970 810 2,423,408 2,056,557 -15% 33%
Lower Monumental
USACE WA 1969 810 2,502,151 2,099,973 -16% 33%
Robert Moses Power Dam
NYPA NY 1958 800 6,771,500 6,936,087 2% 90%*
Oahe USACE SD 1962 714 2,353,409 1,355,022 -42% 30%
Shasta USBR CA 1944 714 1,800,872 1,605,009 -11% 23%
Total 20 Dams 31,113 125,945,718 117,418,942 -7%
Total U.S. 78,518 287,855,374 256,708,605 -11%
20 Largest Dams as percent of U.S. Total Hydro
40% 44% 46%
Note:
This table compares the historical annual average generation (1990-2006) with that of the recent three
years, 2007-2009, at the 20 largest dams in the United States, ranked by summer capacity.
Initial operating year represents the year in which the first unit(s) at the plant became operational and does
not document the years in which additional units were brought online at the same facility.
Owner information:
o NYPA: New York Power Authority
o PUD: Public Utility District
o Seattle: Seattle City of Light
o USACE: U.S. Army Corps of Engineers
o USBR: U.S. Bureau of Reclamation
Capacity Factor: calculated using the 2009 summer capacity and generation data, except for Robert Moses
Power Dam, for which the nameplate capacity of 912MW is used.
Source: Derived from EIA-906, EIA-920, EIA-923, and EIA-860 databases,
http://www.eia.doe.gov/cneaf/electricity/page/eia906_920.html and
http://www.eia.doe.gov/cneaf/electricity/page/eia860.html, accessed November 28, 2010.
September 2011 15
Section 3: Operation of Hydroelectric Dams in Selected Major Watersheds
The operation of a hydroelectric power plant is subject to various internal and external factors.
Internal factors include the management of hydro dams, which respond to the upstream and
downstream conditions by controlling the volume and timing of water retained or released.
External factors include constraints imposed by alternative uses of water (navigation, irrigation,
water supply, fish habitat, recreation) that may lead to restricted flow rates.31
Available water flow is significant both as an internal factor, if upstream and basin flows
decrease, and as an external factor, if water management requires distribution of water for other
purposes or maintaining water to support reservoir activities. This explains why drought can play
a significant role in hydropower production—it can decrease upstream flow and require the
diversion or retention of water that would otherwise go to produce electricity or to other water
purposes during times of scarcity.
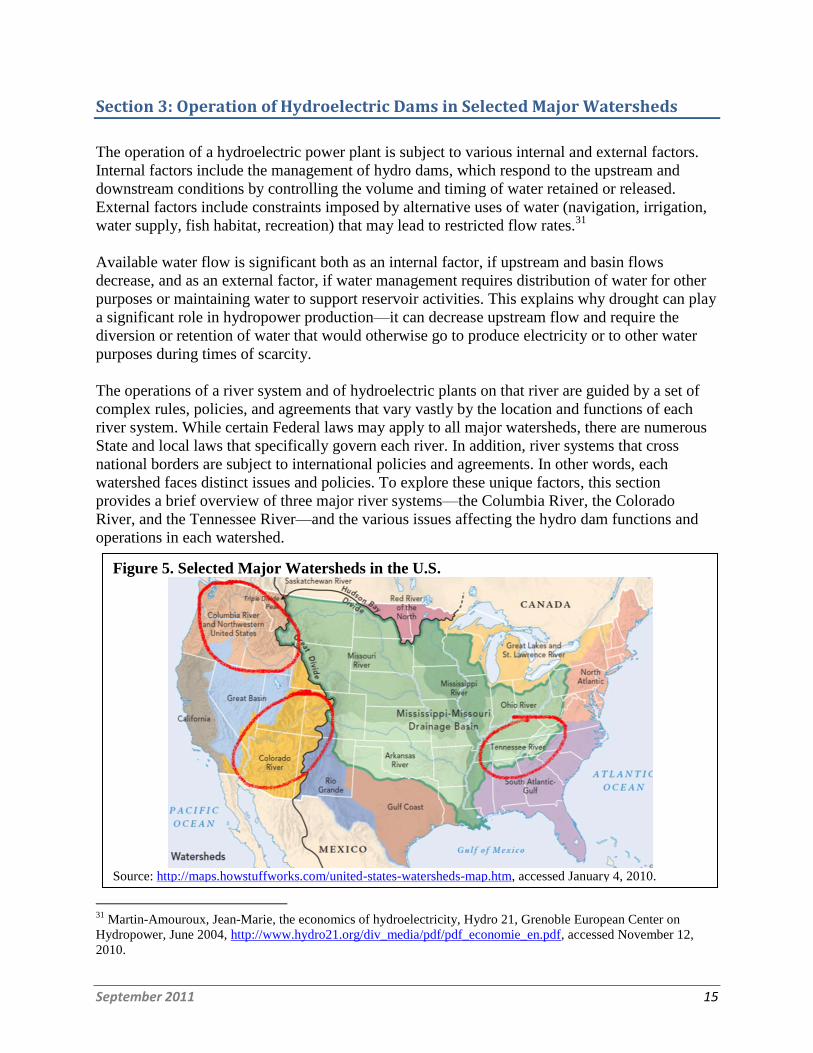
The operations of a river system and of hydroelectric plants on that river are guided by a set of
complex rules, policies, and agreements that vary vastly by the location and functions of each
river system. While certain Federal laws may apply to all major watersheds, there are numerous
State and local laws that specifically govern each river. In addition, river systems that cross
national borders are subject to international policies and agreements. In other words, each
watershed faces distinct issues and policies. To explore these unique factors, this section
provides a brief overview of three major river systems—the Columbia River, the Colorado
River, and the Tennessee River—and the various issues affecting the hydro dam functions and
operations in each watershed.
31
Martin-Amouroux, Jean-Marie, the economics of hydroelectricity, Hydro 21, Grenoble European Center on
Hydropower, June 2004, http://www.hydro21.org/div_media/pdf/pdf_economie_en.pdf, accessed November 12,
2010.
Figure 5. Selected Major Watersheds in the U.S.
Source: http://maps.howstuffworks.com/united-states-watersheds-map.htm, accessed January 4, 2010.
September 2011 16
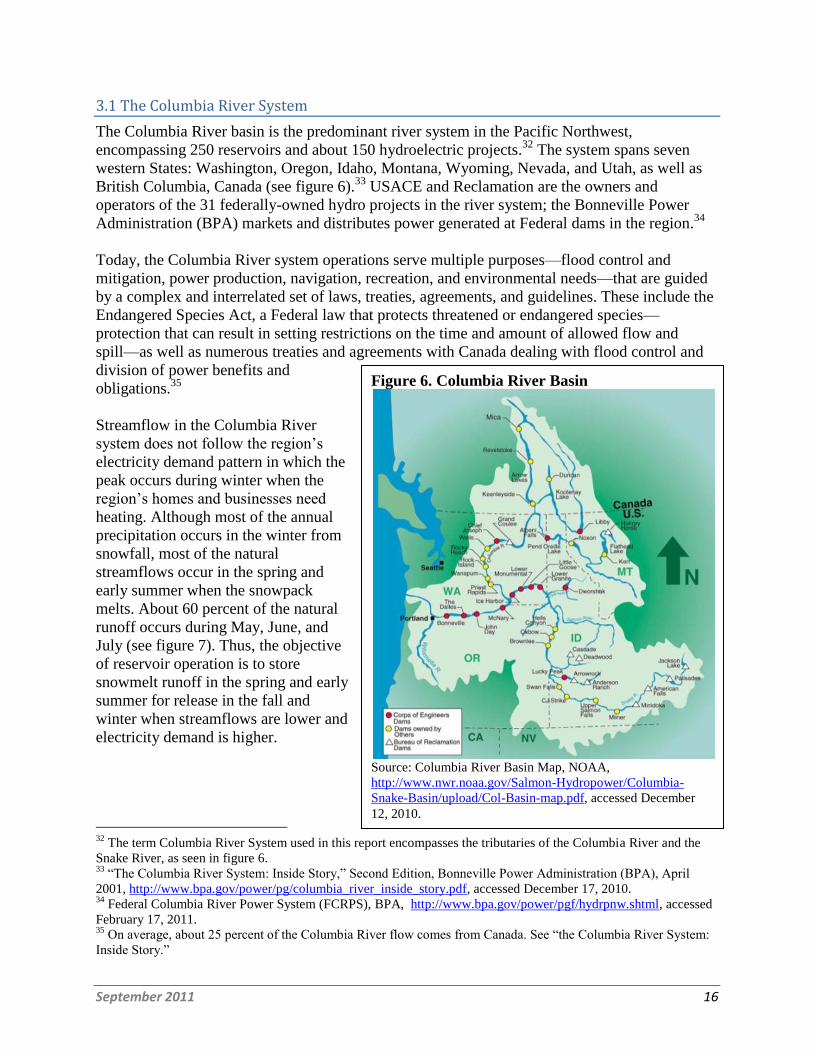
3.1 The Columbia River System
The Columbia River basin is the predominant river system in the Pacific Northwest,
encompassing 250 reservoirs and about 150 hydroelectric projects.32
The system spans seven
western States: Washington, Oregon, Idaho, Montana, Wyoming, Nevada, and Utah, as well as
British Columbia, Canada (see figure 6).33
USACE and Reclamation are the owners and
operators of the 31 federally-owned hydro projects in the river system; the Bonneville Power
Administration (BPA) markets and distributes power generated at Federal dams in the region.34
Today, the Columbia River system operations serve multiple purposes—flood control and
mitigation, power production, navigation, recreation, and environmental needs—that are guided
by a complex and interrelated set of laws, treaties, agreements, and guidelines. These include the
Endangered Species Act, a Federal law that protects threatened or endangered species—
protection that can result in setting restrictions on the time and amount of allowed flow and
spill—as well as numerous treaties and agreements with Canada dealing with flood control and
division of power benefits and
obligations.35
Streamflow in the Columbia River
system does not follow the region‘s
electricity demand pattern in which the
peak occurs during winter when the
region‘s homes and businesses need
heating. Although most of the annual
precipitation occurs in the winter from
snowfall, most of the natural
streamflows occur in the spring and
early summer when the snowpack
melts. About 60 percent of the natural
runoff occurs during May, June, and
July (see figure 7). Thus, the objective
of reservoir operation is to store
snowmelt runoff in the spring and early
summer for release in the fall and
winter when streamflows are lower and
electricity demand is higher.
32
The term Columbia River System used in this report encompasses the tributaries of the Columbia River and the
Snake River, as seen in figure 6. 33
―The Columbia River System: Inside Story,‖ Second Edition, Bonneville Power Administration (BPA), April
2001, http://www.bpa.gov/power/pg/columbia_river_inside_story.pdf, accessed December 17, 2010. 34
Federal Columbia River Power System (FCRPS), BPA, http://www.bpa.gov/power/pgf/hydrpnw.shtml, accessed
February 17, 2011. 35
On average, about 25 percent of the Columbia River flow comes from Canada. See ―the Columbia River System:
Inside Story.‖
Figure 6. Columbia River Basin
Source: Columbia River Basin Map, NOAA,
http://www.nwr.noaa.gov/Salmon-Hydropower/Columbia-
Snake-Basin/upload/Col-Basin-map.pdf, accessed December
12, 2010.
September 2011 17
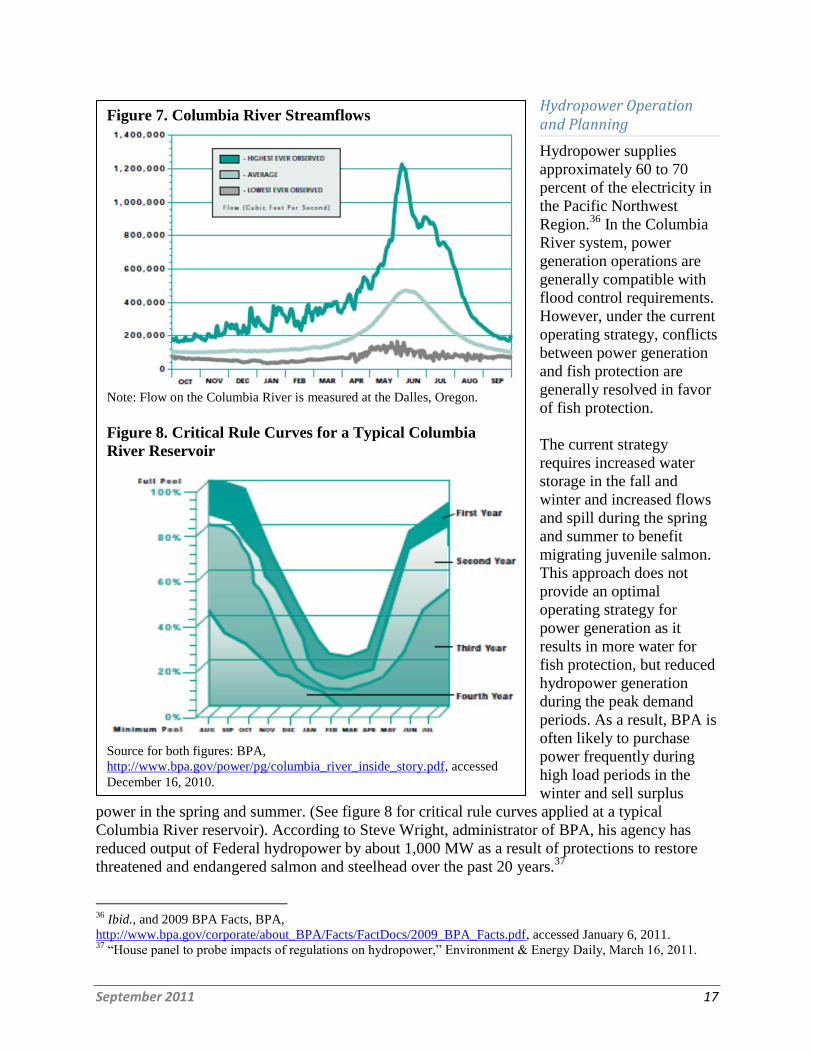
Hydropower Operation and Planning
Hydropower supplies
approximately 60 to 70
percent of the electricity in
the Pacific Northwest
Region.36
In the Columbia
River system, power
generation operations are
generally compatible with
flood control requirements.
However, under the current
operating strategy, conflicts
between power generation
and fish protection are
generally resolved in favor
of fish protection.
The current strategy
requires increased water
storage in the fall and
winter and increased flows
and spill during the spring
and summer to benefit
migrating juvenile salmon.
This approach does not
provide an optimal
operating strategy for
power generation as it
results in more water for
fish protection, but reduced
hydropower generation
during the peak demand
periods. As a result, BPA is
often likely to purchase
power frequently during
high load periods in the
winter and sell surplus
power in the spring and summer. (See figure 8 for critical rule curves applied at a typical
Columbia River reservoir). According to Steve Wright, administrator of BPA, his agency has
reduced output of Federal hydropower by about 1,000 MW as a result of protections to restore
threatened and endangered salmon and steelhead over the past 20 years.37
36
Ibid., and 2009 BPA Facts, BPA,
http://www.bpa.gov/corporate/about_BPA/Facts/FactDocs/2009_BPA_Facts.pdf, accessed January 6, 2011. 37
―House panel to probe impacts of regulations on hydropower,‖ Environment & Energy Daily, March 16, 2011.
Figure 7. Columbia River Streamflows
Note: Flow on the Columbia River is measured at the Dalles, Oregon.
Figure 8. Critical Rule Curves for a Typical Columbia
River Reservoir
Source for both figures: BPA,
http://www.bpa.gov/power/pg/columbia_river_inside_story.pdf, accessed
December 16, 2010.
September 2011 18
Two agreements, the Pacific Northwest Coordination Agreement (PNCA) and the Columbia
River Treaty, underpin how the Columbia River system functions in a coordinated fashion. The
Columbia River Treaty enables improved water storage and annual planning for river projects
with Canada, from which 25 percent of the streamflow originates. The PNCA directs the
coordination among the Federal project operators and hydroelectric generating utilities in the
region. The PNCA enables the optimization of system reliability and power production, provided
that it is consistent with requirements for nonpower uses or functions.38
The PNCA Coordinating Group, made up of BPA, USACE, Reclamation, and major generating
utilities in the Pacific Northwest and Canada, oversees planning and operation for power
production. Annually, the group develops a set of operating guidelines called ―operating rule
curves‖ to guide reservoir operations for power production. Such planning is based on the
possibility that the lowest historical streamflow conditions (―four-year critical period‖ from 1928
to 1932) could recur (see figure 8). The guidelines also include a flood control curve that
requires an adequate space in the reservoir to regulate the predicted runoff for the year without
causing flooding downstream.
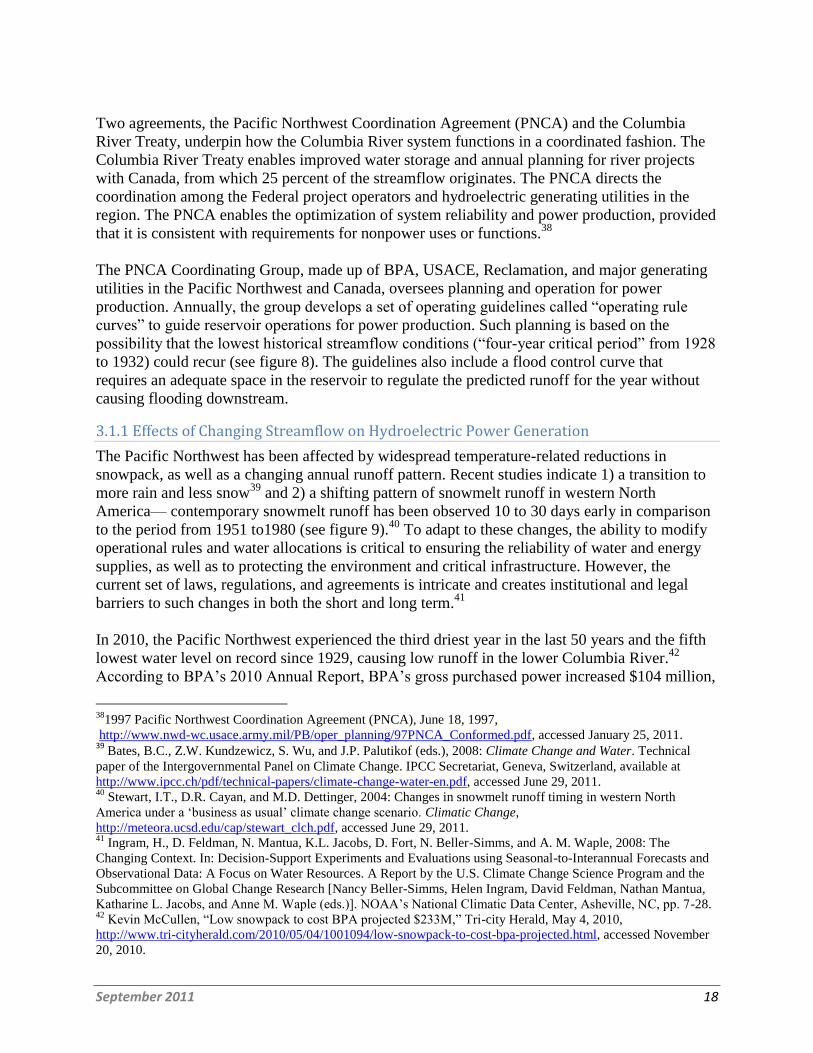
3.1.1 Effects of Changing Streamflow on Hydroelectric Power Generation
The Pacific Northwest has been affected by widespread temperature-related reductions in
snowpack, as well as a changing annual runoff pattern. Recent studies indicate 1) a transition to
more rain and less snow39
and 2) a shifting pattern of snowmelt runoff in western North
America— contemporary snowmelt runoff has been observed 10 to 30 days early in comparison
to the period from 1951 to1980 (see figure 9).40
To adapt to these changes, the ability to modify
operational rules and water allocations is critical to ensuring the reliability of water and energy
supplies, as well as to protecting the environment and critical infrastructure. However, the
current set of laws, regulations, and agreements is intricate and creates institutional and legal
barriers to such changes in both the short and long term.41
In 2010, the Pacific Northwest experienced the third driest year in the last 50 years and the fifth
lowest water level on record since 1929, causing low runoff in the lower Columbia River.42
According to BPA‘s 2010 Annual Report, BPA‘s gross purchased power increased $104 million,
38
1997 Pacific Northwest Coordination Agreement (PNCA), June 18, 1997,
http://www.nwd-wc.usace.army.mil/PB/oper_planning/97PNCA_Conformed.pdf, accessed January 25, 2011. 39
Bates, B.C., Z.W. Kundzewicz, S. Wu, and J.P. Palutikof (eds.), 2008: Climate Change and Water. Technical
paper of the Intergovernmental Panel on Climate Change. IPCC Secretariat, Geneva, Switzerland, available at
http://www.ipcc.ch/pdf/technical-papers/climate-change-water-en.pdf, accessed June 29, 2011. 40
Stewart, I.T., D.R. Cayan, and M.D. Dettinger, 2004: Changes in snowmelt runoff timing in western North
America under a ‗business as usual‘ climate change scenario. Climatic Change,
http://meteora.ucsd.edu/cap/stewart_clch.pdf, accessed June 29, 2011. 41
Ingram, H., D. Feldman, N. Mantua, K.L. Jacobs, D. Fort, N. Beller-Simms, and A. M. Waple, 2008: The
Changing Context. In: Decision-Support Experiments and Evaluations using Seasonal-to-Interannual Forecasts and
Observational Data: A Focus on Water Resources. A Report by the U.S. Climate Change Science Program and the
Subcommittee on Global Change Research [Nancy Beller-Simms, Helen Ingram, David Feldman, Nathan Mantua,
Katharine L. Jacobs, and Anne M. Waple (eds.)]. NOAA‘s National Climatic Data Center, Asheville, NC, pp. 7-28. 42
Kevin McCullen, ―Low snowpack to cost BPA projected $233M,‖ Tri-city Herald, May 4, 2010,
http://www.tri-cityherald.com/2010/05/04/1001094/low-snowpack-to-cost-bpa-projected.html, accessed November
20, 2010.
September 2011 19
or 37 percent, from
2009, mainly due to
below normal basin-
wide precipitation and
streamflows, resulting in
insufficient power
generation to fulfill load
obligations.43
As a result, BPA
experienced a net loss of
$233 million, or 10
percent, from the prior
year due to reduced
hydropower generation.
Despite the below-
normal hydroelectric
generation, electricity
supply to customers
remained adequate in the
Pacific Northwest and rates were unaffected. The rates to customers were unaffected because the
rates BPA charges customers were locked in for two years. However, the rates are expected to go
up by five to six percent in 2011 when contracts are reviewed due to uncertainties around
continuing low water supplies as well as ongoing litigation over salmon conservation in the
lower Columbia River basin that is intricately tied to hydropower operation.44
Not only droughts, but too much water can also bring challenges to hydropower operation. After
a dry winter, spring 2010 river flows were expected to stay fairly low. However, in June 2010, a
strong Pacific storm system brought heavy precipitation that almost doubled the streamflows in
the Columbia River.45
During the month of June, dam operators faced the challenges of
managing flooding and an oversupply of hydropower and, at the same time, complying with
Federal regulations for fish protection that restricted the amount of spill allowed. Since water
that goes through power turbines does not increase dissolved gas levels, thus maintaining safe
conditions for fish, dam operators were forced to produce power for which they could not find a
market.46
As a result, BPA disposed of more than 50,000 MWh of electricity for free or for less
43
2010 Annual Report, BPA, http://www.bpa.gov/corporate/finance/a_report/10/AR2010.pdf, accessed January 4,
2011. 44
Jim Mann, the Western News, November 16, 2010, http://www.thewesternnews.com/news/article_3435b546-
f1ea-11df-b434-001cc4c002e0.html?mode=print, accessed December 30, 2010. 45
―Columbia River high-water operations, [June 1-14, 2010],‖ BPA, September 2010,
http://www.bpa.gov/corporate/pubs/final-report-columbia-river-high-water-operations.pdf, accessed March 15,
2011. 46
Excessive spill is restricted because it can produce very high concentrations of total dissolved gas in the water that
can cause gas bubble trauma in fish. See Statement on Environmental Redispatch and Negative Pricing, BPA,
December 3, 2010,
http://www.bpa.gov/corporate/AgencyTopics/ColumbiaRiverHighWaterMgmnt/Environmental%20Redispatch%20s
tatement.pdf, accessed March 15, 2011.
Figure 9. Observed Changes in Timing of Center of Mass of
Flow (CT), 1948-2000 (Reference Time Period: 1951-1980)
Source: Stewart et al. (see footnote 40)
September 2011 20
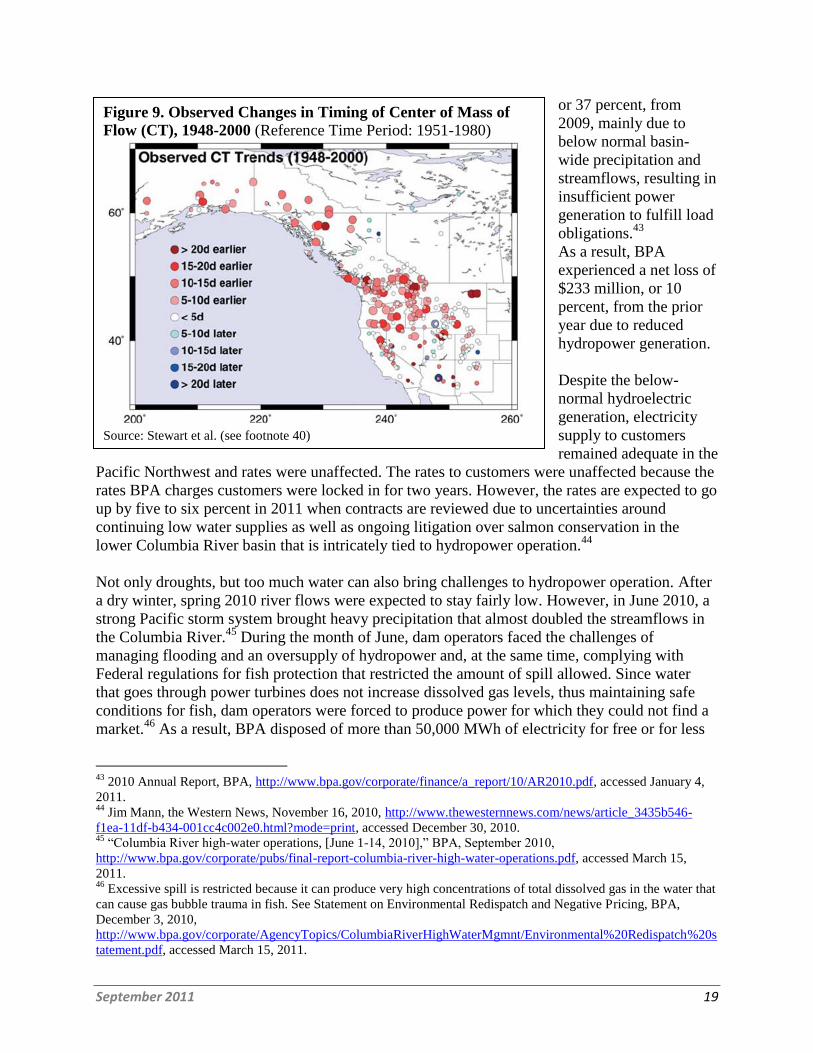
than the cost of transmission and incurred a total of 745,000 MWh of spill for lack of market in
June 2010.47
Figure 10 shows that BPA balancing authority generation significantly exceeded
load in early June.
High flows in the Columbia River system are common, resulting from above average snowpack
and/or early warming periods that result in rapid snowmelt. However, operating the Columbia
River system through those events has become much more complex in recent years due to the
following new factors: 1) multiple flow and storage requirements to protect threatened and
endangered salmon and steelhead under the Endangered Species Act; 2) changing uses of the
transmission system in a deregulated electric power market; and 3) the significant addition of
variable, non-dispatchable wind power capacity (3,400 MW as of February 2011) with financial
incentives for operation—production tax credits of $21 per MWh and renewable energy credits
of $20 per MWh.48
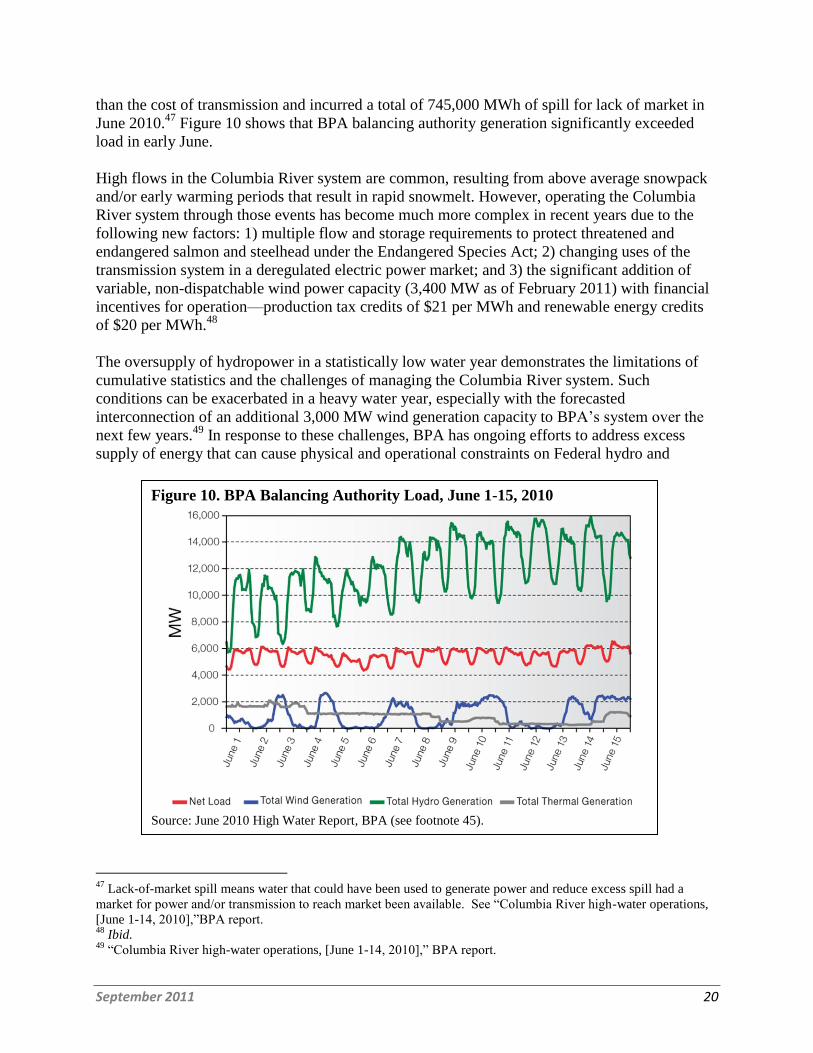
The oversupply of hydropower in a statistically low water year demonstrates the limitations of
cumulative statistics and the challenges of managing the Columbia River system. Such
conditions can be exacerbated in a heavy water year, especially with the forecasted
interconnection of an additional 3,000 MW wind generation capacity to BPA‘s system over the
next few years.49
In response to these challenges, BPA has ongoing efforts to address excess
supply of energy that can cause physical and operational constraints on Federal hydro and
47
Lack-of-market spill means water that could have been used to generate power and reduce excess spill had a
market for power and/or transmission to reach market been available. See ―Columbia River high-water operations,
[June 1-14, 2010],‖BPA report. 48
Ibid. 49
―Columbia River high-water operations, [June 1-14, 2010],‖ BPA report.
Figure 10. BPA Balancing Authority Load, June 1-15, 2010
Source: June 2010 High Water Report, BPA (see footnote 45).
September 2011 21
transmission system operations.50
In May 2011, BPA adopted the Final Record of Decision on
the Interim Environmental Redispatch and Negative Pricing Policy (Interim Policy) that would
be implemented during high water and high wind events. 51
The purpose of the Interim Policy is
to assure that the system is able to comply with environmental mandates while allowing reliable
and equitable power production in the BPA balancing authority area. It proposes to achieve this
by 1) limiting generation at coal, natural gas, and other thermal power plants to keep the supply
of power from exceeding demand and 2) allowing temporary curtailment of wind generation
connected to its power transmission system. Furthermore, BPA would not pay negative prices if
it needed to generate electricity to meet environmental requirements. BPA continues to work
with its regional partners to seek long-term solutions as the Interim Policy is set to expire after
March 30, 2012.
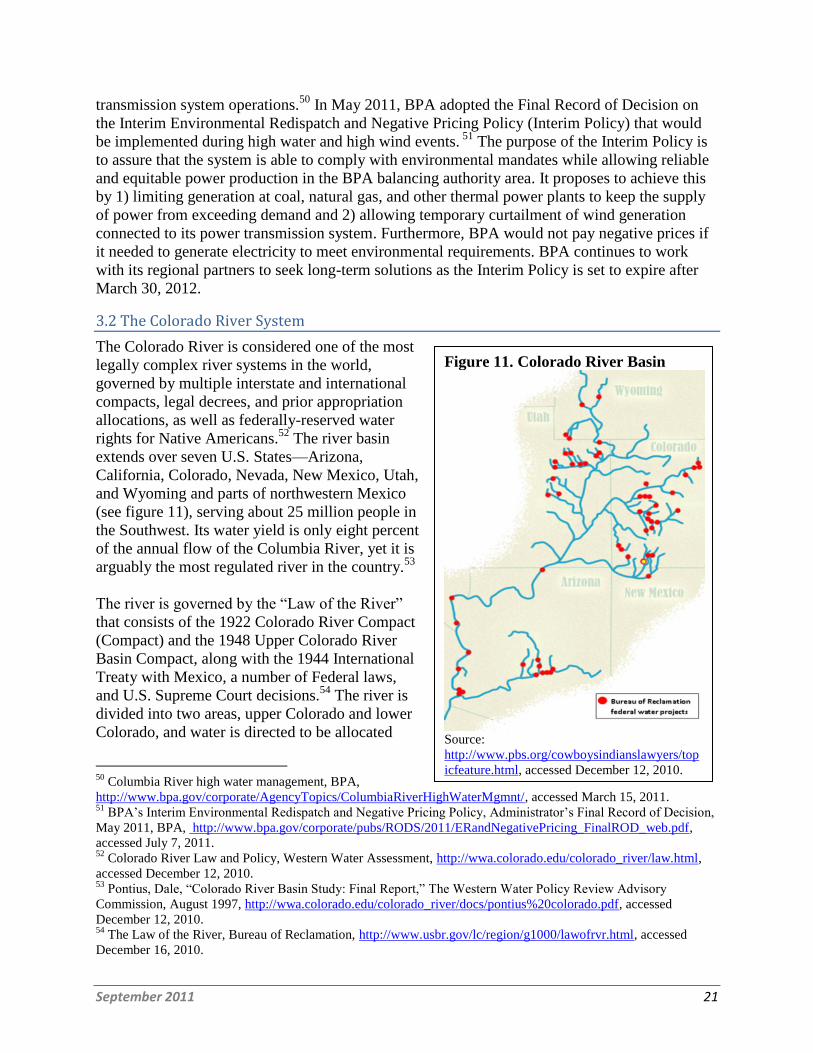
3.2 The Colorado River System
The Colorado River is considered one of the most
legally complex river systems in the world,
governed by multiple interstate and international
compacts, legal decrees, and prior appropriation
allocations, as well as federally-reserved water
rights for Native Americans.52
The river basin
extends over seven U.S. States—Arizona,
California, Colorado, Nevada, New Mexico, Utah,
and Wyoming and parts of northwestern Mexico
(see figure 11), serving about 25 million people in
the Southwest. Its water yield is only eight percent
of the annual flow of the Columbia River, yet it is
arguably the most regulated river in the country.53
The river is governed by the ―Law of the River‖
that consists of the 1922 Colorado River Compact
(Compact) and the 1948 Upper Colorado River
Basin Compact, along with the 1944 International
Treaty with Mexico, a number of Federal laws,
and U.S. Supreme Court decisions.54
The river is
divided into two areas, upper Colorado and lower
Colorado, and water is directed to be allocated
50
Columbia River high water management, BPA,
http://www.bpa.gov/corporate/AgencyTopics/ColumbiaRiverHighWaterMgmnt/, accessed March 15, 2011. 51
BPA‘s Interim Environmental Redispatch and Negative Pricing Policy, Administrator‘s Final Record of Decision,
May 2011, BPA, http://www.bpa.gov/corporate/pubs/RODS/2011/ERandNegativePricing_FinalROD_web.pdf,
accessed July 7, 2011. 52
Colorado River Law and Policy, Western Water Assessment, http://wwa.colorado.edu/colorado_river/law.html,
accessed December 12, 2010. 53
Pontius, Dale, ―Colorado River Basin Study: Final Report,‖ The Western Water Policy Review Advisory
Commission, August 1997, http://wwa.colorado.edu/colorado_river/docs/pontius%20colorado.pdf, accessed
December 12, 2010. 54
The Law of the River, Bureau of Reclamation, http://www.usbr.gov/lc/region/g1000/lawofrvr.html, accessed
December 16, 2010.
Figure 11. Colorado River Basin
Source:
http://www.pbs.org/cowboysindianslawyers/top
icfeature.html, accessed December 12, 2010.
September 2011 22
equally between the two regions based on historical rainfall patterns. However, the Compact that
regulates the water allocation is believed to have been negotiated in a period of abnormally high
rainfall, resulting in allocation of water greater than the sustainable quantity.55
Consequently, the
river has been the source of disputes among States, between the United States and Mexico,
between cities and farms, between power users and conservationists, and between Indian tribes
and non-Indian water users.56
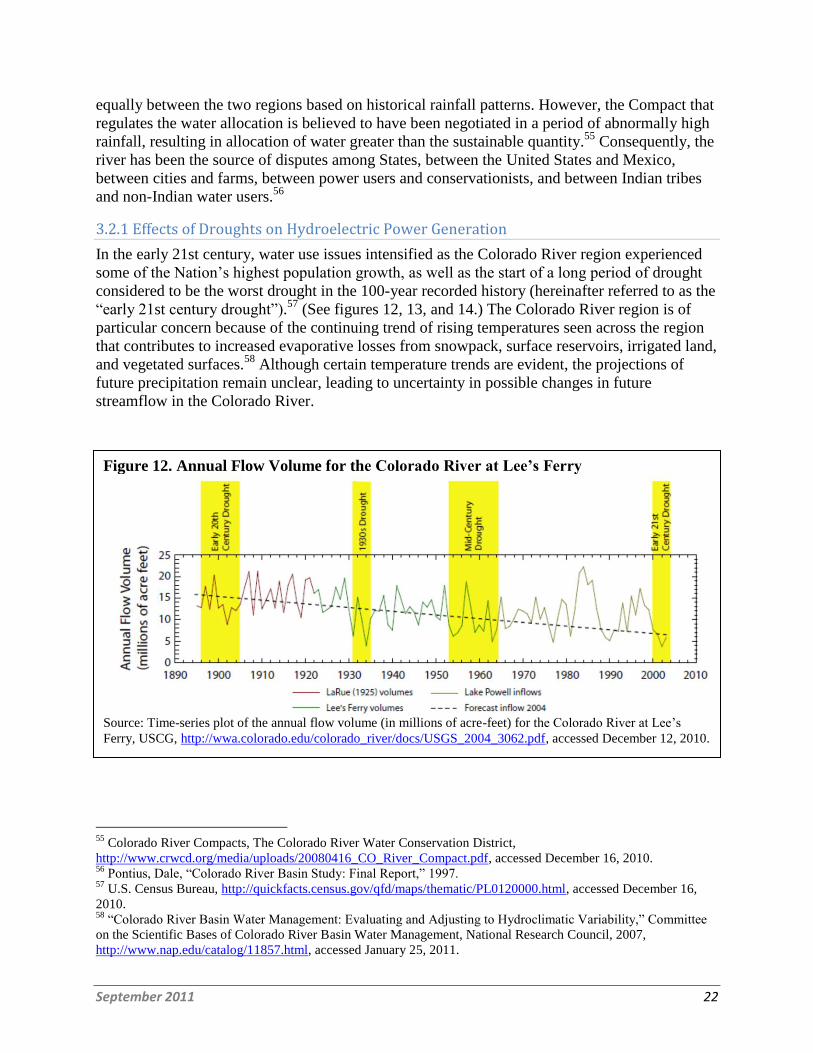
3.2.1 Effects of Droughts on Hydroelectric Power Generation
In the early 21st century, water use issues intensified as the Colorado River region experienced
some of the Nation‘s highest population growth, as well as the start of a long period of drought
considered to be the worst drought in the 100-year recorded history (hereinafter referred to as the
―early 21st century drought‖).57
(See figures 12, 13, and 14.) The Colorado River region is of
particular concern because of the continuing trend of rising temperatures seen across the region
that contributes to increased evaporative losses from snowpack, surface reservoirs, irrigated land,
and vegetated surfaces.58
Although certain temperature trends are evident, the projections of
future precipitation remain unclear, leading to uncertainty in possible changes in future
streamflow in the Colorado River.
55
Colorado River Compacts, The Colorado River Water Conservation District,
http://www.crwcd.org/media/uploads/20080416_CO_River_Compact.pdf, accessed December 16, 2010. 56
Pontius, Dale, ―Colorado River Basin Study: Final Report,‖ 1997. 57
U.S. Census Bureau, http://quickfacts.census.gov/qfd/maps/thematic/PL0120000.html, accessed December 16,
2010. 58
―Colorado River Basin Water Management: Evaluating and Adjusting to Hydroclimatic Variability,‖ Committee
on the Scientific Bases of Colorado River Basin Water Management, National Research Council, 2007,
http://www.nap.edu/catalog/11857.html, accessed January 25, 2011.
Figure 12. Annual Flow Volume for the Colorado River at Lee’s Ferry
Source: Time-series plot of the annual flow volume (in millions of acre-feet) for the Colorado River at Lee‘s
Ferry, USCG, http://wwa.colorado.edu/colorado_river/docs/USGS_2004_3062.pdf, accessed December 12, 2010.
September 2011 23
A number of activities have been underway to cope with drought in the Colorado River region.
The Colorado River basin States have engaged in long-range water planning, drought
management, and conservation measures.59
In 2005, Reclamation launched an effort to develop
strategies for improving coordinated management of the two largest reservoirs in the river, Lakes
Mead and Powell, during drought and low reservoir conditions. Lakes Mead and Powell
comprise approximately 80 percent of the basin‘s entire storage capacity.60
59
Ibid.; These include a statewide water supply initiative in Colorado in 2004, Arizona Drought Preparedness Plan
of 2004, as well as the incorporation of climate change into water management in California in 2006. 60
Pontius, Dale, ―Colorado River Basin Study: Final Report,‖ 1997.
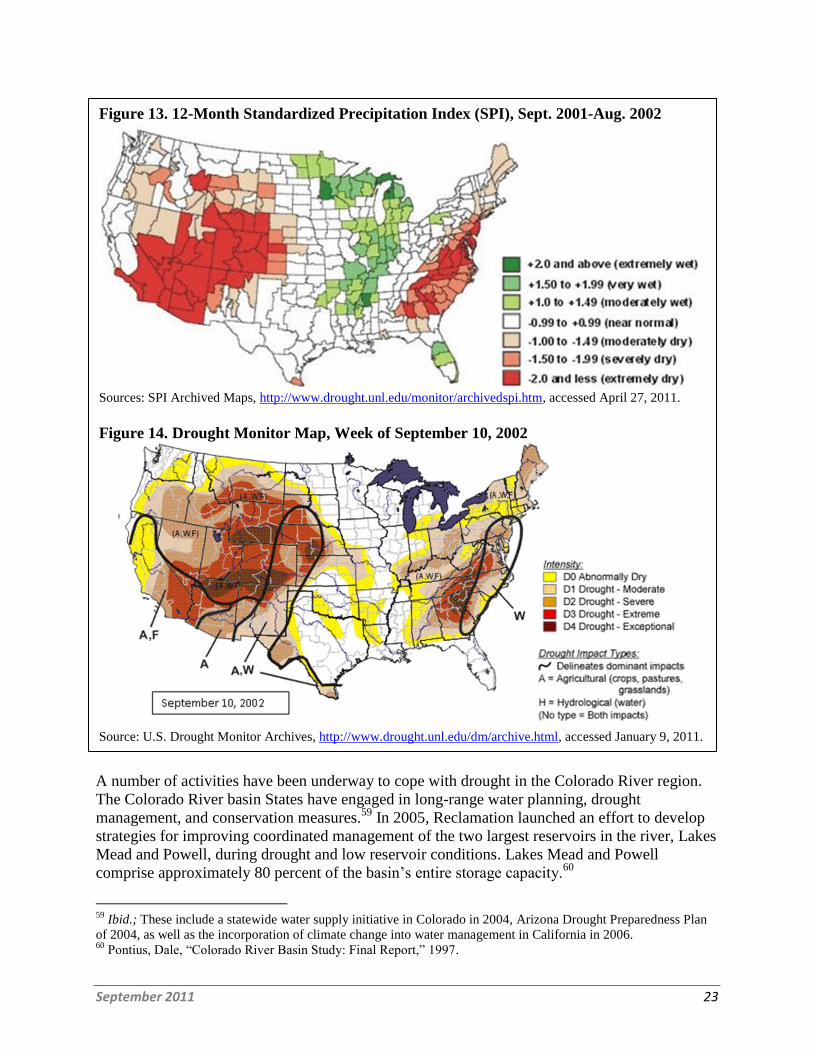
Figure 13. 12-Month Standardized Precipitation Index (SPI), Sept. 2001-Aug. 2002
Sources: SPI Archived Maps, http://www.drought.unl.edu/monitor/archivedspi.htm, accessed April 27, 2011.
Figure 14. Drought Monitor Map, Week of September 10, 2002
Source: U.S. Drought Monitor Archives, http://www.drought.unl.edu/dm/archive.html, accessed January 9, 2011.
September 2011 24
The Reclamation-led effort resulted in the development of the Colorado River Interim
Guidelines for Lower Basin Shortages and Coordinated Operations for Lake Powell and Lake
Mead (Interim Guidelines) that sought to address the unique challenges in the operation of the
Colorado River. 61
This effort included an environmental review and public scoping meetings
during which many stakeholders raised concerns relating to dam operations during drought and
low reservoir conditions. However, some stakeholders expressed a need to consider other water
supply, water management, and operational strategies or programs that could improve the
availability and reliability of Colorado River water supplies.
Some of the most frequently raised comments during an environmental impact statement (EIS)
process included:
Consider/evaluate costs and benefits of decommissioning the Glen Canyon Dam,
Consider/evaluate transfer of Lake Powell and Lake Mead storage to groundwater
aquifers, and
Update the Compact to reflect the Colorado River‘s supply limitations and changing
societal demands.62
In December 2007, a record of decision was issued, officially adopting the Interim Guidelines,
including four new operational rules and guidelines that:
Establish conditions for shortages, specifying when and who will take reductions in the
allocated water (this is essential for prudent water planning in times of drought);
Allow the water level in Lake Powell and Lake Mead to rise and fall in tandem, thereby
better sharing the risk of drought;
Allow DOI to allocate surplus water should there be abundant runoff in the basin; and
Address the ongoing drought by encouraging new initiatives for water conservation.63
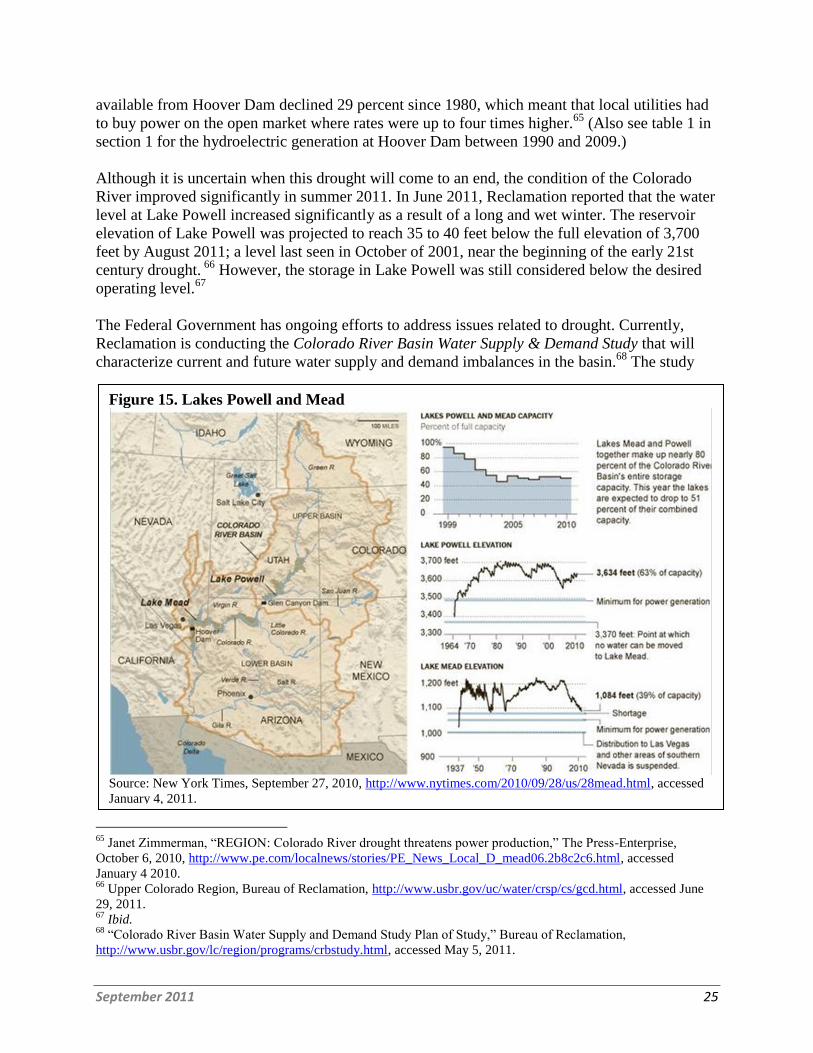
Figure 15 shows the historical elevation level at Lakes Mead and Powell. In October 2010, Lake
Mead stood at 39 percent capacity or 1,084 feet in elevation, curtailing power generation at the
Hoover Dam, the region‘s largest hydro facility. For every foot of elevation lost in Lake Mead,
Hoover Dam produces 5.7 MW less power. That is because at lower water levels air bubbles
flow through with the water causing the turbines to lose efficiency.64
As a result, electricity
61
―Colorado River Interim Guidelines for Lower Basin Shortages and Coordinated Operations for Lakes Powell and
Mead,‖ Bureau of Reclamation, http://www.usbr.gov/lc/region/programs/strategies/about.html, accessed December
17, 2010. 62
Scoping Summary Report for Colorado River Interim Guidelines, Appendix V Summary of Issues Raised in
Comments Grouped by Resource/Issue Area, Bureau of Reclamation, March 2006,
http://www.usbr.gov/lc/region/programs/strategies/scopingreport/Appendices/AppV.pdf, accessed October 13, 2011. 63
The Record of Decision, Colorado River Interim Guidelines for Lower Basin Shortages and Coordinated
Operations for Lakes Powell and Mead, Bureau of Reclamation,
http://www.usbr.gov/lc/region/programs/strategies/RecordofDecision.pdf, and ―Secretary Kempthorne Signs
Historic Decision For New Colorado River Management Strategies,‖ U.S. Department of Interior, December 13,
2007, http://www.doi.gov/archive/news/07_News_Releases/071213.html, accessed January 27, 2011. 64
Eric Wolff, ―ENERGY: Hoover Dam could stop generating electricity as soon as 2013, official fear,‖ North
County Times, September 11, 2010, http://www.nctimes.com/business/article_b7e44e9e-087d-53b2-9c49-
7ea32262c9a9.html, accessed November 20, 2010.
September 2011 25
available from Hoover Dam declined 29 percent since 1980, which meant that local utilities had
to buy power on the open market where rates were up to four times higher.65
(Also see table 1 in
section 1 for the hydroelectric generation at Hoover Dam between 1990 and 2009.)
Although it is uncertain when this drought will come to an end, the condition of the Colorado
River improved significantly in summer 2011. In June 2011, Reclamation reported that the water
level at Lake Powell increased significantly as a result of a long and wet winter. The reservoir
elevation of Lake Powell was projected to reach 35 to 40 feet below the full elevation of 3,700
feet by August 2011; a level last seen in October of 2001, near the beginning of the early 21st
century drought. 66
However, the storage in Lake Powell was still considered below the desired
operating level.67
The Federal Government has ongoing efforts to address issues related to drought. Currently,
Reclamation is conducting the Colorado River Basin Water Supply & Demand Study that will
characterize current and future water supply and demand imbalances in the basin.68
The study
65
Janet Zimmerman, ―REGION: Colorado River drought threatens power production,‖ The Press-Enterprise,
October 6, 2010, http://www.pe.com/localnews/stories/PE_News_Local_D_mead06.2b8c2c6.html, accessed
January 4 2010. 66
Upper Colorado Region, Bureau of Reclamation, http://www.usbr.gov/uc/water/crsp/cs/gcd.html, accessed June
29, 2011. 67
Ibid. 68
―Colorado River Basin Water Supply and Demand Study Plan of Study,‖ Bureau of Reclamation,
http://www.usbr.gov/lc/region/programs/crbstudy.html, accessed May 5, 2011.
Figure 15. Lakes Powell and Mead
Source: New York Times, September 27, 2010, http://www.nytimes.com/2010/09/28/us/28mead.html, accessed
January 4, 2011.
September 2011 26
will also develop and analyze adaptation and mitigation strategies to resolve those imbalances,
and is scheduled to conclude in July 2012. In addition, Reclamation issued a $3.4 million
contract to upgrade generating facilities at the Hoover Dam in April 2010.69
Per the contract, a
new turbine will be installed to allow the generating units to operate more efficiently over a wide
range of water levels, enabling Hoover Dam to generate power at lake levels as low as 1,000
feet. The new turbine is expected to be delivered in early 2012 and, if successful, several of the
other 16 turbines would be replaced by 2016. More information on the historical operations of
the Colorado River, as well as information on operations for the upcoming year, can be found in
the Colorado River Annual Operating Plans.70
Below is a brief summary of a case study investigating the economic impacts of restricted
operations at the Glen Canyon Dam under an operational strategy called the Modified Low
Fluctuating Flows (MLFF) Alternative.71
The MLFF, which was designed to minimize negative
impacts on the downstream environment, was developed as a result of a multi-year EIS process
initiated in early 1990. As approved by the record of decision on October 8, 1996, it is the
current operating regime for the Glen Canyon Dam.
69
James Cartledge, ―Hoover Dam turbines set for upgrade to cope with drought,‖ Brighterenergy.org, April 19,
2010, http://www.brighterenergy.org/9098/news/marine-hydro/hoover-dam-turbines-set-for-upgrade-to-cope-with-
drought/, accessed November 20, 2010. 70
Annual Operating Plans, Upper Colorado Region, Bureau of Reclamation,
http://www.usbr.gov/uc/water/rsvrs/ops/aop/index.html, accessed December 16, 2010. 71
Record of Decision, Operation of Glen Canyon Dam, Final Environmental Impact Statement, Bureau of
Reclamation, October 8, 1996, http://www.usbr.gov/uc/rm/amp/pdfs/sp_appndxG_ROD.pdf, accessed October 13,
2011.
Economic Impacts of Restricted Operations at Glen Canyon Dam: Glen Canyon Dam is a large hydropower facility (see table 1) on the Colorado River in Arizona, designed and operated historically to produce power primarily during on-peak periods when it is most valuable. However, the production of peaking power resulted in large fluctuations in downstream releases that caused considerable adverse impacts on the downstream environment. To mitigate these impacts, DOI initiated a new operational strategy in 1996 called the Modified Low Fluctuating Flows . The MLFF set new restrictions on maximum and minimum flows, ramp rates, and the daily change in flow, with the goal of protecting downstream resources while allowing efficient power production. The new restrictions reduced the generating capacity and limited the ability of the hydropower plant to respond to changes in load in such a way that less energy is generated during the on-peak hours and more energy is generated during the off-peak hours when it is less valuable. A study by Argonne National Laboratory evaluated power economic impacts and compared the results to the economic analysis performed prior to the MLFF. It estimated the annual economic loss resulting from the MLFF implementation to range from approximately $15.1 million to $44.2 million in terms of 1991 dollars ($1991). Source: Ex Post Power Economic Analysis of Record of Decision Operational Restrictions at Glen Canyon Dam, Argonne National Laboratory, July 2010.
September 2011 27
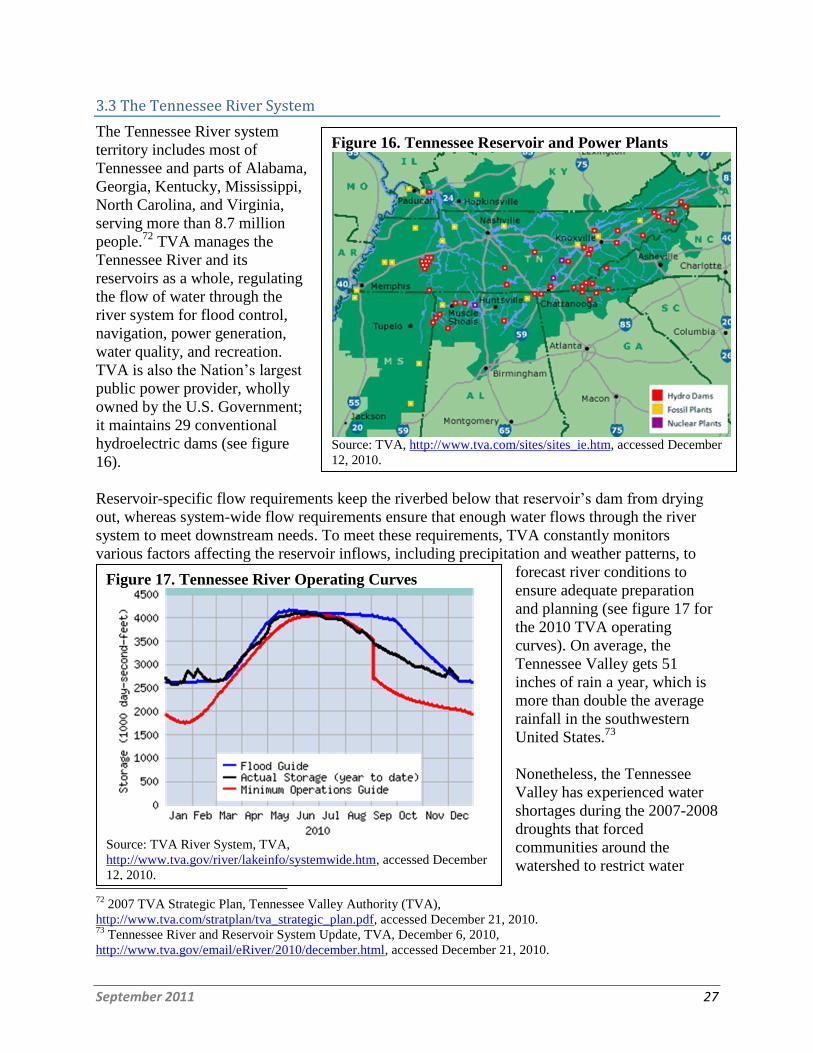
3.3 The Tennessee River System
The Tennessee River system
territory includes most of
Tennessee and parts of Alabama,
Georgia, Kentucky, Mississippi,
North Carolina, and Virginia,
serving more than 8.7 million
people.72
TVA manages the
Tennessee River and its
reservoirs as a whole, regulating
the flow of water through the
river system for flood control,
navigation, power generation,
water quality, and recreation.
TVA is also the Nation‘s largest
public power provider, wholly
owned by the U.S. Government;
it maintains 29 conventional
hydroelectric dams (see figure
16).
Reservoir-specific flow requirements keep the riverbed below that reservoir‘s dam from drying
out, whereas system-wide flow requirements ensure that enough water flows through the river
system to meet downstream needs. To meet these requirements, TVA constantly monitors
various factors affecting the reservoir inflows, including precipitation and weather patterns, to
forecast river conditions to
ensure adequate preparation
and planning (see figure 17 for
the 2010 TVA operating
curves). On average, the
Tennessee Valley gets 51
inches of rain a year, which is
more than double the average
rainfall in the southwestern
United States.73
Nonetheless, the Tennessee
Valley has experienced water
shortages during the 2007-2008
droughts that forced
communities around the
watershed to restrict water
72
2007 TVA Strategic Plan, Tennessee Valley Authority (TVA),
http://www.tva.com/stratplan/tva_strategic_plan.pdf, accessed December 21, 2010. 73
Tennessee River and Reservoir System Update, TVA, December 6, 2010,
http://www.tva.gov/email/eRiver/2010/december.html, accessed December 21, 2010.
Figure 17. Tennessee River Operating Curves
Source: TVA River System, TVA,
http://www.tva.gov/river/lakeinfo/systemwide.htm, accessed December
12, 2010.
Figure 16. Tennessee Reservoir and Power Plants
Source: TVA, http://www.tva.com/sites/sites_ie.htm, accessed December
12, 2010.
September 2011 28
withdrawals and take conservation measures. In December 2010, Gary Springston, TVA
program manager for water supply, stated that the present situation was still tenuous and ―even
systems connected to the Tennessee River system could face conflicts between instream flow
needs to support water quality and aquatic life and withdrawals for offstream uses such as
public-water supply, industry, thermoelectric power generation, and irrigation.‖74
Water supply
concerns continue to increase due to population growth and interbasin transfers, especially since
the Tennessee River is surrounded by areas that may require more water to accommodate
growing needs.
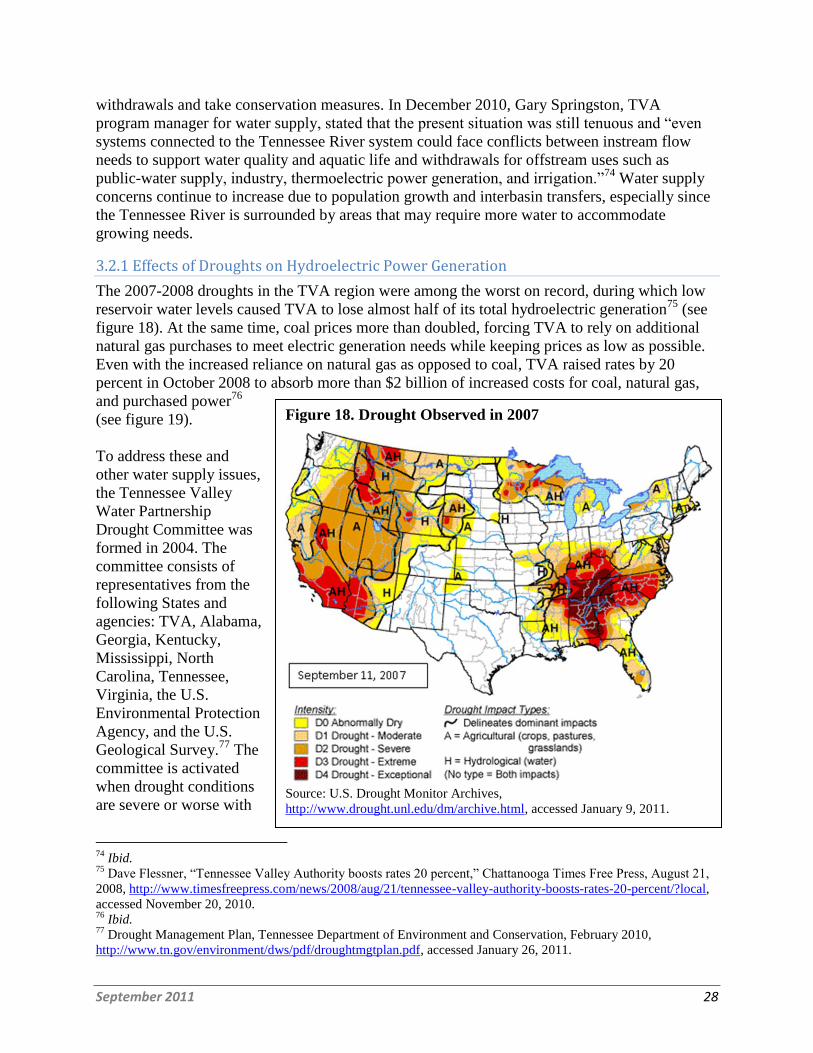
3.2.1 Effects of Droughts on Hydroelectric Power Generation
The 2007-2008 droughts in the TVA region were among the worst on record, during which low
reservoir water levels caused TVA to lose almost half of its total hydroelectric generation75
(see
figure 18). At the same time, coal prices more than doubled, forcing TVA to rely on additional
natural gas purchases to meet electric generation needs while keeping prices as low as possible.
Even with the increased reliance on natural gas as opposed to coal, TVA raised rates by 20
percent in October 2008 to absorb more than $2 billion of increased costs for coal, natural gas,
and purchased power76
(see figure 19).
To address these and
other water supply issues,
the Tennessee Valley
Water Partnership
Drought Committee was
formed in 2004. The
committee consists of
representatives from the
following States and
agencies: TVA, Alabama,
Georgia, Kentucky,
Mississippi, North
Carolina, Tennessee,
Virginia, the U.S.
Environmental Protection
Agency, and the U.S.
Geological Survey.77
The
committee is activated
when drought conditions
are severe or worse with
74
Ibid. 75
Dave Flessner, ―Tennessee Valley Authority boosts rates 20 percent,‖ Chattanooga Times Free Press, August 21,
2008, http://www.timesfreepress.com/news/2008/aug/21/tennessee-valley-authority-boosts-rates-20-percent/?local,
accessed November 20, 2010. 76
Ibid. 77
Drought Management Plan, Tennessee Department of Environment and Conservation, February 2010,
http://www.tn.gov/environment/dws/pdf/droughtmgtplan.pdf, accessed January 26, 2011.
Figure 18. Drought Observed in 2007
Source: U.S. Drought Monitor Archives,
http://www.drought.unl.edu/dm/archive.html, accessed January 9, 2011.

September 2011 29
tributary reservoir levels below the system minimum operating guidelines, and serves as a forum
for the exchange of information and views by the participants.
The Tennessee River Basin, like other major watersheds, crosses State lines. As noted in the
December 2010 Tennessee River and Reservoir system update from TVA, watersheds are natural
―systems that [do not] follow manmade jurisdictions, and effective water supply planning has to
reflect this reality. For example, drought conditions may exist throughout a particular watershed
that sits astride a State line. One State has imposed water conservation measures, while the other
has not. In the absence of a coordinated response to drought conditions, people living in the
‗downstream‘ State may experience water shortages. Water is a shared resource; [therefore, it is]
important to plan from a regional perspective.‖78
78
Tennessee River and Reservoir System Update, TVA, December 6, 2010,
http://www.tva.gov/email/eRiver/2010/december.html, accessed December 21, 2010.
Figure 19. TVA Generation Profile, 2005-2009
Source: Derived from EIA-906, EIA-920, EIA-923 databases,
http://www.eia.doe.gov/cneaf/electricity/page/eia906_920.html, accessed
November 30, 2010.
September 2011 30
Section 4: Discussions with Hydroelectric Facility Owners and Operators
The insights of owners and operators of hydroelectric facilities are essential in understanding not
only the day-to-day operation of critical hydropower infrastructure, but also the key issues that
the owners and operators must consider in their long-term planning. For that reason, DOE and
DHS engaged in discussions with senior hydroelectric facilities personnel who volunteered to
participate in this study.
The primary objective of the discussions was consistent with the purpose of the study as
described in section 1 – to examine the issues related to the effects of weather pattern variability
on the overall management of reservoirs and streamflows at dams. Discussion participants were
experienced operations personnel representing public and private owners and operators of hydro
conventional, pumped storage, and run-of-the-river hydroelectric plants. A hydropower
consumer organization representative also participated in the discussion. Owners and operators
from all geographic regions, with the exception of the Northeast, were represented in the
discussions.
There was substantial agreement among discussion participants that they were generally able to
produce power even in low water situations and that high water events could be more
problematic than low water events. They all agreed that the most significant issue facing them in
producing hydropower is competing demands for the use of the available water.
The storage capacity and conveyance flexibility of most impoundment facilities were designed to
accommodate local or regional historical patterns of hydrologic variability. Thus, episodic low
water conditions, as opposed to long-term drought conditions that could and have affected
hydropower production, are not critical contributors to reduced hydropower production;
scientific and technical advances can limit their effect. These same advances, however, do not
address the requirements for providing sufficient water for irrigation, environmental protection,
community and industrial uses, or transportation that in many cases are already in conflict. Low
water or drought conditions resulting from weather pattern variability will only heighten the
degree of competition for available water.
4.1 Low Water Condition Accommodations
The science of accommodating hydropower production to low water conditions lies in the
increasingly sophisticated modeling that allows optimization of the water that is available to
produce power. An owner of several dams indicated that the facilities are able to operate at low
water levels and they benefit if there is more water available for use than expected.
Technological advances can further optimize the use of available water through modernization.
Several operators reported that more generation can be achieved from lower head dams through
turbine upgrades. Such investment can realize a three to five year payback period as a result of
efficiency gains. An operator of hydroelectric facilities reported an increase of 560 MW in
overall hydro capacity through turbine upgrades at several facilities; another indicated that it
received tax credits for upgrades qualified under certain Federal energy efficiency programs.
September 2011 31
Pumped storage units are another technological approach to withstand the possibility of reduced
precipitation. In pumped storage facilities, water stored in a higher elevation reservoir is released
through turbines to a lower elevation reservoir to produce power during high demand periods.
The water is then pumped back up to the higher elevation reservoir using low-cost, off-peak
electric power. Pumped storage facilities are more resilient to unexpected weather pattern
changes, including extreme low water events, because the water used to produce power is stored
(in the reservoirs) and recycled (i.e., not released into the natural stream flow).
The discussion participants shared another way to cope with low water conditions –
hydroelectric power infrastructure modernization. However, they also indicated that costs
associated with infrastructure modernization can become an issue. Financial resources to design
and implement facility upgrades generally come through public funds and/or power sales for
publicly held hydropower infrastructure, and from rate increases approved by public utility
commissions for privately held facilities. Although payback periods could be as short as three to
five years for technology upgrades, as noted earlier, securing the initial investment can be
challenging.
Some owners have received offers from investors and other utility companies to enter into a
variety of energy savings performance contracts that would provide the initial investment for
modernization in return for a share of the subsequent increased energy production. None of the
participants indicated that they were presently involved in such contracts and several raised
concerns as to whether they could legally enter into such arrangements. The potential for
technology upgrades at some hydropower infrastructure may also be limited or made more
expensive due to the age or physical condition of the facility.
4.2 High Water Condition Impacts
High water conditions present a unique set of challenges that are more problematic than low
water conditions. Although operators want to retain as much water as possible in the reservoir for
hydropower production, storing it in the reservoir during high water conditions may be hard to
manage, as it might impact residences surrounding the reservoir.
Many dams have multiple missions; for some, the requirement for flood control takes precedence
over hydropower production. Adherence to this primary mission may require passing high
volumes of water through the dam turbines even though there may be low power demand. These
increased flows may also require downstream dams to pass through water and not be able to sell
the resulting power at a reasonable price. Even if flood control is not a facility mission, owners
do their best to avoid or minimize downstream harm when they manage high water conditions.
Debris buildup associated with flooding can be dangerous to the facility infrastructure and affect
operations. Trees, lumber, sheds, animals, and other debris can be swept into rivers from floods
and can build up against dams. The cost and personnel resources required to remove this debris
can be significant.
4.3 Competing Demands for Water
Hydroelectric facilities serve multiple purposes that can include flood control, recreation,
industrial and community water supply, irrigation, and transportation. The demands for water for
September 2011 32
these uses can come into conflict with hydropower production in terms of how much water can
be used for nonpower generation and the condition of the water associated with power
generation.
For multifunction facilities, the combination of existing water rights, treaties, contracts, laws, or
court cases determine who gets how much water and when they receive it. Modifying these
controlling forces to consider reduced water availability can be difficult because they may
involve multiple States and parties, and sometimes, international partners. In addition to these
legally binding obligations on water delivery, softer forces, such as providing or storing water to
protect recreational uses or the value of residences around the reservoir, can also limit the
availability of water for hydropower generation.
The condition of the water used in producing hydropower may also be heavily controlled through
Federal and State laws and regulations, operating permits and licenses, and court cases related to
the protection of natural resources and the environment. These controlling forces may stipulate
water conditions such as tail water temperature, streamflow, and dissolved oxygen levels.
Operating stipulations are primarily designed to protect species designated as threatened or
endangered under Federal or State laws. They may also serve to protect downstream banks,
channels, and river branches.
All discussion participants voiced their support for natural resources and environmental
protection; however, they also expressed concerns that hydropower production interests are not
always evenly represented when these environmental protection requirements are developed.
Several participants described examples of how compliance with these operating restrictions
limits optimal operation of hydropower facilities.
A hydropower operator indicated that certain facilities could not operate in certain months in
order to maintain the required tailwater temperature. Another noted that complying with the
required dissolved oxygen levels applicable to the facilities is decreasing turbine efficiency
thereby affecting facility performance. Requirements in one operator‘s permit specify minimum
flow schedules that are higher than the historical minimum flow. Maintaining the stipulated
streamflow requires generating power when there is no or low demand. Operators reported that
in cases such as these, a hydropower producer could be forced to incur costs to produce power.
Competing demands for water are already evidenced in several parts of the country.79
The
operational constraints associated with natural resource and environmental protection will only
increase in their intensity if projected climate change results in increasingly unpredictable water
availability.
79
Water Use Conflicts in the West: Implications of Reforming the Bureau of Reclamation‘s Water Supply Policies,
Congressional Budget Office, August 1997.
September 2011 33
Appendix A. Acronyms
BPA Bonneville Power Administration
CIPAC Critical Infrastructure Partnership Advisory Council
DHS U.S. Department of Homeland Security
DOE U.S. Department of Energy
DOI Department of Interior
EIA U.S. Energy Information Administration
MLFF Modified Low Fluctuating Flows
MW Megawatt
MWh Megawatt hours
NIPP National Infrastructure Protection Plan
NOAA National Oceanic and Atmospheric Administration
PNCA Pacific Northwest Coordination Agreement
SPI Standardized Precipitation Index
SSA Sector-Specific Agency
TVA Tennessee Valley Authority
USACE U.S. Army Corps of Engineers
USGS U.S. Geological Services
September 2011 34
Appendix B. Glossary of Terms
Black start Capability: refers to the ability of a generating unit or station to start operating and
delivering electric power without assistance from the electric system. Black start units are
essential to restart generation and restore power to the grid in the event of an outage.
Critical rule curve: defines the reservoir elevations that must be maintained to ensure that firm
hydro energy requirements can be met under the most adverse streamflows on record.
Drought: is a period of unusually persistent dry weather that persists long enough to cause
serious problems such as crop damage and/or water supply shortages. The severity of the drought
depends upon the degree of moisture deficiency, the duration, and the size of the affected area.
Drought can be defined in four different ways:
Meteorological: a measure of departure of precipitation from normal. Due to climatic
differences, what might be considered a drought in one location of the country may not
be a drought in another location;
Agricultural: refers to a situation where the amount of moisture in the soil no longer
meets the needs of a particular crop;
Hydrological: occurs when surface and subsurface water supplies are below normal; and
Socioeconomic: refers to the situation that occurs when physical water shortages begin to
affect people.80
Flood control curve: defines the drawdown required to ensure adequate space is available in the
reservoir to regulate the predicted runoff for the year without causing flooding downstream.
Peaking capacity: capacity of generating equipment normally reserved for operation during the
hours of highest daily, weekly, or seasonal loads. Some generating equipment may be operated at
certain times as peaking capacity and at other times to serve loads on an around-the-clock basis.
Renewable Energy Credits (RECs): represents the property rights to the environmental, social,
and other nonpower qualities of renewable electricity generation. A REC, and its associated
attributes and benefits, can be sold separately from the underlying physical electricity associated
with a renewable-based generation source.
Streamflow: the rate and volume of water flowing in various sections of a river.
Watershed: is the area of land that drains to a particular water body. A watershed is defined by
the highest elevations surrounding a water body, consistent with the concept that ―water runs
downhill.‖
80
―What is Drought?,‖ NOAA, http://www.wrh.noaa.gov/fgz/science/drought.php?wfo=fgz, accessed March 1,
2011.
September 2011 35
Appendix C. Study Methodology
DOE initiated this study in collaboration with DHS under the Critical Infrastructure Partnership
Advisory Council (CIPAC) framework.81
Under the CIPAC, critical infrastructure stakeholders
in government and private sectors formed a partnership model and a forum in which they can
engage in a broad spectrum of activities to support and coordinate critical infrastructure
protection, security, and resilience.82
In addition to reviewing the 2009 Sandia report, DOE conducted exhaustive Internet and
literature research on several related topics including drought, precipitation, weather changes,
streamflow regulation, water management and uses, as well as the operation of hydroelectric
facilities (see appendix F). DOE also examined EIA‘s annual electricity survey forms EIA-906,
EIA-920, EIA-923, and EIA-860 to investigate the historical pattern of electric power generation
and generating capacity. The focus of the analysis is on hydroelectric power generation at the
State level and the plant level in the last 20 years from 1990 to 2009.
The operation of, and planning at, hydroelectric facilities are driven by a number of factors that
are often unique to each watershed; therefore, DOE assessed several watersheds to help better
understand the function of hydroelectric dams in the context of a large river system. Based on the
amount of hydropower generation and the gravity of water-related concerns affecting
hydropower, the following three rivers were selected as an example: the Columbia River, the
Colorado River, and the Tennessee River. The reservoirs in these rivers serve multiple purposes,
many of which often conflict with one another, including public water supply, irrigation, flood
control, fish habitat protection, and power generation. DOE considered these issues that are often
heightened during low water periods when the availability of water diminishes.
Following a literature review, DOE and DHS engaged a small number of Dams Sector owners
and operators, both public and private, to seek their expertise and insight. The goal of the
discussions was to ascertain the most critical issues they are faced with today and in the near
future in their operation of hydroelectric facilities.
81
CIPAC is an operational mechanism that allows the discussion of sensitive information between public and
private sectors by providing a shield from the Federal Advisory Committee Act requirements. 82
Critical Infrastructure Partnership Advisory Council, DHS,
http://www.dhs.gov/files/committees/editorial_0843.shtm, accessed January 28, 2011.
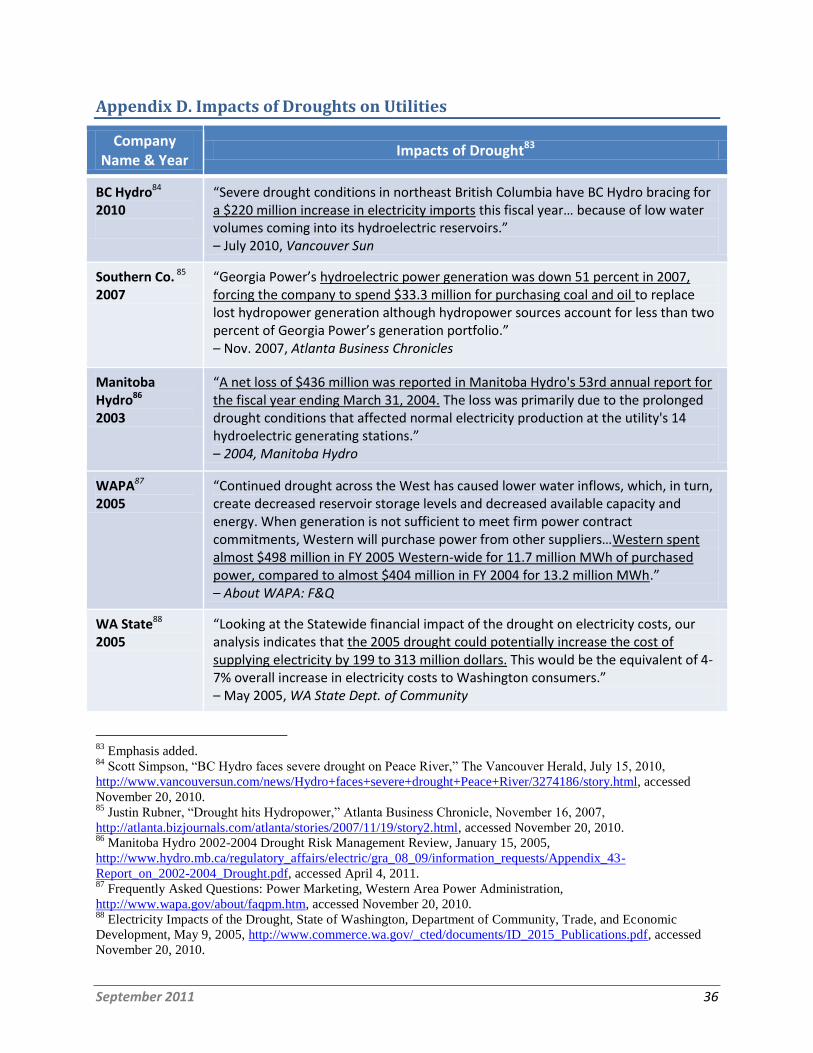
September 2011 36
Appendix D. Impacts of Droughts on Utilities
Company Name & Year
Impacts of Drought83
BC Hydro84 2010
“Severe drought conditions in northeast British Columbia have BC Hydro bracing for a $220 million increase in electricity imports this fiscal year… because of low water volumes coming into its hydroelectric reservoirs.” – July 2010, Vancouver Sun
Southern Co. 85 2007
“Georgia Power’s hydroelectric power generation was down 51 percent in 2007, forcing the company to spend $33.3 million for purchasing coal and oil to replace lost hydropower generation although hydropower sources account for less than two percent of Georgia Power’s generation portfolio.” – Nov. 2007, Atlanta Business Chronicles
Manitoba Hydro86 2003
“A net loss of $436 million was reported in Manitoba Hydro's 53rd annual report for the fiscal year ending March 31, 2004. The loss was primarily due to the prolonged drought conditions that affected normal electricity production at the utility's 14 hydroelectric generating stations.” – 2004, Manitoba Hydro
WAPA87 2005
“Continued drought across the West has caused lower water inflows, which, in turn, create decreased reservoir storage levels and decreased available capacity and energy. When generation is not sufficient to meet firm power contract commitments, Western will purchase power from other suppliers…Western spent almost $498 million in FY 2005 Western-wide for 11.7 million MWh of purchased power, compared to almost $404 million in FY 2004 for 13.2 million MWh.” – About WAPA: F&Q
WA State88 2005
“Looking at the Statewide financial impact of the drought on electricity costs, our analysis indicates that the 2005 drought could potentially increase the cost of supplying electricity by 199 to 313 million dollars. This would be the equivalent of 4-7% overall increase in electricity costs to Washington consumers.” – May 2005, WA State Dept. of Community
83
Emphasis added. 84
Scott Simpson, ―BC Hydro faces severe drought on Peace River,‖ The Vancouver Herald, July 15, 2010,
http://www.vancouversun.com/news/Hydro+faces+severe+drought+Peace+River/3274186/story.html, accessed
November 20, 2010. 85
Justin Rubner, ―Drought hits Hydropower,‖ Atlanta Business Chronicle, November 16, 2007,
http://atlanta.bizjournals.com/atlanta/stories/2007/11/19/story2.html, accessed November 20, 2010. 86
Manitoba Hydro 2002-2004 Drought Risk Management Review, January 15, 2005,
http://www.hydro.mb.ca/regulatory_affairs/electric/gra_08_09/information_requests/Appendix_43-
Report_on_2002-2004_Drought.pdf, accessed April 4, 2011. 87
Frequently Asked Questions: Power Marketing, Western Area Power Administration,
http://www.wapa.gov/about/faqpm.htm, accessed November 20, 2010. 88
Electricity Impacts of the Drought, State of Washington, Department of Community, Trade, and Economic
Development, May 9, 2005, http://www.commerce.wa.gov/_cted/documents/ID_2015_Publications.pdf, accessed
November 20, 2010.
September 2011 37
Appendix E. 2009 Sandia Report
The work conducted in this report builds upon prior energy and water research conducted by
Sandia National Laboratories – New Mexico and issued in a report titled, Energy and Water
Sector Policy Strategies for Drought Mitigation. The following summary of that report focuses
on the use of water for fossil-fuel fired power generation – cooling in thermoelectric power
plants and in movement of coal by barge. Unless otherwise noted, information and data
presented in the section below are taken from the 2009 Sandia report.
Water Use in Cooling Thermoelectric Power Plants
Water is used as the primary coolant in the condensers in both steam and natural gas-fired,
combined cycle plants; the amount of water used for cooling in these plants can be significant,
depending on the type of cooling system used. Plants that use "once-through" or "open-loop"
cooling systems withdraw large amounts of water from nearby surface water sources. This water
passes through a condenser as a coolant and, in doing so, transfers heat energy from the hot
steam to the coolant water, raising the temperature of the water. After moving through the
condenser, the water is released to the original lake, pond, or river source. The increased
temperature of the discharge water also increases the rate of evaporation for the body of water.
The quantity of water lost from the hydrological system by evaporation caused by elevated
temperatures is said to be ―consumed.‖
Closed-loop cooling systems withdraw smaller volumes of water than open-loop systems
because they involve a mechanism for circulating a portion of the coolant water.89
Other closed-
loop systems use cooling towers. In wet cooling towers, hot water that is discharged from the
condenser is sprayed over metal plates while a fan blows cool air up the tower. The water that
evaporates is considered to be consumed, while the remaining water falls down the tower and
can be returned to the condenser. Dry cooling towers pump the hot water in small pipes down the
tower as fans blow cool air over the pipes. The cooled water is returned to the condenser. This
cooling approach is considerably more expensive to operate and is inefficient in hot, arid
climates.
Water use and consumption data indicate that fossil and nuclear steam turbines with open-loop
systems operate with high water use intensity.90
In 2005, power plants equipped with once-
through cooling systems accounted for 92 percent of water withdrawals for thermoelectric power
while plants equipped with re-circulating systems withdrew the remaining 8 percent.91
Cooling
technologies that require less water and allow for the production of thermoelectric power are
common in areas where water is scarce or strictly managed such as Nevada, New Mexico, and
Utah.
89
Closed-loop cooling systems that use cooling ponds withdraw cool water from the bottom of the ponds to
dissipate the heat and cool the water. Nonetheless, some evaporation from the cooling ponds is produced. 90
Hightower, M., Energy and Water: Overview of Emerging Issues and Challenges, DOE/EIA 2010 Energy
Conference. 91
USGS Circular 1344, United States Geological Survey, October 2009.
September 2011 38
Coal Transport by Barge
Transportation on the inland waterways and Great Lakes is an important element of the domestic
coal distribution system, carrying approximately 20 percent of the Nations‘ coal, enough to
produce 10 percent of U.S. electricity annually.92
Barge transport is often used to transfer coal
from the initial source to a railroad, from a railroad to the coal-fired power plant, or the entire
distance from the mine to the plant. Barge traffic is particularly important in the Midwestern and
Eastern States, with 80 percent of shipments originating in States along the Ohio River. The
amount of waterborne transported coal has remained relatively constant over the last two
decades.93
Barge transport and the amount transported on a single barge are dependent upon the depth of the
river on which the barge travels. Reducing the barge load is costly. Losing one foot of draft
typically means losing 17 tons of cargo on a single barge and 255 tons on a typical 15-barge tow.
In addition, idle tow-boats cost shipping companies $5,000 - $10,000 per day.94
Droughts have
the potential to reduce the rate at which all goods, including coal, can be transported by barge.
Some river systems, like the Missouri River, have a system of reservoirs that are used to control
river depths. When river levels are low, water is released from the reservoirs to increase river
depths and permit barge travel. To mitigate the potential for low water levels to significantly
disrupt electric power generation, most coal-burning plants with barge access can also receive
coal shipments by rail. However, because barge is the cheapest mode of transportation, utilities
pay a higher rate for transportation.
Environmental Concerns
Thermoelectric power water withdrawals have been affected by limited water availability in
some areas of the United States and also by sections of the Clean Water Act that regulate cooling
system thermal discharges and mandate the best use of available technology for minimizing
environmental effects of cooling water intake. Consequently, since the 1970s, power plants have
increasingly been built with, or converted to, cooling towers, ponds, or dry re-circulating systems
instead of once-through cooling systems.95
By affecting the availability of cooling water, drought has had an impact on the production of
electricity from thermoelectric power plants. The problem for power plants becomes acute when
river, lake, or reservoir water levels fall near or below the level of the water intakes used for
drawing water for cooling. A related problem occurs when the temperature of the surface water
increases to the point where the water can no longer be used for cooling. The Southeast
experienced particularly acute drought conditions in August 2007, which forced the shutdown of
some nuclear power plants and curtailed operations at others in order to avoid exceeding
92
American Waterway Operators, www.americanwaterways.com/industry_stats/index.html, accessed December 16,
2010. 93
Coal: Research and Development to Support National Energy Policy, Committee on Coal Research, Technology,
and Resource Assessment to Inform Energy Policy, National Research Council, 2007. 94
Lynn Muench, American Waterways Operators, quotes in New York Times, August 15, 2005,
http://www.nytimes.com/2005/08/15/national/15drought.html?_r=1, accessed December 16, 2010. 95
Ibid.
September 2011 39
environmental limits for water temperature. A similar situation occurred in August 2006 along
the Mississippi River, as well as at some plants in Illinois and Minnesota.96
Changes in Utility Water Consumption over Time
The United States Geological Service‘s (USGS) National Water Use Information program
prepares nationwide compilations of all reported water uses that are published every five years.97
According to the USGS, more than 340,000 million gallons of water is withdrawn per day in the
United States, 30 percent of which is ―consumed‖ and 70 percent is returned to flow. 98
The
Reclamation-led effort resulted in the development of the Colorado River Interim Guidelines for
Lower Basin Shortages and Coordinated Operations for Lake Powell and Lake Mead (Interim
Guidelines) that sought to address the unique challenges in the operation of the Colorado River.
99 This effort included an environmental review and public scoping meetings. Thermoelectric
freshwater withdrawals accounted for 41 percent of all freshwater withdrawals in 2005; however,
it is important to note that only 3 percent of the withdrawn water is consumed and the rest is
returned to natural flow.
Nearly all of the water withdrawn was surface water used for once-through cooling at power
plants. Twenty-nine percent of thermoelectric power withdrawals were from saline or brackish
coastal water bodies. Thermoelectric power withdrawals in 2005 were 3 percent more than in
2000 due to an increase in demand for electricity. USGS data indicates that water use for
thermoelectric power increased from 1950 to 1980, but has remained relatively stable from then
through 2005.100
As noted above, the 1980 Federal Clean Water Act requirements resulted in an
end to construction of open-loop cooling systems for cooling thermoelectric power plants and
use of closed-loop cooling. Closed-loop systems require much lower consumption of surface
water.
Hydroelectric facilities use water as the source of energy that is converted to electric power.
Although the operation of hydroelectric facilities depends on water flow, the water consumption
by hydro facilities is negligible.
96
Impact of Drought on U.S. Steam Electric Power Plant Cooling Water Intakes and Related Water Resource Issues,
National Energy Technology Laboratory, DOE/NETL-2009/1364, April 2009,
http://www.netl.doe.gov/technologies/coalpower/ewr/water/pdfs/final-drought%2520impacts.pdf, accessed
November 11, 2010. 97
USGS Circular 1344, United States Geological Survey, October 2009. 98
Kenny, J.F., Barber, N.L., Hutson, S.S., Linsey, K.S., Lovelace, J.K., and Maupin, M.A., 2009, Estimated use of
water in the United States in 2005: U.S. Geological Survey Circular 1344, 52 p.; Solley, Wayne B., Pierce, Robert
R., Perlman, Howard A., 1998, Estimated use of water in the United States in 1995: U.S. Geological Survey Circular
1200. 99
―Colorado River Interim Guidelines for Lower Basin Shortages and Coordinated Operations for Lakes Powell and
Mead,‖ Bureau of Reclamation, http://www.usbr.gov/lc/region/programs/strategies/about.html, accessed December
17, 2010. 100
Trends in Water Use in the United States, 1950 – 2005, United States Geological Survey.
September 2011 40
Appendix F. Sources and References
―1997 Pacific Northwest Coordination Agreement,‖ U.S. Army Corps of Engineers, June 18,
1997, http://www.nwd-wc.usace.army.mil/PB/oper_planning/97PNCA_Conformed.pdf.
American Waterway Operators, www.americanwaterways.com/industry_stats/index.html.
―Apalachicola-Chattahoochee-Flint (ACF) Drought: Federal Reservoir and Species
Management,‖ Congressional Research Service, RL34250, Updated May 1, 2008,
http://assets.opencrs.com/rpts/RL34250_20071114.pdf.
Bates, B.C., Z.W. Kundzewicz, S. Wu, and J.P. Palutikof (eds.), 2008: Climate Change and
Water. Technical paper of the Intergovernmental Panel on Climate Change. IPCC Secretariat,
Geneva, Switzerland, available at http://www.ipcc.ch/pdf/technical-papers/climate-change-
water-en.pdf.
BPA. ―The Columbia River System: Inside Story,‖ Second Edition, Bonneville Power
Administration, April 2001, http://www.bpa.gov/power/pg/columbia_river_inside_story.pdf.
BPA. 2009 BPA Facts, Bonneville Power Administration,
http://www.bpa.gov/corporate/about_BPA/Facts/FactDocs/2009_BPA_Facts.pdf.
BPA. 2010 Annual Report, Bonneville Power Administration,
http://www.bpa.gov/corporate/finance/a_report/10/AR2010.pdf.
BPA. BPA‘s Interim Environmental Redispatch and Negative Pricing Policy, Administrator‘s
Final Record of Decision, May 2011, Bonneville Power Administration,
http://www.bpa.gov/corporate/pubs/RODS/2011/ERandNegativePricing_FinalROD_web.pdf.
BPA. Columbia River high water management, Bonneville Power Administration,
http://www.bpa.gov/corporate/AgencyTopics/ColumbiaRiverHighWaterMgmnt/.
BPA. Columbia River high-water operations, [June 1-14, 2010],‖ Bonneville Power
Administration, September 2010, http://www.bpa.gov/corporate/pubs/final-report-columbia-
river-high-water-operations.pdf.
BPA. Federal Columbia River Power System, Bonneville Power Administration,
http://www.bpa.gov/power/pgf/hydrpnw.shtml.
BPA. Statement on Environmental Redispatch and Negative Pricing, Bonneville Power
Administration, December 3, 2010,
http://www.bpa.gov/corporate/AgencyTopics/ColumbiaRiverHighWaterMgmnt/Environmental
%20Redispatch%20statement.pdf.
Bull, S. R., D. E. Bilello, J. Ekmann, M. J. Sale, and D. K. Schmalzer, 2007: Effects of climate
change on energy production and distribution in the United States in Effects of Climate Change
on Energy Production and Use in the United States. A Report by the U.S. Climate Change
Science Program and the Subcommittee on Global Change Research. Washington, DC.
Coal: Research and Development to Support National Energy Policy, Committee on Coal
Research, Technology, and Resource Assessment to Inform Energy Policy, National Research
Council, 2007.
September 2011 41
―Colorado River Basin Water Management: Evaluating and Adjusting to Hydroclimatic
Variability,‖ Committee on the Scientific Bases of Colorado River Basin Water Management,
National Research Council, 2007, http://www.nap.edu/catalog/11857.html.
Colorado River Compacts, The Colorado River Water Conservation District, April 16, 2008,
http://www.crwcd.org/media/uploads/20080416_CO_River_Compact.pdf.
Colorado River Law and Policy, Western Water Assessment, University of Colorado – Boulder,
http://wwa.colorado.edu/colorado_river/law.html.
Database of State Incentives for Renewables & Efficiency, June 2011,
http://www.dsireusa.org/documents/summarymaps/RPS_map.pptx.
Dave Flessner, ―Tennessee Valley Authority boosts rates 20 percent,‖ Chattanooga Times Free
Press, August 21, 2008, http://www.timesfreepress.com/news/2008/aug/21/tennessee-valley-
authority-boosts-rates-20-percent/?local.
DHS. 2010 Dams Sector-Specific Plan, U.S. Department of Homeland Security,
http://www.dhs.gov/xlibrary/assets/nipp-ssp-dams-2010.pdf.
DHS. Critical Infrastructure Partnership Advisory Council, DHS
http://www.dhs.gov/files/committees/editorial_0843.shtm.
DHS. National Infrastructure Protection Plan, U.S. Department of Homeland Security,
http://www.dhs.gov/xlibrary/assets/NIPP_Plan.pdf.
DOE. ―Feasibility Assessment of the Water Energy Resources of the United States for New
Low Power and Small Hydro Classes of Hydroelectric Plants,‖ U.S. Department of Energy,
Office of Energy Efficiency and Renewable Energy, January 2006,
http://www1.eere.energy.gov/windandhydro/pdfs/doewater-11263.pdf.
DOE. 2010 Energy Sector-Specific Plan, U.S. Department of Energy,
http://www.oe.energy.gov/DocumentsandMedia/Energy_SSP_2010.pdf.
DOE. Energy Demands on Water Resources, Report to Congress on the Interdependency of
Water and Energy, U.S. Department of Energy, December 2006.
DOE/NETL. Impact of Drought on U.S. Steam Electric Power Plant Cooling Water Intakes and
Related Water Resource Issues, National Energy Technology Laboratory, DOE/NETL-
2009/1364, April 2009, http://www.netl.doe.gov/technologies/coalpower/ewr/water/pdfs/final-
drought%2520impacts.pdf.
DOE/NETL. ―An Analysis of the Effects of Drought Conditions on Electric Power Generation
in the Western United States,‖ National Energy Technology Laboratory, DOE/NETL-2009/1365,
April 2009, http://www.netl.doe.gov/technologies/coalpower/ewr/water/pdfs/final%20-
%20WECC%20drought%20analysis.pdf.
DOI. ―Secretary Kempthorne Signs Historic Decision For New Colorado River Management
Strategies,‖ U.S. Department of Interior, December 13, 2007,
http://www.doi.gov/archive/news/07_News_Releases/071213.html.
Drought Management Plan, Tennessee Department of Environment and Conservation, February
2010, http://www.tn.gov/environment/dws/pdf/droughtmgtplan.pdf.
September 2011 42
EIA. Annual Energy Outlook 2010, U.S. Energy Information Administration, December 2010,
http://www.eia.gov/oiaf/aeo/tablebrowser/#release=AEO2011&subject=10-
AEO2011&table=16-AEO2011®ion=0-0&cases=ref2011-d120810c.
EIA. EIA-906, EIA-920, EIA-923, and EIA-860 databases, annual electric power generation,
U.S. Energy Information Administration,
http://www.eia.doe.gov/cneaf/electricity/page/eia906_920.html.
EIA. Electricity Net Generation from Renewable Energy by Energy Use Sector and Energy
Source, U.S. Energy Information Administration,
http://www.eia.doe.gov/cneaf/solar.renewables/page/table3.html.
EIA. Glossary, U.S. Energy Information Administration,
http://www.eia.doe.gov/glossary/index.cfm.
EIA. Net Generation by Energy Source, U.S. Energy Information Administration,
http://www.eia.doe.gov/cneaf/electricity/epm/table1_1.html.
Electricity Impacts of the Drought, State of Washington, Department of Community, Trade, and
Economic Development, May 9, 2005,
http://www.commerce.wa.gov/_cted/documents/ID_2015_Publications.pdf.
Eric Wolff, ―ENERGY: Hoover Dam could stop generating electricity as soon as 2013, official
fear,‖ North County Times, September 11, 2010,
http://www.nctimes.com/business/article_b7e44e9e-087d-53b2-9c49-7ea32262c9a9.html.
―Ex Post Power Economic Analysis of Record of Decision Operational Restrictions at Glen
Canyon Dam,‖ Argonne National Laboratory, July 2010,
http://www.wapa.gov/CRSP/environment/documents/Post-RODFinal_000.pdf.
Federal Water Projects on the Colorado River System, PBS,
http://www.pbs.org/cowboysindianslawyers/topicfeature.html.
Felicity Barringer, ―Water Use in Southwest Heads for a Day of Reckoning,‖ New York Times,
September 27, 2010, http://www.nytimes.com/2010/09/28/us/28mead.html.
Global Climate Change Impacts in the United States, Thomas R. Karl, Jerry M. Melillo, and
Thomas C. Peterson, (eds.). Cambridge University Press, 2009,
http://downloads.globalchange.gov/usimpacts/pdfs/climate-impacts-report.pdf.
Gutowski, W.J., G.C. Hegerl, G.J. Holland, T.R. Knutson, L.O. Mearns, R.J. Stouffer, P.J.
Webster, M.F. Wehner, and F.W. Zwiers, 2008: Causes of observed changes in extremes and
projections of future changes. In: Weather and Climate Extremes in a Changing Climate:
Regions of Focus: North America, Hawaii, Caribbean, and U.S. Pacific Islands [Karl, T.R., G.A.
Meehl, C.D. Miller, S.J. Hassol, A.M. Waple, and W.L. Murray (eds.)]. Synthesis and
Assessment Product 3.3. U.S. Climate Change Science Program, Washington, DC, pp. 81-116.
Hightower, M., Energy and Water: Overview of Emerging Issues and Challenges, DOE/EIA
2010 Energy Conference.
Hydropower and the World's Energy Future, International Hydropower Association, November
2000, http://www.ieahydro.org/reports/Hydrofut.pdf.
September 2011 43
―Hydropower is Reliable,‖ National Hydropower Association, http://hydro.org/why-
hydro/reliable/.
Hydropower, the National Energy Education Development Project,
http://www.need.org/needpdf/infobook_activities/SecInfo/HydroS.pdf.
James Cartledge, ―Hoover Dam turbines set for upgrade to cope with drought,‖
Brighterenergy.org, April 19, 2010, http://www.brighterenergy.org/9098/news/marine-
hydro/hoover-dam-turbines-set-for-upgrade-to-cope-with-drought/.
Janet Zimmerman, ―REGION: Colorado River drought threatens power production,‖ The Press-
Enterprise, October 6, 2010,
http://www.pe.com/localnews/stories/PE_News_Local_D_mead06.2b8c2c6.html.
Jim Mann, the Western News, November 16, 2010,
http://www.thewesternnews.com/news/article_3435b546-f1ea-11df-b434-
001cc4c002e0.html?mode=print.
Justin Rubner, ―Drought hits Hydropower,‖ Atlanta Business Chronicle, November 16, 2007,
http://atlanta.bizjournals.com/atlanta/stories/2007/11/19/story2.html.
Kelic, Andjelka, V. Loose, V. Vargas, and E. Vugrin, 2009, Energy and Water Sector Policy
Strategies for Drought Mitigation, Sandia National Laboratories, Albuquerque, NM,
http://prod.sandia.gov/techlib/access-control.cgi/2009/091360.pdf.
Kenny, J.F., Barber, N.L., Hutson, S.S., Linsey, K.S., Lovelace, J.K., and Maupin, M.A., 2009,
Estimated use of water in the United States in 2005: U.S. Geological Survey Circular 1344, 52
p.; Solley, Wayne B., Pierce, Robert R., Perlman, Howard A., 1998, Estimated use of water in
the United States in 1995: U.S. Geological Survey Circular 1200.
Kevin McCullen, ―Low snowpack to cost BPA projected $233M,‖ Tri-city Herald, May 4, 2010,
http://www.tri-cityherald.com/2010/05/04/1001094/low-snowpack-to-cost-bpa-projected.html.
Lynn Muench, American Waterways Operators, quotes in New York Times, August 15, 2005,
http://www.nytimes.com/2005/08/15/national/15drought.html?_r=1.
Manitoba Hydro 2002-2004 Drought Risk Management Review, January 15, 2005,
http://www.hydro.mb.ca/regulatory_affairs/electric/gra_08_09/information_requests/Appendix_
43-Report_on_2002-2004_Drought.pdf.
Martin-Amouroux, Jean-Marie, the economics of hydroelectricity, Hydro 21, Grenoble European
Center on Hydropower, June 2004,
http://www.hydro21.org/div_media/pdf/pdf_economie_en.pdf.
NOAA. Columbia River Basin Map, National Oceanic and Atmospheric Administration,
http://www.nwr.noaa.gov/Salmon-Hydropower/Columbia-Snake-Basin/upload/Col-Basin-
map.pdf.
NOAA. Ingram, H., D. Feldman, N. Mantua, K.L. Jacobs, D. Fort, N. Beller-Simms, and A. M.
Waple, 2008: The Changing Context. In: Decision-Support Experiments and Evaluations using
Seasonal-to-Interannual Forecasts and Observational Data: A Focus on Water Resources. A
Report by the U.S. Climate Change Science Program and the Subcommittee on Global Change
Research [Nancy Beller-Simms, Helen Ingram, David Feldman, Nathan Mantua, Katharine L.
September 2011 44
Jacobs, and Anne M. Waple (eds.)]. NOAA‘s National Climatic Data Center, Asheville, NC, pp.
7-28.
NOAA. Western Area Power Administration, Frequently Asked Questions: Power Marketing,
http://www.wapa.gov/about/faqpm.htm.
NOAA. ―What is Drought?‖, National Oceanic and Atmospheric Administration,
http://www.wrh.noaa.gov/fgz/science/drought.php?wfo=fgz.
Pontius, Dale, ―Colorado River Basin Study: Final Report,‖ The Western Water Policy Review
Advisory Commission, August 1997,
http://wwa.colorado.edu/colorado_river/docs/pontius%20colorado.pdf.
Reclamation. ―Addressing Climate Change in Long-Term Water Resources Planning and
Management,‖ U.S. Army Corps of Engineers and Bureau of Reclamation, January 2011,
http://www.usbr.gov/climate/userneeds/.
Reclamation. ―Colorado River Interim Guidelines for Lower Basin Shortages and Coordinated
Operations for Lakes Powell and Mead,‖ Bureau of Reclamation, December 2007,
http://www.usbr.gov/lc/region/programs/strategies/about.html.
Reclamation. Annual Operating Plans, Upper Colorado Region, Bureau of Reclamation,
http://www.usbr.gov/uc/water/rsvrs/ops/aop/index.html.
Reclamation. ―Colorado River Basin Water Supply and Demand Study Plan of Study,‖ Bureau
of Reclamation, http://www.usbr.gov/lc/region/programs/crbstudy.html.
Reclamation. Grand Culee Dam, Bureau of Reclamation, Pacific Northwest Region, Bureau of
Reclamation, http://www.usbr.gov/pn/grandcoulee/index.html.
Reclamation. Hydroelectric Power, Bureau of Reclamation, July 2005,
http://www.usbr.gov/power/edu/pamphlet.pdf.
Reclamation. The Law of the River, Bureau of Reclamation,
http://www.usbr.gov/lc/region/g1000/lawofrvr.html.
Reclamation. The Record of Decision, Colorado River Interim Guidelines for Lower Basin
Shortages and Coordinated Operations for Lakes Powell and Mead, Bureau of Reclamation,
http://www.usbr.gov/lc/region/programs/strategies/RecordofDecision.pdf.
Reclamation. Upper Colorado Region, Bureau of Reclamation,
http://www.usbr.gov/uc/water/crsp/cs/gcd.html.
―Renewable Portfolio Standards and Renewable Energy Credits,‖ Washington State Legislature,
February 10, 2010,
http://www.leg.wa.gov/Senate/Committees/EWE/Documents/RenewableEnergy.pdf.
Scott Simpson, ―BC Hydro faces severe drought on Peace River,‖ The Vancouver Herald, July
15, 2010,
http://www.vancouversun.com/news/Hydro+faces+severe+drought+Peace+River/3274186/story.
html.
SPI Archived Maps, http://www.drought.unl.edu/monitor/archivedspi.htm.
September 2011 45
Stewart, I.T., D.R. Cayan, and M.D. Dettinger, 2004: Changes in snowmelt runoff timing in
western North America under a ‗business as usual‘ climate change scenario. Climatic Change,
http://meteora.ucsd.edu/cap/stewart_clch.pdf.
Time-series plot of the annual flow volume (in millions of acre-feet) for the Colorado River at
Lee‘s Ferry, http://wwa.colorado.edu/colorado_river/docs/USGS_2004_3062.pdf.
TVA. TVA River System, Tennessee Valley Authority,
http://www.tva.gov/river/lakeinfo/systemwide.htm.
TVA. 2007 TVA Strategic Plan, Tennessee Valley Authority,
http://www.tva.com/stratplan/tva_strategic_plan.pdf.
TVA. Tennessee Reservoir and Power Plants, Tennessee Valley Authority,
http://www.tva.com/sites/sites_ie.htm.
TVA. Tennessee River and Reservoir System Update, December 6, 2010,
http://www.tva.gov/email/eRiver/2010/december.html.
U.S. Census Bureau, http://quickfacts.census.gov/qfd/maps/thematic/PL0120000.html.
U.S. Drought Monitor Archives, National Drought Mitigation Center,
http://www.drought.unl.edu/dm/archive.html.
U.S. Geological Survey, Trends in Water Use in the United States, 1950 – 2005.
U.S. Geological Survey, USGS Circular 1344, October 2009.
United States Watersheds Map, http://maps.howstuffworks.com/united-states-watersheds-
map.htm.
Wind Power: Capacity Factor and Intermittency, Council of European Municipalities and
Regions, http://www.ceere.org/rerl/about_wind/RERL_Fact_Sheet_2a_Capacity_Factor.pdf.