Embed Size (px)
Citation preview
Identifying Vulnerable Neighborhoods of Alachua County
Dallas Dunbar
Stephanie DelGatto
Jake Causey
Cameron Hindle
Background
301.75
7.25
US Population (in millions)
Unincarcerated
Incarcerated
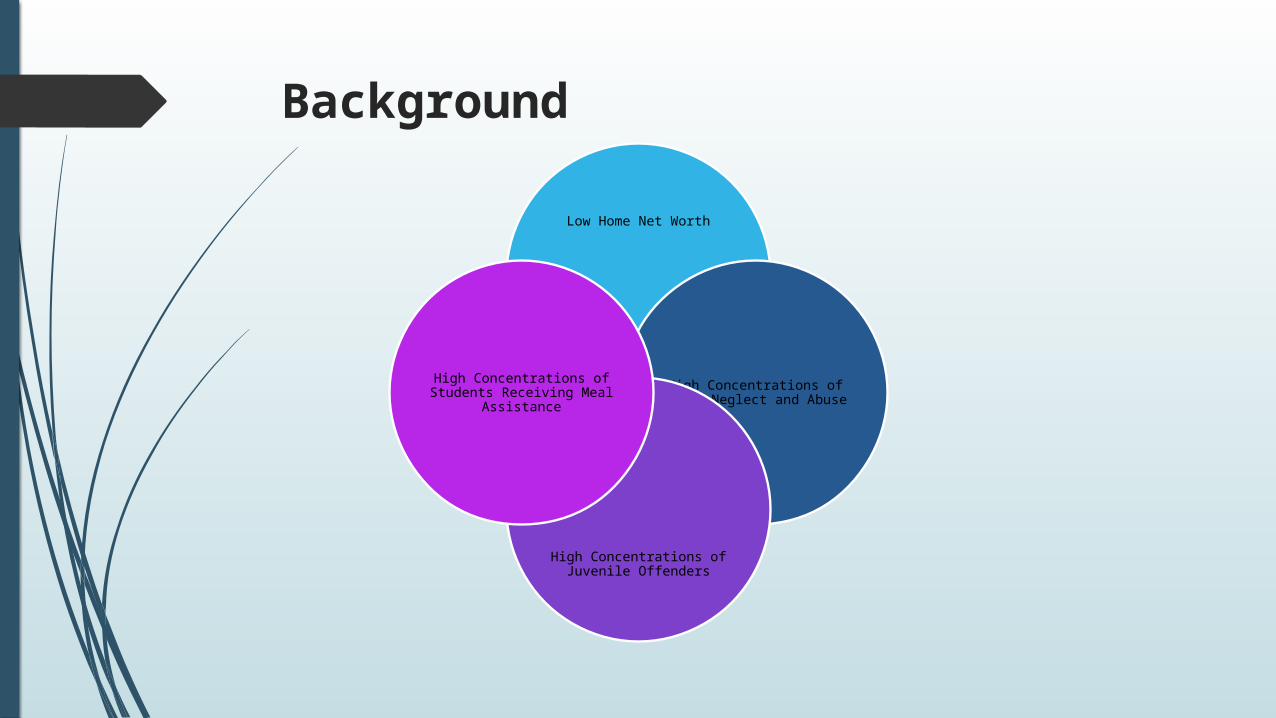
Background
Low Home Net Worth
High Concentrations
of Child Neglect and
Abuse
High Concentrations of Juvenile Offenders
High Concentrations
of Students Receiving Meal
Assistance
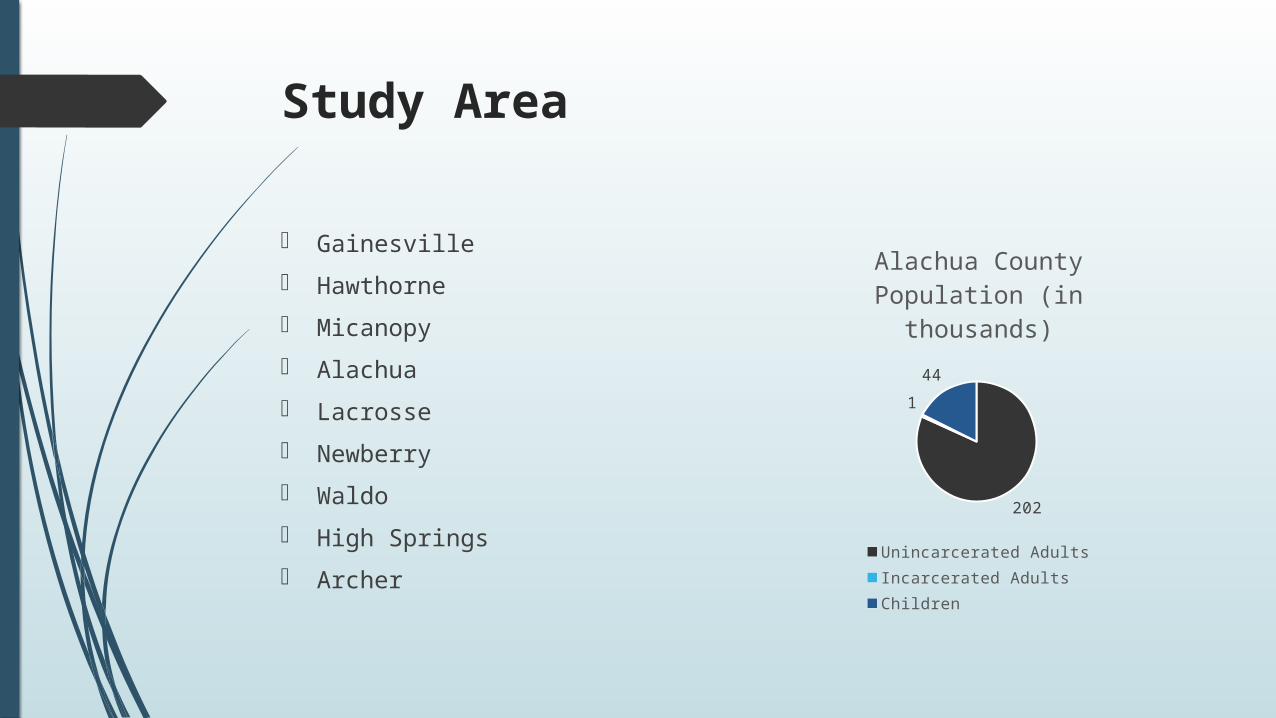
Study Area
Gainesville
Hawthorne
Micanopy
Alachua
Lacrosse
Newberry
Waldo
High Springs
Archer
202
1
44
Alachua County Population (in thousands)
Unincarcerated Adults Incarcerated AdultsChildren
Low Home Net Worth
High Concentrations
of Child Neglect and
Abuse
High Concentrations of Juvenile Offenders
High Concentrations
of Students Receiving Meal
Assistance
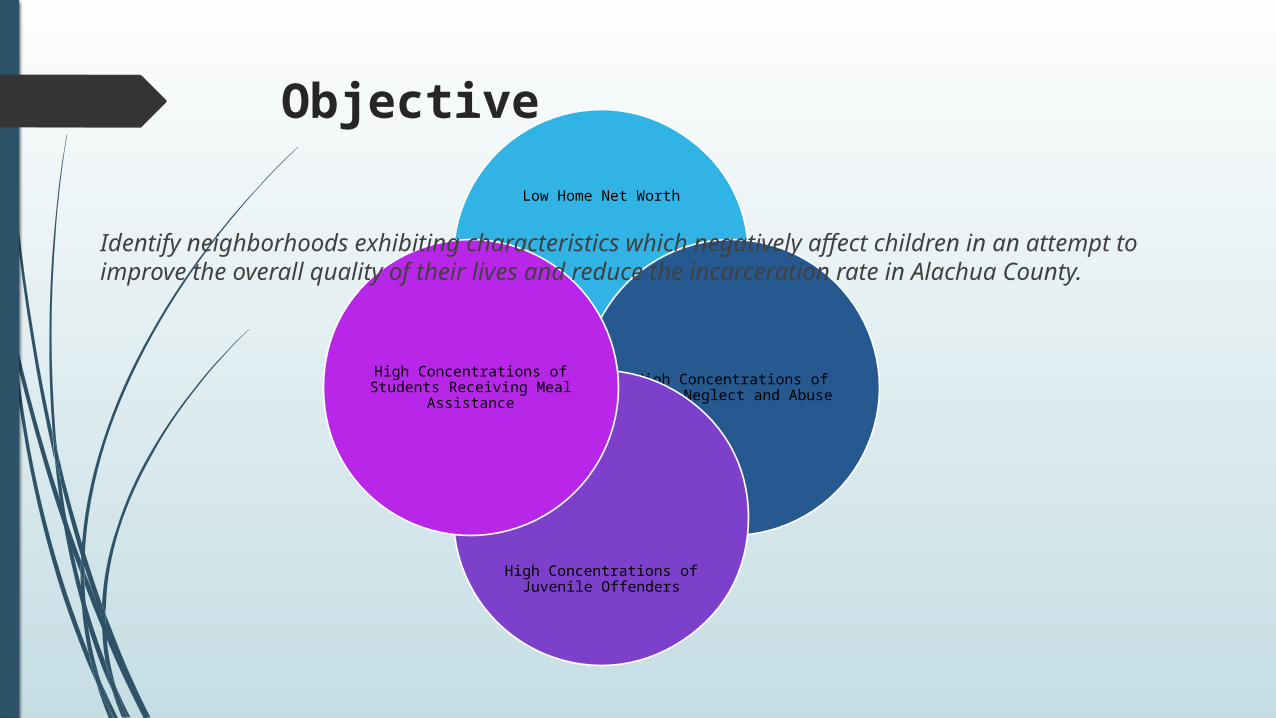
Objective
Identify neighborhoods exhibiting characteristics which negatively affect children in an attempt to improve the overall quality of their lives and reduce the incarceration rate in Alachua County.
Methodology

Select by Attribute
(low worth Layer)
≤$55,719
Buffer Free Lunch
points(by 250 ft)
Interactive Selection (75 or more per
0.5 mile radius)
Create layer from selection
Free Lunch and Low Net Worth
Select by Attribute (Low Net
Worth Layer)
≤$55,719
Buffer Child Neglect
points (by 250 ft)
Interactive Selection (10 or more cases per 0.5 mile
radius)
Create layer from selection
Low Net Worth and
Child Neglect
Final Map with Vulnerable Areas
Select by Attribute (Juvenile Offenders
layer)
≥3 offenses
Buffer Free Lunch points (by 250 ft)
Interactive Selection (75 or more cases per 0.5 mile radius)
Create layer from selection
Free Lunch and Juvenile
Offenders

Steps of Analysis
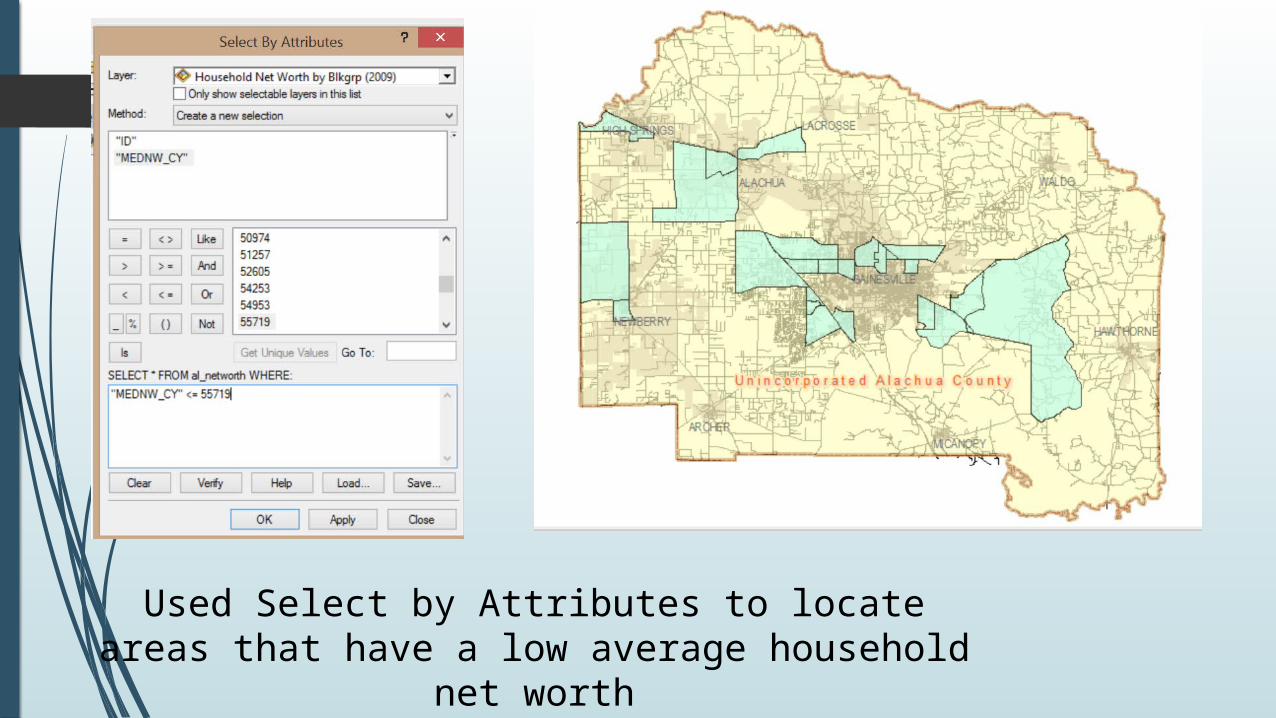
Used Select by Attributes to locate areas that have a low average household net worth
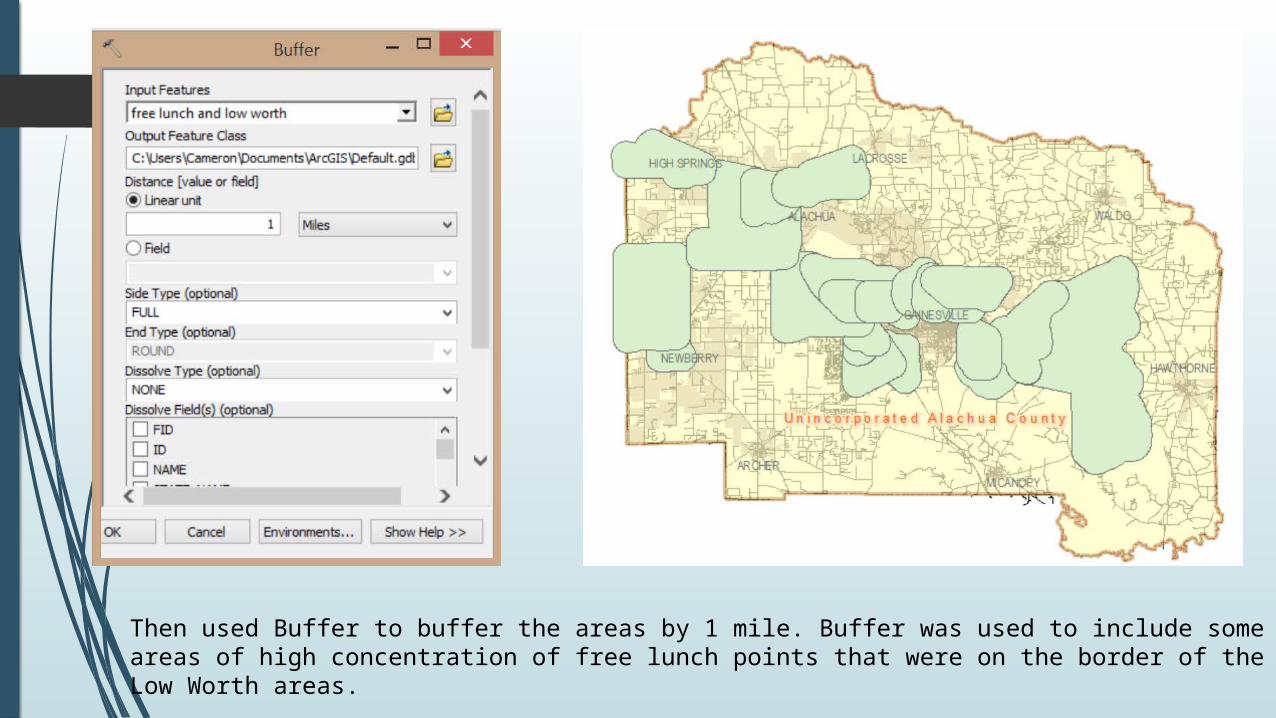
Then used Buffer to buffer the areas by 1 mile. Buffer was used to include some areas of high concentration of free lunch points that were on the border of the Low Worth areas.
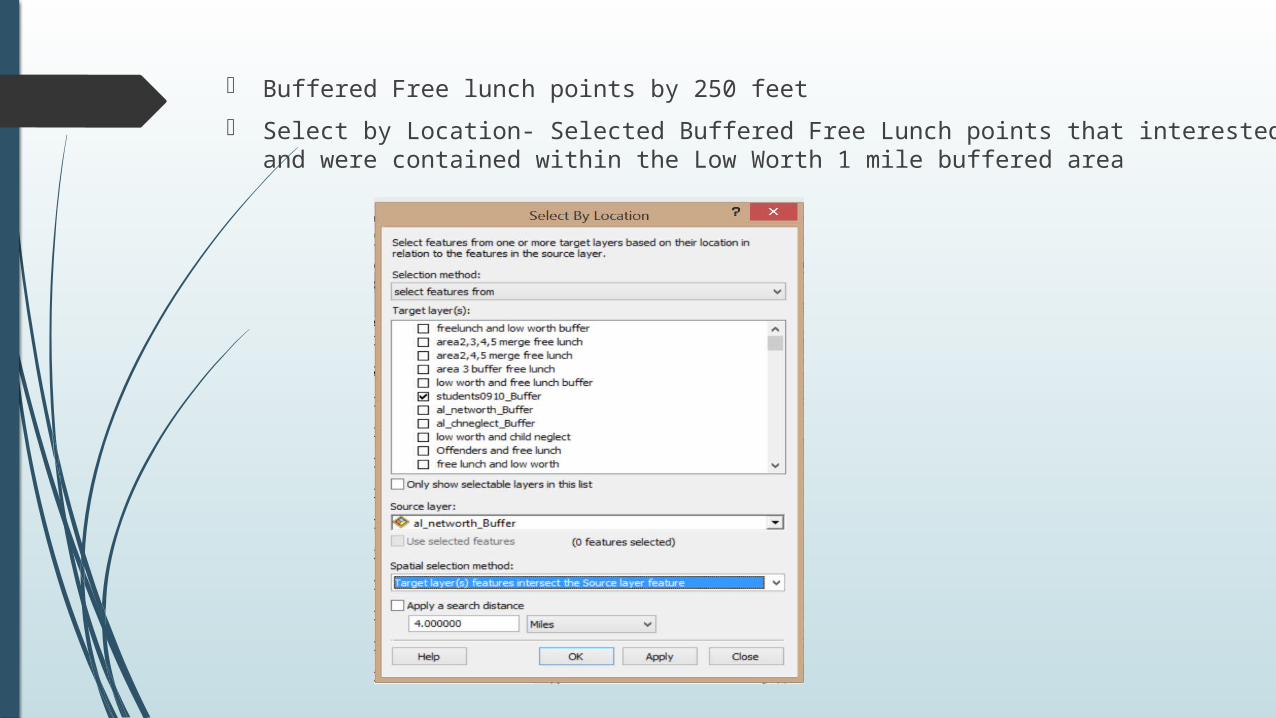
Buffered Free lunch points by 250 feet
Select by Location- Selected Buffered Free Lunch points that interested and were contained within the Low Worth 1 mile buffered area

Used Interactive Selection with a circle to search for and select areas with high concentrations of points. Selected Areas that contained more than 75 points within a ½ mile radius of the center of the area.
Theses selected Areas were then combined together to form our targeted vulnerable neighborhoods.
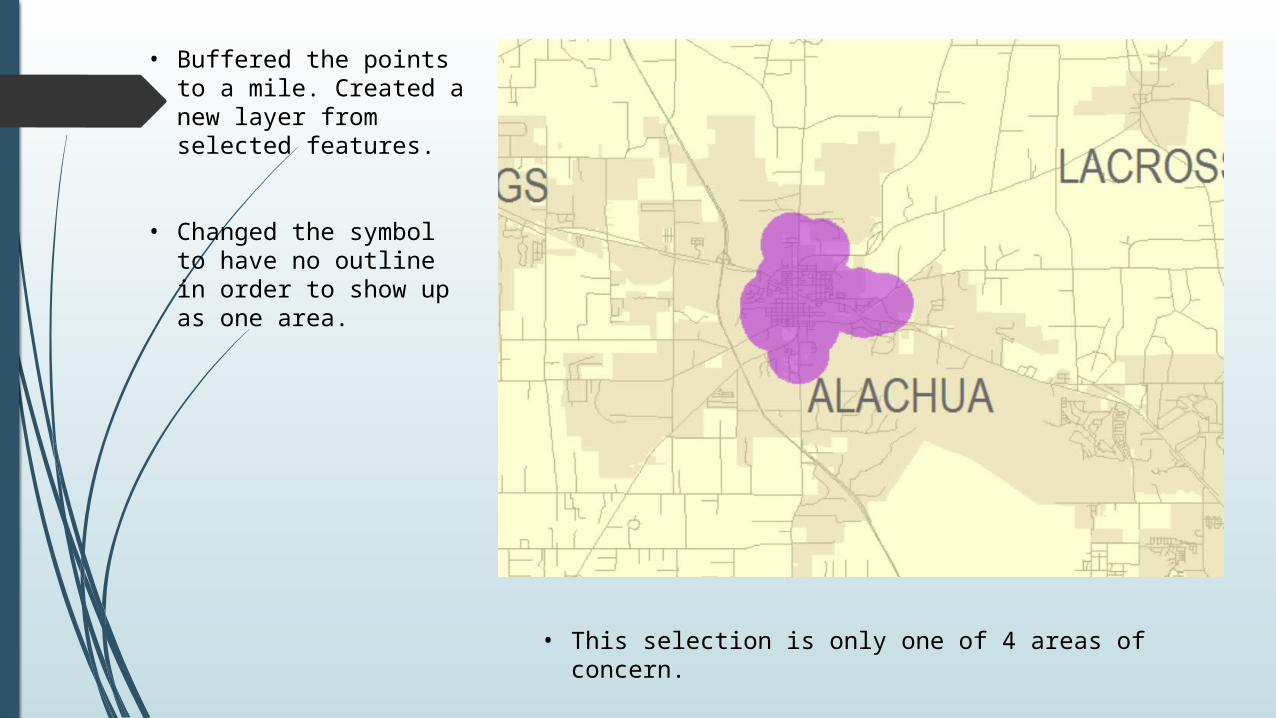
• Buffered the points to a mile. Created a new layer from selected features.
• Changed the symbol to have no outline in order to show up as one area.
• This selection is only one of 4 areas of concern.
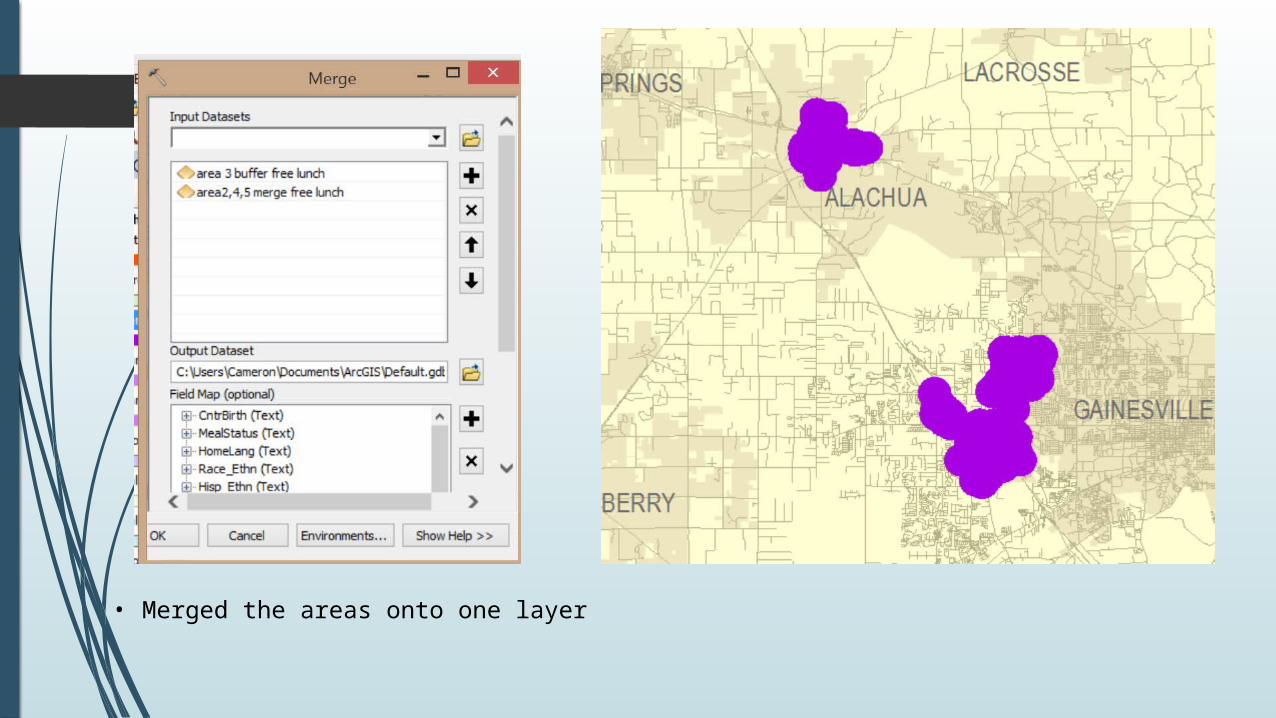
• Merged the areas onto one layer
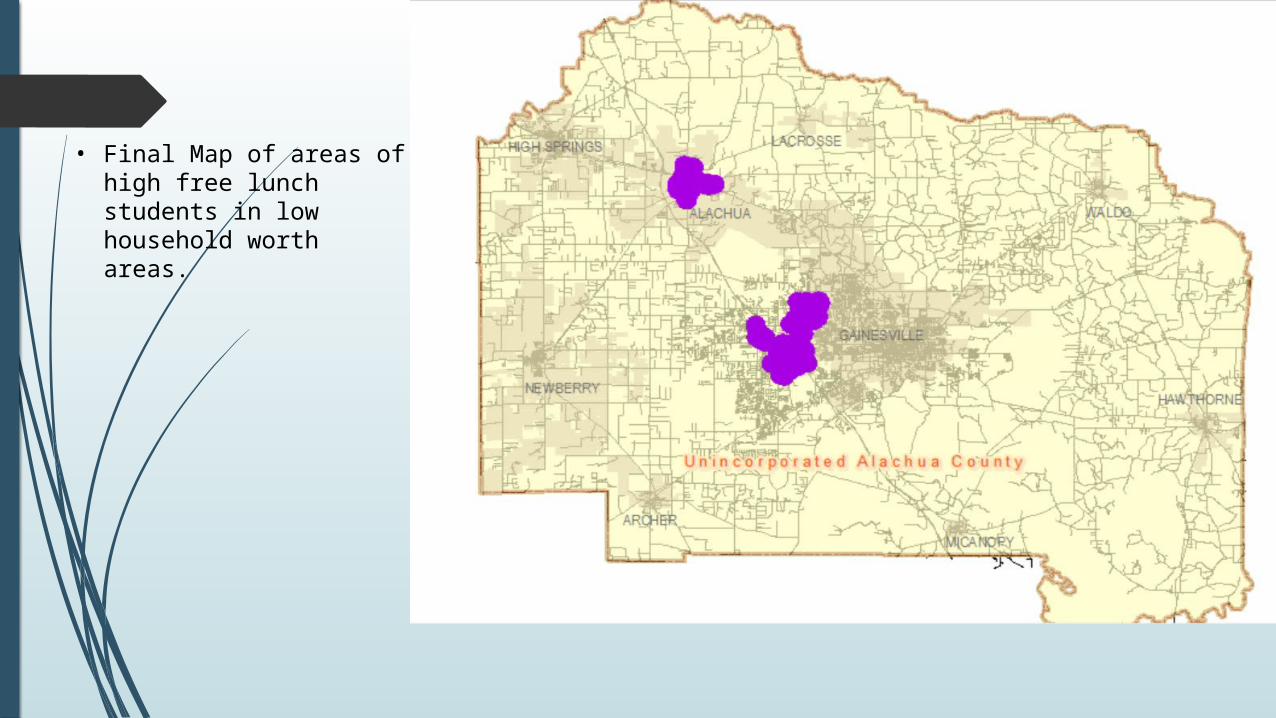
• Final Map of areas of high free lunch students in low household worth areas.
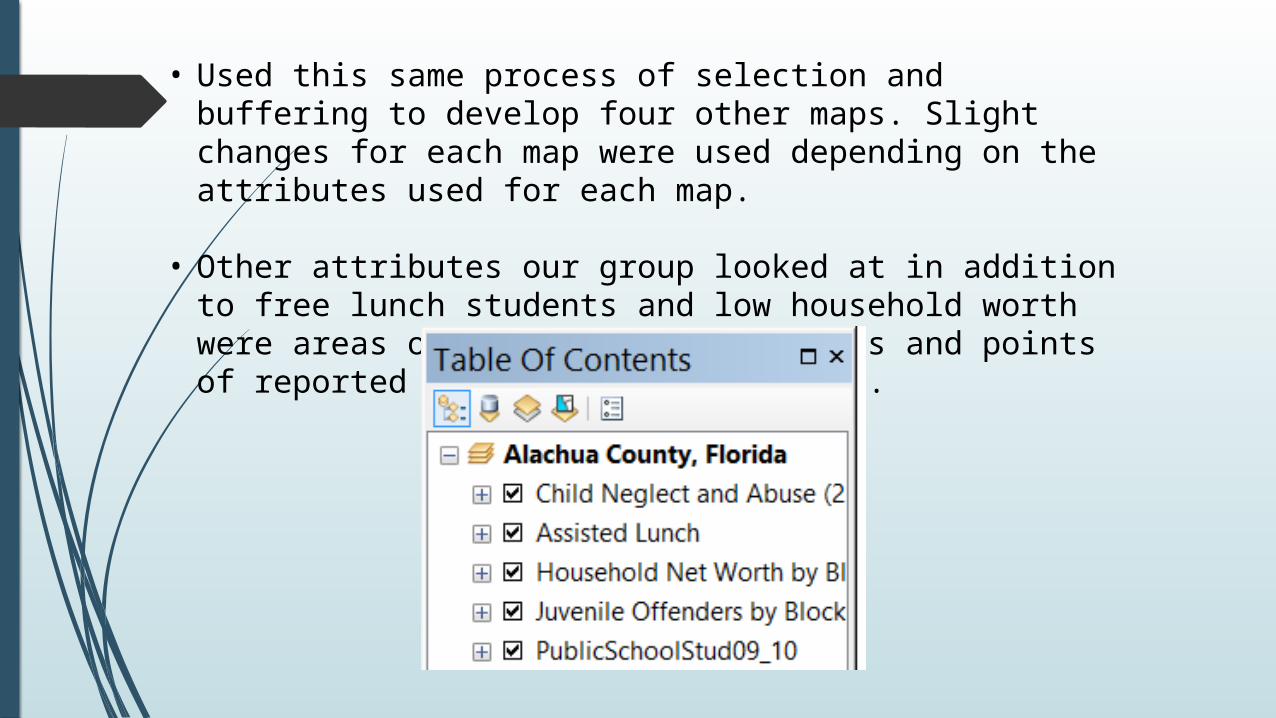
• Used this same process of selection and buffering to develop four other maps. Slight changes for each map were used depending on the attributes used for each map.
• Other attributes our group looked at in addition to free lunch students and low household worth were areas of high Juvenile Offenses and points of reported Child Neglect and Abuse.
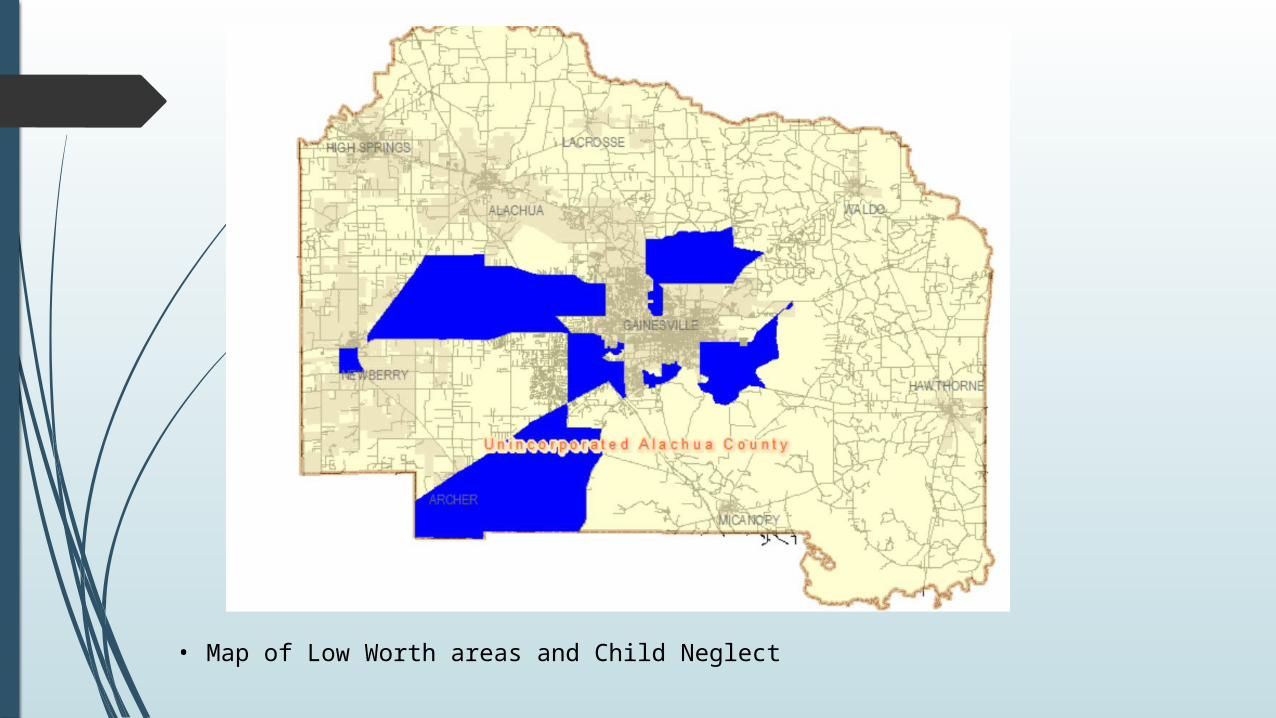
• Map of Low Worth areas and Child Neglect
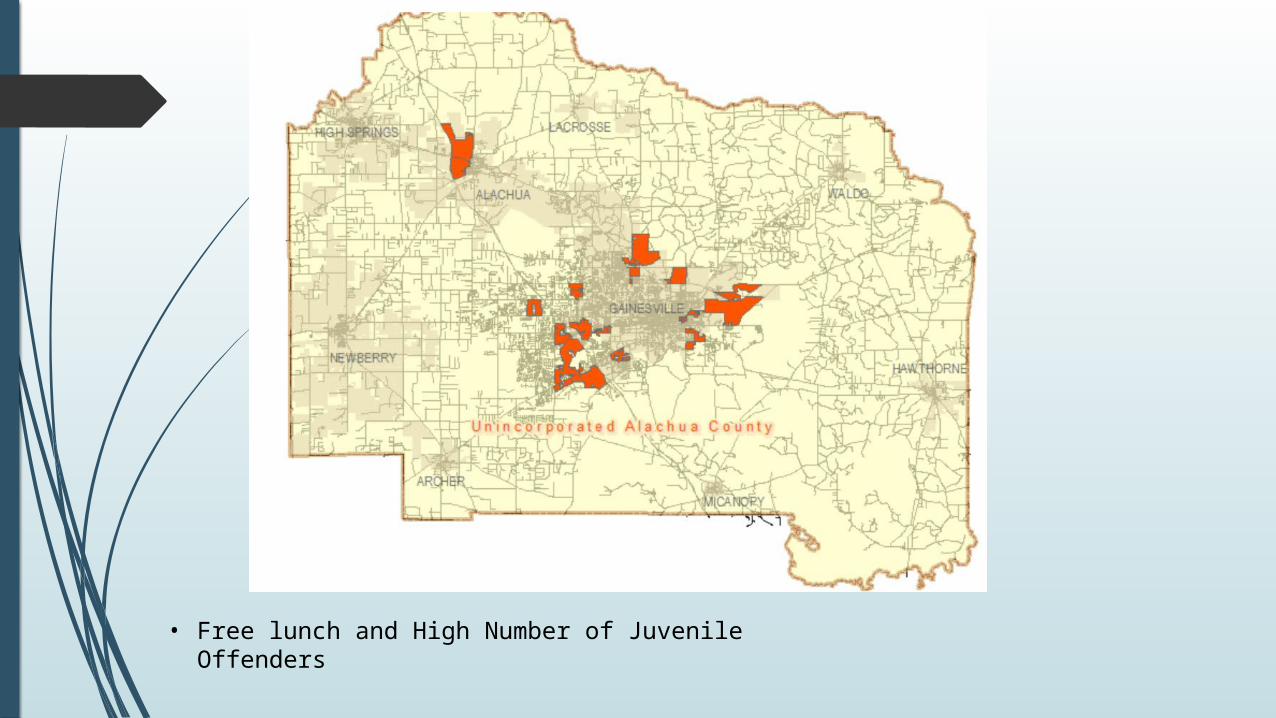
• Free lunch and High Number of Juvenile Offenders
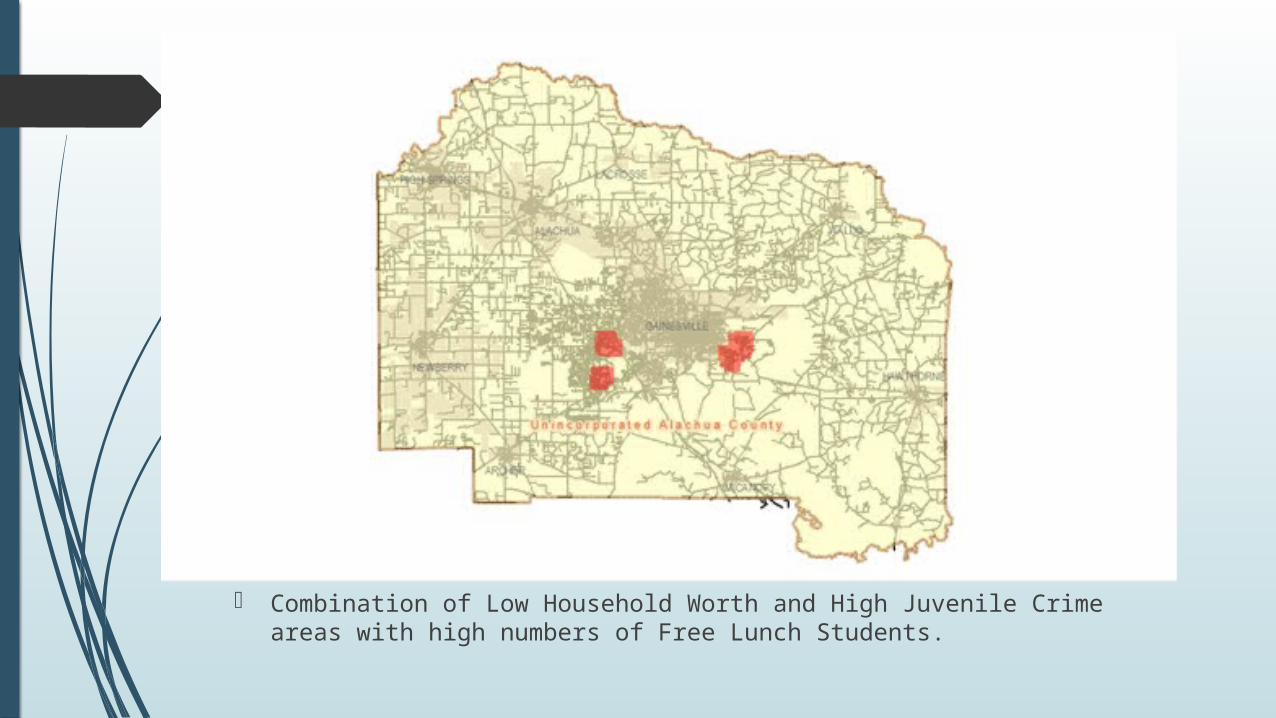
Combination of Low Household Worth and High Juvenile Crime areas with high numbers of Free Lunch Students.
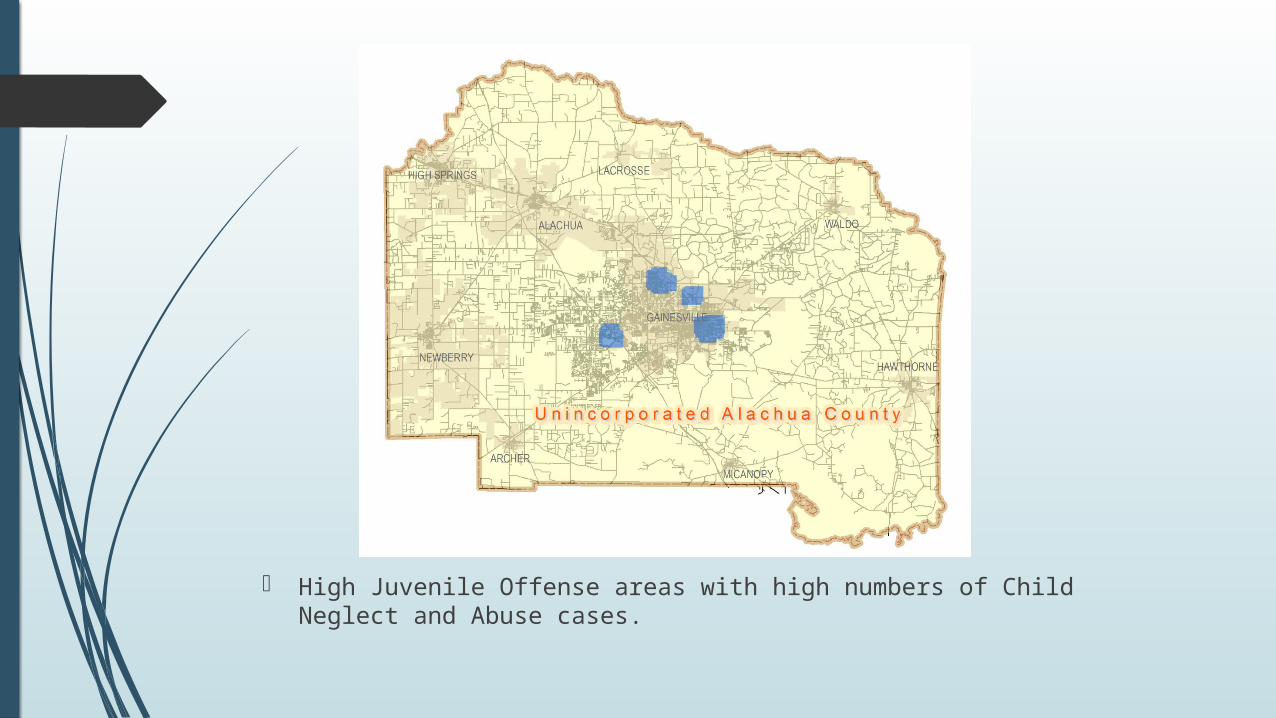
High Juvenile Offense areas with high numbers of Child Neglect and Abuse cases.

Conclusion

The outskirts of Gainesville seems to be the most vulnerable areas in Alachua County.
Looking at the county budget and other records is recommended to find the issues in the areas and to determine what efforts have been made in the past to improve the quality of living in these areas.
The wellbeing of children is of the utmost importance to any communities.

Questions?