Embed Size (px)
Citation preview
The U.S. dairy industry is currently threatened by a global dairy glut. Worldwide, milk production has increased nearly 40 percent since 1995, with the fastest increase occurring in the last two years.1 In the United States, dairy output exceeded 157 billion pounds in the first three quarters of 2015, and likely broke all-time produc-tion records for 2015 as a whole.2
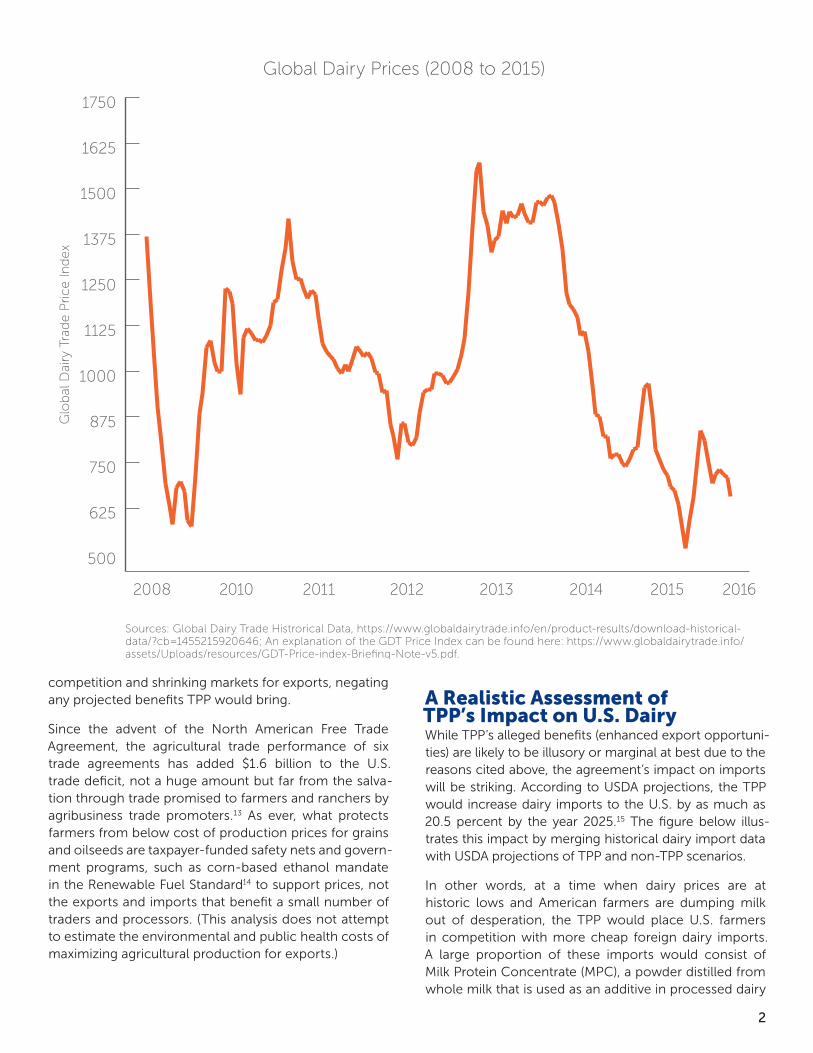
As a result of this oversupply, global dairy prices have plummeted 55 percent since their peak in 2014, and are now at their lowest levels since 2009, according to data from Global Dairy Trade.3 According to Bloomberg Busi-ness, in early 2015, dairies in the northeastern United States dumped 31 million pounds of milk when proces-sors could no longer accommodate the supply.4
This crisis of global oversupply and crashing prices reflects a deeper crisis for U.S. dairy farmers: the hollowing out of the industry itself. According to data from the USDA, the number of U.S. dairy farms declined from 648,000 in 1970 to 75,000 in 2006.5 Today, fewer than 60,000 dairy farms are active in the United States.6 Those family farmers who remain face the prospect of years of devastating losses and cutbacks due to govern-ments’ and market actors’ inability or unwillingness to realign demand and supply nationally and globally.
The False Hope of the TPPIn the present context of crashing dairy prices and failing farms, the Office of the U.S. Trade Representative continues to argue that the Trans Pacific Partnership (TPP) agreement will be a savior for U.S. agriculture. The agree-ment, soon to be considered for approval by Congress, would reduce or eliminate tariffs on dairy products across the board.7 “U.S. agriculture, as a whole, has a lot to gain from this agreement,” contends Darci Vetter, chief agri-cultural negotiator for the USTR, because the deal’s tariff cuts promote exports, and exports are the key to growth.8
Yet despite these confident claims by the USTR, the pros-pects of export-driven growth in the U.S. dairy industry appear dim. U.S. dairy exports fell by 33 percent in value and 13 percent in volume over the past year alone.9 Many of those exports had been flowing to China, where growth has now stalled, ending the global commodity boom for the foreseeable future.10
The U.S. dairy industry’s export problems are compounded by similar gluts in other countries. New Zealand (home to Fonterra, a national dairy cooperative that handles one third of global dairy trade and is the world’s largest dairy exporter11) is facing a similar crisis of oversupply and is also looking to snap up export markets.12 In short, U.S. dairy exporters face sharp
Written by Erik Katovich, Intern, March 2016
2105 First Avenue South Minneapolis, Minnesota 55404 USA iatp.org
DAIRY IN CRISIS: TPP DUMPING ON DAIRY FARMERS
CC image courtesy of Flickr user NRCS Oregon.
competition and shrinking markets for exports, negating any projected benefits TPP would bring.
Since the advent of the North American Free Trade Agreement, the agricultural trade performance of six trade agreements has added $1.6 billion to the U.S. trade deficit, not a huge amount but far from the salva-tion through trade promised to farmers and ranchers by agribusiness trade promoters.13 As ever, what protects farmers from below cost of production prices for grains and oilseeds are taxpayer-funded safety nets and govern-ment programs, such as corn-based ethanol mandate in the Renewable Fuel Standard14 to support prices, not the exports and imports that benefit a small number of traders and processors. (This analysis does not attempt to estimate the environmental and public health costs of maximizing agricultural production for exports.)
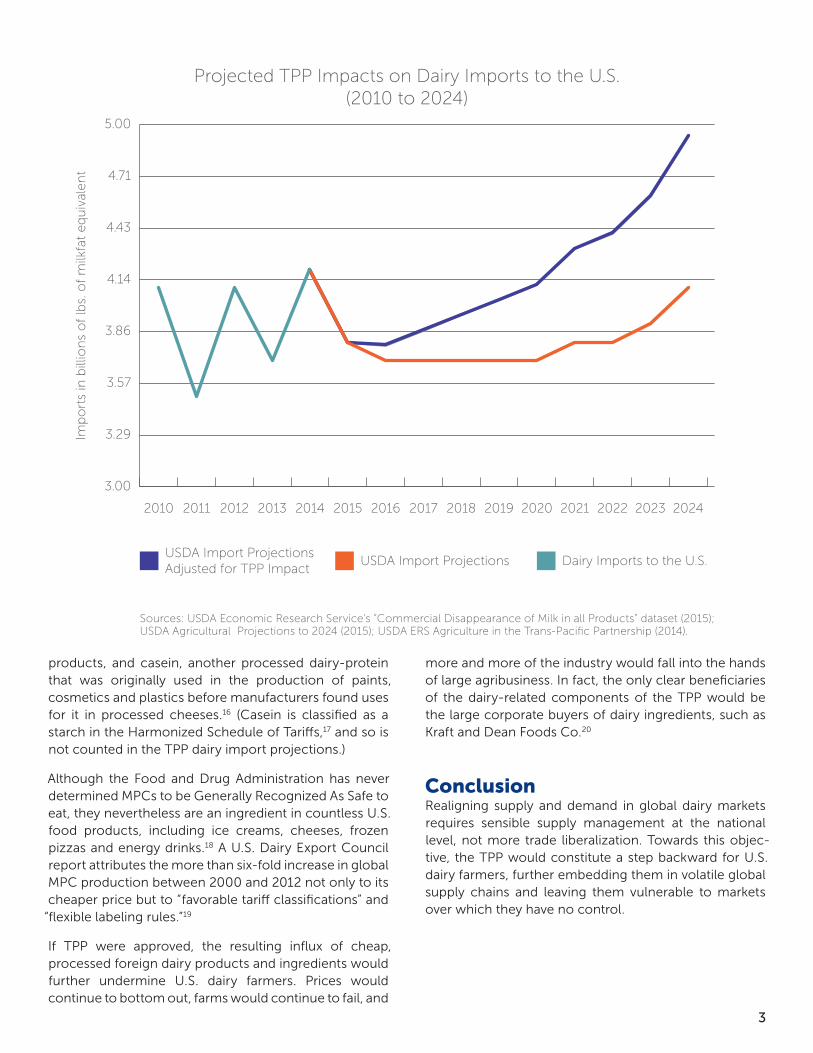
A Realistic Assessment of TPP’s Impact on U.S. DairyWhile TPP’s alleged benefits (enhanced export opportuni-ties) are likely to be illusory or marginal at best due to the reasons cited above, the agreement’s impact on imports will be striking. According to USDA projections, the TPP would increase dairy imports to the U.S. by as much as 20.5 percent by the year 2025.15 The figure below illus-trates this impact by merging historical dairy import data with USDA projections of TPP and non-TPP scenarios.
In other words, at a time when dairy prices are at historic lows and American farmers are dumping milk out of desperation, the TPP would place U.S. farmers in competition with more cheap foreign dairy imports. A large proportion of these imports would consist of Milk Protein Concentrate (MPC), a powder distilled from whole milk that is used as an additive in processed dairy
2
Glo
bal
Dai
ry T
rad
e P
rice In
dex
500
625
750
875
1000
1125
1250
1375
1500
1625
1750
2015 2016201420132012201120102008
Global Dairy Prices (2008 to 2015)
Sources: Global Dairy Trade Histrorical Data, https://www.globaldairytrade.info/en/product-results/download-historical-data/?cb=1455215920646; An explanation of the GDT Price Index can be found here: https://www.globaldairytrade.info/assets/Uploads/resources/GDT-Price-index-Briefing-Note-v5.pdf.
products, and casein, another processed dairy-protein that was originally used in the production of paints, cosmetics and plastics before manufacturers found uses for it in processed cheeses.16 (Casein is classified as a starch in the Harmonized Schedule of Tariffs,17 and so is not counted in the TPP dairy import projections.)
Although the Food and Drug Administration has never determined MPCs to be Generally Recognized As Safe to eat, they nevertheless are an ingredient in countless U.S. food products, including ice creams, cheeses, frozen pizzas and energy drinks.18 A U.S. Dairy Export Council report attributes the more than six-fold increase in global MPC production between 2000 and 2012 not only to its cheaper price but to “favorable tariff classifications” and
“flexible labeling rules.”19
If TPP were approved, the resulting influx of cheap, processed foreign dairy products and ingredients would further undermine U.S. dairy farmers. Prices would continue to bottom out, farms would continue to fail, and
more and more of the industry would fall into the hands of large agribusiness. In fact, the only clear beneficiaries of the dairy-related components of the TPP would be the large corporate buyers of dairy ingredients, such as Kraft and Dean Foods Co.20
ConclusionRealigning supply and demand in global dairy markets requires sensible supply management at the national level, not more trade liberalization. Towards this objec-tive, the TPP would constitute a step backward for U.S. dairy farmers, further embedding them in volatile global supply chains and leaving them vulnerable to markets over which they have no control.
3
3.00
3.29
3.57
3.86
4.14
4.43
4.71
5.00
Imp
ort
s in
bill
ion
s o
f lb
s. o
f m
ilkfa
t eq
uiv
alen
t
202420232022202120202019201820172016201520142013201220112010
USDA Import Projections Dairy Imports to the U.S.USDA Import Projections Adjusted for TPP Impact
Projected TPP Impacts on Dairy Imports to the U.S. (2010 to 2024)
Sources: USDA Economic Research Service’s “Commercial Disappearance of Milk in all Products” dataset (2015); USDA Agricultural Projections to 2024 (2015); USDA ERS Agriculture in the Trans-Pacific Partnership (2014).
Endnotes1. Einhorn, Bruce, Dairy Farmers at the Barricades, Bloomberg Business,
September, 2015, http://www.bloomberg.com/news/articles/2015-09-10/milk-surplus-dairy-farmers-at-the-barricades.
2. US Quarterly Milk Production and Related Data, USDA Economic Research Service, 11/25/2015.
3. Trading Events Historical Data, Global Dairy Trade, 2016, https://www.global-dairytrade.info/en/product-results.
4. Mulvany, Lydia, The US Is Producing a Record Amount of Milk and Dumping the Leftovers, Bloomberg Business, 7/1/2015, h t t p : / / w w w . b l o o m b e r g . c o m / n e w s / a r t i c l e s / 2 0 1 5 - 0 7 - 0 1 /milk-spilled-into-manure-pits-as-supplies-overwhelm-u-s-dairies.
5. Changes in the Size and Location of US Dairy Farms, USDA Economic Research Service, 2006, http://www.ers.usda.gov/media/430528/err47b_1_.pdf.
6. Dairy Facts, Food and Education Network, Purdue University, 2008.
7. TPP Final Text Tariff Elimination Schedule, USTR, 2016, https://ustr.gov/sites/default/files/TPP-Final-Text-US-Tariff-Elimination-Schedule.pdf.
8. Fatka, Jacqui, Ag Support for TPP Remains Strong, Feedstuffs, January, 2016.
9. Dougherty, Carter, US Farm Economy: How Globalization Soured Milk Market for American Dairy Farmers, International Business Times, 2015, http://www.ibtimes.com/us-farm-economy-how-globalization-soured-milk-market-ameri-can-dairy-farmers-2117656.
10. Ibid.
11. Weiss, Ben, World’s Largest Dairy Exporter, Soon on Sale, MarketWatch, 2012, http://www.marketwatch.com/story/worlds-largest-dairy-exporter-soon-on-sale-2012-03-06.
12. Dickwell, Jim, World Glut of Milk being felt in Canada, Ireland, New Zealand, AgWeb, 2016, http://www.agweb.com/article/world-glut-of-milk-being-felt-in-canada-ireland-new-zealand-naa-jim-dickrell/.
13. Harwood Schaffer and Daryl Ray, “Trade Effects of bi-lateral trade agreements on U.S. agriculture,” Agricultural Policy Analysis Center, December 31, 2015. http://www.agpolicy.org/weekcol/804.html.
14. Schaffer and Ray, “Question: what makes crop agriculture fly so high and then crash so quickly?” Agricultural Policy Analysis Center, January 29, 2015. http://www.agpolicy.org/weekcol/808.html.
15. Agriculture in the Trans-Pacific Partnership, USDA Economic Research Service, 2014http://www.ers.usda.gov/media/1692509/err176.pdf.
16. Jesse, Ed, US Imports of Concentrated Milk Proteins: What We Know and Don’t Know?, UW Madison, 2003, http://www.fda.gov/ohrms/dockets/dockets/00p0586/00p-0586-bkg0001-62-Ref-60-Jesse-vol25.pdf.
17. Ibid., at 2.
18. http://www.fda.gov/Food/IngredientsPackagingLabeling/GRAS/NoticeIn-ventory/ucm427497.htm; Pete Hardin, Protein Imports Disrupt U.S. Dairy Markets, Weaken Producers,” The Milkweed, May 2012, and Food and Water Watch, “Milk Protein Concentrates”,http://www.foodandwaterwatch.org/sites/default/files/Milk%20Concentrate%20FS.pdf.
19. Hasmukh Patel and Sonia Patel, “Milk Protein Concentrates: Manufacturing and Applications,” U.S. Dairy Export Council, 2014, at 3-4. http://www.usdairy.com/~/media/usd/public/mpc_tech_report_final.pdf.
20. Mulvany, Lydia (cited above).
Assumptions underlying USDA Import Projections:USDA import projections were developed in October, 2014 and published in February, 2015. The projections rely on a range of standard assumptions. They account for the U.S. Agricultural Act of 2014 and for SPS regula-tions as of November, 2014 but assume no further policy shifts after this date. Thus, these projections serve as a neutral reference point against which to evaluate the impacts of future policies such as the TPP.
Data Sources and Methodology: Data on global dairy prices are drawn from Global Dairy Trade’s historical Price Index dataset. Data on dairy imports to the U.S. between 1995 and 2014 come from the USDA Economic Research Service’s “Commercial Disappearance of Milk in all Products” dataset (2015). Dairy import projections are drawn from the “USDA Agricultural Projections to 2024 (2015).” Dairy import values (2010-2025) are given in billions of pounds of milkfat basis. Projected TPP impacts on U.S. dairy imports are drawn from the USDA ERS’ “Agriculture in the Trans-Pacific Partnership (2014).” TPP impacts are presented there as “percent change in value in 2025 relative to baseline, due to TPP.” In our figure, this percent change is applied in a progressively weighted fashion over the 2016-2024 period.
4