Embed Size (px)
Citation preview

DAB Coverage Plan:
Berkshire & North Hampshire
Local Multiplex
Publication date: January 2015
Proposed increases to coverage In December 2013, the Minister for Culture, Communications and Creative Industries, Ed Vaizey MP, announced that Government, multiplex operators and the BBC had agreed to improve the coverage of local multiplexes around the UK. These multiplexes carry both commercial radio services and BBC local or nations’ services.
The proposed improvements entail:
modifications to licensed areas (this term is explained below), to more accurately reflect existing analogue editorial coverage areas;
changes to DAB frequencies in some places; modifications to around 50 existing transmitters; and the implementation of around 190 new transmitters.
While each multiplex carries a range of services, including both commercial radio and the BBC, the aim of the Coverage Plan is to provide DAB coverage which is equivalent to the FM coverage of the relevant large local commercial station in each area.
This coverage is expected to be achieved by mid-2016, as part of the joint funding initiative between Government, the BBC and the multiplex licensee.
This report sets out the predicted coverage of this local multiplex following the programme of enhancements detailed above. The predicted coverage is expressed in terms of the number of households and length of major roads which will be covered, and is also shown in maps. It is worth noting that not all multiplexes will see improvements to coverage as part of this programme, as some already provide good coverage of their licensed areas. Furthermore as roll out proceeds some sites may need to be altered due to implementation issues, and this could affect the coverage predictions shown here. Maps and coverage figures for existing coverage can be found on the Ofcom website here.
DAB coverage maps All local digital radio (DAB) multiplex services have a specified licensed area which is shown on the following maps. This is the geographical area that the multiplex is intended to serve, and within which the coverage of the multiplex is protected from interference from other multiplexes. Any coverage falling outside of this licensed area is neither counted as part of the coverage, nor does Ofcom seek to protect it from interference.
Ofcom DAB coverage maps and figures are produced using the BBC software implementation of the UK planning model (UKPM). The UKPM methodology has been agreed between Ofcom, Arqiva, and the BBC. However, the actual implementation of the UKPM processes does vary between the organisations due to factors such as operating platform and program coding. As a result predictions and coverage figures produced for the same set of wanted and interfering transmitter parameters by different organisations can be expected to exhibit small variations.
The coverage indicated does not represent or imply any warranty by Ofcom that the technical conditions which form the basis of its definition are satisfied at all points within the
area shown, nor that these conditions would not be satisfied at locations outside of that area. The associated technical conditions represent a conservative average threshold (for each relevant measure) for generally acceptable reception for most circumstances: some listeners find these thresholds too low to deliver what they would like, and others enjoy what they regard as adequate reception under worse conditions than those corresponding to these thresholds. Reception quality can differ rapidly with changing location, to a more detailed extent than is shown on the map.
These maps do not take account of adjacent channel interference which may cause localised blocking around any DAB transmitter site not used by the wanted service. However these maps do take account of the interference from other multiplexes expected to be present when the Coverage Plan has been fully implemented.
These maps represent the percentage of locations served1 rather than the specific field strength level predicted at a point, as depicted on Ofcom AM and FM coverage maps. The reason for using this measure is that DAB services provide coverage using multiple transmitters on the same frequency; a single frequency network (SFN). There are two advantages of such a network;
Firstly, the signals from several wanted transmitters may add constructively at the reception point giving a higher wanted signal level,
Secondly, in many locations contributing transmitters may be in different directions from the receive point. So while the path to one transmitter may be obstructed the path to another might not.
The following four maps model a range of DAB coverage scenarios:
Indoor coverage under enhanced propagation conditions. Indoor coverage under normal propagation conditions. Mobile coverage under enhanced propagation conditions. Mobile coverage under normal propagation conditions.
Propagation conditions
The prevailing propagation conditions will have an impact on the levels of incoming interference within the wanted service area. As a result we have predicted the interference limited coverage for:
The effect of interference during enhanced propagation conditions that occur around 1% of the time, usually during high pressure atmospheric conditions.
Normal propagation conditions which occur for the majority of the time.
Ofcom's definition of what constitutes coverage is based on the worst case (enhanced) interference propagation conditions. Actual coverage will therefore generally be significantly more extensive than this.
1 Percentage of locations served is a measure of how many random points the receiver is expected to work at in a 100m square area (the size of a prediction pixel). For example if we state that 95% of locations should be served the radio should work at 95 out of every 100 randomly chosen places within the prediction pixel.

Mobile and indoor reception
Mobile coverage indicates where car and portable radios used outdoors are predicted to receive a signal. Ofcom's definition of mobile coverage is based upon providing a service to motorways and A roads within the licence area with 99% location and time availability. High percentage location and time requirements are deemed necessary in order to minimise the possibility that a stationary vehicle, at traffic lights or road works, might be in an unserved location. Consequently when vehicles are in motion reception may well be possible beyond the predicted coverage and areas of lower percentage location availability are shown to indicate this.
Indoor coverage indicates where a radio with an indoor aerial will operate on the ground floor. This measure takes account of losses as the signal passes through the walls of the building. In the case of indoor coverage we consider 80% locations to be a usable signal and consider 95% of locations to provide robust coverage. We do not believe that coverage at 99% locations is necessary indoors as the listener has the opportunity to position the radio at a number of places. We measure household coverage using a proportional counting system that operates as follows:
o In pixels where coverage is predicted to be at or above 95% locations we consider all households in the pixel to be served.
o In pixels where coverage is predicted to be available at only 80% of locations we will count only 80% of households to be served
o For pixels predicted to have above 80% but less than 95% locations served we will count that percentage of households served. For example if there were 100 households in a pixel predicted to be served at 87% locations we would consider 87 households to be served and 13 households to be un-served.
o While reception will be possible in pixels predicted to have coverage of less than 80% of locations, Ofcom will consider all households within them to be un-served.
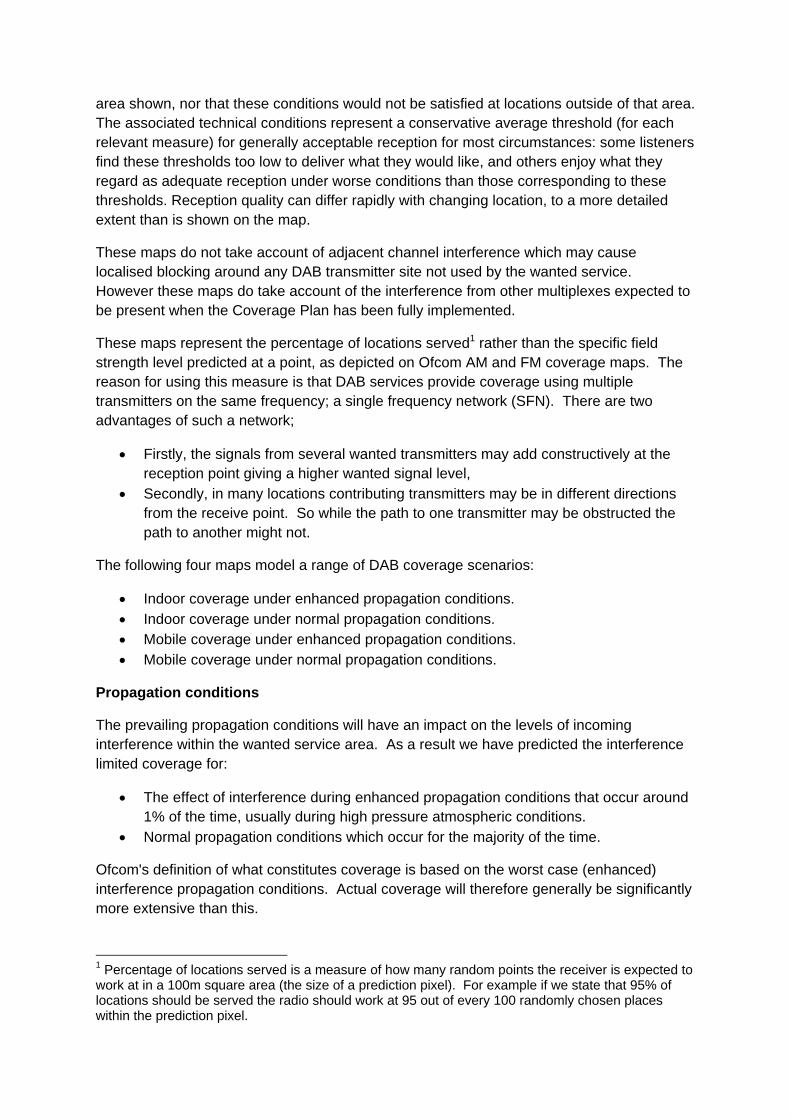
Berkshire and North Hampshire local DAB multiplex (Block 12D) predicted final coverage
Indoor Coverage 1% Time Propagation (HH)
Normal Propagation (HH)
Map Colour
Proportional count: 80% to 95% Locations
379,975 (83.55%) 415,296 (87.22%) Not Applicable
95% Locations 362,245 (76.08%) 377,434 (79.27%) 80% Locations 402,665 (84.57%) 420,352 (88.28%) 70% Locations 420,096 (88.23%) 437,638 (91.91%) Table one, total Households within the Digital Licence Area: 476,138 Households
Outdoor Mobile Coverage 1% Time Propagation (km)
Normal Propagation (km)
Map Colour
99% Locations 626.0 (86.57%) 681.1 (94.20%) 95% Locations 655.1 (90.60%) 699.0 (96.66%) 90% Locations 665.6 (92.06%) 705.5 (97.57%) 70% Locations 686.8 (94.98%) 712.3 (98.50%) Table two, total Motorway and ‘A’ road length within the Digital Licence Area: 723.1 kilometres
Site Name NGR Site height (m) Aerial Height (m) Power (kW) Basingstoke SU 643 479 176 27 1.0 Coppid Beach SU 838 690 90 38 1.0 Dorking Cobbetts Lane
SU 828 592 95 15 0.3
Hannington SU 527 568 229 83 1.0 Hemdean SU 710 763 59 48 1.0 Ibthorpe SU 357 534 215 40 0.4 Maidenhead SU 850 840 85 32 1.0 Membury SU 307 763 211 145 1.0 Newbury VHF SU 494 687 130 32 1.0 Table three, transmitters in use or proposed for the Berkshire and North Hampshire local multiplex. In the above table future sites are highlighted in RED.