Embed Size (px)
Citation preview
SIRRIMED grant agreement nº 245159
Page 1
SEVENTH FRAMEWORK PROGRAMME
THEME 2: Biotechnologies, Agriculture, Food
Collaborative Project – SICA (Mediterranean Partner Countries)
SIRRIMED
Sustainable use of irrigation water
in the Mediterranean Region
Grant agreement: 245159
Start date: 01/07/2010 End date: 31/03/2014 (43 months)
D2.5 Guidelines on Best Irrigation Management Practices for tomato production
in the Mediterranean Area
Lead Beneficiary: IAV-CHA
Dissemination Level
PU = Public
Nature: R = Report
Revision
[Code] Organization
Date &
Visa Due date of
the
deliverable Written by IAV-CHA 12/05/2014
Checked by CEBAS-CSIC 20/05/2014
Validated by Juan Jose Alarcon 31/03/2014 31/03/2014
Revision Date Changes description
SIRRIMED grant agreement nº 245159
Page 2
Table of Contents
1 Introduction .................................................................................................................................. 3 The tomato life cycle and crop climatic requirements ..................................................................... 4
Tomato production in the Souss-Massa region of Morocco ............................................................ 5 2 Objectives of this document:........................................................................................................ 6 3 Practical aspects ........................................................................................................................... 6
Step 1: The calculation is based on the prior determination of the net maximum dose (NMD) of
water to be applied at a given application ........................................................................................ 6
2- The development of the root system for the cultivated variety: depth of maximum
concentration of the roots;.................................................................................................................... 7 3- The irrigation system adopted: percentage of wetted soil surface, taking into account the
disposition of the drip lines, water flow at the dripper and the spacing between drippers in the drip
line; 7 4- The intervention of the operator: fixing the percentage of tolerated reduction of the soil
available water before triggering irrigation. ........................................................................................ 7
Step 2: calculation of reference evapotranspiration ET0 in the greenhouse .................................... 8 Step 3: Calculation of the maximum crop evapotranspiration (ETc) in the greenhouse ................. 9
Step 4: Calculation of the irrigation frequency .............................................................................. 10 4 Monitoring soil and plant water status ....................................................................................... 10 5 Environmental and economic implications ................................................................................ 10
6 Additional information learned .................................................................................................. 11 7 Literature cited ........................................................................................................................... 13
SIRRIMED grant agreement nº 245159
Page 3
1 Introduction
Tomato is a major crop worldwide. Recent statistics indicate a world production of about 162
million tons of which China, the world production leader, has close to 30% (FAOSTAT, 2014).
Furthermore, in many of the Mediterranean countries, particularly those of the southern rim,
agriculture is an important pillar of their economies and tomatoes occupy a significant rank in
agricultural production. For example, Turkey is the largest producer of this crop in the northern
rim (with 11 million tons) whereas Egypt is the largest tomato producer in the southern rim
(with 8 million tons) of the Mediterranean basin (FAOSTAT, 2014) . In Morocco, tomato
occupies 18,000 ha for a total production of 1.2 million tons (ElFadl and Chtaina, 2010). About
5,000 ha are under plastic houses mostly concentrated in the Souss-Massa region located in the
southwestern part of the country with average yields in the vicinity of 150 tons/ha but can reach
220-250 tons/ha when all of the production techniques are optimal.
In addition, water is becoming very scarce in many parts of the Mediterranean region and,
therefore, its use should be done very efficiently for maximizing production with less water. In
many parts of this basin, the climate is semi arid with dry summers and generally humid and
wet winters. However, rainfall is low particularly in the southern rim and the case of the Souss-
Massa region of Morocco is a good example with an average of 200 mm/ year. In this region,
autumns and springs are relatively warm with average temperature of 15-20°C and summers
are quite hot with temperatures reaching over 40° during July-August. Air is relatively dry with
relative air humidity in the vicinity of 60-70% but can reach lows of 10-20% in the day and
highs of 90% at night almost any time of the year (ElKissi, 2013). In addition, rain is not regular
from year-to-year and varies also within the season.
It is noteworthy that sunlight is plentiful and winters are usually mild with the lowest
temperatures ranging between 7 and 10°C in countries of the southern rim of the Mediterranean
basin making it unnecessary to heat the greenhouses which are generally all in plastic.
These conditions plus the fact that the plants are grown under greenhouse make irrigation a
must throughout the growth and development stages of the plant. In fact, water use for tomato
irrigation is in the range of 8,000 to 10,000 m2/ha depending on factors such as climate, length
of the production cycle, type of production (open field or greenhouse), type of irrigation system
(localized or surface irrigation) etc. Letard et al. (1995) indicated that for Daniela cultivar sown
in November and grown under greenhouse with harvests between March and November of the
SIRRIMED grant agreement nº 245159
Page 4
following year leading to a production of 420 tons/ha, water consumption by the plants was
7236 m3/ha from a water supply of 10,643 m3/ha.
The tomato life cycle and crop climatic requirements
The description of the tomato plant and its life cycle has been reported in many
publications (see Jones, 1999). The following is a brief summary.
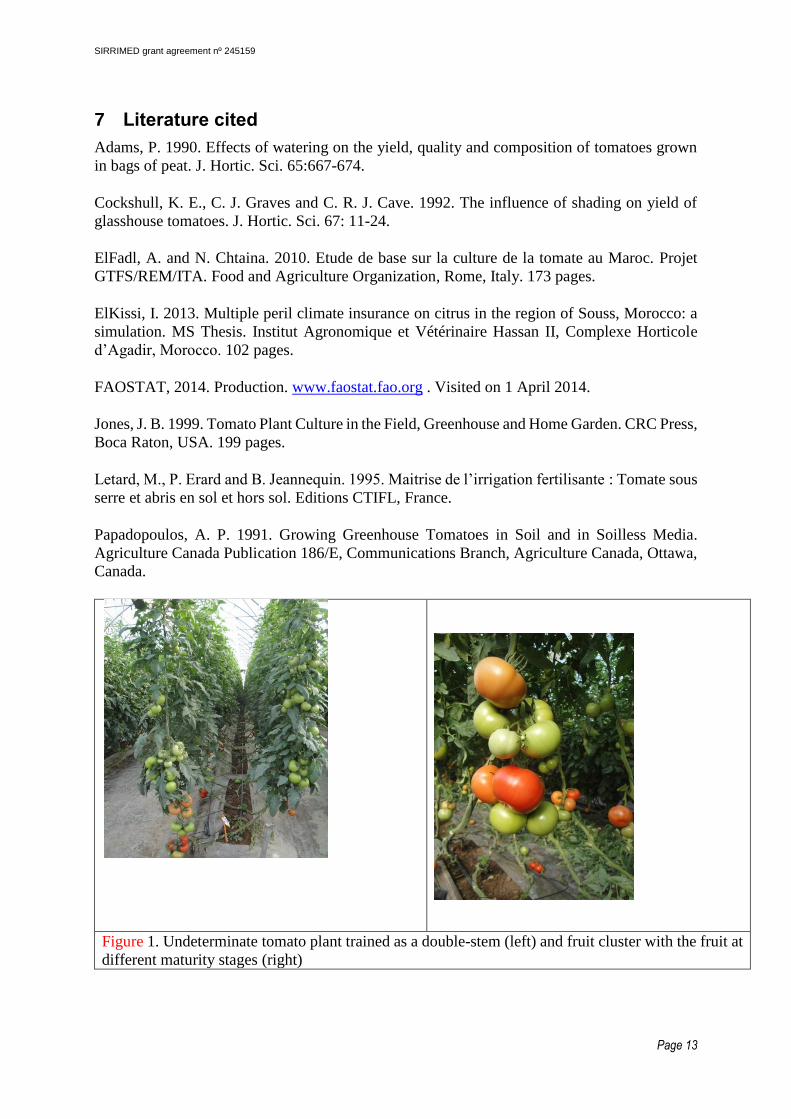
There are two types of the cultivated tomato: the indeterminate type (Figure 1) trained as a vine
with a single stem with all side shoots removed, and the determinate type terminating in a
flower cluster with shoot elongation stopping. The first type is for long-season production as
the plants will continue producing flower cluster and, thus, fruits as long as they are properly
maintained in terms of irrigation, fertilization, disease control etc. The second type, however,
is suitable for short-season producing areas and, because fruit mature at one time, for
mechanical harvesting as for processing tomato.
The optimum air temperature suitable for tomato growth and development and fruit set is in the
range of 18-26 °C (Jones, 1999). The time from planting to harvest of the first fruit cluster is
about 2 months but can vary with temperature with shorter interval under warm and longer
interval under cool temperatures. Cultivation under greenhouse conditions where the air volume
is confined allows for climate and better pest and disease control compared to field conditions,
thereby keeping the tomato plant producing over a long period of time. Under Mediterranean
conditions, particularly in countries located in southern rim, relatively mild winters (with
average temperatures > 5-7°C) allow for production under plastic houses with little or no
heating required.
Tomato plant can flower under conditions of either short or long days and is thus adapted to
most latitudes. The inflorescence is a monochasial cyme of 4 to 12 perfect and hypogenous
flowers (Jones, 1999). Cultivated tomato are self-fertile and can self-pollinate but physical
vibration of the flower either by mechanical means or by insect is essential for complete
pollination to produce symmetrical and normally shaped fruit. Flower abortion can occur under
stress (water stress, heat stress, cold stress etc.), or low light or lack of pollination.
Fruit production is directly related to solar radiation. Cockshull et al. (1992) reported that in
UK yields of 2.01 kg of fresh fruit were harvested for every 100 megajoules of solar radiation
from February to May, and during the longer light days production increased to 2.65 kg for the
same light energy input. However, high light intensity is also detrimental to fruit production,
quality and size which, under low latitudes and in summer months, obliges growers to either
SIRRIMED grant agreement nº 245159
Page 5
cover the greenhouses by shading material or by applying whitewash on the greenhouse to
reduce light intensity for better plant performance
Air temperature has a significant effect on atmospheric demand (crop evapotranspiration)
increasing with increasing temperature. However, the relationship between air temperature and
relative humidity can moderate the transpiration rate, reducing the atmospheric demand with
increasing humidity.
Fruit yield and quality are affected by water restriction/ supply to the plant (Adams, 1990;
Papadopoulos, 1991). In particular, Adams (1990) reported that restricting water supply to 80%
or less of crop water needs reduces yield due to a reduction in fruit size but improved fruit
flavor
Tomato production in the Souss-Massa region of Morocco
In the Souss-Massa region of Morocco, greenhouse tomato is planted under plastic
houses during the months of July-September for production during winter months mostly for
export to the European market. In fact, during this period, in Europe, particularly at higher
latitudes, temperatures are very cold and day-lengths very short requiring heating and lighting
for optimum production, thus making production costs very high whereas in the Souss-Massa
region, temperatures are mild and light duration and intensity are adequate for good fruit
production.
During recent years, use of grafted tomato plants is common practice with rootstocks having
resistance to nematodes and other plant pests. Planting density may vary from 10,000 to 20,000
plants/ha. Under low density planting, plants are trained to maintain a double stem while under
high density they are usually trained as a 2-stem. Successful production can continue for about
8-9 months provided that cultural practices and conditions are optimal for maximum yield, fruit
size and quality. During this period of time, plants produce an average of 25 flower/ fruit
clusters.
Because tomato flowers are not attractive to honeybees and because honeybees are less active
under greenhouse conditions, bumblebees are usually placed in the greenhouse for satisfactory
pollination.
Fruit is harvested according to its maturity stage based on color (Figure 1). First harvests occur
about 60 days after planting and harvests are less frequent during the cooler periods and more
frequent during warm periods. In general, harvests occur at 3- to 5-day intervals (higher
temperatures favor shorter intervals).
SIRRIMED grant agreement nº 245159
Page 6
Furthermore, to increase water use efficiency in the region, irrigation is essentially done using
the drip system where water and fertilizer are applied together. Soilless culture using a substrate
such as sand or coconut fiber is developing and becoming a common practice.
2 Objectives of this document:
The main objectives of the present document are:
- To develop guidelines for best irrigation management practices (BIMP) for tomatoes grown
under greenhouse conditions in the Mediterranean region.
- To develop these BIMPs based on acquired information during a three-year study under the
SIRRIMED Project using the specific method known as “fixed dose (which is related to soil
texture) and variable frequency (related to climate) of water supply” which leads précised
irrigation scheduling and allows for water saving.
- To provide information on the calculation of the water dose to apply and the frequency of its
application based on parameters related to the climatic conditions in the greenhouse, the
substrate and plant development stage.
3 Practical aspects
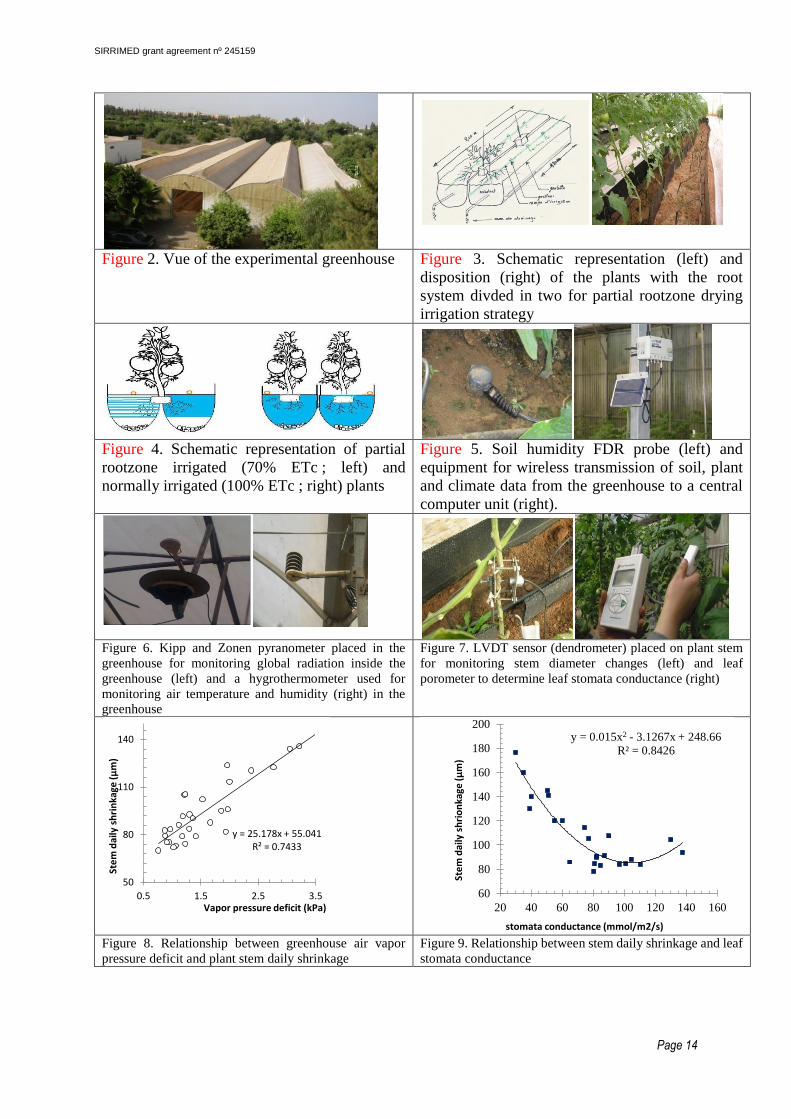
To achieve the above-defined objectives, tomato plants were grown under greenhouse
conditions (Figure 2) in a soilless system using sand as substrate with the characteristics
reported below, and the root system divided in two halves as shown in Figure 3 for application
of the “partial rootzone drying” irrigation technique (Figure 4). To monitor soil humidity, FDR
soil humidity probes were used (Figure 5) and to follow changes in greenhouse environmental
conditions, Kipp and Zonen pyranometer (for global radiation), and a thermohygrometer were
used (Figure 6) and data were sent to a central computer unit by wireless system (Figure 5) for
storage and processing. Real time changes in the plant stem diameter as a result of the plant
water status were also recorded using LVDT (dendrometers) (Figure 7). For physiological
parameters, leaf stomatal conductance was measured by a leaf porometer (Figure 7) and leaf
net photosynthesis was determined using an LCi-SD apparatus.
To determine water dose and frequency of application, several steps are necessary as described
in the sections below.
Step 1: The calculation is based on the prior determination of the net maximum dose (NMD) of
water to be applied at a given application
The formula used to this regard has the advantage of incorporating in its design the following
parameters:
SIRRIMED grant agreement nº 245159
Page 7
1- The intrinsic properties of the substrate : specific characteristics of the substrate (soil
or other) in relation to the retention of water (i.e.; moisture at field capacity, moisture
at permanent wilting point, and soil available water) should be defined and known by
the operator;
2- The development of the root system for the cultivated variety: depth of maximum
concentration of the roots;
3- The irrigation system adopted: percentage of wetted soil surface, taking into account the
disposition of the drip lines, water flow at the dripper and the spacing between drippers
in the drip line;
4- The intervention of the operator: fixing the percentage of tolerated reduction of the soil
available water before triggering irrigation.
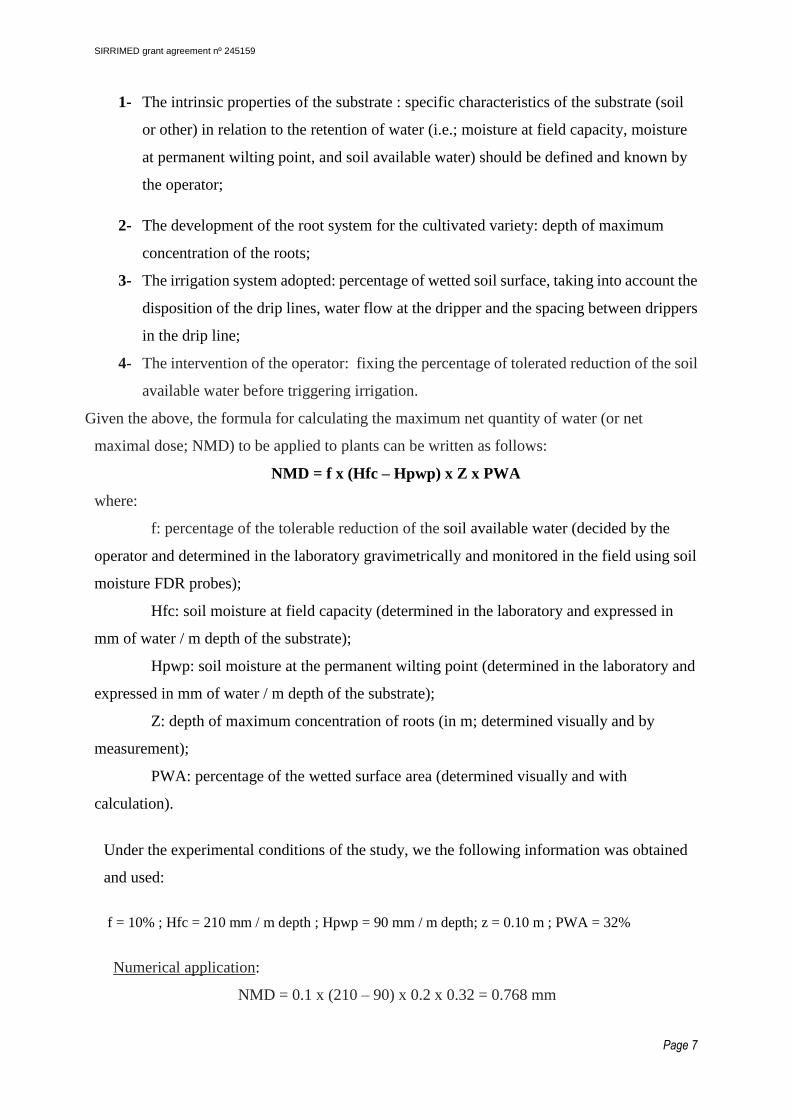
Given the above, the formula for calculating the maximum net quantity of water (or net
maximal dose; NMD) to be applied to plants can be written as follows:
NMD = f x (Hfc – Hpwp) x Z x PWA
where:
f: percentage of the tolerable reduction of the soil available water (decided by the
operator and determined in the laboratory gravimetrically and monitored in the field using soil
moisture FDR probes);
Hfc: soil moisture at field capacity (determined in the laboratory and expressed in
mm of water / m depth of the substrate);
Hpwp: soil moisture at the permanent wilting point (determined in the laboratory and
expressed in mm of water / m depth of the substrate);
Z: depth of maximum concentration of roots (in m; determined visually and by
measurement);
PWA: percentage of the wetted surface area (determined visually and with
calculation).
Under the experimental conditions of the study, we the following information was obtained
and used:
f = 10% ; Hfc = 210 mm / m depth ; Hpwp = 90 mm / m depth; z = 0.10 m ; PWA = 32%
Numerical application:
NMD = 0.1 x (210 – 90) x 0.2 x 0.32 = 0.768 mm
SIRRIMED grant agreement nº 245159
Page 8
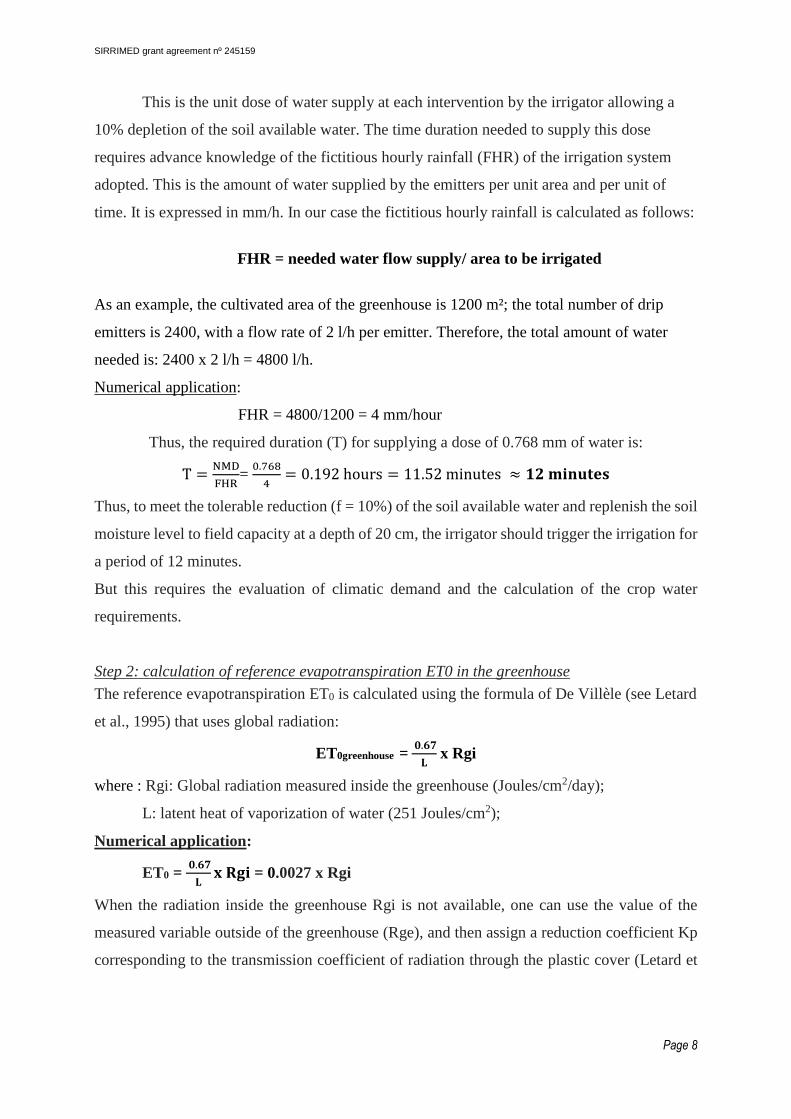
This is the unit dose of water supply at each intervention by the irrigator allowing a
10% depletion of the soil available water. The time duration needed to supply this dose
requires advance knowledge of the fictitious hourly rainfall (FHR) of the irrigation system
adopted. This is the amount of water supplied by the emitters per unit area and per unit of
time. It is expressed in mm/h. In our case the fictitious hourly rainfall is calculated as follows:
FHR = needed water flow supply/ area to be irrigated
As an example, the cultivated area of the greenhouse is 1200 m²; the total number of drip
emitters is 2400, with a flow rate of 2 l/h per emitter. Therefore, the total amount of water
needed is: 2400 x 2 l/h = 4800 l/h.
Numerical application:
FHR = 4800/1200 = 4 mm/hour
Thus, the required duration (T) for supplying a dose of 0.768 mm of water is:
T =NMD
FHR=
0.768
4 = 0.192 hours = 11.52 minutes ≈ 𝟏𝟐 𝐦𝐢𝐧𝐮𝐭𝐞𝐬
Thus, to meet the tolerable reduction (f = 10%) of the soil available water and replenish the soil
moisture level to field capacity at a depth of 20 cm, the irrigator should trigger the irrigation for
a period of 12 minutes.
But this requires the evaluation of climatic demand and the calculation of the crop water
requirements.
Step 2: calculation of reference evapotranspiration ET0 in the greenhouse
The reference evapotranspiration ET0 is calculated using the formula of De Villèle (see Letard
et al., 1995) that uses global radiation:
ET0greenhouse = 𝟎.𝟔𝟕
𝐋 x Rgi
where : Rgi: Global radiation measured inside the greenhouse (Joules/cm2/day);
L: latent heat of vaporization of water (251 Joules/cm2);
Numerical application:
ET0 = 𝟎.𝟔𝟕
𝐋𝐱 𝐑𝐠𝐢 = 0.0027 x Rgi
When the radiation inside the greenhouse Rgi is not available, one can use the value of the
measured variable outside of the greenhouse (Rge), and then assign a reduction coefficient Kp
corresponding to the transmission coefficient of radiation through the plastic cover (Letard et
SIRRIMED grant agreement nº 245159
Page 9
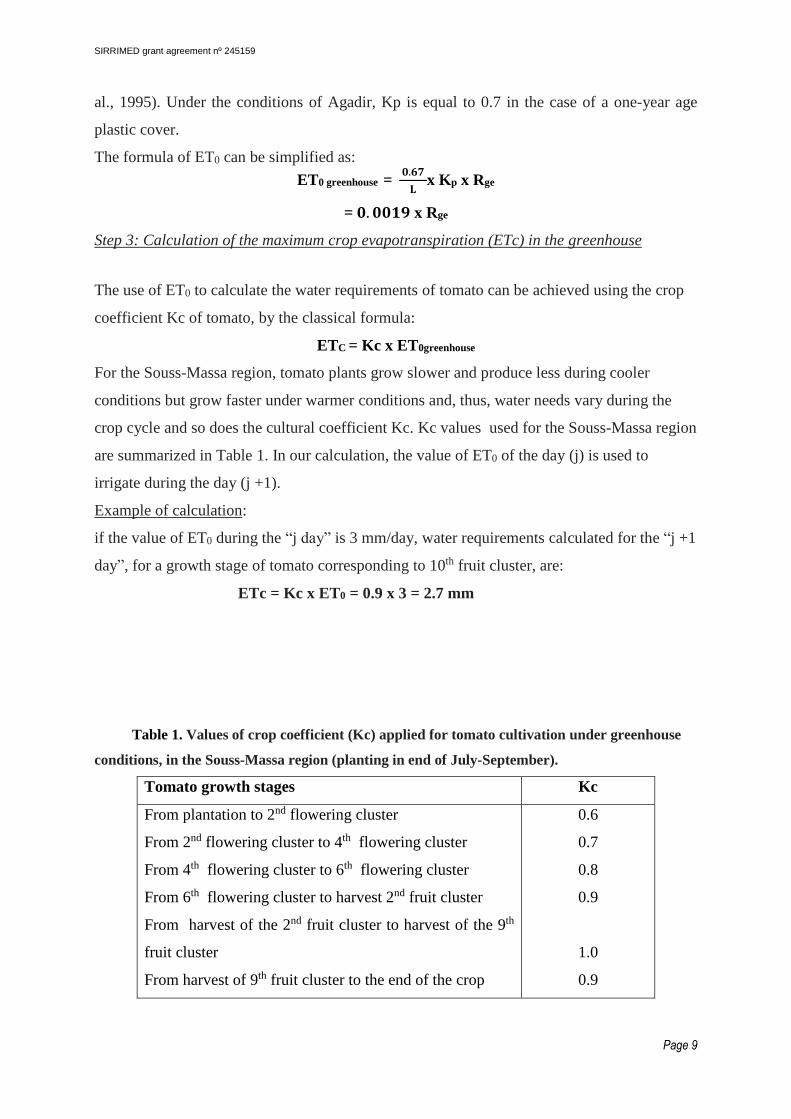
al., 1995). Under the conditions of Agadir, Kp is equal to 0.7 in the case of a one-year age
plastic cover.
The formula of ET0 can be simplified as:
ET0 greenhouse = 𝟎.𝟔𝟕
𝐋x Kp x Rge
= 𝟎. 𝟎𝟎𝟏𝟗 x Rge
Step 3: Calculation of the maximum crop evapotranspiration (ETc) in the greenhouse
The use of ET0 to calculate the water requirements of tomato can be achieved using the crop
coefficient Kc of tomato, by the classical formula:
ETC = Kc x ET0greenhouse
For the Souss-Massa region, tomato plants grow slower and produce less during cooler
conditions but grow faster under warmer conditions and, thus, water needs vary during the
crop cycle and so does the cultural coefficient Kc. Kc values used for the Souss-Massa region
are summarized in Table 1. In our calculation, the value of ET0 of the day (j) is used to
irrigate during the day (j +1).
Example of calculation:
if the value of ET0 during the “j day” is 3 mm/day, water requirements calculated for the “j +1
day”, for a growth stage of tomato corresponding to 10th fruit cluster, are:
ETc = Kc x ET0 = 0.9 x 3 = 2.7 mm
Table 1. Values of crop coefficient (Kc) applied for tomato cultivation under greenhouse
conditions, in the Souss-Massa region (planting in end of July-September).
Tomato growth stages Kc
From plantation to 2nd flowering cluster
From 2nd flowering cluster to 4th flowering cluster
From 4th flowering cluster to 6th flowering cluster
From 6th flowering cluster to harvest 2nd fruit cluster
From harvest of the 2nd fruit cluster to harvest of the 9th
fruit cluster
From harvest of 9th fruit cluster to the end of the crop
0.6
0.7
0.8
0.9
1.0
0.9
SIRRIMED grant agreement nº 245159
Page 10
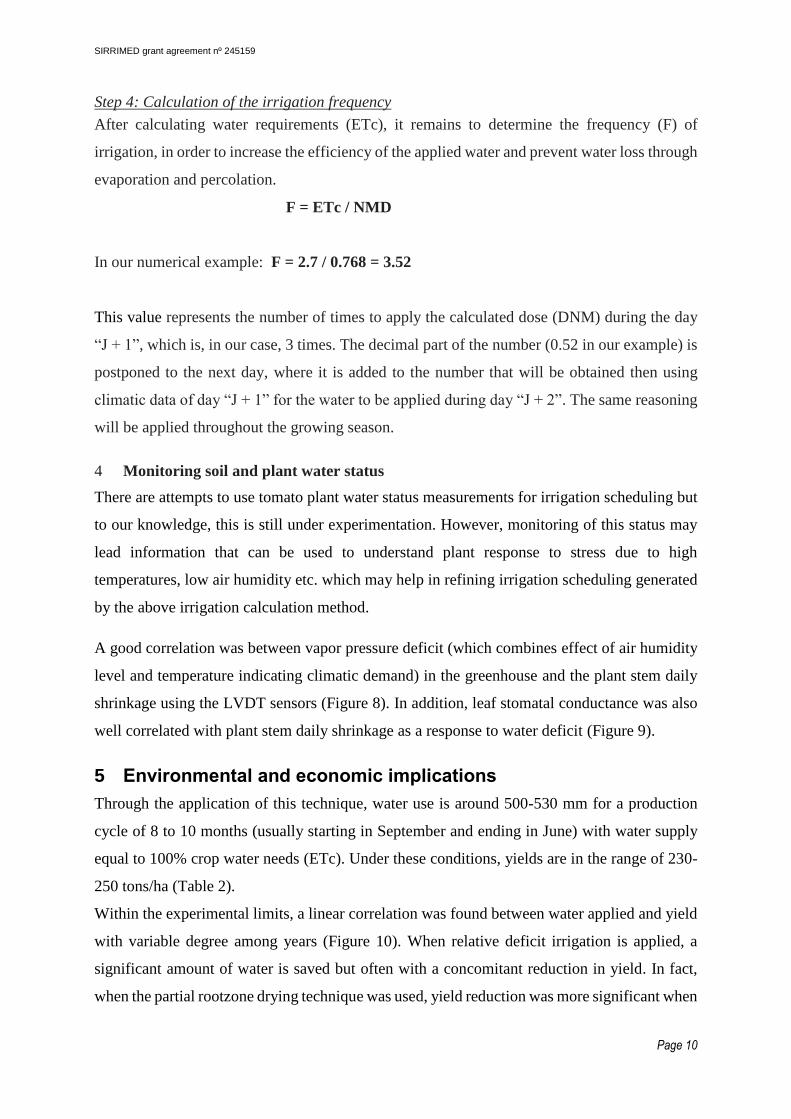
Step 4: Calculation of the irrigation frequency
After calculating water requirements (ETc), it remains to determine the frequency (F) of
irrigation, in order to increase the efficiency of the applied water and prevent water loss through
evaporation and percolation.
F = ETc / NMD
In our numerical example: F = 2.7 / 0.768 = 3.52
This value represents the number of times to apply the calculated dose (DNM) during the day
“J + 1”, which is, in our case, 3 times. The decimal part of the number (0.52 in our example) is
postponed to the next day, where it is added to the number that will be obtained then using
climatic data of day “J + 1” for the water to be applied during day “J + 2”. The same reasoning
will be applied throughout the growing season.
4 Monitoring soil and plant water status
There are attempts to use tomato plant water status measurements for irrigation scheduling but
to our knowledge, this is still under experimentation. However, monitoring of this status may
lead information that can be used to understand plant response to stress due to high
temperatures, low air humidity etc. which may help in refining irrigation scheduling generated
by the above irrigation calculation method.
A good correlation was between vapor pressure deficit (which combines effect of air humidity
level and temperature indicating climatic demand) in the greenhouse and the plant stem daily
shrinkage using the LVDT sensors (Figure 8). In addition, leaf stomatal conductance was also
well correlated with plant stem daily shrinkage as a response to water deficit (Figure 9).
5 Environmental and economic implications
Through the application of this technique, water use is around 500-530 mm for a production
cycle of 8 to 10 months (usually starting in September and ending in June) with water supply
equal to 100% crop water needs (ETc). Under these conditions, yields are in the range of 230-
250 tons/ha (Table 2).
Within the experimental limits, a linear correlation was found between water applied and yield
with variable degree among years (Figure 10). When relative deficit irrigation is applied, a
significant amount of water is saved but often with a concomitant reduction in yield. In fact,
when the partial rootzone drying technique was used, yield reduction was more significant when
SIRRIMED grant agreement nº 245159
Page 11
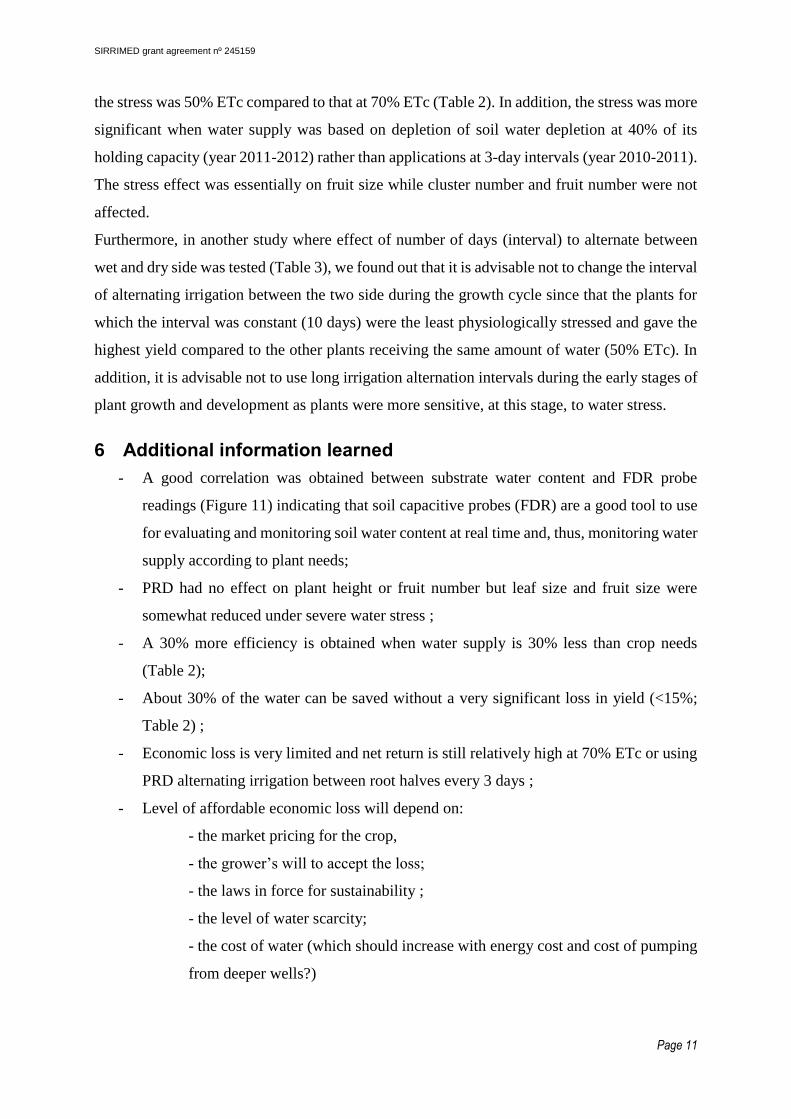
the stress was 50% ETc compared to that at 70% ETc (Table 2). In addition, the stress was more
significant when water supply was based on depletion of soil water depletion at 40% of its
holding capacity (year 2011-2012) rather than applications at 3-day intervals (year 2010-2011).
The stress effect was essentially on fruit size while cluster number and fruit number were not
affected.
Furthermore, in another study where effect of number of days (interval) to alternate between
wet and dry side was tested (Table 3), we found out that it is advisable not to change the interval
of alternating irrigation between the two side during the growth cycle since that the plants for
which the interval was constant (10 days) were the least physiologically stressed and gave the
highest yield compared to the other plants receiving the same amount of water (50% ETc). In
addition, it is advisable not to use long irrigation alternation intervals during the early stages of
plant growth and development as plants were more sensitive, at this stage, to water stress.
6 Additional information learned
- A good correlation was obtained between substrate water content and FDR probe
readings (Figure 11) indicating that soil capacitive probes (FDR) are a good tool to use
for evaluating and monitoring soil water content at real time and, thus, monitoring water
supply according to plant needs;
- PRD had no effect on plant height or fruit number but leaf size and fruit size were
somewhat reduced under severe water stress ;
- A 30% more efficiency is obtained when water supply is 30% less than crop needs
(Table 2);
- About 30% of the water can be saved without a very significant loss in yield (<15%;
Table 2) ;
- Economic loss is very limited and net return is still relatively high at 70% ETc or using
PRD alternating irrigation between root halves every 3 days ;
- Level of affordable economic loss will depend on:
- the market pricing for the crop,
- the grower’s will to accept the loss;
- the laws in force for sustainability ;
- the level of water scarcity;
- the cost of water (which should increase with energy cost and cost of pumping
from deeper wells?)
SIRRIMED grant agreement nº 245159
Page 12
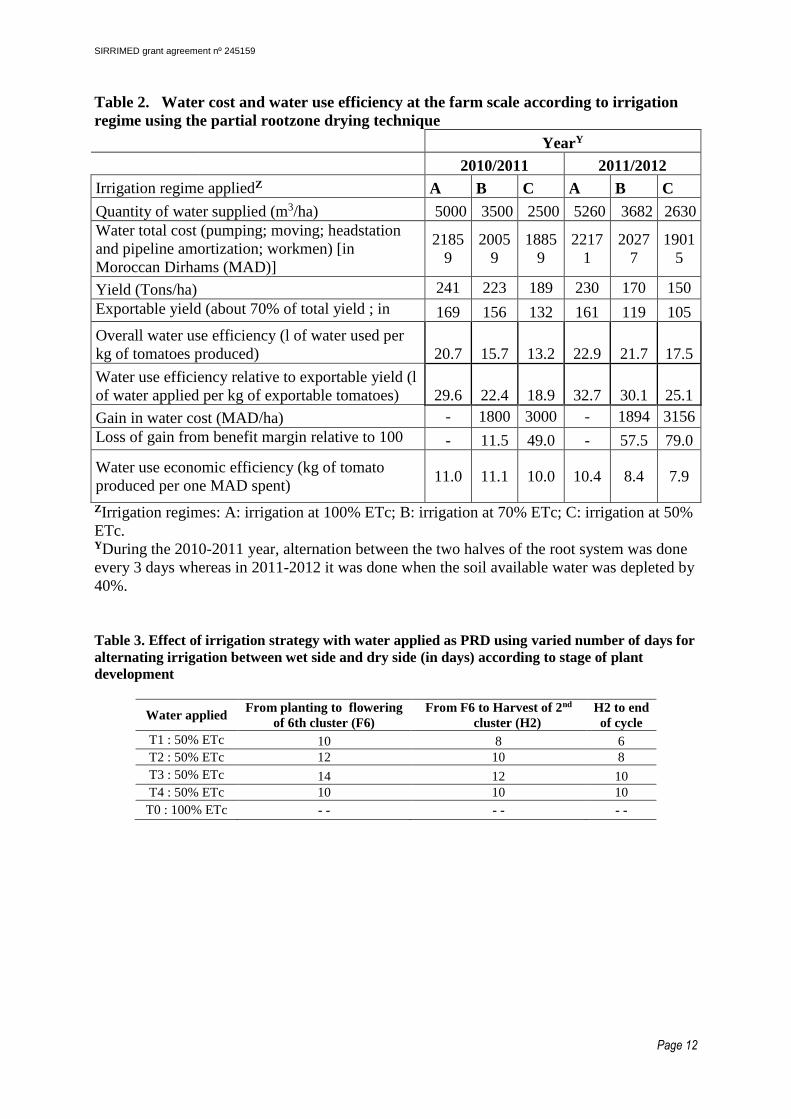
Table 2. Water cost and water use efficiency at the farm scale according to irrigation
regime using the partial rootzone drying technique
YearY
2010/2011 2011/2012
Irrigation regime appliedZ A B C A B C
Quantity of water supplied (m3/ha) 5000 3500 2500 5260 3682 2630
Water total cost (pumping; moving; headstation
and pipeline amortization; workmen) [in
Moroccan Dirhams (MAD)]
2185
9
2005
9
1885
9
2217
1
2027
7
1901
5
Yield (Tons/ha) 241 223 189 230 170 150
Exportable yield (about 70% of total yield ; in
Tons/ha) 169 156 132 161 119 105
Overall water use efficiency (l of water used per
kg of tomatoes produced) 20.7 15.7 13.2 22.9 21.7 17.5
Water use efficiency relative to exportable yield (l
of water applied per kg of exportable tomatoes) 29.6 22.4 18.9 32.7 30.1 25.1
Gain in water cost (MAD/ha) - 1800 3000 - 1894 3156
Loss of gain from benefit margin relative to 100
ETc (in %)
(water regime A)
%
- 11.5 49.0 - 57.5 79.0
Water use economic efficiency (kg of tomato
produced per one MAD spent) 11.0 11.1 10.0 10.4 8.4 7.9
ZIrrigation regimes: A: irrigation at 100% ETc; B: irrigation at 70% ETc; C: irrigation at 50%
ETc. YDuring the 2010-2011 year, alternation between the two halves of the root system was done
every 3 days whereas in 2011-2012 it was done when the soil available water was depleted by
40%.
Table 3. Effect of irrigation strategy with water applied as PRD using varied number of days for
alternating irrigation between wet side and dry side (in days) according to stage of plant
development
Water applied From planting to flowering
of 6th cluster (F6)
From F6 to Harvest of 2nd
cluster (H2)
H2 to end
of cycle
T1 : 50% ETc 10 8 6
T2 : 50% ETc 12 10 8
T3 : 50% ETc 14 12 10
T4 : 50% ETc 10 10 10
T0 : 100% ETc - - - - - -
SIRRIMED grant agreement nº 245159
Page 13
7 Literature cited
Adams, P. 1990. Effects of watering on the yield, quality and composition of tomatoes grown
in bags of peat. J. Hortic. Sci. 65:667-674.
Cockshull, K. E., C. J. Graves and C. R. J. Cave. 1992. The influence of shading on yield of
glasshouse tomatoes. J. Hortic. Sci. 67: 11-24.
ElFadl, A. and N. Chtaina. 2010. Etude de base sur la culture de la tomate au Maroc. Projet
GTFS/REM/ITA. Food and Agriculture Organization, Rome, Italy. 173 pages.
ElKissi, I. 2013. Multiple peril climate insurance on citrus in the region of Souss, Morocco: a
simulation. MS Thesis. Institut Agronomique et Vétérinaire Hassan II, Complexe Horticole
d’Agadir, Morocco. 102 pages.
FAOSTAT, 2014. Production. www.faostat.fao.org . Visited on 1 April 2014.
Jones, J. B. 1999. Tomato Plant Culture in the Field, Greenhouse and Home Garden. CRC Press,
Boca Raton, USA. 199 pages.
Letard, M., P. Erard and B. Jeannequin. 1995. Maitrise de l’irrigation fertilisante : Tomate sous
serre et abris en sol et hors sol. Editions CTIFL, France.
Papadopoulos, A. P. 1991. Growing Greenhouse Tomatoes in Soil and in Soilless Media.
Agriculture Canada Publication 186/E, Communications Branch, Agriculture Canada, Ottawa,
Canada.
Figure 1. Undeterminate tomato plant trained as a double-stem (left) and fruit cluster with the fruit at
different maturity stages (right)
SIRRIMED grant agreement nº 245159
Page 14
Figure 2. Vue of the experimental greenhouse Figure 3. Schematic representation (left) and
disposition (right) of the plants with the root
system divded in two for partial rootzone drying
irrigation strategy
Figure 4. Schematic representation of partial
rootzone irrigated (70% ETc ; left) and
normally irrigated (100% ETc ; right) plants
Figure 5. Soil humidity FDR probe (left) and
equipment for wireless transmission of soil, plant
and climate data from the greenhouse to a central
computer unit (right).
Figure 6. Kipp and Zonen pyranometer placed in the
greenhouse for monitoring global radiation inside the
greenhouse (left) and a hygrothermometer used for
monitoring air temperature and humidity (right) in the
greenhouse
Figure 7. LVDT sensor (dendrometer) placed on plant stem
for monitoring stem diameter changes (left) and leaf
porometer to determine leaf stomata conductance (right)
Figure 8. Relationship between greenhouse air vapor
pressure deficit and plant stem daily shrinkage
Figure 9. Relationship between stem daily shrinkage and leaf
stomata conductance
y = 25.178x + 55.041R² = 0.7433
50
80
110
140
0.5 1.5 2.5 3.5
Ste
m d
aily
sh
rin
kage
(µ
m)
Vapor pressure deficit (kPa)
y = 0.015x2 - 3.1267x + 248.66
R² = 0.8426
60
80
100
120
140
160
180
200
20 40 60 80 100 120 140 160
Ste
m d
aily
sh
rio
nka
ge (
µm
)
stomata conductance (mmol/m2/s)

SIRRIMED grant agreement nº 245159
Page 15
Figure 10. Correlation between water supply during the
crop cycle and total fruit yield for tomato
Figure 11. Correlation between substrate water content and
values given by soil FDR probes
y1 = 0,034x + 142,4R² = 0,862
y2 = 0,039x + 60,17R² = 0,844
y3 = 0,014x + 80,78R² = 0,541
100
120
140
160
180
200
220
240
260
280
300
1000 3000 5000 7000
Tota
l yie
ld (
T/h
a)
Water supply (m3/ha)
year 1
year 2
year 3
y = 0.2222x - 3.5229R² = 0.781
1.0
4.0
7.0
10.0
13.0
27 37 47 57 67
Sub
stra
te w
ate
r co
nte
nt
(%
) m
eas
ure
d in
th
e la
bo
rato
ry
Value given by FDR probe (SFU)