Embed Size (px)
Citation preview
CUSTOMS CLEARANCE FACILITATION COMMITTEE MEETING
on
29th SEPTEMBER, 2015
at
Custom House, Chennai
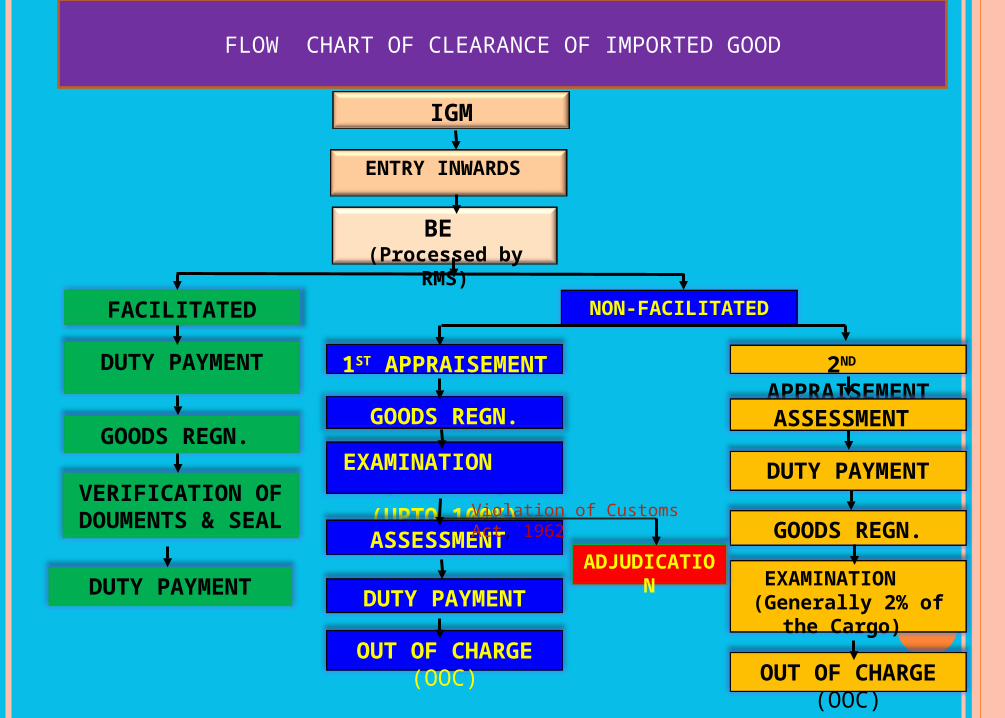
IGM
BE (Processed by RMS)
FACILITATED NON-FACILITATED
DUTY PAYMENT
GOODS REGN.
1ST APPRAISEMENT
GOODS REGN.
EXAMINATION (UPTO 100%)
ASSESSMENT
DUTY PAYMENT
OUT OF CHARGE (OOC)
2ND APPRAISEMENT
ASSESSMENT
DUTY PAYMENT
GOODS REGN.
EXAMINATION (Generally 2% of the
Cargo)
OUT OF CHARGE (OOC)
VERIFICATION OF DOUMENTS & SEAL
ENTRY INWARDS
DUTY PAYMENTADJUDICATION
Violation of Customs Act, 1962
FLOW CHART OF CLEARANCE OF IMPORTED GOOD
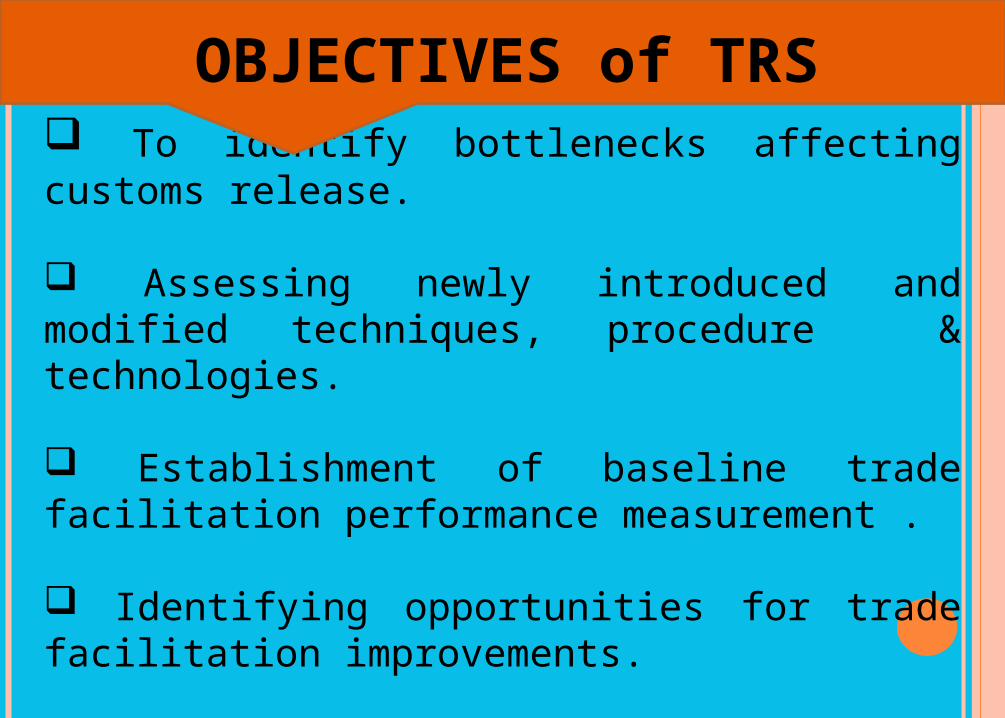
To identify bottlenecks affecting customs release.
Assessing newly introduced and modified techniques, procedure & technologies.
Establishment of baseline trade facilitation performance measurement .
Identifying opportunities for trade facilitation improvements.
Facilitates ‘ease of doing business’.
OBJECTIVES of TRS
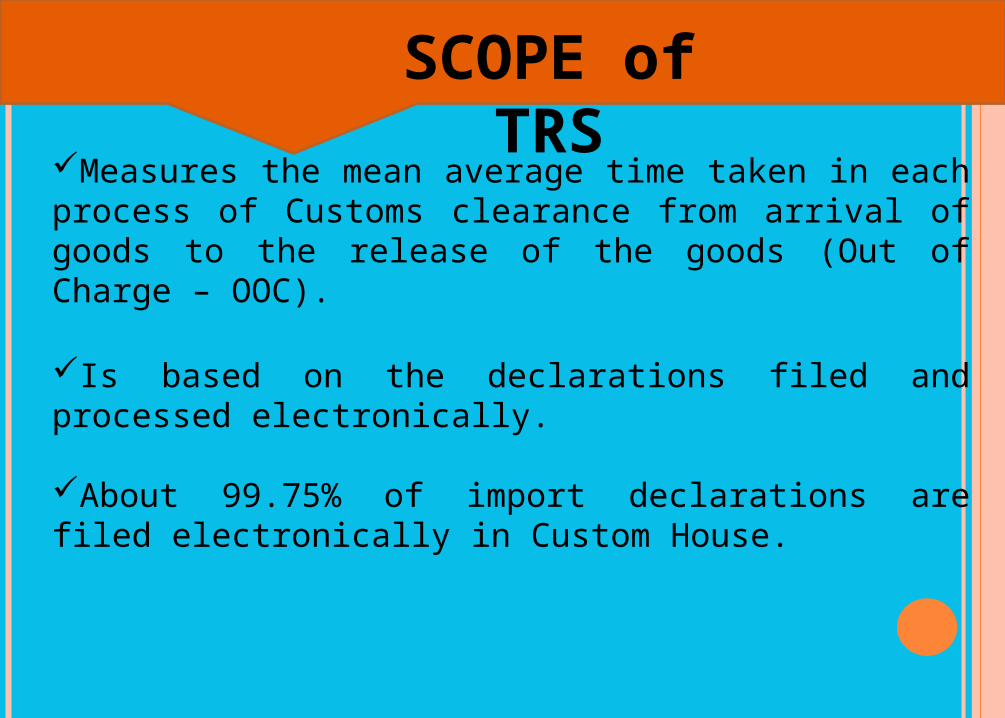
Measures the mean average time taken in each process of Customs clearance from arrival of goods to the release of the goods (Out of Charge – OOC).
Is based on the declarations filed and processed electronically.
About 99.75% of import declarations are filed electronically in Custom House.
SCOPE of TRS
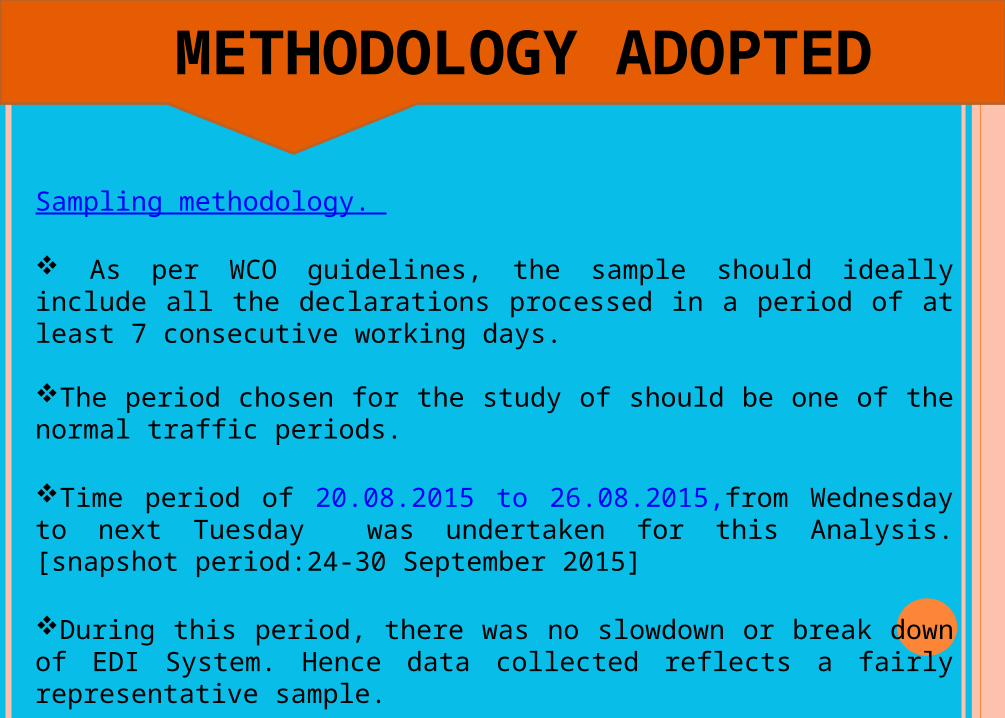
METHODOLOGY ADOPTED
Sampling methodology.
As per WCO guidelines, the sample should ideally include all the declarations processed in a period of at least 7 consecutive working days.
The period chosen for the study of should be one of the normal traffic periods.
Time period of 20.08.2015 to 26.08.2015,from Wednesday to next Tuesday was undertaken for this Analysis.[snapshot period:24-30 September 2015]
During this period, there was no slowdown or break down of EDI System. Hence data collected reflects a fairly representative sample.
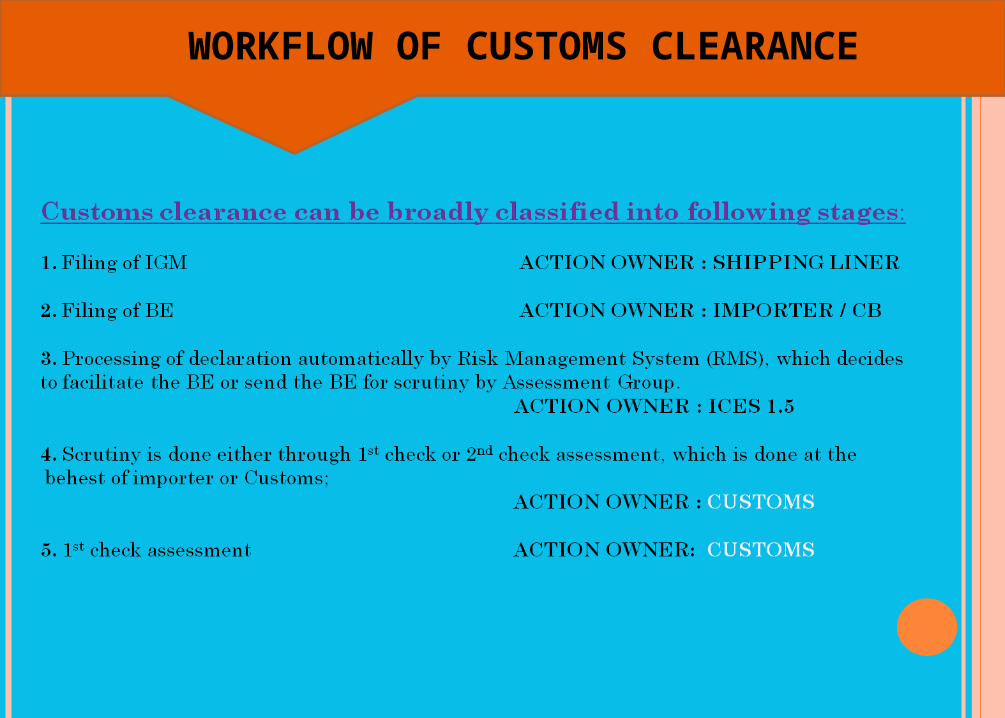
WORKFLOW OF CUSTOMS CLEARANCE
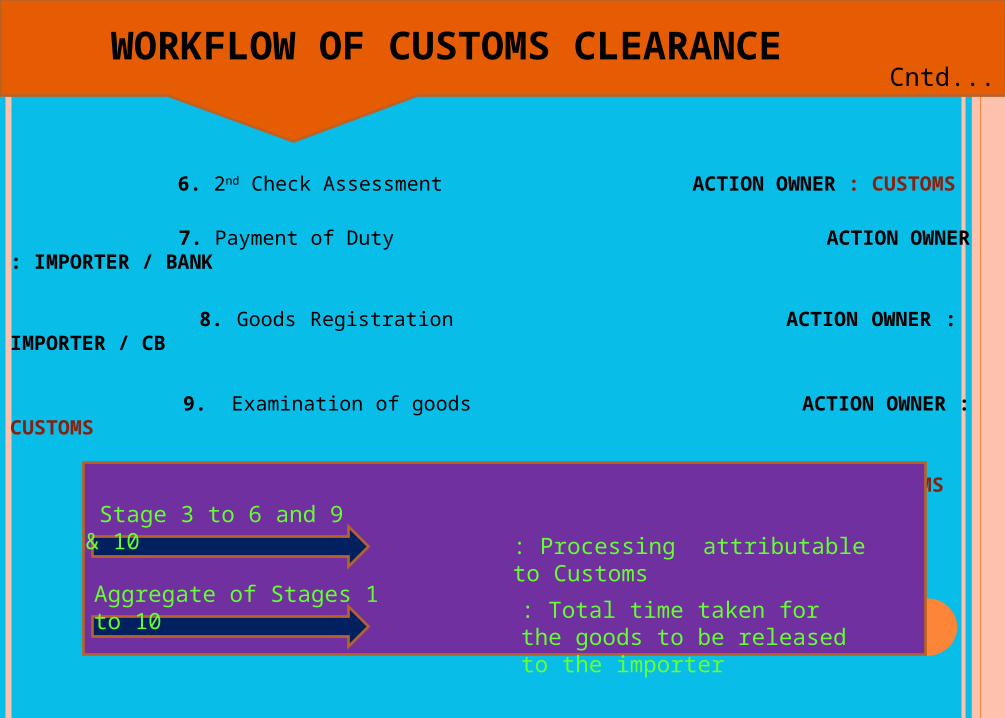
WORKFLOW OF CUSTOMS CLEARANCE
6. 2nd Check Assessment ACTION OWNER : CUSTOMS
7. Payment of Duty ACTION OWNER : IMPORTER / BANK
8. Goods Registration ACTION OWNER : IMPORTER / CB
9. Examination of goods ACTION OWNER : CUSTOMS
10. Out of Charge (OOC) in ICES. ACTION OWNER : CUSTOMS
Cntd...
Stage 3 to 6 and 9 & 10
: Processing attributable to Customs
Aggregate of Stages 1 to 10 : Total time taken for the goods to be released to the importer
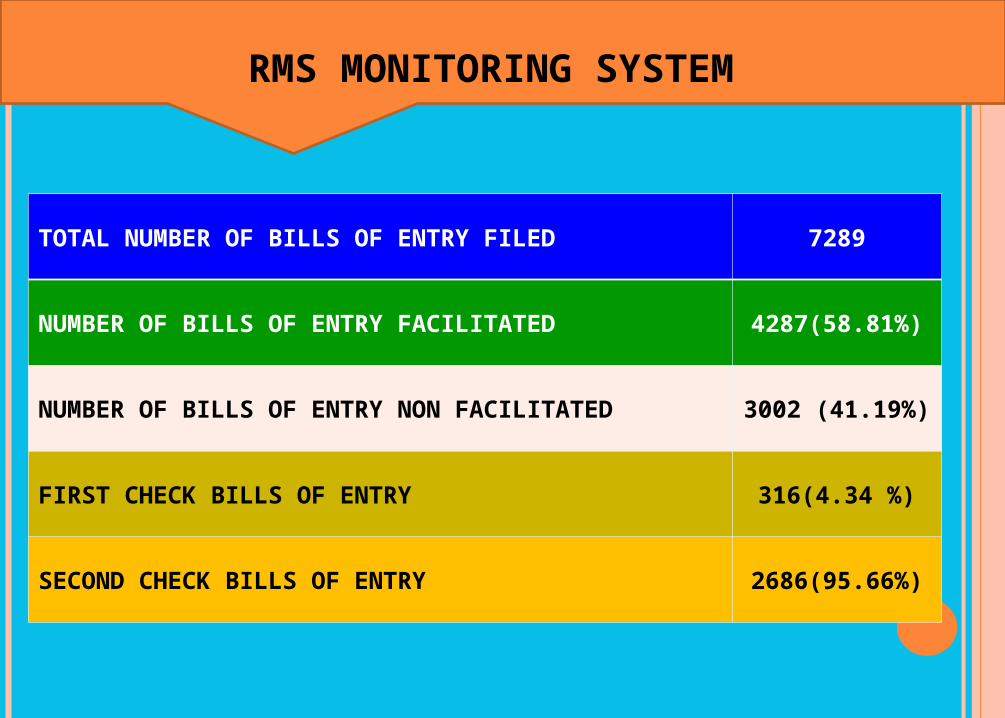
RMS MONITORING SYSTEM
TOTAL NUMBER OF BILLS OF ENTRY FILED 7289
NUMBER OF BILLS OF ENTRY FACILITATED 4287(58.81%)
NUMBER OF BILLS OF ENTRY NON FACILITATED 3002
(41.19%)
FIRST CHECK BILLS OF ENTRY 316(4.34 %)
SECOND CHECK BILLS OF ENTRY 2686(95.66%)
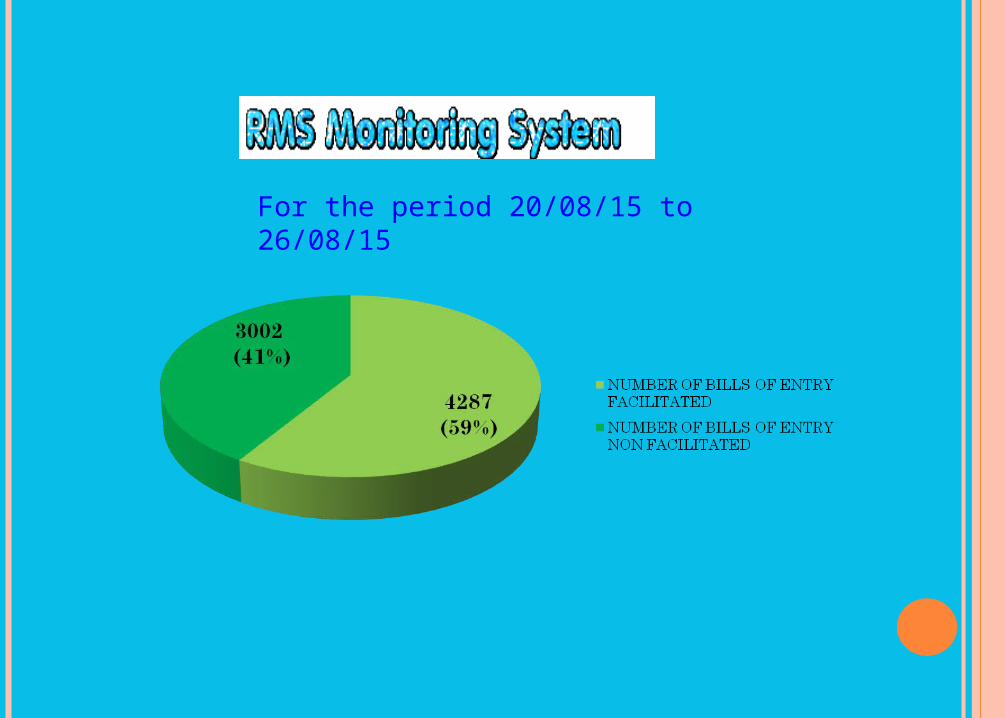
For the period 20/08/15 to 26/08/15
ANALYSIS OF STAGES 1 & 2
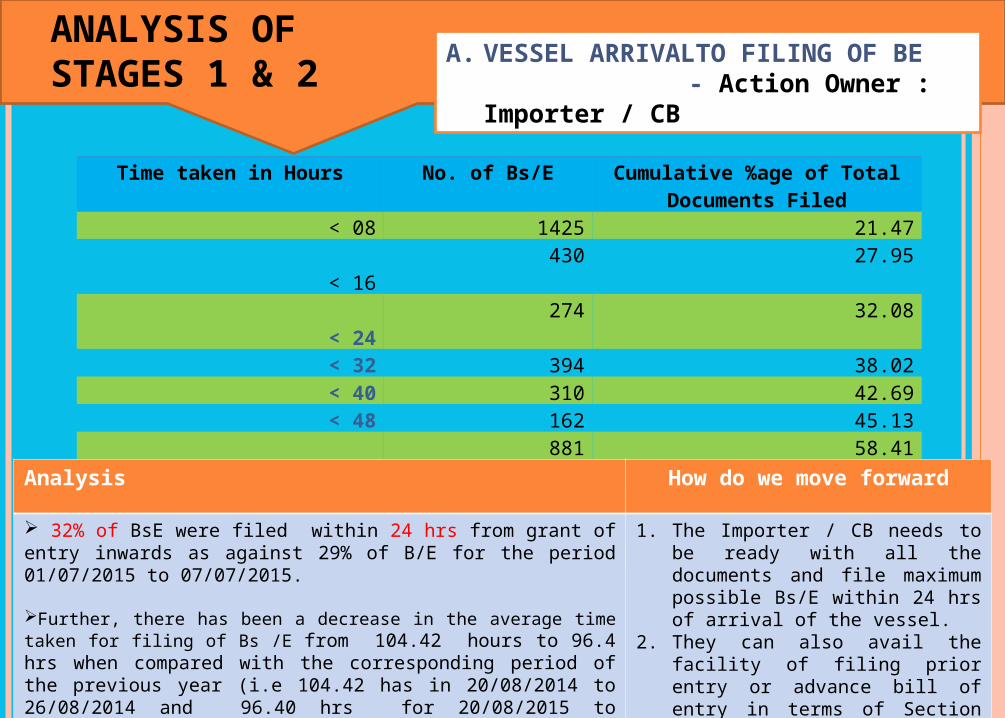
A. VESSEL ARRIVALTO FILING OF BE - Action Owner : Importer /
CB
Time taken in Hours No. of Bs/E Cumulative %age of Total Documents Filed
< 08 1425 21.47 < 16 430 27.95
< 24 274 32.08< 32 394 38.02< 40 310 42.69< 48 162 45.13
< 72 881 58.41 > 72 2760 100
Total 6636
Analysis How do we move forward
32% of BsE were filed within 24 hrs from grant of entry inwards as against 29% of B/E for the period 01/07/2015 to 07/07/2015.
Further, there has been a decrease in the average time taken for filing of Bs /E from 104.42 hours to 96.4 hrs when compared with the corresponding period of the previous year (i.e 104.42 has in 20/08/2014 to 26/08/2014 and 96.40 hrs for 20/08/2015 to 26/08/2015)
1. The Importer / CB needs to be ready with all the documents and file maximum possible Bs/E within 24 hrs of arrival of the vessel.
2. They can also avail the facility of filing prior entry or advance bill of entry in terms of Section 46 (3) of the Customs Act, 1962.
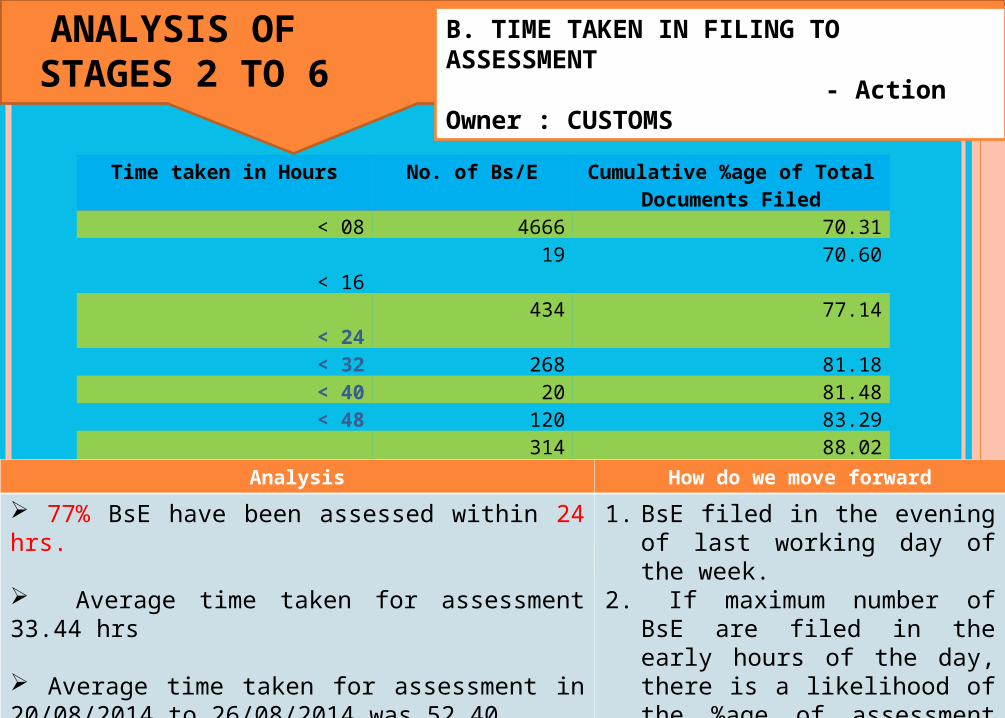
B. TIME TAKEN IN FILING TO ASSESSMENT - Action Owner : CUSTOMS
Time taken in Hours No. of Bs/E Cumulative %age of Total Documents Filed
< 08 4666 70.31 < 16 19 70.60
< 24 434 77.14
< 32 268 81.18< 40 20 81.48< 48 120 83.29
< 72 314 88.02 > 72 795 100
Total 6636
Analysis How do we move forward
77% BsE have been assessed within 24 hrs. Average time taken for assessment 33.44 hrs
Average time taken for assessment in 20/08/2014 to 26/08/2014 was 52.40
1. BsE filed in the evening of last working day of the week.
2. If maximum number of BsE are filed in the early hours of the day, there is a likelihood of the %age of assessment of BsE in the first 8 hours shall substantially be high.
ANALYSIS OF STAGES 2 TO 6
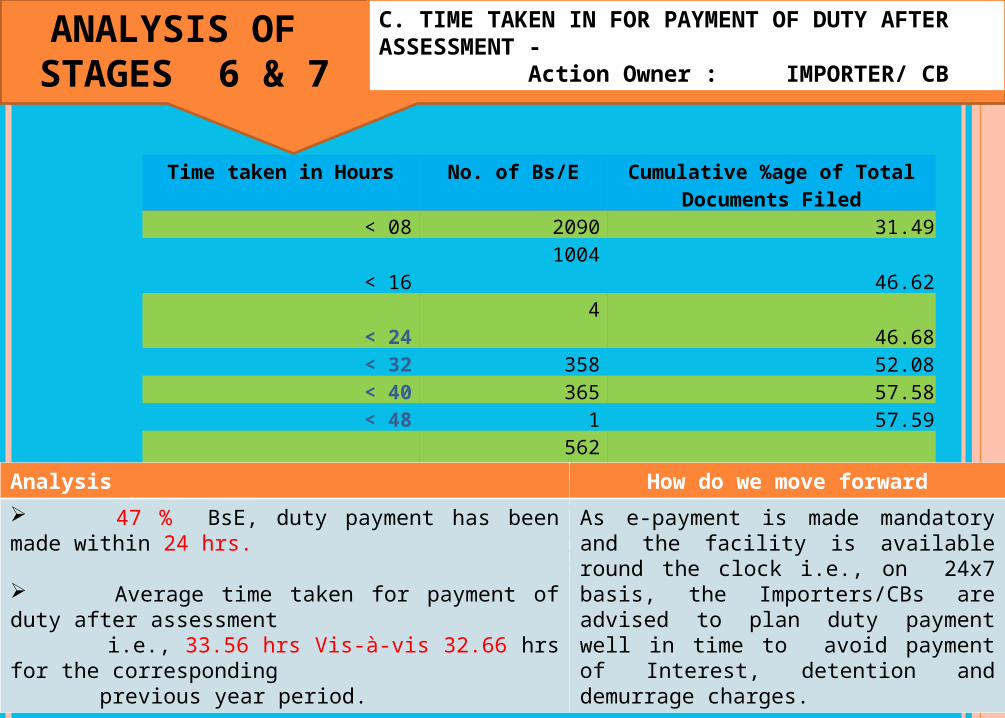
C. TIME TAKEN IN FOR PAYMENT OF DUTY AFTER ASSESSMENT -
Action Owner : IMPORTER/ CB
Time taken in Hours No. of Bs/E Cumulative %age of Total Documents Filed
< 08 2090 31.49 < 16 1004 46.62
< 24 4 46.68< 32 358 52.08< 40 365 57.58< 48 1 57.59
< 72 562 66.06 > 72 736 77.15
Total 5120
Analysis How do we move forward
47 % BsE, duty payment has been made within 24 hrs.
Average time taken for payment of duty after assessment i.e., 33.56 hrs Vis-à-vis 32.66 hrs for the corresponding previous year period.
As e-payment is made mandatory and the facility is available round the clock i.e., on 24x7 basis, the Importers/CBs are advised to plan duty payment well in time to avoid payment of Interest, detention and demurrage charges.
ANALYSIS OF STAGES 6 & 7
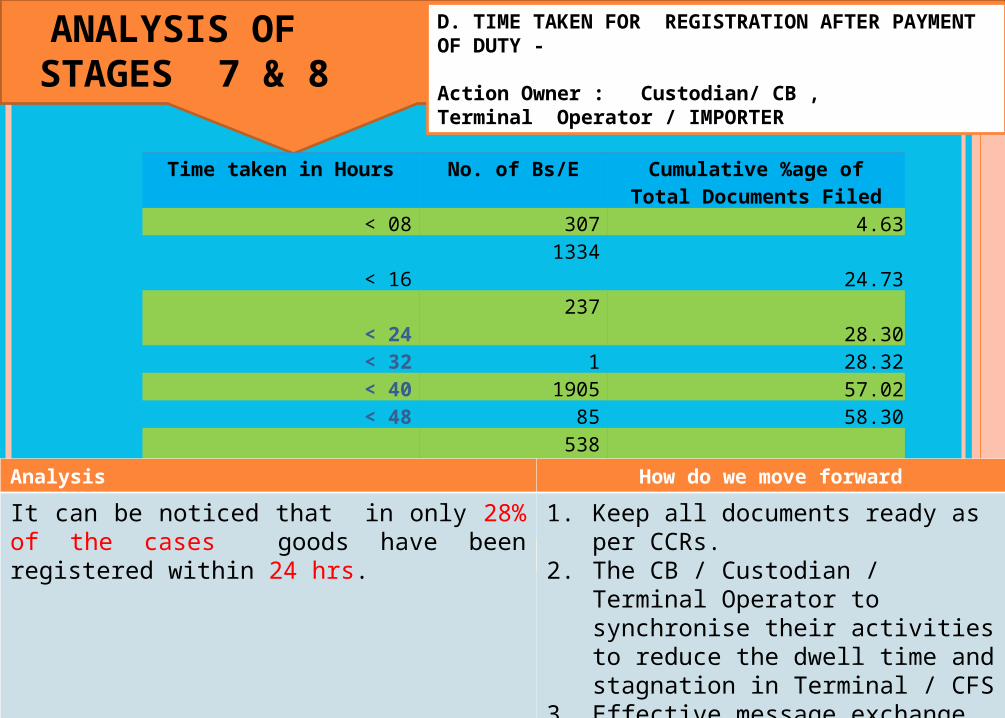
D. TIME TAKEN FOR REGISTRATION AFTER PAYMENT OF DUTY -
Action Owner : Custodian/ CB , Terminal Operator / IMPORTER
Time taken in Hours No. of Bs/E Cumulative %age of Total Documents Filed
< 08 307 4.63 < 16 1334 24.73
< 24 237 28.30< 32 1 28.32< 40 1905 57.02< 48 85 58.30
< 72 538 66.41 > 72 713 77.15
Total 5120
Analysis How do we move forward
It can be noticed that in only 28% of the cases goods have been registered within 24 hrs.
1. Keep all documents ready as per CCRs.2. The CB / Custodian / Terminal Operator
to synchronise their activities to reduce the dwell time and stagnation in Terminal / CFS
3. Effective message exchange among all the stakeholders.
ANALYSIS OF STAGES 7 & 8
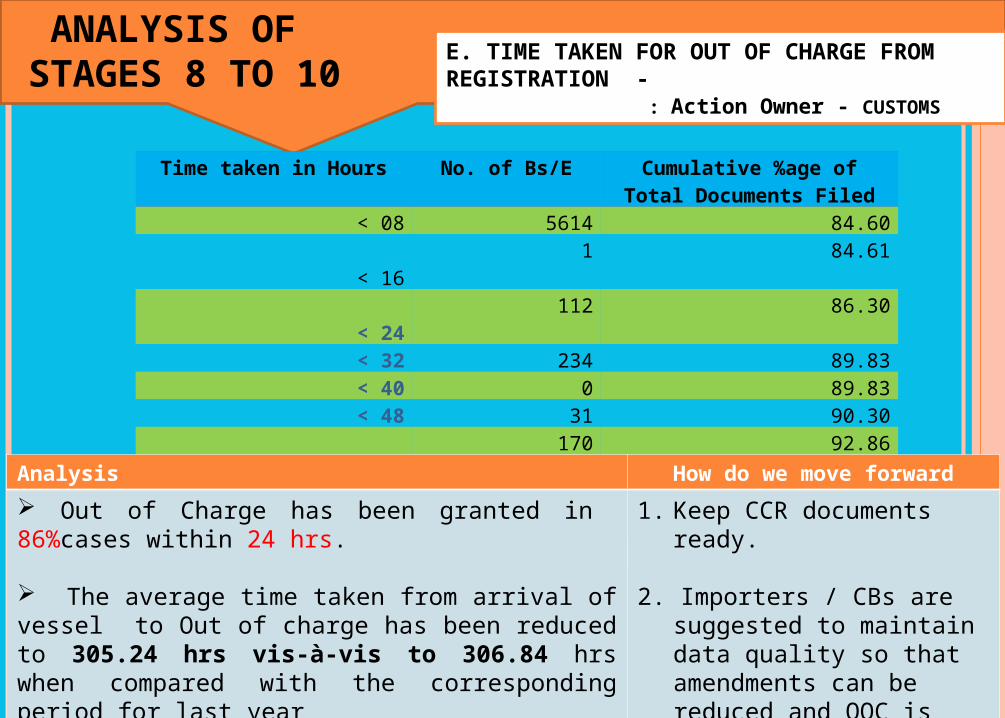
E. TIME TAKEN FOR OUT OF CHARGE FROM REGISTRATION -
: Action Owner - CUSTOMS
Time taken in Hours No. of Bs/E Cumulative %age of Total Documents Filed
< 08 5614 84.60 < 16 1 84.61
< 24 112 86.30< 32 234 89.83< 40 0 89.83< 48 31 90.30
< 72 170 92.86 > 72 474 100
Total 6131
Analysis How do we move forward
Out of Charge has been granted in 86%cases within 24 hrs.
The average time taken from arrival of vessel to Out of charge has been reduced to 305.24 hrs vis-à-vis to 306.84 hrs when compared with the corresponding period for last year
1. Keep CCR documents ready.
2. Importers / CBs are suggested to maintain data quality so that amendments can be reduced and OOC is given within 24 hours for all the Bills.
ANALYSIS OF STAGES 8 TO 10
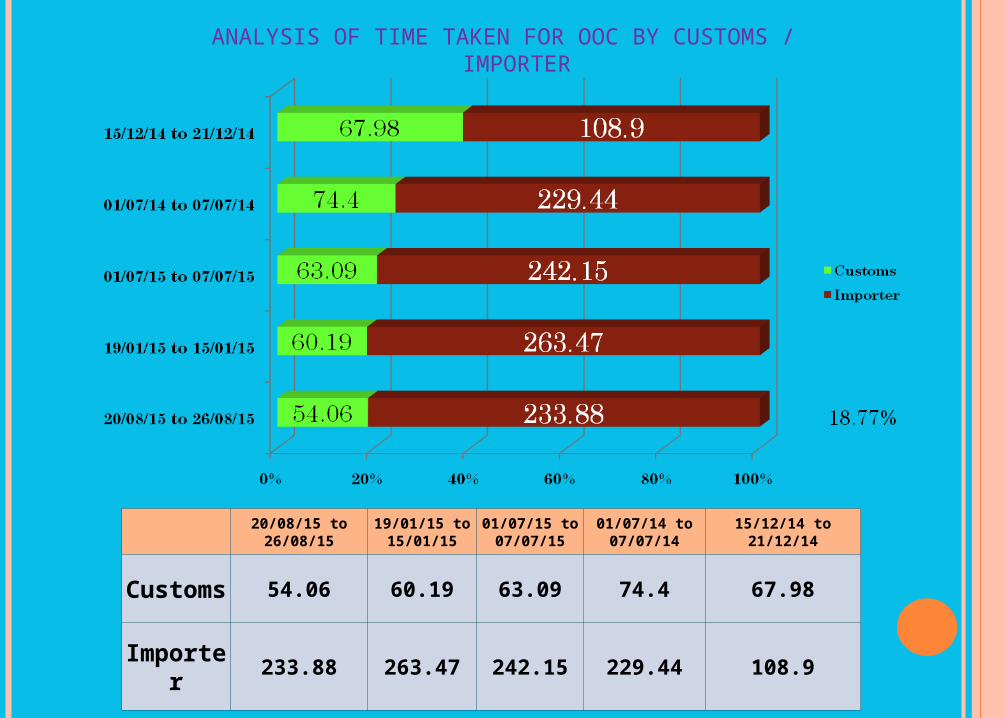
20/08/15 to 26/08/15 19/01/15 to 15/01/15
01/07/15 to 07/07/15
01/07/14 to 07/07/14 15/12/14 to 21/12/14
Customs 54.06 60.19 63.09 74.4 67.98
Importer 233.88 263.47 242.15 229.44 108.9
ANALYSIS OF TIME TAKEN FOR OOC BY CUSTOMS / IMPORTER
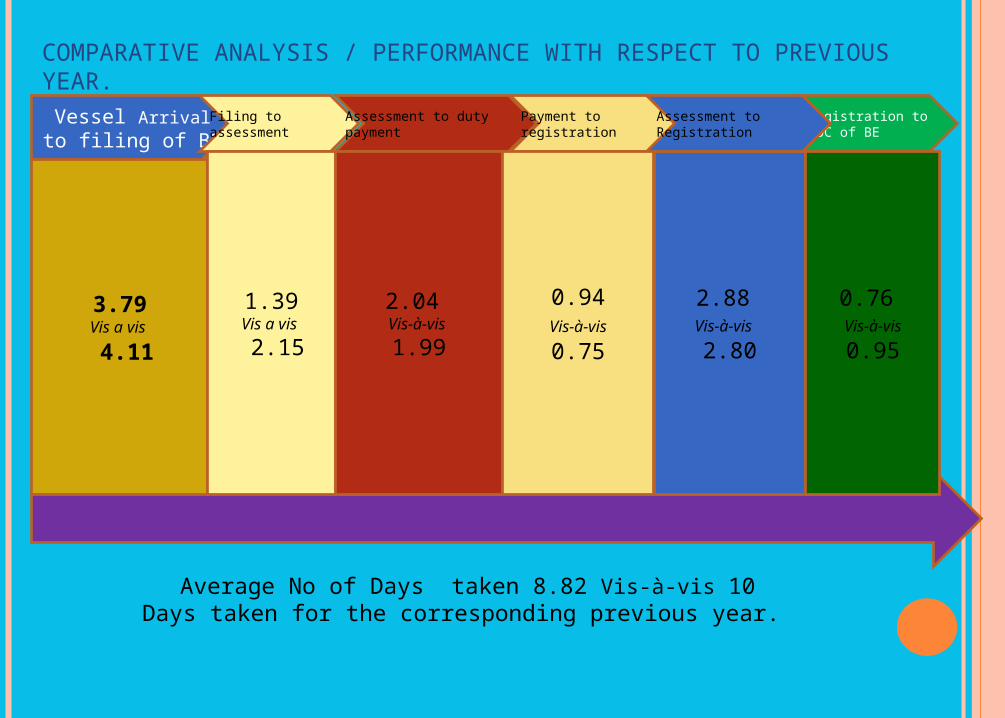
Vessel Arrival to filing of BE
Filing to assessmentAssessment to duty payment
Payment to registration
Registration to OOC of BE
3.79Vis a vis
4.11
Assessment to Registration
1.39Vis a vis
2.15
2.04 Vis-à-vis
1.99
0.94 Vis-à-vis
0.75
2.88 Vis-à-vis 2.80
0.76 Vis-à-vis 0.95
COMPARATIVE ANALYSIS / PERFORMANCE WITH RESPECT TO PREVIOUS YEAR.
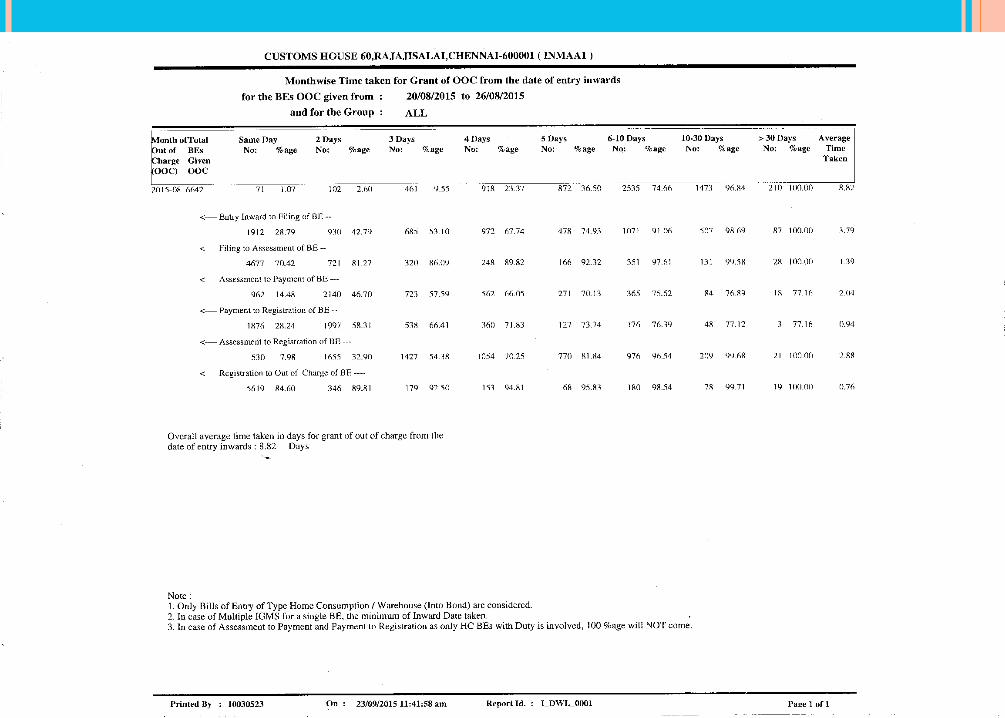
Average No of Days taken 8.82 Vis-à-vis 10 Days taken for the corresponding previous year.
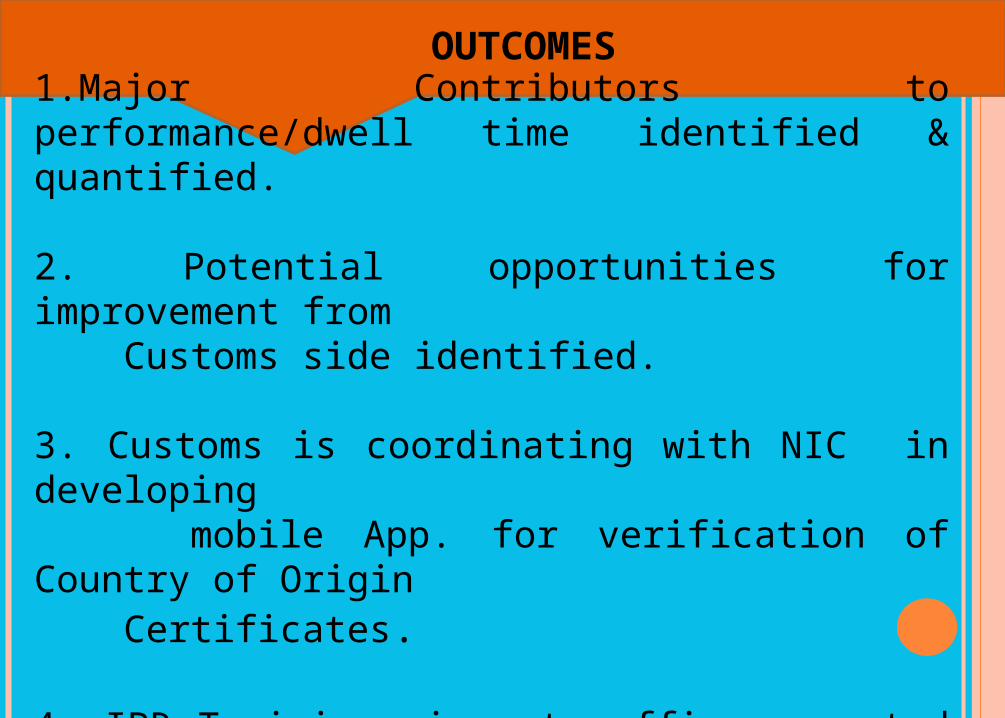
OUTCOMES
1.Major Contributors to performance/dwell time identified & quantified.
2. Potential opportunities for improvement from Customs side identified.
3. Customs is coordinating with NIC in developing mobile App. for verification of Country of Origin Certificates.
4. IPR Training given to officers posted in Docks.
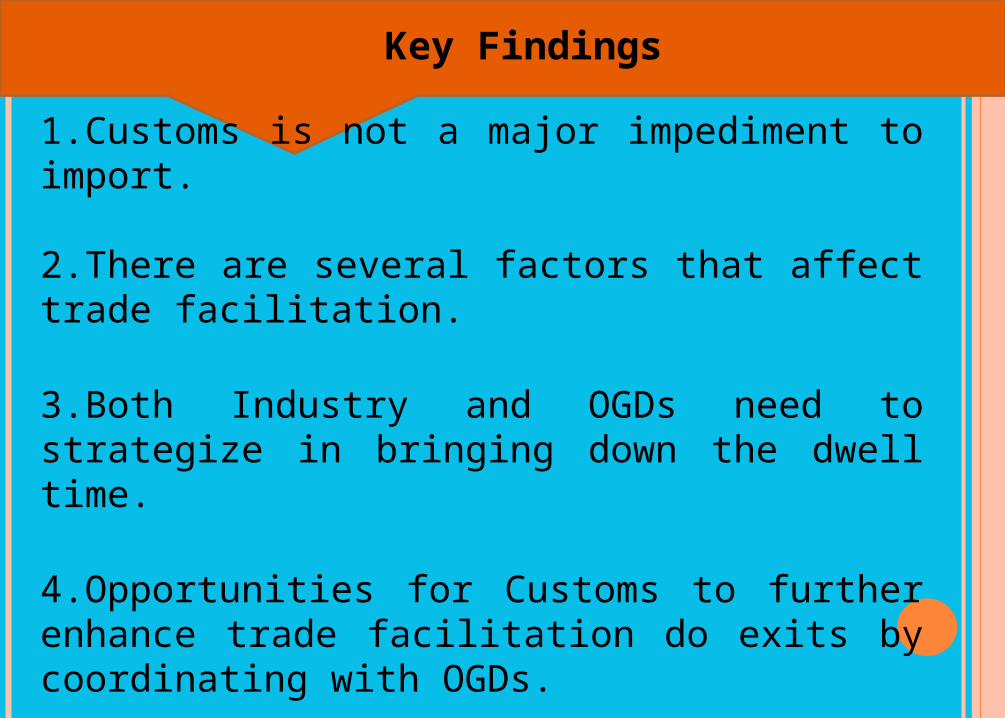
Key Findings
1.Customs is not a major impediment to import.
2.There are several factors that affect trade facilitation.
3.Both Industry and OGDs need to strategize in bringing down the dwell time.
4.Opportunities for Customs to further enhance trade facilitation do exits by coordinating with OGDs.

SUGGESTIONS/RECOMMENDATIO
NS
FOR YOUR KIND ATTENTION