Embed Size (px)
Citation preview
PROMOTING CHOICE • SECURING STANDARDS • PREVENTING HARM
1
Customer Satisfaction TrackerSummary of research findingsProduced by: Critical Research
Fieldwork: 3rd January to 15th February 2018

PROMOTING CHOICE • SECURING STANDARDS • PREVENTING HARM
2
Section 1Background, objectives, methodology
PROMOTING CHOICE • SECURING STANDARDS • PREVENTING HARM
3
Background, objectives and methodology
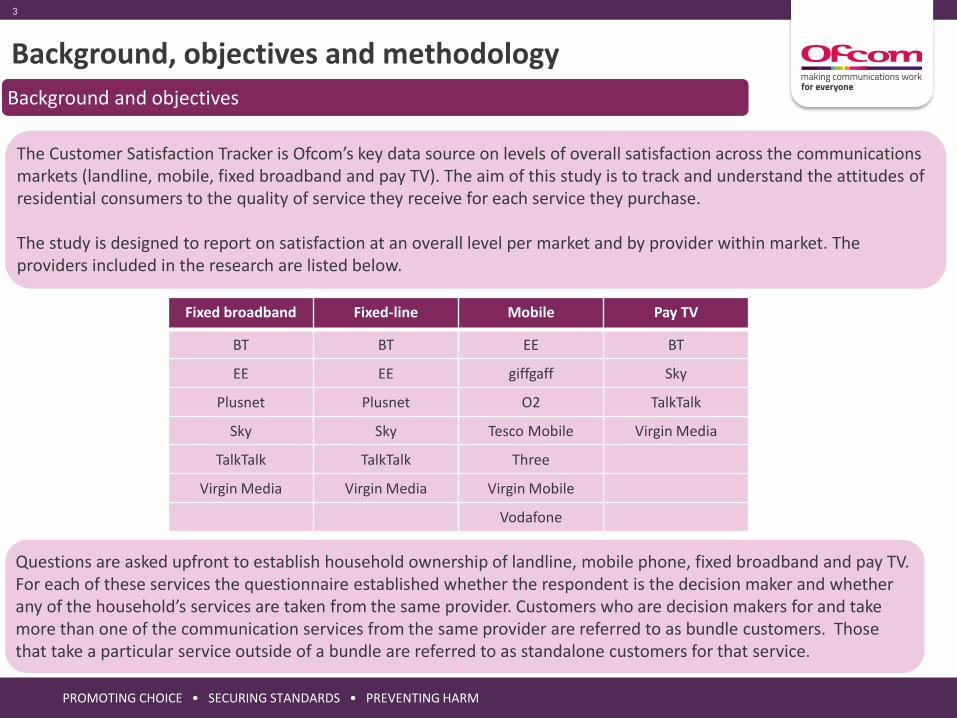
The Customer Satisfaction Tracker is Ofcom’s key data source on levels of overall satisfaction across the communications markets (landline, mobile, fixed broadband and pay TV). The aim of this study is to track and understand the attitudes of residential consumers to the quality of service they receive for each service they purchase.
The study is designed to report on satisfaction at an overall level per market and by provider within market. The providers included in the research are listed below.
Background and objectives
Fixed broadband Fixed-line Mobile Pay TV
BT BT EE BT
EE EE giffgaff Sky
Plusnet Plusnet O2 TalkTalk
Sky Sky Tesco Mobile Virgin Media
TalkTalk TalkTalk Three
Virgin Media Virgin Media Virgin Mobile
Vodafone
Questions are asked upfront to establish household ownership of landline, mobile phone, fixed broadband and pay TV. For each of these services the questionnaire established whether the respondent is the decision maker and whether any of the household’s services are taken from the same provider. Customers who are decision makers for and take more than one of the communication services from the same provider are referred to as bundle customers. Those that take a particular service outside of a bundle are referred to as standalone customers for that service.
PROMOTING CHOICE • SECURING STANDARDS • PREVENTING HARM
4
Background, objectives and methodology/2
Background and objectives
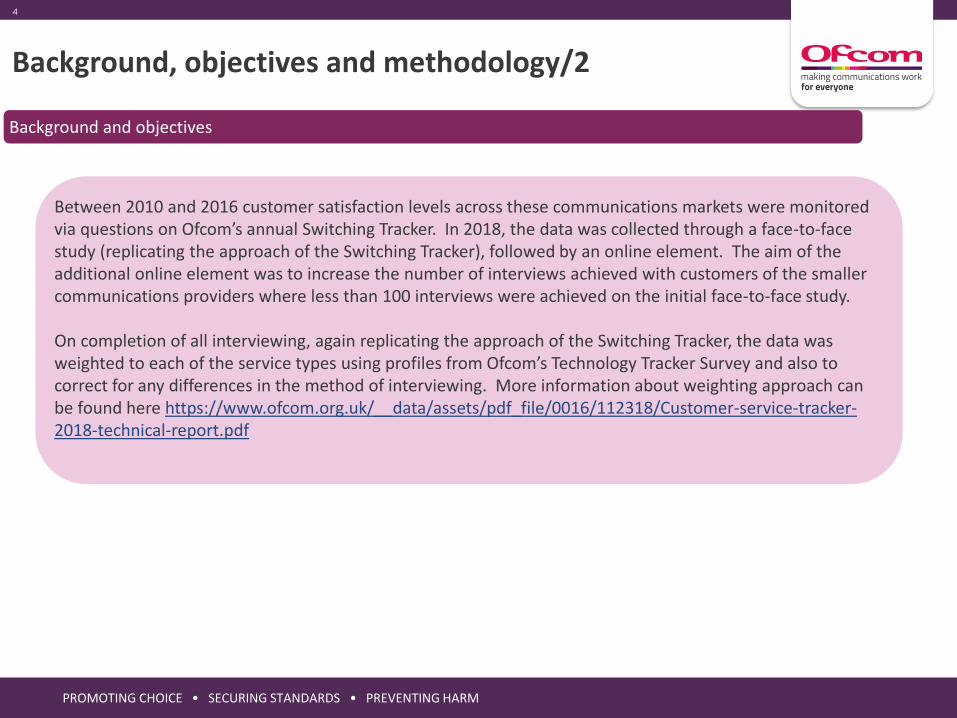
Between 2010 and 2016 customer satisfaction levels across these communications markets were monitored via questions on Ofcom’s annual Switching Tracker. In 2018, the data was collected through a face-to-face study (replicating the approach of the Switching Tracker), followed by an online element. The aim of the additional online element was to increase the number of interviews achieved with customers of the smaller communications providers where less than 100 interviews were achieved on the initial face-to-face study.
On completion of all interviewing, again replicating the approach of the Switching Tracker, the data was weighted to each of the service types using profiles from Ofcom’s Technology Tracker Survey and also to correct for any differences in the method of interviewing. More information about weighting approach can be found here https://www.ofcom.org.uk/__data/assets/pdf_file/0016/112318/Customer-service-tracker-2018-technical-report.pdf
PROMOTING CHOICE • SECURING STANDARDS • PREVENTING HARM
5
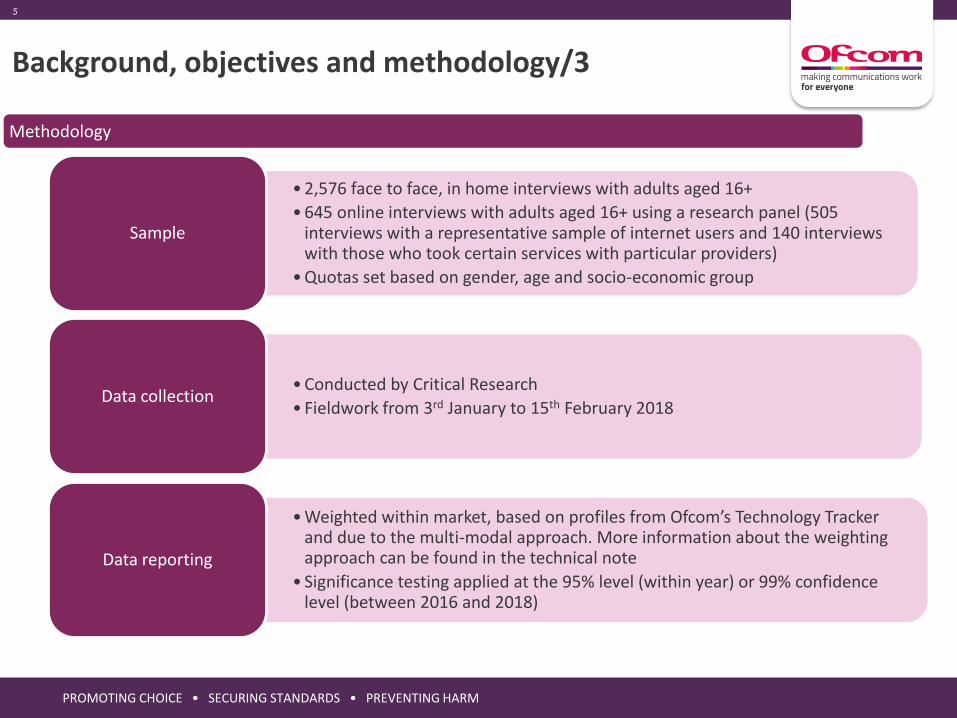
• 2,576 face to face, in home interviews with adults aged 16+
• 645 online interviews with adults aged 16+ using a research panel (505 interviews with a representative sample of internet users and 140 interviews with those who took certain services with particular providers)
• Quotas set based on gender, age and socio-economic group
Sample
• Conducted by Critical Research
• Fieldwork from 3rd January to 15th February 2018Data collection
• Weighted within market, based on profiles from Ofcom’s Technology Tracker and due to the multi-modal approach. More information about the weighting approach can be found in the technical note
• Significance testing applied at the 95% level (within year) or 99% confidence level (between 2016 and 2018)
Data reporting
Background, objectives and methodology/3
Methodology

PROMOTING CHOICE • SECURING STANDARDS • PREVENTING HARM
6
Background, objectives, methodology /4
Throughout the chart pack, where it is possible to do so, statistically significant differences are flagged over time (at the 99% confidence level) and are indicated by the following symbols where: shows a significant increase over time and shows a significant decrease.
In the market specific charts (from slide 18), statistically significant differences are also flagged
comparing results for a particular provider to the average for that market (at the 95% confidence level).
The market average score is always shown outlined in black , a measure that is higher than
average is outlined in green , and a lower than average measure is outlined in red
On some charts (i.e. those showing the Net Promoter Scores™ and when making comparisons between
urban and rural areas) these symbols may also be used to flag significant differences. In these
instances there is an accompanying explanation on the chart or in the chart footer.
If a finding is not statistically significant it may be referenced as being unchanged or that it does not
differ/ vary when compared to another measure. In some instances, the two percentages compared
could differ by as much as 15 percentage points, but due to relatively low base sizes for one (or both) of
these groups the difference is not registering as statistically significant.
x%
x% x%
Significance testing

PROMOTING CHOICE • SECURING STANDARDS • PREVENTING HARM
7
Section 2Satisfaction with communications services-service comparison
PROMOTING CHOICE • SECURING STANDARDS • PREVENTING HARM
8
Summary – service comparison
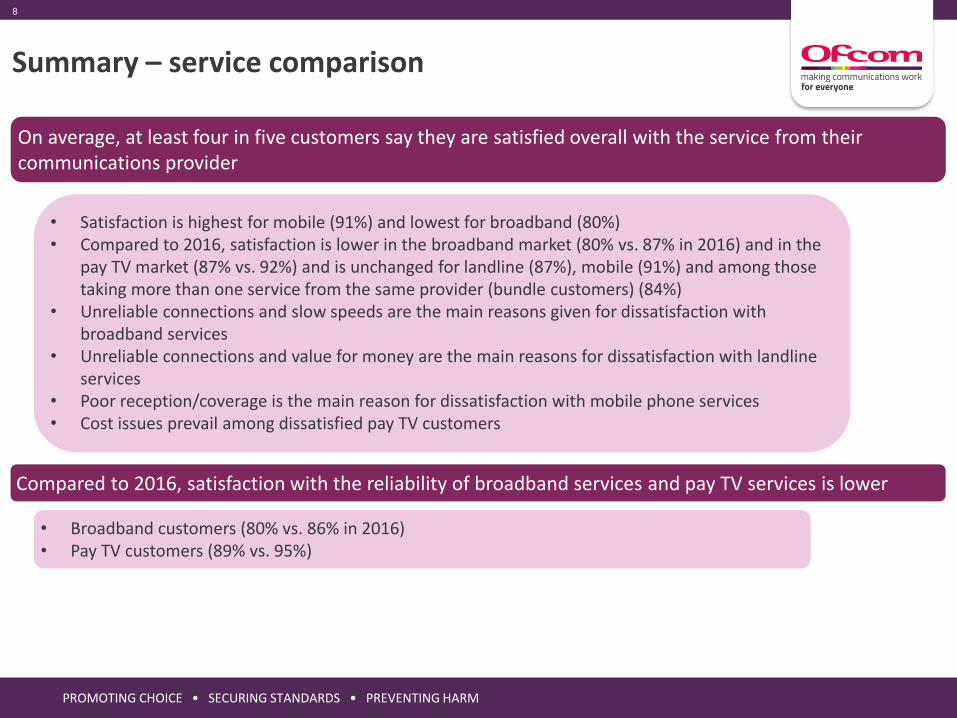
On average, at least four in five customers say they are satisfied overall with the service from their communications provider
• Satisfaction is highest for mobile (91%) and lowest for broadband (80%) • Compared to 2016, satisfaction is lower in the broadband market (80% vs. 87% in 2016) and in the
pay TV market (87% vs. 92%) and is unchanged for landline (87%), mobile (91%) and among those taking more than one service from the same provider (bundle customers) (84%)
• Unreliable connections and slow speeds are the main reasons given for dissatisfaction with broadband services
• Unreliable connections and value for money are the main reasons for dissatisfaction with landline services
• Poor reception/coverage is the main reason for dissatisfaction with mobile phone services • Cost issues prevail among dissatisfied pay TV customers
Compared to 2016, satisfaction with the reliability of broadband services and pay TV services is lower
• Broadband customers (80% vs. 86% in 2016)• Pay TV customers (89% vs. 95%)

PROMOTING CHOICE • SECURING STANDARDS • PREVENTING HARM
9
Summary – service comparison/2
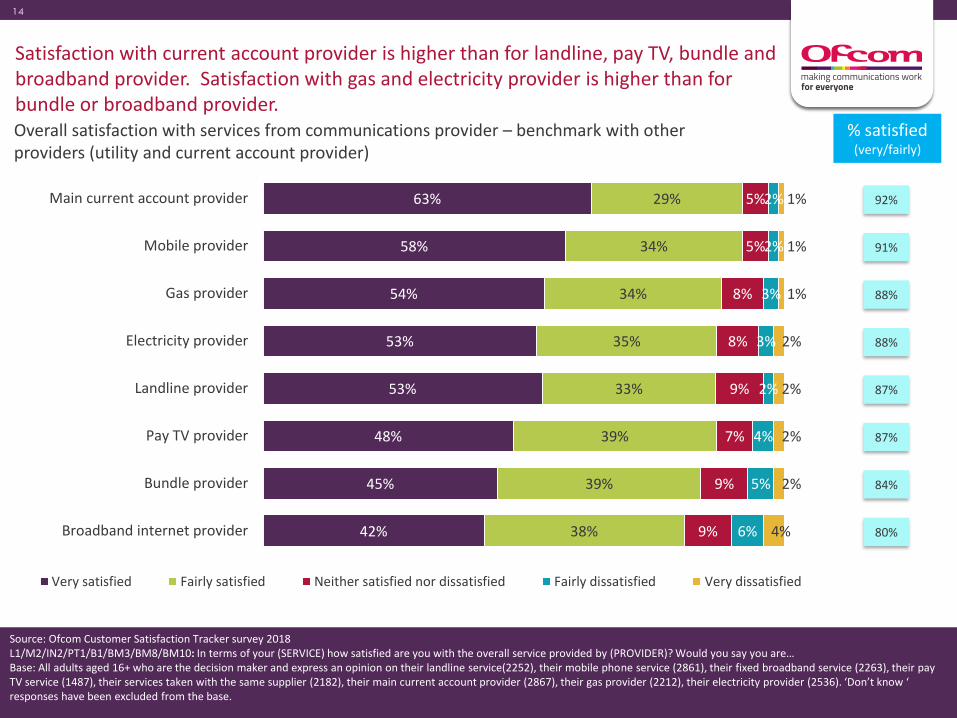
Overall satisfaction with current account provider is comparable to that for mobile phone provider and is higher than for landline, pay TV, bundle and broadband provider. Satisfaction with gas and electricity provider is higher than for telecoms bundle or broadband provider
• 92% for main current account provider, 91% for mobile provider• 88% for gas and 88% for electricity provider, 87% for landline provider, 87% for pay TV provider • 84% for bundle provider and 80% for broadband provider
When asked to rate their likelihood to recommend their communications provider to friends and family (where 0 is extremely unlikely and 10 extremely likely ), customers in each market are more likely to be ‘Promoters’ (give a score of 9-10) than they are to be ‘Detractors’ (give a score of 0-6)
• The Net Promoter Score™ – the difference between the proportion of Promoters and Detractors - is higher among mobile customers (22) than among landline (11), broadband (6) or pay TV (11) customers
Satisfaction with value for money among standalone pay tv and mobile customers is lower compared to 2016. Satisfaction with value for money among bundle customers is also lower
• Pay TV customers (58% vs. 69% in 2016) • Mobile customers (84% vs. 88%) • Bundle customers (70% vs. 76%)

PROMOTING CHOICE • SECURING STANDARDS • PREVENTING HARM
10 1010
Overall satisfaction is highest among mobile customers and lowest among broadband customers. Compared to 2016, fixed broadband and pay TV customers are less likely to be satisfied with the overall service provided.
Overall satisfaction with services from communications provider – total market
53%
58%
42%
48%
45%
33%
34%
38%
39%
39%
9%
5%
9%
7%
9%
2%
2%
6%
4%
5%
2%
1%
4%
2%
2%
Landline
Mobile
Broadband
Pay TV
Bundle
Very satisfied Fairly satisfied Neither satisfied nor dissatisfied Fairly dissatisfied Very dissatisfied
Source: Ofcom Customer Satisfaction Tracker survey 2018L1/M2/IN2/PT1/B1: In terms of your (SERVICE) how satisfied are you with the overall service provided by (PROVIDER)? Would you say you are…Base: All adults aged 16+ who are the decision maker and express an opinion on their landline service (2252), their mobile phone service (2861), their fixed broadband service (2263), their pay TV service (1487), their services taken with the same supplier (2182). ‘Don’t know ‘ responses have been excluded from the base.
89%87%
2018 2016
88%
2015
91%
2014
92%91% 89% 89%
87%80% 83% 85%
92%87% 90% 91%
86%84% 85% 90%
vs.
% satisfied (very/fairly)
PROMOTING CHOICE • SECURING STANDARDS • PREVENTING HARM
11 1111
Broadband (11% dissatisfied)
Pay TV(5% dissatisfied)
Mobile (4% dissatisfied)
Landline(4% dissatisfied)
Base 237 81** 113 101
Service I take from them is poor/bad connection/doesn’t work some of the time/unreliable
48% 13% 37%
Speed isn’t as advertised/slow 47% 8%
Too expensive/not good value for money 21% 36% 20% 27%
Poor customer service/unhelpful 12% 10% 18%
Problems left unresolved/takes too long to fix 9% 10%
Poor TV reception 18%
Price keeps increasing 14%
Poor reception/coverage (unspecified) 47%
Poor mobile reception/coverage – at home 11%
Poor mobile reception/coverage – in my area 7%
Have to pay for something I don’t use/have to have a landline 8%
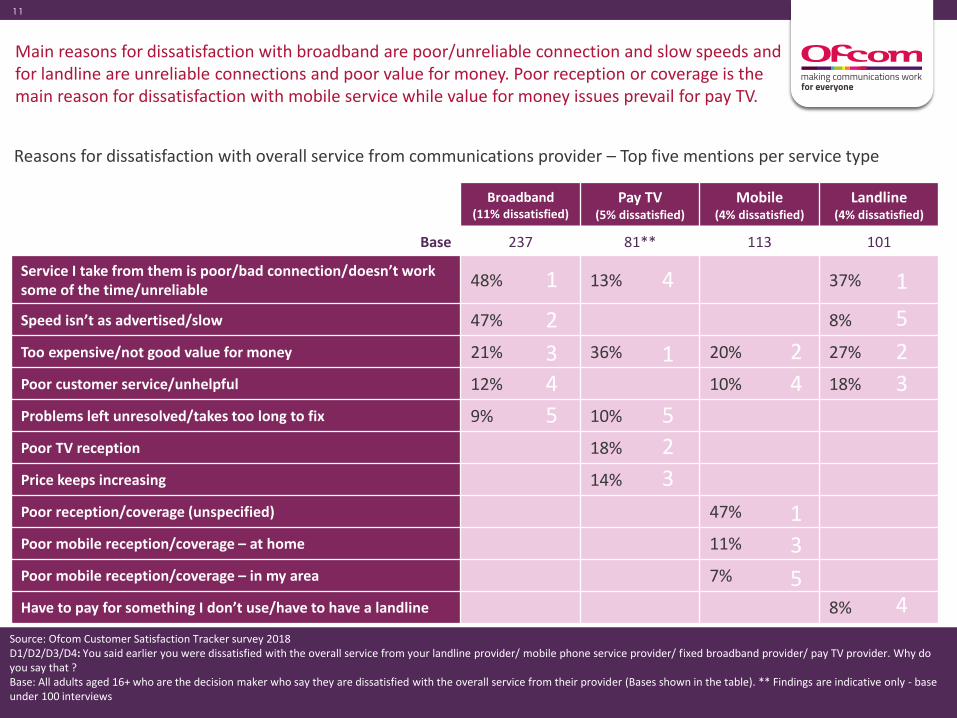
Main reasons for dissatisfaction with broadband are poor/unreliable connection and slow speeds and for landline are unreliable connections and poor value for money. Poor reception or coverage is the main reason for dissatisfaction with mobile service while value for money issues prevail for pay TV.
Reasons for dissatisfaction with overall service from communications provider – Top five mentions per service type
Source: Ofcom Customer Satisfaction Tracker survey 2018D1/D2/D3/D4: You said earlier you were dissatisfied with the overall service from your landline provider/ mobile phone service provider/ fixed broadband provider/ pay TV provider. Why do you say that ?Base: All adults aged 16+ who are the decision maker who say they are dissatisfied with the overall service from their provider (Bases shown in the table). ** Findings are indicative only - base under 100 interviews
1
2
3
4
5
1
2
3
5
1
2
4
3
5
2
3
1
5
4
4

PROMOTING CHOICE • SECURING STANDARDS • PREVENTING HARM
12 1212
Overall satisfaction with service reliability is lower compared to 2016 in the broadband and pay TV markets.
Satisfaction with reliability of service from communications provider (reception/signal strength for mobile phone service provider) – total market
61%
48%
44%
57%
29%
35%
36%
32%
7%
8%
9%
7%
2%
5%
7%
3%
1%
4%
4%
1%
Landline
Mobile
Broadband
Pay TV
Very satisfied Fairly satisfied Neither satisfied nor dissatisfied Fairly dissatisfied Very dissatisfied
Source: Ofcom Customer Satisfaction Tracker survey 2018L3/IN5/PT3: And how satisfied are you with the reliability of your landline/ fixed broadband/ pay TV service from (PROVIDER)? / M4: And how satisfied are you overall with the reception or signal strength that you get on your mobile phone service from (PROVIDER)? Would you say you are…Base: All adults aged 16+ who are the decision maker who express an opinion on their landline service (2238), mobile phone service (2862), fixed broadband service (2266), pay TV service (1487). ‘Don’t know ‘ responses have been excluded from the base. * In previous years respondents were asked about the reception or ease of accessing the (PROVIDER) network
92%90%
2018 2016
94%
2015
95%
2014
86%*84% 81%* 80%*
86%80% 83% 85%
95%89% 92% 94%
vs.
% satisfied (very/fairly)

PROMOTING CHOICE • SECURING STANDARDS • PREVENTING HARM
13 1313
Satisfaction with reception/signal strength among mobile customers is lower in rural areas compared to urban areas.
90%84%
80%
89%90%86%
81%
89%89%
69%
78%
90%
Landline Mobile Fixed broadband Pay TV
Total Urban Rural
% satisfied with reliability of service from communications provider (reception/ signal strength for mobile phone service provider) – by location
Source: Ofcom Customer Satisfaction Tracker survey 2018L3/IN5/PT3: And how satisfied are you with the reliability of your landline/ fixed broadband/ pay TV service from (PROVIDER)? / M4: And how satisfied are you overall with the reception or signal strength that you get on your mobile phone service from (PROVIDER)? Would you say you are…Base: All adults aged 16+ who are the decision maker who express an opinion on their landline service (2238 total, 1927 urban, 311 rural), mobile phone service (2862 total, 2524 urban, 338 rural), fixed broadband service (2266 total, 1969 urban, 297 rural), pay TV service (1487 total, 1323 urban, 164 rural). Significance testing shows any difference (at the 95% level) between customers in urban and rural areas.
PROMOTING CHOICE • SECURING STANDARDS • PREVENTING HARM
14 1414
Satisfaction with current account provider is higher than for landline, pay TV, bundle and broadband provider. Satisfaction with gas and electricity provider is higher than for bundle or broadband provider.Overall satisfaction with services from communications provider – benchmark with other providers (utility and current account provider)
63%
58%
54%
53%
53%
48%
45%
42%
29%
34%
34%
35%
33%
39%
39%
38%
5%
5%
8%
8%
9%
7%
9%
9%
2%
2%
3%
3%
2%
4%
5%
6%
1%
1%
1%
2%
2%
2%
2%
4%
Main current account provider
Mobile provider
Gas provider
Electricity provider
Landline provider
Pay TV provider
Bundle provider
Broadband internet provider
Very satisfied Fairly satisfied Neither satisfied nor dissatisfied Fairly dissatisfied Very dissatisfied
Source: Ofcom Customer Satisfaction Tracker survey 2018L1/M2/IN2/PT1/B1/BM3/BM8/BM10: In terms of your (SERVICE) how satisfied are you with the overall service provided by (PROVIDER)? Would you say you are…Base: All adults aged 16+ who are the decision maker and express an opinion on their landline service(2252), their mobile phone service (2861), their fixed broadband service (2263), their pay TV service (1487), their services taken with the same supplier (2182), their main current account provider (2867), their gas provider (2212), their electricity provider (2536). ‘Don’t know ‘ responses have been excluded from the base.
91%
88%
87%
84%
80%
% satisfied (very/fairly)
92%
87%
88%

PROMOTING CHOICE • SECURING STANDARDS • PREVENTING HARM
15 1515
27%20%
29% 26%
36%37%
36% 37%
38% 42%35% 37%
Landline Mobile Broadband Pay TV
Promoters(9-10)
Passives(7-8)
Detractors(0-6)
For each market, customers are more likely to be ‘Promoters’ than ‘Detractors’. NPS™ is higher for mobile than for the other markets.
Net Promoter score (NPS™) by service type, total market
11NPS™ score
22 6 11
Source: Ofcom Customer Satisfaction Tracker survey 2018QN1/ QN2/ QN3/ QN4: Based on your overall experience of using (PROVIDER) for your landline service/ as your mobile phone service provider/ as your fixed broadband provider/ as your pay TV provider, how likely would you be to recommend them to a friend or family member as a (SERVICE) provider? Please give a rating on a scale of 0 to 10, where 0 is 'Extremely Unlikely' and 10 is 'Extremely Likely'?Base: All adults aged 16+ who are the decision maker and express an opinion on their landline service(2332), their mobile phone service (2868), their fixed broadband service (2273), their pay TV service (1494).
PROMOTING CHOICE • SECURING STANDARDS • PREVENTING HARM
16 1616
* By giving a NPS™ score of four or lower
Landline(6% would not
recommend and are not dissatisfied)
Pay TV(6% would not
recommend and are not dissatisfied)
Broadband(5% would not
recommend and are not dissatisfied)
Mobile(4% would not
recommend and are not dissatisfied)
Base 152 97** 119 109
Too expensive/ not good value for money 26% 44% 19% 25%
Service I take from them is poor/bad connection/ doesn’t work some of the time/ unreliable
16% 9% 19%
I do not recommend/ I don’t use it enough/ know enough to recommend
15% 6% 11% 11%
Poor customer service/ unhelpful 14% 15% 11%
Have to pay for something I don’t use/ have to have a landline 7%
Poor TV reception 6%
Price keeps increasing 5%
Speed isn’t as advertised/ slow 25%
Poor reception/ coverage (unspecified) 22%
Poor mobile reception/ coverage – in my area 7%
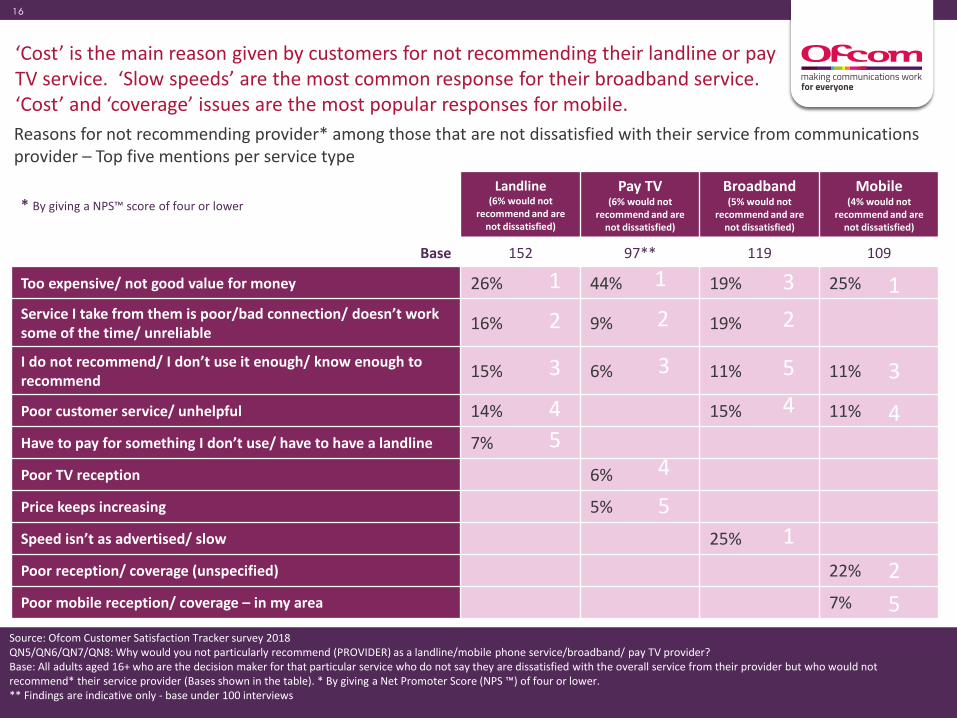
‘Cost’ is the main reason given by customers for not recommending their landline or pay TV service. ‘Slow speeds’ are the most common response for their broadband service. ‘Cost’ and ‘coverage’ issues are the most popular responses for mobile.
Reasons for not recommending provider* among those that are not dissatisfied with their service from communications provider – Top five mentions per service type
Source: Ofcom Customer Satisfaction Tracker survey 2018QN5/QN6/QN7/QN8: Why would you not particularly recommend (PROVIDER) as a landline/mobile phone service/broadband/ pay TV provider? Base: All adults aged 16+ who are the decision maker for that particular service who do not say they are dissatisfied with the overall service from their provider but who would not recommend* their service provider (Bases shown in the table). * By giving a Net Promoter Score (NPS ™) of four or lower.** Findings are indicative only - base under 100 interviews
1
2
3
4
5
1
2
3
4
5
1
4
5
2
3 1
3
4
2
5

PROMOTING CHOICE • SECURING STANDARDS • PREVENTING HARM
17 1717
42%
48%
32%
25%
34%
34%
36%
47%
33%
36%
14%
9%
12%
17%
14%
7%
5%
7%
15%
10%
3%
2%
2%
9%
5%
Landline
Mobile
Broadband
Pay TV
Bundle*
Very satisfied Fairly satisfied Neither satisfied nor dissatisfied Fairly dissatisfied Very dissatisfied
Compared to 2016, satisfaction with value for money is lower among standalone customers for mobile and pay TV, and also among bundle customers.
Satisfaction with value for money from communications provider – standalone service and bundle customers
Source: Ofcom Customer Satisfaction Tracker survey 2018L2/M3/IN3/PT2/B2: And how satisfied are you with the overall value for money of your service from (PROVIDER)? Would you say you are…Base: All adults aged 16+ who are the decision maker who express an opinion on their landline service (300), mobile phone service (2483), fixed broadband service (153), pay TV service (364) where it is held as a standalone service/ not taken with another service from the same provider and among those who take more than one service from the same provider (2180)‘Don’t know ‘ responses have been excluded from the base.
82%76%
2018 2016
78%
2015
81%
2014
88%84% 86% 87%
80%78% 79% 74%
69%58% 61% 60%
76%70% 73% 80%
vs.
% satisfied (very/fairly)
*Those with each service on a standalone basis were asked about the value for money of that particular service . As bundle customers receive one bill/ make one payment they were asked instead about the value for money of the service from their bundle provider.
PROMOTING CHOICE • SECURING STANDARDS • PREVENTING HARM
18
Section 3Fixed Broadband

PROMOTING CHOICE • SECURING STANDARDS • PREVENTING HARM
19
Summary – fixed broadband
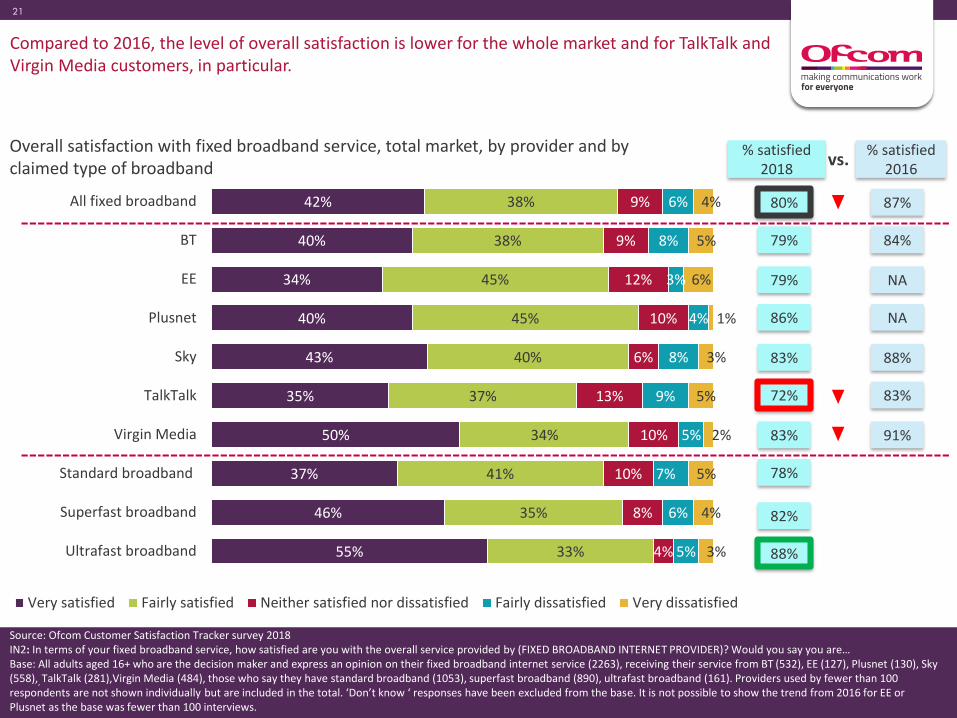
Four in five (80%) fixed broadband customers are satisfied overall with their broadband service
• Among broadband customers as a whole, satisfaction is lower compared to 2016 (87%)• In 2018, TalkTalk customers are less satisfied than average (72% vs. 80%)• TalkTalk and Virgin Media customers have lower levels of satisfaction compared to 2016 (72%
vs. 83% for TalkTalk and 83% vs. 91% for Virgin Media)• Customers who say they have ultrafast* broadband (88%) are more likely than average (80%) to
be satisfied
Four in five (80%) fixed broadband customers are satisfied with the reliability of their broadband service
• In 2018, TalkTalk customers are less likely to be satisfied (73% vs. 80%)• Among broadband customers as a whole, satisfaction is lower compared to 2016 (86%)• Sky and Virgin Media customers have lower levels of satisfaction compared to 2016 (81% vs.
88% for Sky and 82% vs. 90% for Virgin Media)
*Standard broadband was defined to respondents as – broadband through a phone line or cable service – which is not superfast, so the download speed is less than 30MB/second. Superfast broadband was defined as – a premium service that delivers higher speeds through either fibre optic or cable service – so the download speed is 30 MB/ second or higher. Ultrafast broadband was defined as – the download speed is 100MB/ second a higher

PROMOTING CHOICE • SECURING STANDARDS • PREVENTING HARM
20
Summary – fixed broadband/2
TalkTalk broadband customers have a Net Promoter Score™ that is lower than average while Virgin Media customers have a higher than average NPS™
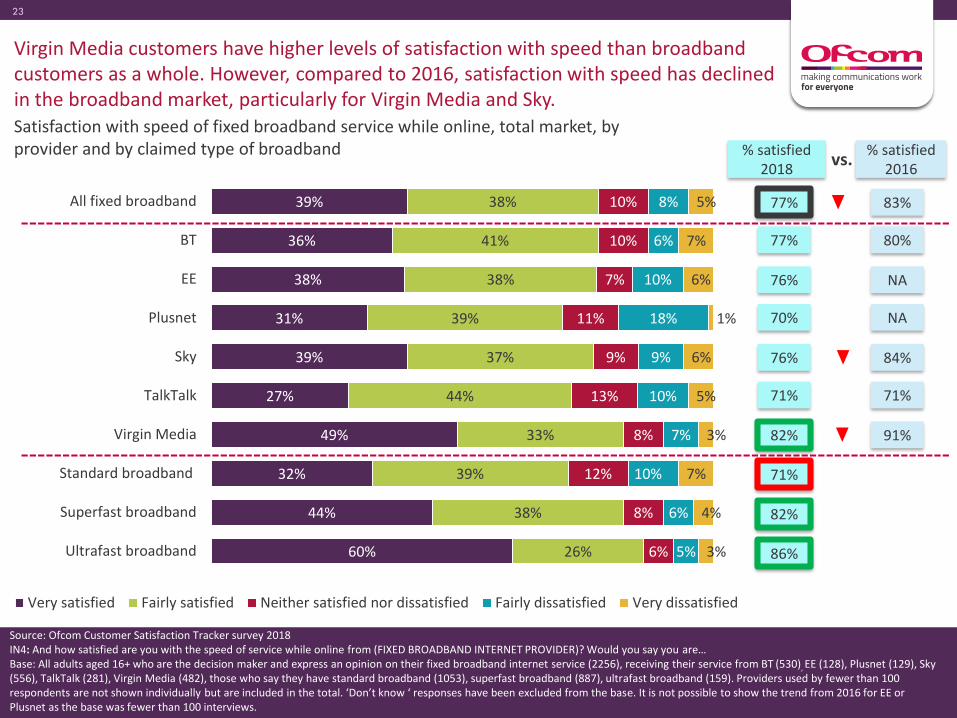
More than three quarters (77%) of broadband customers are satisfied with the speed of their broadband service while online
• Among broadband customers as a whole, satisfaction with speed of service is lower compared to 2016 (77% vs. 83%). This decline is evident for Sky (76% vs. 84%) and Virgin Media customers (82% vs. 91%)
• Virgin Media (82%) customers are more likely than average to be satisfied• Compared to the average (77%), customers who say they have superfast* (82%) or ultrafast*
broadband (86%) are more likely to be satisfied. Those who say they have standard* broadband are less likely to be satisfied (71%)
• Compared to the average, those who say they have standard* broadband gave a lower NPS™ and those on superfast* or ultrafast* broadband gave a higher NPS™
*Standard broadband was defined to respondents as – broadband through a phone line or cable service – which is not superfast, so the download speed is less than 30MB/secondSuperfast broadband was defined as – a premium service that delivers higher speeds through either fibre optic or cable service – so the download speed is 30 MB/ second or higherUltrafast broadband was defined as – the download speed is 100MB/ second a higher
More than three quarters (78%) of standalone broadband customers say they are satisfied with the value for money of their service – unchanged compared to 2016
PROMOTING CHOICE • SECURING STANDARDS • PREVENTING HARM
21 2121
Compared to 2016, the level of overall satisfaction is lower for the whole market and for TalkTalk and Virgin Media customers, in particular.
Overall satisfaction with fixed broadband service, total market, by provider and by claimed type of broadband
42%
40%
34%
40%
43%
35%
50%
37%
46%
55%
38%
38%
45%
45%
40%
37%
34%
41%
35%
33%
9%
9%
12%
10%
6%
13%
10%
10%
8%
4%
6%
8%
3%
4%
8%
9%
5%
7%
6%
5%
4%
5%
6%
1%
3%
5%
2%
5%
4%
3%
All fixed broadband
BT
EE
Plusnet
Sky
TalkTalk
Virgin Media
Standard broadband
Superfast broadband
Ultrafast broadband
Very satisfied Fairly satisfied Neither satisfied nor dissatisfied Fairly dissatisfied Very dissatisfied
Source: Ofcom Customer Satisfaction Tracker survey 2018IN2: In terms of your fixed broadband service, how satisfied are you with the overall service provided by (FIXED BROADBAND INTERNET PROVIDER)? Would you say you are…Base: All adults aged 16+ who are the decision maker and express an opinion on their fixed broadband internet service (2263), receiving their service from BT (532), EE (127), Plusnet (130), Sky (558),, TalkTalk (281),Virgin Media (484), those who say they have standard broadband (1053), superfast broadband (890), ultrafast broadband (161). Providers used by fewer than 100 respondents are not shown individually but are included in the total. ‘Don’t know ‘ responses have been excluded from the base. It is not possible to show the trend from 2016 for EE or Plusnet as the base was fewer than 100 interviews.
% satisfied 2016
% satisfied 2018
80%
79%
79%
86%
83%
72%
83%
78%
82%
88%
87%
84%
NA
NA
88%
83%
91%
vs.

PROMOTING CHOICE • SECURING STANDARDS • PREVENTING HARM
22 2222
TalkTalk customers are less likely to be satisfied with the reliability of the service compared to the fixed line broadband market as a whole. Compared to 2016, satisfaction with service reliability in the market as a whole is lower - particularly for Sky and Virgin Media customers.
Satisfaction with reliability of service, total market and by provider
44%
44%
42%
40%
44%
34%
51%
40%
48%
56%
36%
37%
40%
42%
37%
39%
31%
39%
33%
30%
9%
8%
6%
9%
9%
10%
9%
9%
8%
7%
7%
6%
9%
8%
5%
11%
7%
7%
7%
4%
4%
5%
3%
1%
4%
6%
3%
5%
4%
2%
All fixed broadband
BT
EE
Plusnet
Sky
TalkTalk
Virgin Media
Standard broadband
Superfast broadband
Ultrafast broadband
Very satisfied Fairly satisfied Neither satisfied nor dissatisfied Fairly dissatisfied Very dissatisfied
Source: Ofcom Customer Satisfaction Tracker survey 2018IN5: And how satisfied are you with the reliability of your fixed broadband service from (FIXED BROADBAND PROVIDER)? Would you say you are…Base: All adults aged 16+ who are the decision maker and express an opinion on their fixed broadband internet service (2266), receiving their service from BT (532), EE (128), Plusnet (130), Sky (559), TalkTalk (281), Virgin Media (485), those who say they have standard broadband (1053), superfast broadband (890), ultrafast broadband (161). Providers used by fewer than 100 respondents are not shown individually but are included in the total. ‘Don’t know ‘ responses have been excluded from the base. It is not possible to show the trend from 2016 for EE or Plusnet as the base was fewer than 100 interviews.
% satisfied 2016
% satisfied 2018
80%
81%
82%
82%
81%
73%
82%
79%
81%
86%
86%
83%
NA
NA
88%
83%
90%
vs.
PROMOTING CHOICE • SECURING STANDARDS • PREVENTING HARM
23 2323
Virgin Media customers have higher levels of satisfaction with speed than broadband customers as a whole. However, compared to 2016, satisfaction with speed has declined in the broadband market, particularly for Virgin Media and Sky. Satisfaction with speed of fixed broadband service while online, total market, by provider and by claimed type of broadband
39%
36%
38%
31%
39%
27%
49%
32%
44%
60%
38%
41%
38%
39%
37%
44%
33%
39%
38%
26%
10%
10%
7%
11%
9%
13%
8%
12%
8%
6%
8%
6%
10%
18%
9%
10%
7%
10%
6%
5%
5%
7%
6%
1%
6%
5%
3%
7%
4%
3%
All fixed broadband
BT
EE
Plusnet
Sky
TalkTalk
Virgin Media
Standard broadband
Superfast broadband
Ultrafast broadband
Very satisfied Fairly satisfied Neither satisfied nor dissatisfied Fairly dissatisfied Very dissatisfied
Source: Ofcom Customer Satisfaction Tracker survey 2018IN4: And how satisfied are you with the speed of service while online from (FIXED BROADBAND INTERNET PROVIDER)? Would you say you are…Base: All adults aged 16+ who are the decision maker and express an opinion on their fixed broadband internet service (2256), receiving their service from BT (530), EE (128), Plusnet (129), Sky (556), TalkTalk (281), Virgin Media (482), those who say they have standard broadband (1053), superfast broadband (887), ultrafast broadband (159). Providers used by fewer than 100 respondents are not shown individually but are included in the total. ‘Don’t know ‘ responses have been excluded from the base. It is not possible to show the trend from 2016 for EE or Plusnet as the base was fewer than 100 interviews.
% satisfied 2016
% satisfied 2018
77%
77%
76%
70%
76%
71%
82%
71%
82%
86%
83%
80%
NA
NA
84%
71%
91%
vs.

PROMOTING CHOICE • SECURING STANDARDS • PREVENTING HARM
24 2424
29% 33% 35% 30% 25%38%
25%32% 27% 24%
36%36% 33%
32% 39%
36%
34%
38%34%
28%
35% 31% 32%38% 36%
26%
40%31%
39%48%
All fixedbroadband
BT EE Plusnet Sky TalkTalk Virgin Media Standardbroadband
Superfastbroadband
Ultrafastbroadband
Promoters(9-10)
Passives(7-8)
Detractors(0-6)
Virgin Media broadband customers have a higher than average Net Promoter Score™ while TalkTalk customers have a lower than average score. Customers who say they have a faster broadband service have a higher than average score.
Net Promoter score™, total market and by fixed broadband provider
6NPS™score
-1 -3 9 15 -1 24
Source: Ofcom Customer Satisfaction Tracker survey 2018QN3: Based on your overall experience of (FIXED BROADBAND PROVIDER) as your fixed broadband provider, how likely would you be to recommend them to a friend or family member as a mobile phone service provider? Please give a rating on a scale of 0 to 10, where 0 is 'Extremely Unlikely' and 10 is 'Extremely Likely'?Base: All adults aged 16+ who are the decision maker and express an opinion on their fixed broadband internet service (2273), receiving their service from BT (533), EE (129), Plusnet (130), Sky (561), TalkTalk (282), Virgin Media (487), those who say they have standard broadband (1057), superfast broadband (890), ultrafast broadband (161). Providers used by fewer than 100 respondents are not shown individually but are included in the total.
1311 -13
Indicates a result that is higher than averageIndicates a result that is lower than average
PROMOTING CHOICE • SECURING STANDARDS • PREVENTING HARM
25 2525
32% 47% 12% 7% 2%All fixed
broadband
Very satisfied Fairly satisfied Neither satisfied nor dissatisfied Fairly dissatisfied Very dissatisfied
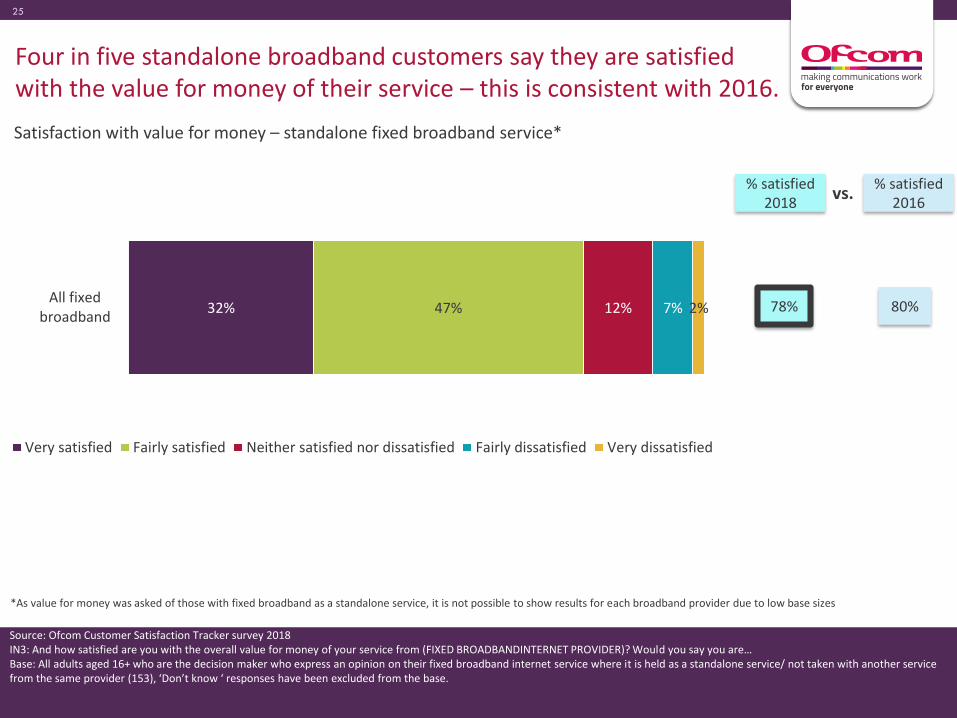
Four in five standalone broadband customers say they are satisfied with the value for money of their service – this is consistent with 2016.
Satisfaction with value for money – standalone fixed broadband service*
Source: Ofcom Customer Satisfaction Tracker survey 2018IN3: And how satisfied are you with the overall value for money of your service from (FIXED BROADBANDINTERNET PROVIDER)? Would you say you are…Base: All adults aged 16+ who are the decision maker who express an opinion on their fixed broadband internet service where it is held as a standalone service/ not taken with another service from the same provider (153), ‘Don’t know ‘ responses have been excluded from the base.
% satisfied 2016
80%78%
% satisfied 2018
vs.
*As value for money was asked of those with fixed broadband as a standalone service, it is not possible to show results for each broadband provider due to low base sizes
PROMOTING CHOICE • SECURING STANDARDS • PREVENTING HARM
26
Section 4Landline

PROMOTING CHOICE • SECURING STANDARDS • PREVENTING HARM
27
Summary - landline
When looking at overall satisfaction with landline services, close to nine in ten (87%) are satisfied
• Compared to this average (87%), satisfaction is lower among TalkTalk landline customers (82%)• Satisfaction is unchanged compared to 2016 at an overall level and by provider
Three quarters (76%) of standalone landline customers say they are satisfied with the value for money of their landline service
Nine in ten (90%) landline customers are satisfied with the reliability of their landline service and with the clarity of the line when making/receiving calls (89%)
• This measure is unchanged compared to 2016
• Compared to this average for the market (89%), satisfaction is lower for line clarity among Plusnet customers (82%)
The Net Promoter Score ™ does not vary by landline provider, compared to the average for the market
PROMOTING CHOICE • SECURING STANDARDS • PREVENTING HARM
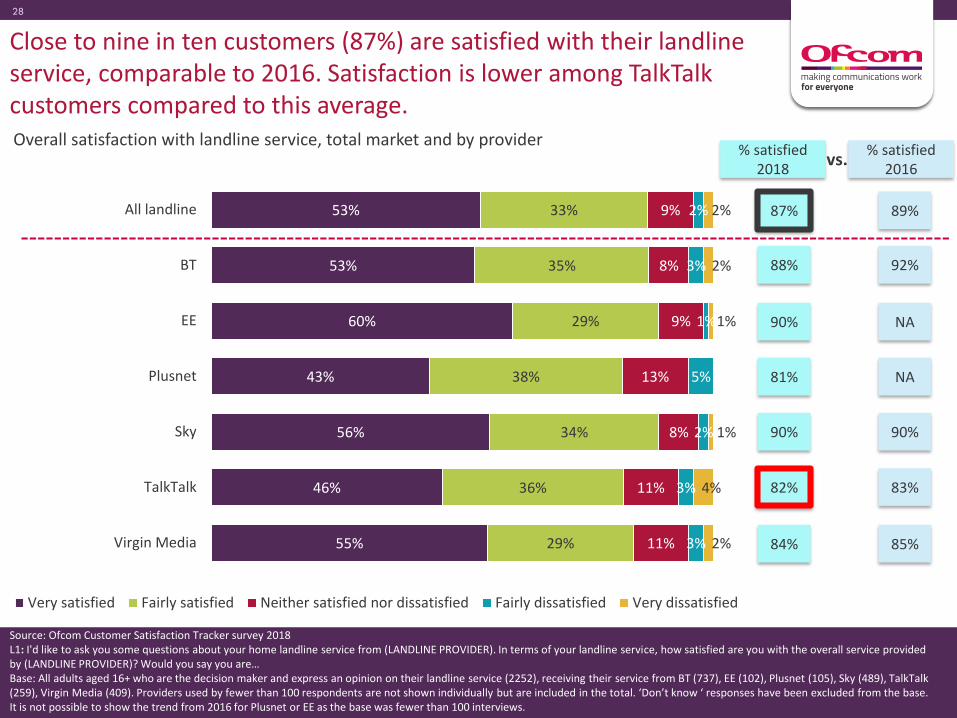
28 2828
Close to nine in ten customers (87%) are satisfied with their landline service, comparable to 2016. Satisfaction is lower among TalkTalk customers compared to this average.Overall satisfaction with landline service, total market and by provider
53%
53%
60%
43%
56%
46%
55%
33%
35%
29%
38%
34%
36%
29%
9%
8%
9%
13%
8%
11%
11%
2%
3%
1%
5%
2%
3%
3%
2%
2%
1%
1%
4%
2%
All landline
BT
EE
Plusnet
Sky
TalkTalk
Virgin Media
Very satisfied Fairly satisfied Neither satisfied nor dissatisfied Fairly dissatisfied Very dissatisfied
Source: Ofcom Customer Satisfaction Tracker survey 2018L1: I'd like to ask you some questions about your home landline service from (LANDLINE PROVIDER). In terms of your landline service, how satisfied are you with the overall service provided by (LANDLINE PROVIDER)? Would you say you are…Base: All adults aged 16+ who are the decision maker and express an opinion on their landline service (2252), receiving their service from BT (737), EE (102), Plusnet (105), Sky (489), TalkTalk (259), Virgin Media (409). Providers used by fewer than 100 respondents are not shown individually but are included in the total. ‘Don’t know ‘ responses have been excluded from the base. It is not possible to show the trend from 2016 for Plusnet or EE as the base was fewer than 100 interviews.
% satisfied 2016
89%
92%
NA
NA
90%
83%
85%
87%
88%
90%
81%
90%
82%
84%
% satisfied 2018
vs.
PROMOTING CHOICE • SECURING STANDARDS • PREVENTING HARM
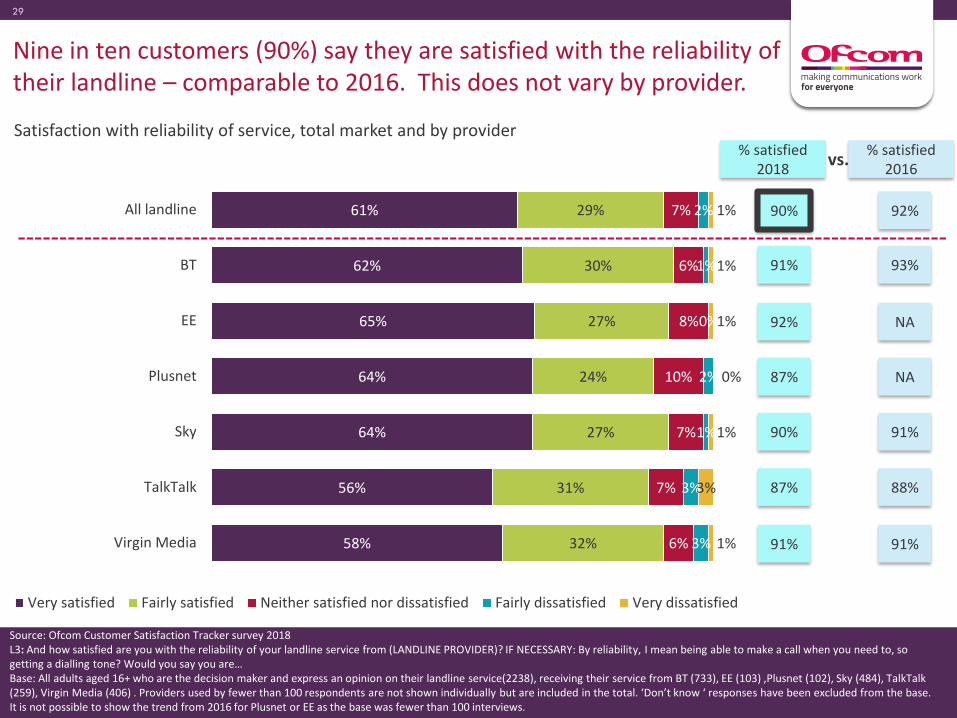
29 2929
Nine in ten customers (90%) say they are satisfied with the reliability of their landline – comparable to 2016. This does not vary by provider.
Satisfaction with reliability of service, total market and by provider
61%
62%
65%
64%
64%
56%
58%
29%
30%
27%
24%
27%
31%
32%
7%
6%
8%
10%
7%
7%
6%
2%
1%
0%
2%
1%
3%
3%
1%
1%
1%
0%
1%
3%
1%
All landline
BT
EE
Plusnet
Sky
TalkTalk
Virgin Media
Very satisfied Fairly satisfied Neither satisfied nor dissatisfied Fairly dissatisfied Very dissatisfied
Source: Ofcom Customer Satisfaction Tracker survey 2018L3: And how satisfied are you with the reliability of your landline service from (LANDLINE PROVIDER)? IF NECESSARY: By reliability, I mean being able to make a call when you need to, so getting a dialling tone? Would you say you are…Base: All adults aged 16+ who are the decision maker and express an opinion on their landline service(2238), receiving their service from BT (733), EE (103) ,Plusnet (102), Sky (484), TalkTalk (259), Virgin Media (406) . Providers used by fewer than 100 respondents are not shown individually but are included in the total. ‘Don’t know ‘ responses have been excluded from the base. It is not possible to show the trend from 2016 for Plusnet or EE as the base was fewer than 100 interviews..
% satisfied 2016
92%
93%
NA
NA
91%
88%
91%
90%
91%
92%
87%
90%
87%
91%
% satisfied 2018
vs.

PROMOTING CHOICE • SECURING STANDARDS • PREVENTING HARM
30 3030
Nine in ten customers (89%) are satisfied with the clarity of the line when making or receiving calls. Compared to this average, Plusnet customers are less likely to be satisfied with this aspect of their service.
Satisfaction with clarity of the line, total market and by provider
61%
62%
70%
57%
62%
57%
60%
28%
28%
22%
24%
27%
33%
29%
7%
6%
5%
12%
7%
5%
8%
2%
2%
2%
4%
2%
3%
2%
1%
1%
1%
3%
1%
3%
2%
All landline
BT
EE
Plusnet**
Sky
TalkTalk
Virgin Media
Very satisfied Fairly satisfied Neither satisfied nor dissatisfied Fairly dissatisfied Very dissatisfied
Source: Ofcom Customer Satisfaction Tracker survey 2018L4: And how satisfied are you with the clarity of the line when making or receiving calls on your landline from (LANDLINE PROVIDER)? IF NECESSARY: By this I mean being able to clearly hear the other person on the call. Would you say you are…Base: All adults aged 16+ who are the decision maker and express an opinion on their landline service (2202), receiving their service from BT (729), EE (101), Plusnet (98** base lower than 100 interviews), Sky (478), TalkTalk (253), Virgin Media (393). Other providers used by fewer than 100 respondents are not shown individually but are included in the total. ‘Don’t know ‘ responses have been excluded from the base. As satisfaction with line clarity was asked about for the first time in 2018, no trend data is available
89%
90%
92%
82%
90%
89%
88%
% satisfied 2018

PROMOTING CHOICE • SECURING STANDARDS • PREVENTING HARM
31 3131
27% 26% 28%34%
25%31% 27%
36% 37% 33%29%
39%36%
31%
38% 37% 40% 36% 36% 33%42%
All landline BT EE Plusnet Sky TalkTalk Virgin Media
Promoters(9-10)
Passives(7-8)
Detractors(0-6)
Landline customers are more likely to be ‘Promoters’ than ‘Detractors’, resulting in a positive Net Promoter Score™. This score does not vary by provider, although the gap between Promoters and Detractors is narrowest for Plusnet and TalkTalk.
Net Promoter score (NPS™), total market and by landline provider
11NPS™ score
11 12 2 11 1 15
Source: Ofcom Customer Satisfaction Tracker survey 2018QN1 Based on your overall experience of using (LANDLINE PROVIDER) for your landline service, how likely would you be to recommend them to a friend or family member as a landline provider? Please give a rating on a scale of 0 to 10, where 0 is 'Extremely Unlikely' and 10 is 'Extremely Likely'?Base: All adults aged 16+ who are the decision maker and express an opinion on their landline service (2332), receiving their service from BT (753), EE (109), Plusnet (110), Sky (509), TalkTalk (272), Virgin Media (424). Providers used by fewer than 100 respondents are not shown individually but are included in the total.

PROMOTING CHOICE • SECURING STANDARDS • PREVENTING HARM
32 3232
Compared to 2016, satisfaction with value for money among standalone customers is unchanged in the landline market.
Satisfaction with value for money – standalone landline service*
42% 34% 14% 7% 3%All landline
Very satisfied Fairly satisfied Neither satisfied nor dissatisfied Fairly dissatisfied Very dissatisfied
Source: Ofcom Customer Satisfaction Tracker survey 2018L2: And how satisfied are you with the overall value for money of your service from (LANDLINE PROVIDER)? Would you say you are…Base: All adults aged 16+ who are the decision maker who express an opinion on their landline service where it is held as a standalone service/ not taken with another service from the same provider (300)‘Don’t know ‘ responses have been excluded from the base.
% satisfied 2016
82%76%
% satisfied 2018 vs.
*As value for money was asked of those with a landline as a standalone service, it is not possible to show results for each landline provider due to low base sizes

PROMOTING CHOICE • SECURING STANDARDS • PREVENTING HARM
33
Section 5Mobile
PROMOTING CHOICE • SECURING STANDARDS • PREVENTING HARM
34
Summary – mobile phone
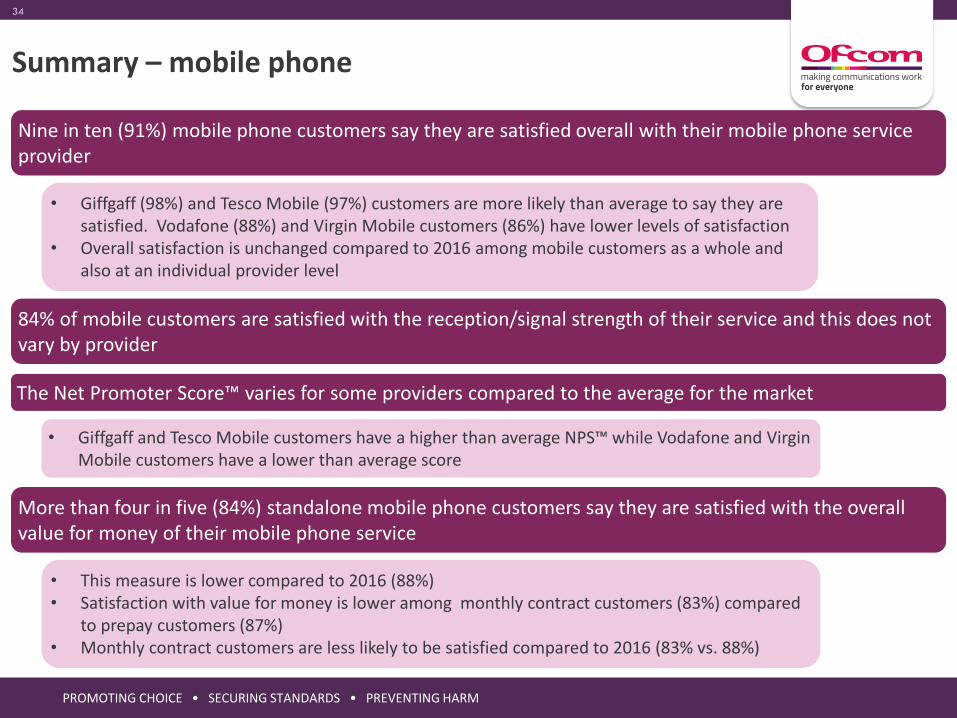
Nine in ten (91%) mobile phone customers say they are satisfied overall with their mobile phone service provider
• Giffgaff (98%) and Tesco Mobile (97%) customers are more likely than average to say they are satisfied. Vodafone (88%) and Virgin Mobile customers (86%) have lower levels of satisfaction
• Overall satisfaction is unchanged compared to 2016 among mobile customers as a whole and also at an individual provider level
84% of mobile customers are satisfied with the reception/signal strength of their service and this does not vary by provider
The Net Promoter Score™ varies for some providers compared to the average for the market
• Giffgaff and Tesco Mobile customers have a higher than average NPS™ while Vodafone and Virgin Mobile customers have a lower than average score
More than four in five (84%) standalone mobile phone customers say they are satisfied with the overall value for money of their mobile phone service
• This measure is lower compared to 2016 (88%)• Satisfaction with value for money is lower among monthly contract customers (83%) compared
to prepay customers (87%)• Monthly contract customers are less likely to be satisfied compared to 2016 (83% vs. 88%)
PROMOTING CHOICE • SECURING STANDARDS • PREVENTING HARM
35 3535
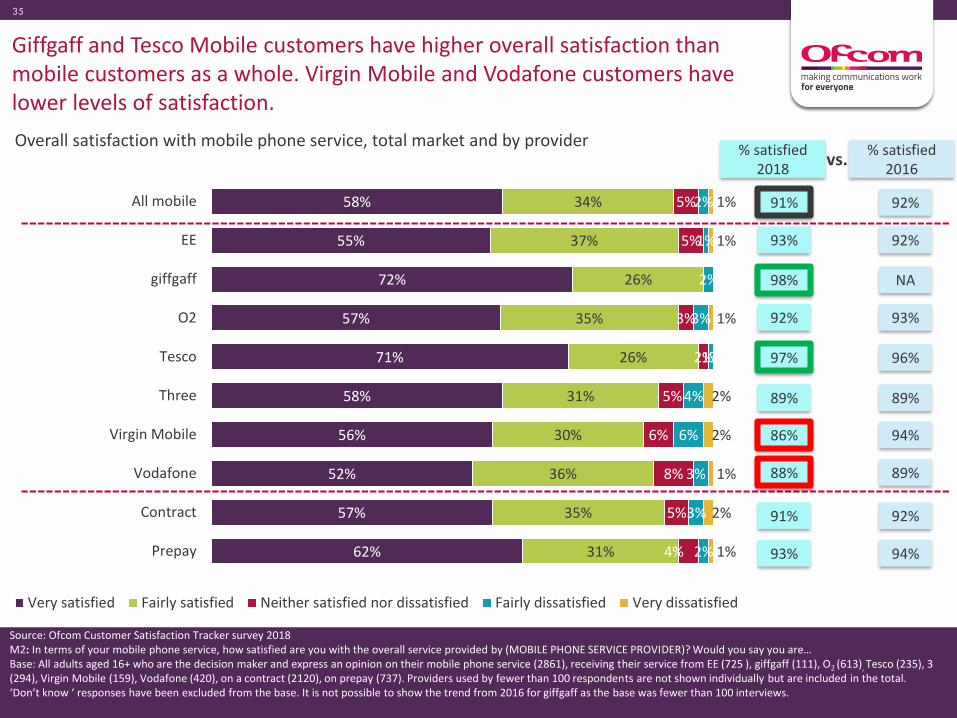
Giffgaff and Tesco Mobile customers have higher overall satisfaction than mobile customers as a whole. Virgin Mobile and Vodafone customers have lower levels of satisfaction.
Overall satisfaction with mobile phone service, total market and by provider
58%
55%
72%
57%
71%
58%
56%
52%
57%
62%
34%
37%
26%
35%
26%
31%
30%
36%
35%
31%
5%
5%
3%
2%
5%
6%
8%
5%
4%
2%
1%
2%
3%
1%
4%
6%
3%
3%
2%
1%
1%
1%
2%
2%
1%
2%
1%
All mobile
EE
giffgaff
O2
Tesco
Three
Virgin Mobile
Vodafone
Contract
Prepay
Very satisfied Fairly satisfied Neither satisfied nor dissatisfied Fairly dissatisfied Very dissatisfied
Source: Ofcom Customer Satisfaction Tracker survey 2018M2: In terms of your mobile phone service, how satisfied are you with the overall service provided by (MOBILE PHONE SERVICE PROVIDER)? Would you say you are…Base: All adults aged 16+ who are the decision maker and express an opinion on their mobile phone service (2861), receiving their service from EE (725 ), giffgaff (111), O2 (613), Tesco (235), 3 (294), Virgin Mobile (159), Vodafone (420), on a contract (2120), on prepay (737). Providers used by fewer than 100 respondents are not shown individually but are included in the total. ‘Don’t know ‘ responses have been excluded from the base. It is not possible to show the trend from 2016 for giffgaff as the base was fewer than 100 interviews.
% satisfied 2016
% satisfied 2018
91%
93%
98%
92%
97%
86%
88%
91%
93%
92%
92%
NA
93%
96%
89%
94%
89%
92%
94%
vs.
89%

PROMOTING CHOICE • SECURING STANDARDS • PREVENTING HARM
36 3636
Over four in five mobile customers are satisfied overall with their reception/signal strength, with no difference by provider. Satisfaction is unchanged compared to 2016, both at an overall level and for each provider.Satisfaction with reception/ signal strength, total market and by provider
48%
48%
62%
47%
59%
44%
45%
45%
46%
55%
35%
35%
29%
36%
29%
38%
40%
39%
36%
32%
8%
10%
6%
7%
6%
7%
6%
6%
8%
5%
5%
4%
2%
4%
5%
6%
3%
7%
5%
3%
4%
3%
1%
6%
1%
5%
5%
3%
4%
4%
All mobile
EE
giffgaff
O2
Tesco
Three
Virgin Mobile
Vodafone
Contract
Prepay
Very satisfied Fairly satisfied Neither satisfied nor dissatisfied Fairly dissatisfied Very dissatisfied
Source: Ofcom Customer Satisfaction Tracker survey 2018M4: And how satisfied are you overall with the reception or signal strength that you get on your mobile phone service from (MOBILE PHONE SERVICE PROVIDER)? Would you say you are…Base: All adults aged 16+ who are the decision maker and express an opinion on their mobile phone service (2862), receiving their service from EE (725), giffgaff (111), O2 (612), Tesco (236), 3 (294), Virgin Mobile (160), Vodafone (421), on a contract (2119), on prepay (738).Providers used by fewer than 100 respondents are not shown individually but are included in the total. ‘Don’t know ‘ responses have been excluded from the base. As satisfaction with the reception or signal strength was asked about for the first time in 2018, no trend data is available**In 2016 the question wording read: And how satisfied are you with the reception or ease of accessing the (MOBILE PHONE SERVICE PROVIDER) network?
% satisfied 2018
84%
83%
91%
83%
88%
82%
86%
84%
83%
87%
% satisfied 2016**
86%
85%
NA
86%
91%
80%
87%
86%
85%
88%
vs.

PROMOTING CHOICE • SECURING STANDARDS • PREVENTING HARM
37 3737
20% 21%
8%20%
10%18%
32%25%
20% 21%
37% 38%
24%
40%
30%
38%
31%38%
38% 34%
42% 41%
68%
39%
60%
44%37% 36%
42% 45%
All mobile EE giffgaff O2 Tesco Three Virgin Mobile Vodafone Contract Prepay
Promoters(9-10)
Passives(7-8)
Detractors(0-6)
Giffgaff and Tesco Mobile customers have a higher than average Net Promoter Score™. Virgin Mobile and Vodafone customers have a lower than average score.
Net Promoter score™, total market and by mobile phone service provider
22NPS™score
20 60 19 6 11 24
Source: Ofcom Customer Satisfaction Tracker survey 2018QN2: Based on your overall experience of (MOBILE PHONE SERVICE PROVIDER) as your mobile phone service provider, how likely would you be to recommend them to a friend or family member as a mobile phone service provider? Please give a rating on a scale of 0 to 10, where 0 is 'Extremely Unlikely' and 10 is 'Extremely Likely'?Base: All adults aged 16+ who are the decision maker and express an opinion on their mobile phone service (2868), receiving their service from EE (725), giffgaff (111), O2 (615), Tesco (236), 3 (294), Virgin Mobile (160), Vodafone (422), on a contract (2121), on prepay (740). Providers used by fewer than 100 respondents are not shown individually but are included in the total.
2251 26
Indicates a result that is higher than averageIndicates a result that is lower than average
PROMOTING CHOICE • SECURING STANDARDS • PREVENTING HARM
38 3838
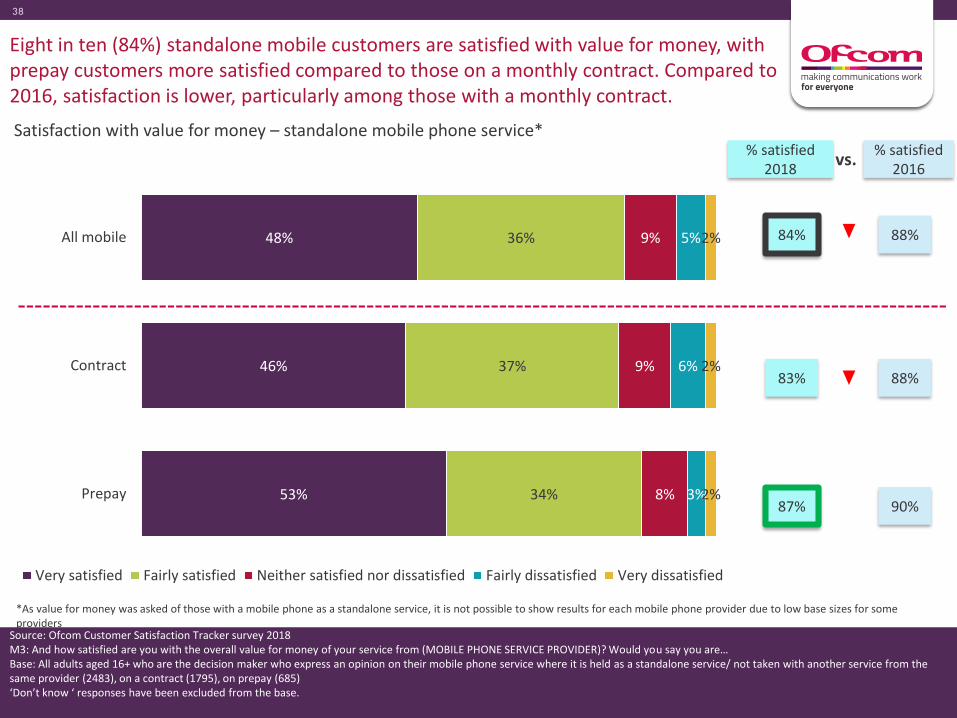
Eight in ten (84%) standalone mobile customers are satisfied with value for money, with prepay customers more satisfied compared to those on a monthly contract. Compared to 2016, satisfaction is lower, particularly among those with a monthly contract.
Satisfaction with value for money – standalone mobile phone service*
48%
46%
53%
36%
37%
34%
9%
9%
8%
5%
6%
3%
2%
2%
2%
All mobile
Contract
Prepay
Very satisfied Fairly satisfied Neither satisfied nor dissatisfied Fairly dissatisfied Very dissatisfied
Source: Ofcom Customer Satisfaction Tracker survey 2018M3: And how satisfied are you with the overall value for money of your service from (MOBILE PHONE SERVICE PROVIDER)? Would you say you are…Base: All adults aged 16+ who are the decision maker who express an opinion on their mobile phone service where it is held as a standalone service/ not taken with another service from the same provider (2483), on a contract (1795), on prepay (685)‘Don’t know ‘ responses have been excluded from the base.
% satisfied 2016
88%84%
% satisfied 2018
88%83%
90%87%
vs.
*As value for money was asked of those with a mobile phone as a standalone service, it is not possible to show results for each mobile phone provider due to low base sizes for some providers

PROMOTING CHOICE • SECURING STANDARDS • PREVENTING HARM
39
Section 6Pay TV
PROMOTING CHOICE • SECURING STANDARDS • PREVENTING HARM
40
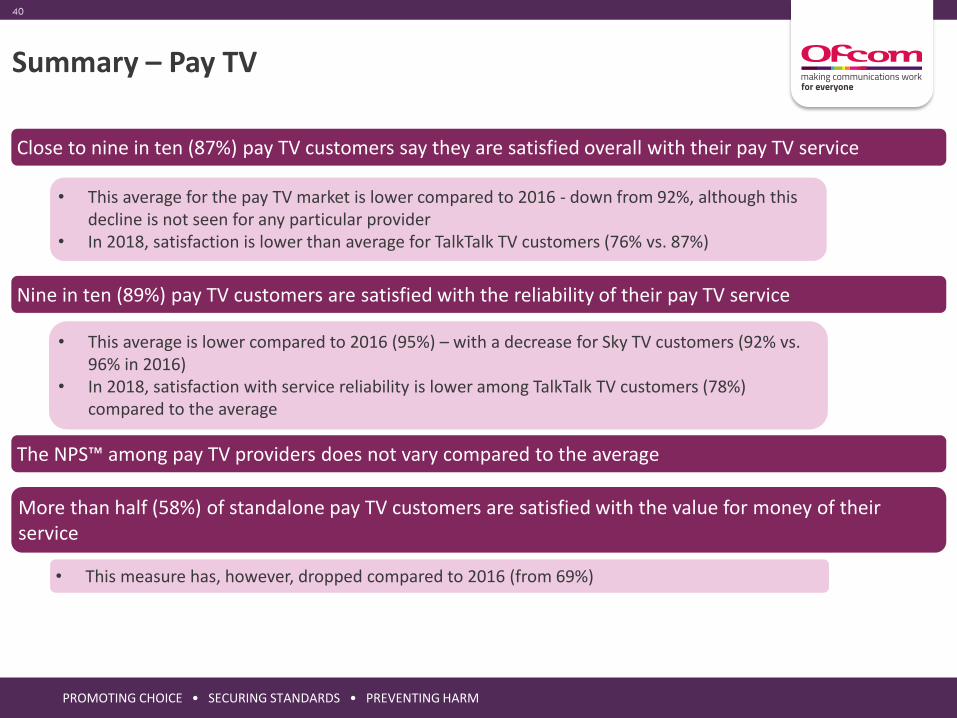
Summary – Pay TV
Close to nine in ten (87%) pay TV customers say they are satisfied overall with their pay TV service
• This average for the pay TV market is lower compared to 2016 - down from 92%, although this decline is not seen for any particular provider
• In 2018, satisfaction is lower than average for TalkTalk TV customers (76% vs. 87%)
Nine in ten (89%) pay TV customers are satisfied with the reliability of their pay TV service
• This measure has, however, dropped compared to 2016 (from 69%)
• This average is lower compared to 2016 (95%) – with a decrease for Sky TV customers (92% vs. 96% in 2016)
• In 2018, satisfaction with service reliability is lower among TalkTalk TV customers (78%) compared to the average
The NPS™ among pay TV providers does not vary compared to the average
More than half (58%) of standalone pay TV customers are satisfied with the value for money of their service

PROMOTING CHOICE • SECURING STANDARDS • PREVENTING HARM
41 4141
Overall satisfaction is lower among pay TV customers, compared to 2016 although this decrease is not seen for any particular provider. In 2018, satisfaction is lower among TalkTalk customers compared to the average for pay TV customers.
Overall satisfaction with pay TV service, total market and by provider
48%
45%
49%
41%
50%
39%
44%
40%
35%
35%
7%
6%
6%
17%
8%
4%
4%
3%
3%
5%
2%
1%
1%
4%
2%
All Pay TV
BT
Sky
TalkTalk
Virgin Media
Very satisfied Fairly satisfied Neither satisfied nor dissatisfied Fairly dissatisfied Very dissatisfied
Source: Ofcom Customer Satisfaction Tracker survey 2018PT1: I’d like to ask you some questions about your pay TV service provided by (PAY TV SERVICE PROVIDER). How satisfied are you with the overall service provided by your television service provider (PAY TV SERVICE PROVIDER) ? Would you say you are…Base: All adults aged 16+ who are the decision maker and express an opinion on their pay TV service (1487), receiving their service from BT (126), Sky (791), TalkTalk (105), Virgin Media (399). Providers used by fewer than 100 respondents are not shown individually but are included in the total. ‘Don’t know ‘ responses have been excluded from the base. It is not possible to show the trend from 2016 for BT or TalkTalk as the base was fewer than 100 interviews.
% satisfied 2016
% satisfied 2018
87%
89%
89%
76%
92%
85%
NA
93%
NA
91%
vs.
PROMOTING CHOICE • SECURING STANDARDS • PREVENTING HARM
42 4242
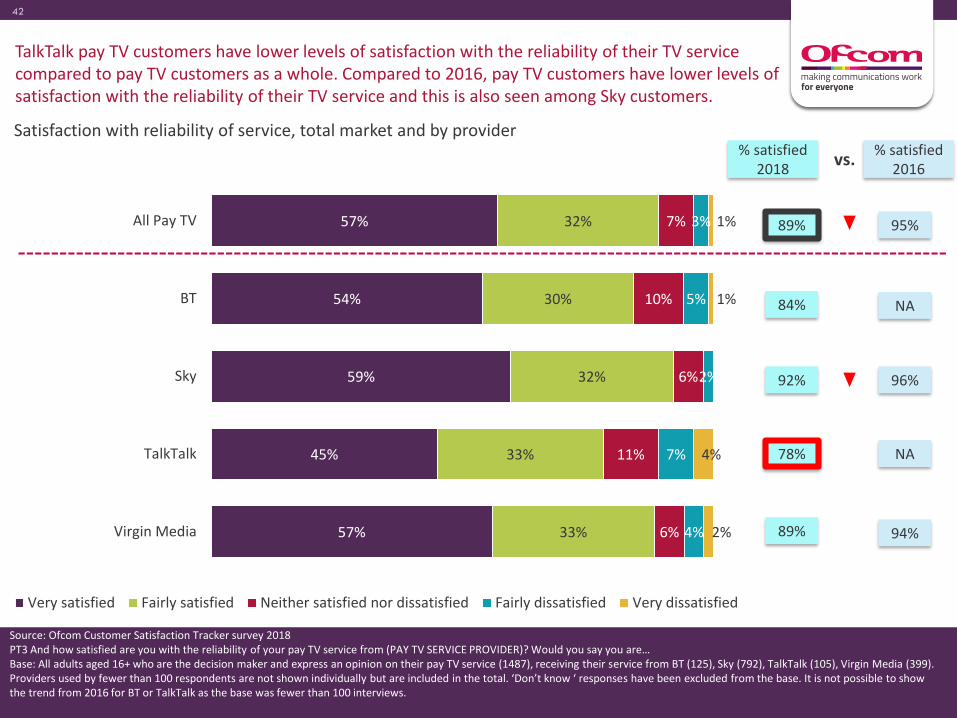
TalkTalk pay TV customers have lower levels of satisfaction with the reliability of their TV service compared to pay TV customers as a whole. Compared to 2016, pay TV customers have lower levels of satisfaction with the reliability of their TV service and this is also seen among Sky customers.
Satisfaction with reliability of service, total market and by provider
57%
54%
59%
45%
57%
32%
30%
32%
33%
33%
7%
10%
6%
11%
6%
3%
5%
2%
7%
4%
1%
1%
4%
2%
All Pay TV
BT
Sky
TalkTalk
Virgin Media
Very satisfied Fairly satisfied Neither satisfied nor dissatisfied Fairly dissatisfied Very dissatisfied
Source: Ofcom Customer Satisfaction Tracker survey 2018PT3 And how satisfied are you with the reliability of your pay TV service from (PAY TV SERVICE PROVIDER)? Would you say you are…Base: All adults aged 16+ who are the decision maker and express an opinion on their pay TV service (1487), receiving their service from BT (125), Sky (792), TalkTalk (105), Virgin Media (399). Providers used by fewer than 100 respondents are not shown individually but are included in the total. ‘Don’t know ‘ responses have been excluded from the base. It is not possible to show the trend from 2016 for BT or TalkTalk as the base was fewer than 100 interviews.
% satisfied 2016
% satisfied 2018
89%
84%
92%
78%
95%
89%
NA
96%
NA
94%
vs.

PROMOTING CHOICE • SECURING STANDARDS • PREVENTING HARM
43 4343
26% 29% 26%35%
24%
37% 34% 37%
33%
36%
37% 37% 37% 32%40%
All Pay TV BT Sky TalkTalk Virgin Media
Promoters(9-10)
Passives(7-8)
Detractors(0-6)
Net Promoter score (NPS™), total market and by pay TV provider
11NPS™score
8 -3 16
Source: Ofcom Customer Satisfaction Tracker survey 2018QN4: Based on your overall experience of using (PAY TV PROVIDER) as your pay TV provider, how likely would you be to recommend them to a friend or family member as a landline provider? Please give a rating on a scale of 0 to 10, where 0 is 'Extremely Unlikely' and 10 is 'Extremely Likely'?Base: All adults aged 16+ who are the decision maker and express an opinion on their pay TV service (1494), receiving their service from BT (126), Sky (792), TalkTalk (106), Virgin Media (399). Providers used by fewer than 100 respondents are not shown individually but are included in the total.
10
Pay TV customers as a whole are more likely to be ‘Promoters’ rather than ‘Detractors’, resulting in a positive Net Promoter Score™ for the pay TV market. This score does not vary by provider.
PROMOTING CHOICE • SECURING STANDARDS • PREVENTING HARM
44 4444
25% 33% 17% 15% 9%All Pay TV
Very satisfied Fairly satisfied Neither satisfied nor dissatisfied Fairly dissatisfied Very dissatisfied
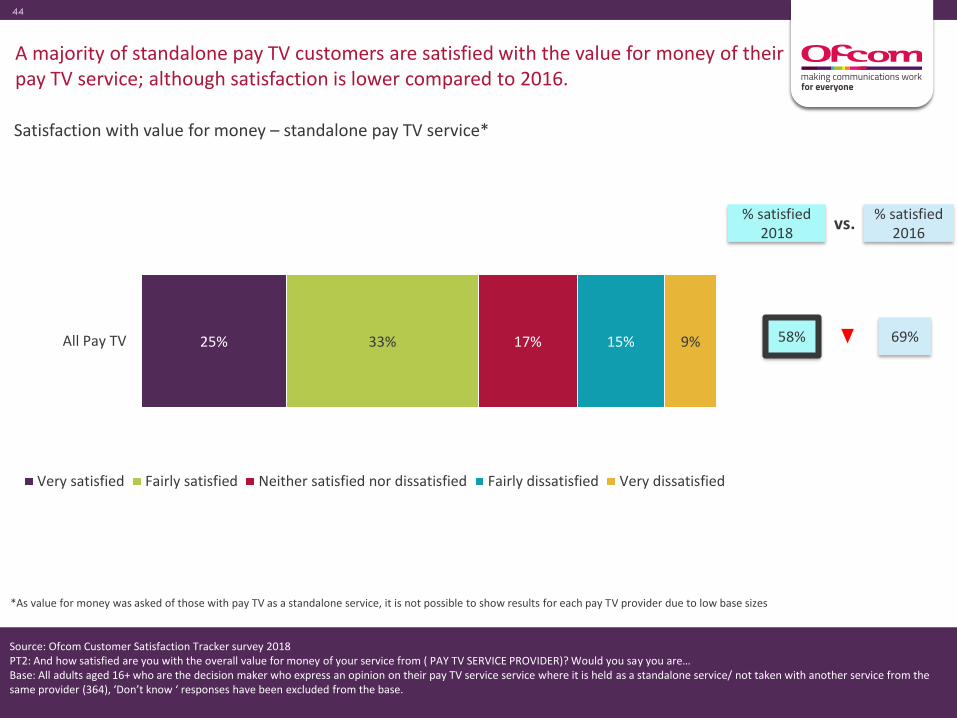
A majority of standalone pay TV customers are satisfied with the value for money of their pay TV service; although satisfaction is lower compared to 2016.
Satisfaction with value for money – standalone pay TV service*
Source: Ofcom Customer Satisfaction Tracker survey 2018PT2: And how satisfied are you with the overall value for money of your service from ( PAY TV SERVICE PROVIDER)? Would you say you are…Base: All adults aged 16+ who are the decision maker who express an opinion on their pay TV service service where it is held as a standalone service/ not taken with another service from the same provider (364), ‘Don’t know ‘ responses have been excluded from the base.
% satisfied 2016
69%58%
% satisfied 2018
vs.
*As value for money was asked of those with pay TV as a standalone service, it is not possible to show results for each pay TV provider due to low base sizes

PROMOTING CHOICE • SECURING STANDARDS • PREVENTING HARM
45
Section 7Services taken from the same provider/ Bundle

PROMOTING CHOICE • SECURING STANDARDS • PREVENTING HARM
46
Summary – services taken with the same provider
Eighty four percent of bundle customers are satisfied overall with the service they receive -unchanged compared to 2016
• In 2018, TalkTalk bundle customers (77%) are less likely than average to be satisfied (84%)
Seven in ten (70%) bundle customers are satisfied with the overall value for money of these services
• Satisfaction is higher than average among those who have more than one service with EE (86%) or Plusnet (82%) and lower among those with a Virgin Media bundle (65%)
• The overall average (70%) is lower compared to 2016 (76%)• Virgin Media bundle customers are less likely to be satisfied with the value for money
of these services (65%) compared to 2016 (77%)

PROMOTING CHOICE • SECURING STANDARDS • PREVENTING HARM
47 4747
More than four in five bundle customers say they are satisfied overall with the service provided -unchanged compared to 2016. In 2018, TalkTalk bundle customers (77%) are less likely than average to be satisfied (84%).
Overall satisfaction with bundled services, total market and by provider
45%
41%
45%
50%
47%
39%
46%
39%
40%
45%
34%
39%
38%
40%
9%
9%
7%
12%
8%
13%
7%
5%
6%
2%
4%
5%
7%
5%
2%
3%
1%
1%
1%
3%
3%
All Bundle customers
BT
EE
Plusnet
Sky
TalkTalk
Virgin Media
Very satisfied Fairly satisfied Neither satisfied nor dissatisfied Fairly dissatisfied Very dissatisfied
Source: Ofcom Customer Satisfaction Tracker survey 2018B1: I’d like to talk to you about the services you have from the same supplier - so using (PROVIDER) for your (SERVICES TAKEN). In terms of you overall package of services, how satisfied are you with the overall service provide by (PROVIDER)? Would you say you are…Base: All adults aged 16+ who are the decision maker and express an opinion on those services they take from the same provider (2182), receiving their service from BT (522), EE (123), Plusnet (109), Sky (552), TalkTalk (265), Virgin Media (462). Providers used by fewer than 100 respondents are not shown individually but are included in the total. ‘Don’t know ‘ responses have been excluded from the base.. It is not possible to show the trend from 2016 for EE or Plusnet as the base was fewer than 100 interviews.
% satisfied 2016
% satisfied 2018
84%
82%
90%
85%
86%
85%
82%
NA
89%
86%
77% 82%
84% NA
vs.

PROMOTING CHOICE • SECURING STANDARDS • PREVENTING HARM
48 4848
EE (86%) and Plusnet (82%) bundle customers have higher levels of satisfaction with the value for money of these services compared to the average (70%) while satisfaction among Virgin Media customers (65%) is lower than average. Compared to 2016, bundle customers are less likely to be satisfied with value for money, particularly Virgin Media customers.
Satisfaction with value for money – bundle customers, total market and by provider
Source: Ofcom Customer Satisfaction Tracker survey 2018B2: And how satisfied are you with the overall value for money of your service from (PROVIDER)? Would you say you are…Base: All adults aged 16+ who are the decision maker and express an opinion on those services they take from the same provider (2180), receiving their service from BT (518), EE (125), Plusnet (109), Sky (553), TalkTalk (265), Virgin Media (461). Providers used by fewer than 100 respondents are not shown individually but are included in the total. ‘Don’t know ‘ responses have been excluded from the base. It is not possible to show the trend from 2016 for EE or Plusnet as the base was fewer than 100 interviews.
% satisfied 2016
76%70%
% satisfied 2018
34%
28%
45%
45%
33%
38%
29%
36%
39%
41%
36%
33%
37%
36%
14%
15%
10%
9%
17%
15%
15%
10%
10%
3%
9%
12%
6%
14%
5%
8%
1%
1%
5%
4%
6%
All Bundle customers
BT
EE
Plusnet
Sky
TalkTalk
Virgin Media
Very satisfied Fairly satisfied Neither satisfied nor dissatisfied Fairly dissatisfied Very dissatisfied
74%67%
NA86%
NA82%
72%66%
79%75%
77%65%
vs.