Embed Size (px)
Citation preview

Current And Emerging Technologies In Current And Emerging Technologies In Insulin Pumps & Continuous MonitorsInsulin Pumps & Continuous Monitors
May 8, 2008May 8, 2008
John Walsh, PA, [email protected]
(619) 497-0900
Advanced Metabolic Care + ResearchAdvanced Metabolic Care + Research
700 West El Norte Pkwy700 West El Norte Pkwy
Escondido, CA 92126Escondido, CA 92126
(760) 743-1431(760) 743-1431
Highlights
Background
Smart Pumps and Features
Pump Control Tips
DIA and BOB
Super Bolus
Continuous Monitors and Tips
Wrap Up

EDIC Study FindingsLower Glucose Prevents Heart Attacks & Early Death
After the DCCT ended in 1993, the EDIC Study has followed these participants.
Over 11 years, A1c levels in intensive and conventional control groups have been identical at 7.9% (was ~7.4% and ~9.1%).
However, heart attacks and strokes have been twice as high (98 vs 46) in the original conventional versus intensive group, even though A1c levels have been identical since the DCCT trial ended.
1. EDIC Study Group presentation at 2005 ADA, K.M. Venkat Narayan: Clinical Diabetes 24:88-89, 2006

EDIC Study FindingsLower Glucose Temporarily Reduces Nerve Damage
The tight control group also experienced half as much neuropathy
BUT, as shown in figure, improvedcontrol in the past delays progression but offers no long-term protection
Also, an A1c of 7.9% does not stopprogression of nerve damage (or CVD)
Take Home: Improve control and KEEP it there!
Diabetes Care, Vol 29, No. 2, pp. 340-344
Avg A1c = 7.9%
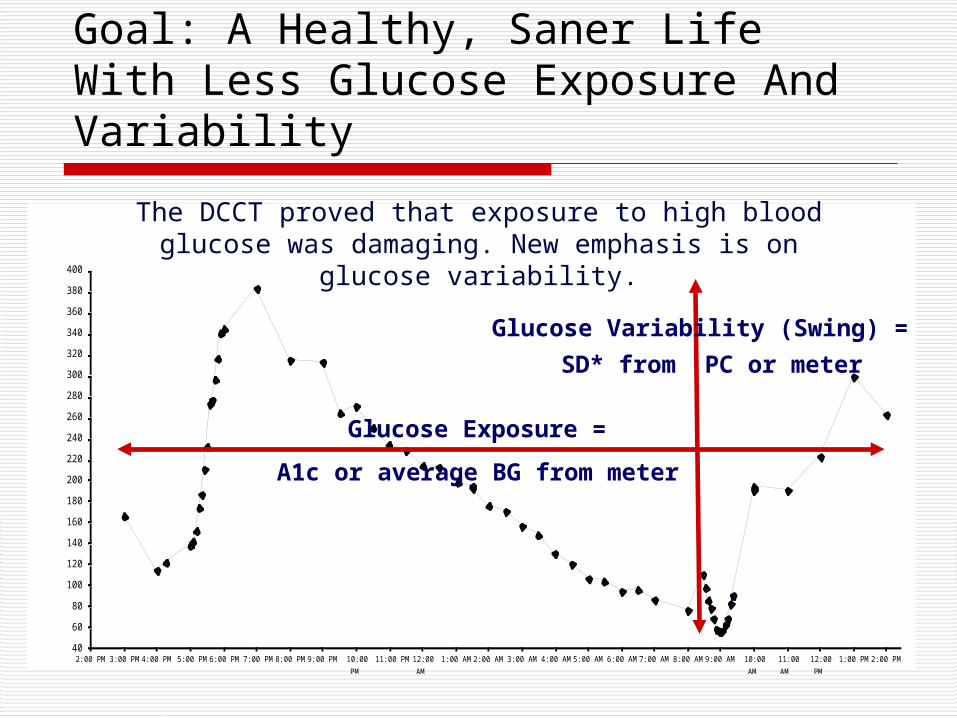
Goal: A Healthy, Saner Life With Less Glucose Exposure And Variability
40
60
80
100
120
140
160
180
200
220
240
260
280
300
320
340
360
380
400
2:00 PM 3:00 PM 4:00 PM 5:00 PM 6:00 PM 7:00 PM 8:00 PM 9:00 PM 10:00
PM
11:00 PM 12:00
AM
1:00 AM 2:00 AM 3:00 AM 4:00 AM 5:00 AM 6:00 AM 7:00 AM 8:00 AM 9:00 AM 10:00
AM
11:00
AM
12:00
PM
1:00 PM 2:00 PM
glucose (mg/dl)
The DCCT proved that exposure to high blood glucose was damaging. New emphasis is on glucose variability.
Glucose Exposure =
Glucose Variability (Swing) =
A1c or average BG from meter
SD* from PC or meter

Current Pump Reality
Pumps provide only modest improvements in A1c levels over MDI:
About 0.6% lower (mid to upper 8% range)
Avg. A1c of 8.5% is well above goal of less than 7% or 6.5%
But glucose levels ARE more stable with less insulin needed per day

Smart Pump Features

Smart Pump Features – Overview
Automatic carb and correction calculations based on: Carb and correction factors Glucose targets DIA avoids insulin stacking Carb and correction boluses
adjusted for BOB for accuracy and safety Personal carb database Correction bolus shown as % of TDD Direct glucose entry and detailed glucose history Reminders, alerts, weekly schedule, temp basal rates, etc.

Deltec Cozmo
Features: # Pumps
HypoManager 1
Weekly Schedule 1
Missed Meal Bolus 1
Bolus Not Completed 1
Disconnect Bolus 1
Basal Test 1
Meal Maker with CozFoods 4
Therapy Effectiveness 2
BG Variability (SD) 1
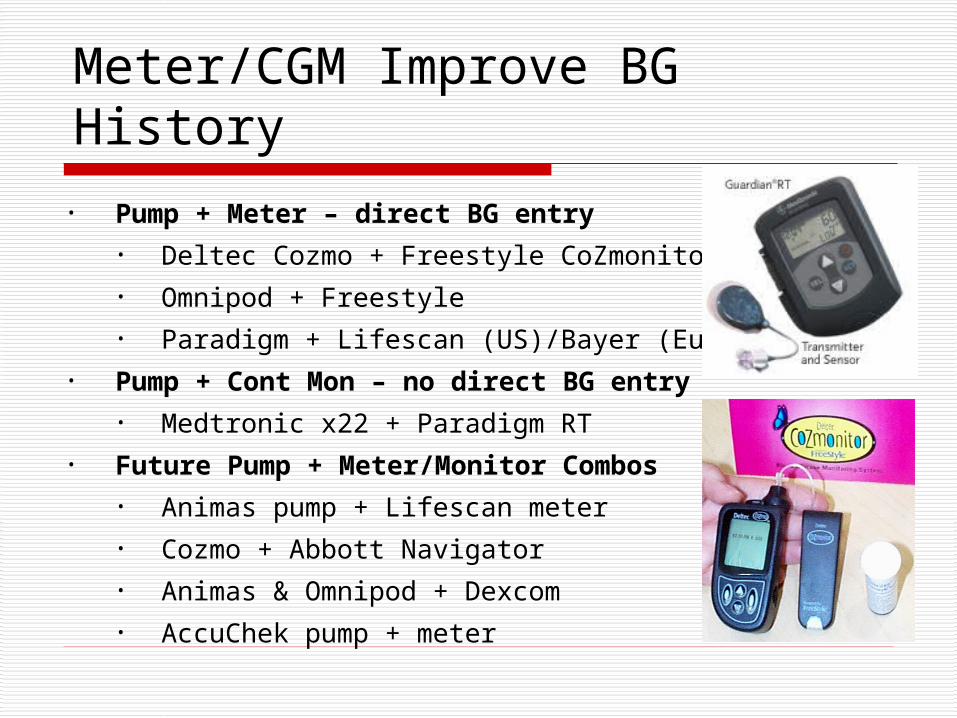
Meter/CGM Improve BG History
• Pump + Meter – direct BG entry• Deltec Cozmo + Freestyle CoZmonitor• Omnipod + Freestyle• Paradigm + Lifescan (US)/Bayer (Eur)
• Pump + Cont Mon – no direct BG entry• Medtronic x22 + Paradigm RT
• Future Pump + Meter/Monitor Combos• Animas pump + Lifescan meter• Cozmo + Abbott Navigator• Animas & Omnipod + Dexcom• AccuChek pump + meter

Disconnect Bolus
Disconnect up to 2 hrs forsports, sauna, sex, etc.
Useful for “Mini-vacations”
User estimates time off andpump gives up to 50% of missed basal as bolus
Alarm reminds user to re-connect
On reconnecting, pump shows missed basal and offers to supply the missing amount
Weekly Schedule
User’s profile changes automatically for specific days of the week
Allows different basal patterns and missed meal bolus alerts for each day of the week
No need to remember to change basal patterns or alerts
Great for college, shift work, weekends, exercise, or other regular variation in schedule
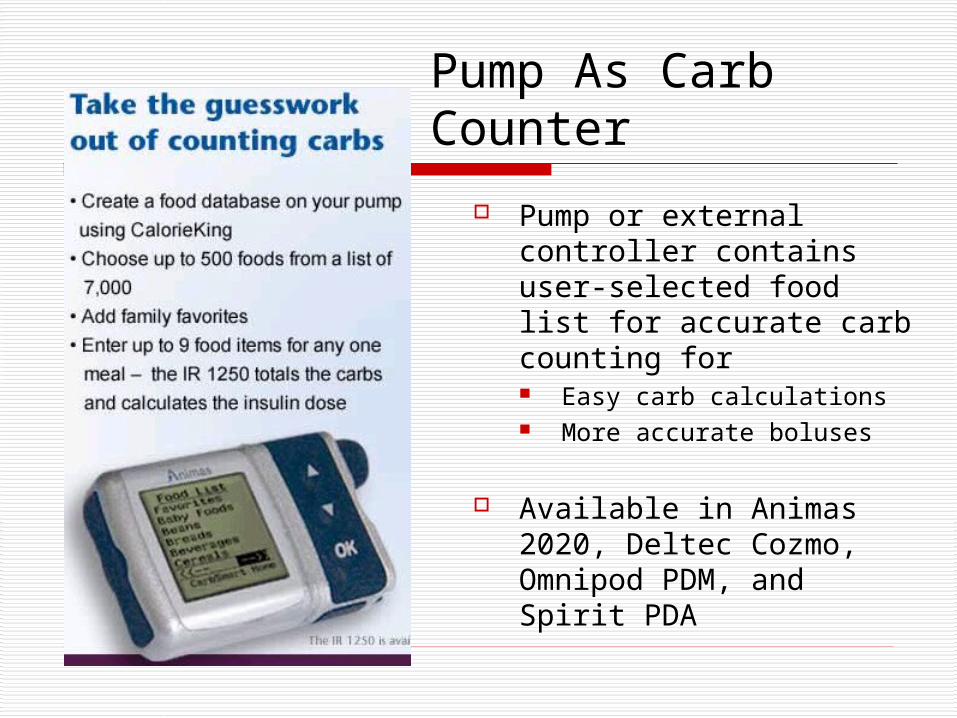
Pump As Carb Counter
Pump or external controller contains user-selected food list for accurate carb counting for Easy carb calculations More accurate boluses
Available in Animas 2020, Deltec Cozmo, Omnipod PDM, and Spirit PDA

Carb Bolus Varieties
Regular Taken immediately – for most meals
Extended / square wave Extended over time – gastroparesis
Combo / dual wave Some now, some later – bean burrito,
some pastas and pizzas, Symlin

Helpful Aids And Alerts
Carb or insulin recommendation for each BG
Bolus-not-completed alert
Missed meal bolus alert
Check after high or low BG
10 extra units for basal when reservoir reads zero
Easier analysis with TDD and basal/bolus balance
Overview of basal/bolus balance and correction bolus
Not available in all pumps

Getting The Big PictureTherapy Effectiveness – A summary
of glucose and insulin history

Therapy Effectiveness Scorecard
Screen 1: Average BG (over 2 to 30 days) BG tests per day BG standard deviation (SD)
Screen 2: Carbs per day TDD
% correction boluses % carb boluses % basal rates
Largely available in Paradigm pumps as well
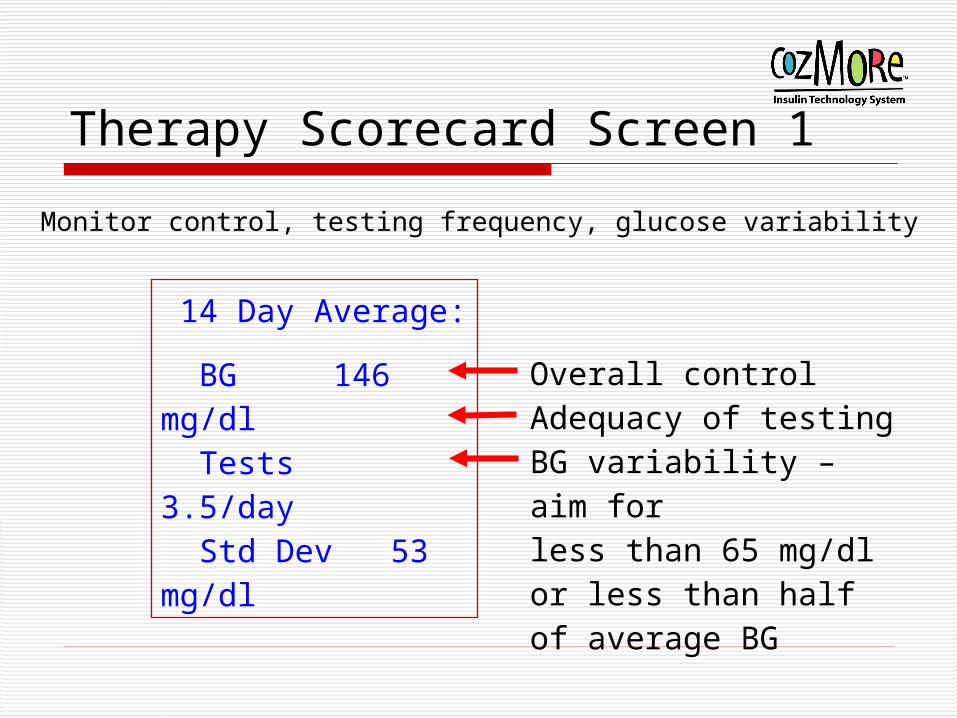
Therapy Scorecard Screen 1
14 Day Average:
BG 146 mg/dl Tests 3.5/day Std Dev 53 mg/dl
Overall controlAdequacy of testingBG variability – aim forless than 65 mg/dl or less than half of average BG
Monitor control, testing frequency, glucose variability

Therapy Scorecard Screen 2
14 Day Average:
Carbs 206 g TDD 48.58 u Meal 38.07% Corr 4.95% Basal 56.98%
Boluses taken? Low carb diet?Guides therapy – A1c, lows, etcCarb bolus %Correction less than 8% of TDD?Basal at least 40 to 45% of TDD?
Monitors carb intake, TDD, basal/carb bolus balance, correction bolus%

Check Correction Bolus %
If correction boluses make up more than 8% of the TDD (and lows are NOT a problem):
Move half of the excess units above 8% into basal rates or carb boluses
Raise the basal rates
Lower the carb factor
Or stop skipping carb boluses
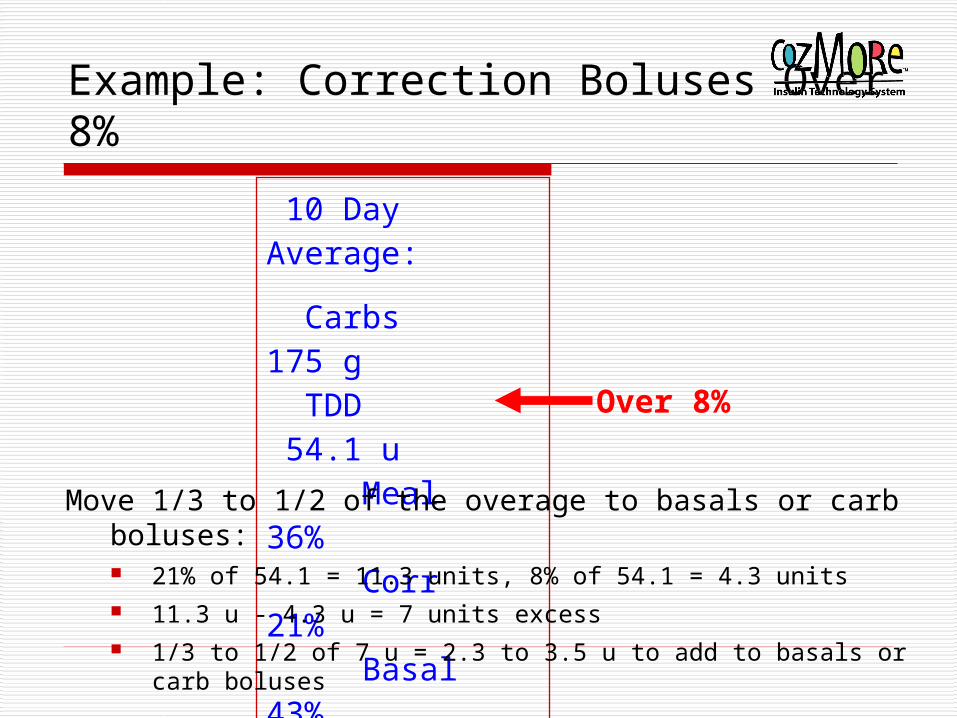
Example: Correction Boluses Over 8%
10 Day Average:
Carbs 175 g TDD 54.1 u Meal 36% Corr 21% Basal 43%
Move 1/3 to 1/2 of the overage to basals or carb boluses: 21% of 54.1 = 11.3 units, 8% of 54.1 = 4.3 units 11.3 u - 4.3 u = 7 units excess 1/3 to 1/2 of 7 u = 2.3 to 3.5 u to add to basals or carb boluses
Over 8%
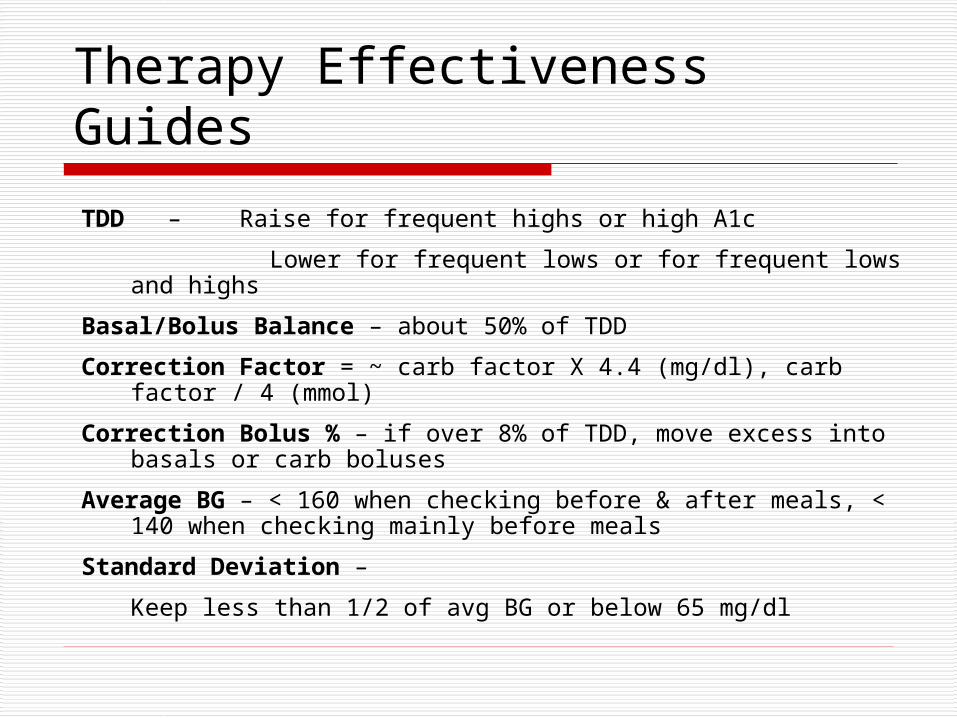
Therapy Effectiveness Guides
TDD – Raise for frequent highs or high A1c
Lower for frequent lows or for frequent lows and highs
Basal/Bolus Balance – about 50% of TDD
Correction Factor = ~ carb factor X 4.4 (mg/dl), carb factor / 4 (mmol)
Correction Bolus % – if over 8% of TDD, move excess into basals or carb boluses
Average BG – < 160 when checking before & after meals, < 140 when checking mainly before meals
Standard Deviation –
Keep less than 1/2 of avg BG or below 65 mg/dl

Pump Control Tips

High BGs? Keep The Usual Suspects In Mind
I ate too much
Bad infusion set or site
Inaccurate carb counts
Missed or late boluses
Bad insulin
Stress hormone rebound
Empty refrigerator syndrome
Stress, pain, steroid meds

Bad Infusion Set Or Site
If you have “unexplained” highs:
How often do they happen?
Do they correct only when you replace your infusion set?
If you answer yes:
• Always use tape to anchor the infusion line
• Consider changing to a different infusion set
The right infusion set and good site technique prevents headaches and improves your A1c
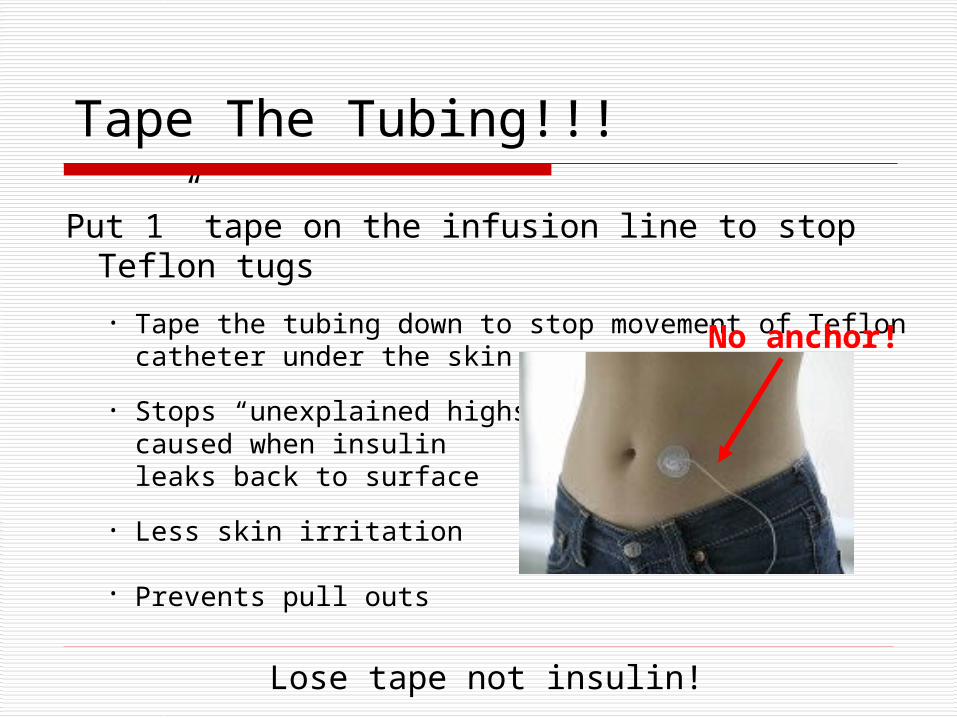
Tape The Tubing!!!
Put 1” tape on the infusion line to stop Teflon tugs
• Tape the tubing down to stop movement of Teflon catheter under the skin
• Stops “unexplained highs” caused when insulin leaks back to surface
• Less skin irritation
• Prevents pull outs
Lose tape not insulin!
No anchor!

Use Sterile Technique For Site Prep
30% of people are constant staph carriers and 25% are intermittent. MRSA is now common. Prevent infections:
• Wash hands
• Sterilize skin with IV Prep
• Place bio-occlusive IV3000 over site
• Insert infusion set through IV 3000
• Steps for staph carriers:
• Use antiseptic soap all over body once every 1-2 weeks
• Occasionally, apply bacitracin ointment to inside of nose
Pump Settings That Affect Control
Important Pump Settings
TDD – adjust when having frequent lows or highs
Basal % – basal/bolus balance, secure sleep Basal rate variation – large variation not physiologic
Carb factor – postmeal control Carb factor variation – may indicate basal problem
Correction factor – lower high BGs safely
DIA – bolus accuracy, HypoManager
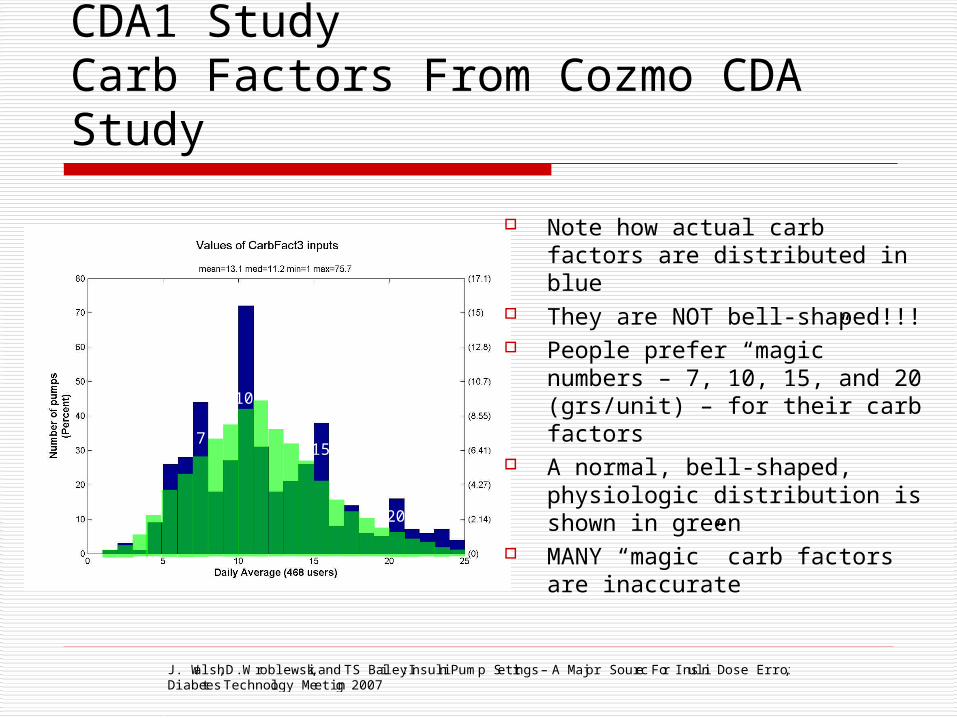
CDA1 StudyCarb Factors From Cozmo CDA Study
Note how actual carb factors are distributed in blue
They are NOT bell-shaped!!! People prefer “magic” numbers
– 7, 10, 15, and 20 (grs/unit) – for their carb factors
A normal, bell-shaped, physiologic distribution is shown in green
MANY “magic” carb factors are inaccurate
7
10
115
20
J. Walsh, D. Wroblewski, and TS Bailey: Insulin Pump Settings – A Major Source For Insulin Dose Errors, Diabetes Technology Meeting 2007

Carb Factors From CDA1 Sudy
Graph shows carb factor versus TDD for 200 pumps with better control (avg BG < 209 mg/dl)
Note a break in relationship (red line) near a TDD of 40 u/day or carb factor of 10
Suggests that people are hesitant to lower carb factors below 10
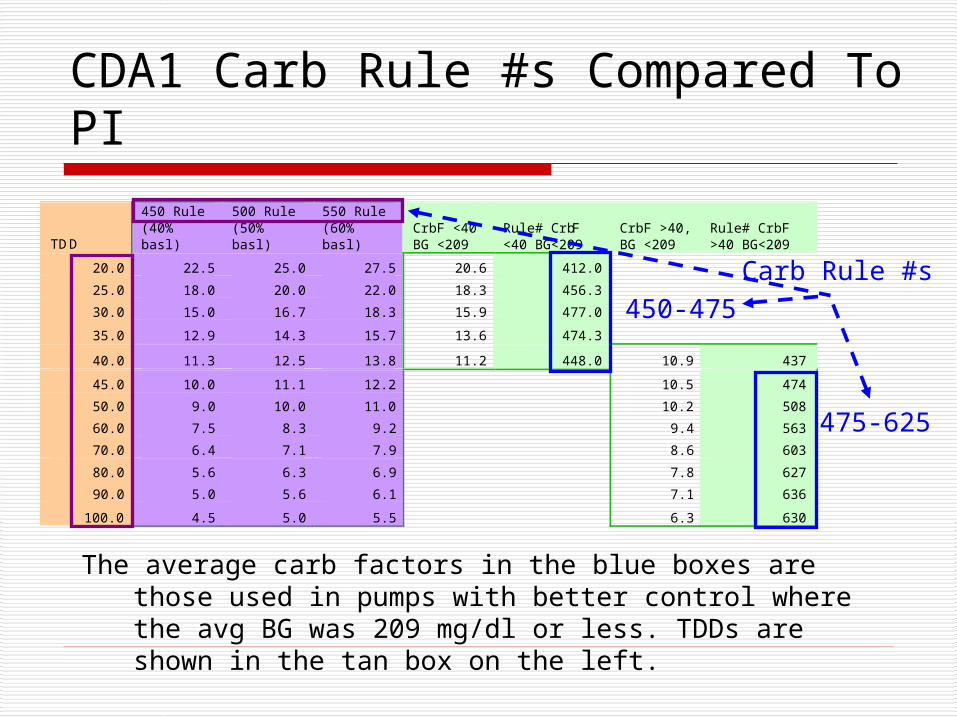
CDA1 Carb Rule #s Compared To PI
The average carb factors in the blue boxes are those used in pumps with better control where the avg BG was 209 mg/dl or less. TDDs are shown in the tan box on the left.
TDD
450 Rule (40% basl)
500 Rule (50% basl)
550 Rule (60% basl)
CrbF <40 BG <209
Rule# CrbF <40 BG<209
CrbF >40, BG <209
Rule# CrbF >40 BG<209
20.0 22.5 25.0 27.5 20.6 412.0
25.0 18.0 20.0 22.0 18.3 456.3
30.0 15.0 16.7 18.3 15.9 477.0
35.0 12.9 14.3 15.7 13.6 474.3
40.0 11.3 12.5 13.8 11.2 448.0 10.9 437
45.0 10.0 11.1 12.2 10.5 474
50.0 9.0 10.0 11.0 10.2 508
60.0 7.5 8.3 9.2 9.4 563
70.0 6.4 7.1 7.9 8.6 603
80.0 5.6 6.3 6.9 7.8 627
90.0 5.0 5.6 6.1 7.1 636
100.0 4.5 5.0 5.5 6.3 630
450-475
475-625
Carb Rule #s

CDA1 Basal/Bolus Balance
QuickTime™ and aTIFF (Uncompressed) decompressor
are needed to see this picture.
As TDD rises, basal percentage falls slightly from 51.7% at a TDD of 20 u to 49.4% at 40 u and 48.3% at 80 u
Basals vary widely – 27% to 83% of TDD
Many basal rates do not appear to be accurate
If correction bolus excess is distributed evenly into basals and carb boluses, “real” basal rates would average over 50% of TDD
J. Walsh, D. Wroblewski, and TS Bailey: Insulin Pump Settings – A Major Source For Insulin Dose Errors, Diabetes Technology Meeting 2007

Walsh-Roberts Rules For Optimum Readings
Starting TDD = (TDD X 0.9) + (wt [lbs]/4* X 0.9) ** 2
Keep Basal/Bolus Balance near 50/50
Basal test – rise/fall less than 30 mg/dl (1.7 mmol) over 8 hrs
500 Rule for Carb Factor
2000 Rule for Correction Factor (110 Rule for mmol)
Set DIA at 4 to 6 hrs
Keep correction boluses less than 8% of TDD
* or kg/1.8 ** If current TDD less than wt/4 with good control, TDD = current TDD X 0.90
J Walsh and R Roberts: Pumping Insulin, 2006

Delay Eating When BG Is High
Glucose exposure is reduced when high readings are allowed to fall before eating.
Remember:
Test early
Don’t forget to eat on time
Don’t forget you bolused
Duration Of Insulin Action (DIA)How long a bolus lowers your glucose
Bolus On Board (BOB)Bolus insulin still active from previous boluses
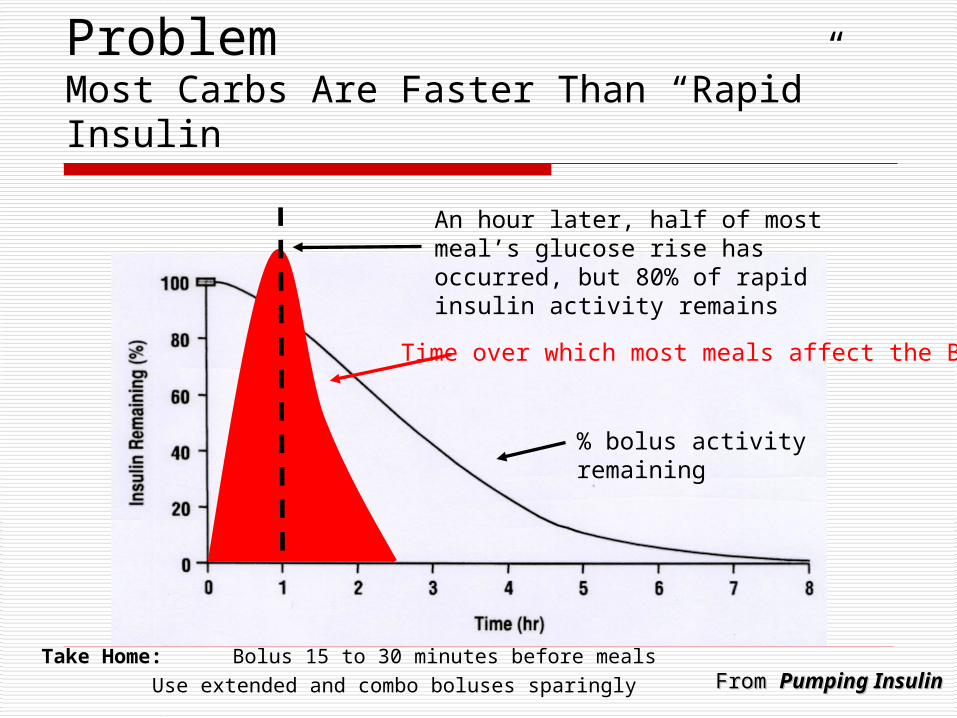
ProblemMost Carbs Are Faster Than “Rapid” Insulin
% bolus activity remaining
From From Pumping InsulinPumping InsulinTake Home: Bolus 15 to 30 minutes before meals
Use extended and combo boluses sparingly
Time over which most meals affect the BG
An hour later, half of most meal’s glucose rise has occurred, but 80% of rapid insulin activity remains

Typical Carb Digestion Times
Food Digestion Time
water 0 m
fruit/veg juice 5-20 m
fruit/veg salad 20-40 m
melons/oranges 30 m
apples/pears 40 m
broccoli/caulif 45 m
raw carots/beets 50 m
potatoes/yams 60 m
cornmeal/oats 90 m
Food Digestion Time
fish 30-60 m
milk/cot cheese 90 m
legumes/beans 120 m
egg 45 m
chicken 1.5-2 hr
seeds/nuts 2.5-3 hr
beef/lamb 3-4 hr
cheese 4-5 hr
Take Home: Choose combo foods to lengthen carb digestion time

Best Bolus Timing For Carbs
Figure shows rapid insulin injected 0, 30, or 60 min before a meal
Normal glucose and insulin profiles shown in the shaded areas
DO NOT bolus an hour ahead of your meals!!!
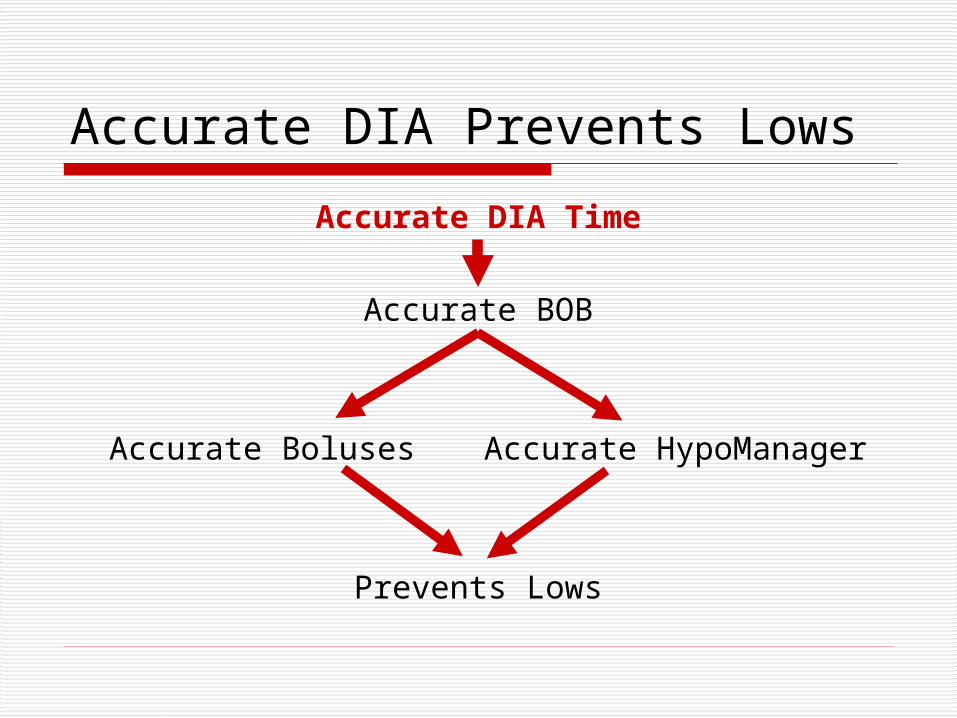
Accurate DIA Prevents Lows
Accurate DIA Time
Accurate BOB
Accurate Boluses Accurate HypoManager
Prevents Lows

A short DIA hides true BOB level and its glucose-lowering activity
Causes “unexplained” lows
Leads to incorrect adjustments in basal rates, carb factors, and correction factors
Or user starts to ignore “smart” pump’s advice
Set DIA based on real insulin action time.
Do not modify DIA time to fix a control problem.
Short DIAs Hide Bolus Insulin Activity

Duration Of Insulin Action (DIA)
4 hrs 6 hrs2 hrs0
Accurate boluses require an accurate DIA
Glu
cose
-lowe
ring
Activ
ity
DIA times shorter than 4 to 7 hrs will hide BOB and its glucose lowering activity

Large Doses, Longer Duration Large doses (0.3 u/kg or
30 u for 220 lb. person) of “rapid” insulin in 18 non-diabetic, obese people show significant activity beyond 4 hours.
Medium doses (0.2 u/kg or 10 u for 110 lb. person) show similar results.
Large doses may lengthen DIA
Apidra product handout, Rev. April 2004a

Dose Size May Affect Duration Of Action
For a 154 lb or 70 kg person:
0.05 u/kg = 3.5 u
0.1 u/kg = 7 u
0.2 u/kg = 14 u
0.3 u/kg = 21 u
Woodworth et al. Diabetes. 1993;42(Suppl. 1):54A

But Studies Routinely Underestimate DIA
To measure pharmacodynamics, glucose clamp studies are done in healthy individuals
SQ doses from 0.05 to 0.3 u/kg But injected insulin ALSO
SUPPRESSES normal basal release from the pancreas (grey area in figure)
Unmeasured basal suppression makes smaller boluses appear to have a shorter DIA
When basal suppression is accounted for, true DIA times become longer

Recommended DIA Times
A DIA of 4 to 6 hrs gives best estimate for residual bolus activity
A longer DIA is a safer DIA
4 hr Linear
4 hr Curvilinear
From Pumping Insulin, 4th ed., adapted fom Mudaliar et al: Diabetes Care, 22: 1501, 1999

DIA Time Selection
Current limited research suggests that DIA times are NOT different between children and adults
Immediate factors can change insulin action time:
Shorter with activity and exercise
Shorter in hot weather
Longer with fat in diet
Do not change DIA time for temporary factors

DIA Tips
If pump often suggests boluses that are too small, do not shorten the DIA– it is rarely NOT problem
Instead, ask what is causing the highs and where more insulin is needed – in basal rates, in carb boluses, or both
DO NOT shorten the DIA for occasional activity. Instead:
• lower boluses or basals ahead of time for planned activities
• or eat more carbs or lower basals for unplanned activities
Basal rates that are too low make the DIA appear SHORT!

How Different Pumps Handle DIA
Differences In DIA Calculations
DIA Type% Of DIA Measured
Default DIA
My Preferred
DIA
Time Increment
For DIA
Animas 2020
Curvilinear 100% 4 hrs 4.5 to 6 hrs 30 min
Deltec Cozmo
Linear 100% 3 hrs 4 to 5.25 hrs 15 min
Insulet Omnipod
Linear 100% 4 hrs 4 to 5.5 hrs 30 min
Paradigm 522/722
Curvilinear 95% 6 hrs 5 to 6 hrs 60 min

Bolus On Board (BOB)Glucose-lowering activity that remains from recent boluses
An accurate BOB
• Prevents insulin stacking
• Improves bolus accuracy
• Reveals current carb or insulin deficit
Basal insulin is NOT measured by BOB!
aka: insulin on board, active insulin, unused insulin** Introduced as Unused Insulin in 1st ed of Pumping Insulin (1989)

BOB Prevents Insulin Stacking
Bedtime BG = 173Is there an insulin or a carb deficit?
6 pm 8 pm 10 pm 12 am
DinnerDinner
DessertDessertCorrectionCorrection Bedtime BG
= 173 mg/dl

BOB Is Present In 65% Of Boluses
CDA1 Study ResultsOf 201,538 boluses, 64.8% were
given within 4.5 hrs of a previous bolus
An accurate DIA shows that BOB is present for MOST boluses
Take Home: insulin stacking is a common threat
4.5 hrs
J. Walsh, D. Wroblewski, and TS Bailey: Disparate Bolus Recommendations In Insulin Pump Therapy. AACE Meeting 2007

Blind Boluses Hide BOB
89.8
57.7
32.5
14.2
0
10
20
30
40
50
60
70
80
90
100
With BG orcarb
With carb With BG With BG andcarb
% of Boluses with BG or Carb Inputs In 2005, only 28,969 of
117,711 carb boluses given by 541 pumps across the US were accompanied by a BG value.
6 of 7 carb boluses are blind – given with no BG
With no BG, BOB cannot be accounted for by the pump in most carb boluses
85.8
% b
lind
bolu
ses
J. Walsh, D. Wroblewski, and TS Bailey: Disparate Bolus Recommendations In Insulin Pump Therapy. AACE Meeting 2007

Before giving a bolus, check your BOB (via BG).Do not give blind boluses.

BOB Is BOB
If BOB is present, it doesn’t matter how it got there.
Safety requires that BOB be subtracted from BOTH carb and correction boluses to avoid hypoglycemia.
BOB is measured only when a BG is entered into pump!

How Different Pumps Handle BOB
What’s In BOB And What Is It Applied Against?
BOB Includes This Type Of Bolus
BOB Is Subtracted From This Type Of Bolus
Carb Correction Carb Correction
Animas 2020 Yes Yes No* Yes
Deltec Cozmo Yes Yes Yes Yes
Insulet Omnipod No Yes No Yes
Medtronic Paradigm Yes Yes No Yes
* Except when BG is below target BG

Different Pump Bolus Recommendations
BOB = 3.0 u and 30 gr. of carb will be
eaten at these
glucose levels
Carb factor = 1u / 10 gr
Corr. Factor = 1 u / 40 mg/dl over 100
Target BG = 100
TDD = ~50 u
0
1
2
3
4
60 90 120 150 180 210 240
Deltec Cozmo Animas 1250 Medtronic 522
units
mg/dl
Omnipod cannot be determined here - it counts only correction bolus insulin as BOB
Bolus recommended by each pump when:

Recommended Bolus Errors Can Be Corrected
3.0U 30 gr 160 3U 1.5U 4.5U
A Paradigm user can scroll down 3 times to see active insulin, then adjust dose:
3 + 1.5- - 4.5 - = 0 u bolus
30

HypoManagerShows current insulin OR carb deficit

HypoManager
Compares BOB to correction bolus need: When BOB is smaller –> all pumps recommend a
correction bolus When BOB is larger –> Cozmo recommends eating
carbs
A very helpful feature:
• Shows current carb OR insulin deficit
• Reduces overeating when BG is low
• Warns when carbs may be needed later even though current BG is OK or high.

HypoManager
Helps TREAT lows Encourage users to test when low The BG reading triggers what should be an
accurate recommendation for carb intake to treat that low
Prevents ETRS – “Empty The Refrigerator Syndrome”
Don’t use with Symlin, ?gastroparesis

Continuous Monitors

CGM Benefits
Increased sense of security
Immediate feedback – look and learn
Control with safety
Worth out of pocket cost for many
Reimbursement gradually catching on

Continuous Monitor
A continuous monitor (OR frequent meter checks) can assist optimum energy flow
Optimum BG range for energy flow

Plus Insulin Pump
With full BG record, basals and boluses can be adjusted to provide optimum fuel flow
Optimum BG range

Continuous Monitoring
Benefits• Lots more info• Alarms to
prevent lows & highs
• Security in knowing where the BG is and where it is going
• Trends shown by graph, arrows, or predictors
Limitations• Accuracy• Data gaps• Insurance coverage• Occ cell phone and
other interference

Continuous Monitor Tips

CGM: Look And Learn
Excess night basal or bedtime bolus
Breakfast bolus too small or too late
Lunch bolus too small or afternoon basal too low

No Two Points Are Created Equal!
20
30
40
50
60
70
80
90
100
0 50 100 150 200Minutes
Glucose (mg/dl)
Lower Risk Going Up
Higher Risk Going Down
Level of a BG’s risk depends on its trend

Turnaround Time A Glucose in Motion Stays in Motion

Don’t Stack Insulin

Stay Between The Lines
As readings improve, bring the upper glucose target alert line down

Continuous Monitoring Tips
Be patient, have realistic expectations
Don’t panic when meter and sensor differ
Expect some lag time
Don’t react too quickly and stack your insulin
Look at trends, not just individual values
Rapid rises usually mean more insulin is needed
Validate your readings with a meter

Comparison Of Two Continuous Monitors
The Dexcom STS 3 Day & Paradigm RT continuous monitors were worn at the same time by one person with Type 1 diabetes. With low alert at 80 mg/dl and high alert at 160 mg/dl, 262 readings from Ultra meter performed over 33 days. Ultra tests done:
• As soon as either monitor’s low or high alert sounded
• When values between the monitors disagreed
• And at routine intervals, including calibrations
Screens show same 3 hr time period (0 to 400 mg/dl), Ultra reading was 73 mg/dl.

GlycensitTM Analysis
Simultaneous comparison vs 262 Ultra readings over 33 days1. Blue dotted lines = ISO meter standard2. Yellow area = 95% of all data points3. Red lines = min and max deviation by star points
Ideally, all readings would fall between the blue dotted lines
A B
http://tomcatbackup.esat.kuleuven.be/GLYCENSIT/

Which Monitor Alerted First?
This table shows which monitor alerted at least 5 min earlier for true lows and highs.
Monitor A was first to alert for readings below 80 mg/dl 76% of the time, B was first 3% of the time, with 21% as ties.
Monitor A was first to arlert for readings above 160 mg/dl 68% of the time, B was first 5% of the time, with 27% as ties.
Monitor A Monitor B Ties
For BGs less than 80 28 1 8
For BGs over 160 25 2 10
Which Monitor Alerted First?

More On Monitor Accuracy
1 R L Weinstein et al: Diabetes Care, 30, 1125-1130, 2007
Navigator 5 day (shown in graph)1
Median ARD = 9.3% Clark error grid
A: 81.7% B: 16.7% C and D: 1.7%
Dexcom 7-day (not shown): Median ARD = 17% Clark error grid
A: 70% B: 28% C and D: 3%

Your Questions Answered
Available at www.diabetesnet.com or 800-988-4772