Embed Size (px)
DESCRIPTION
Annual Report for fiscal 2011 from CSI.
Citation preview

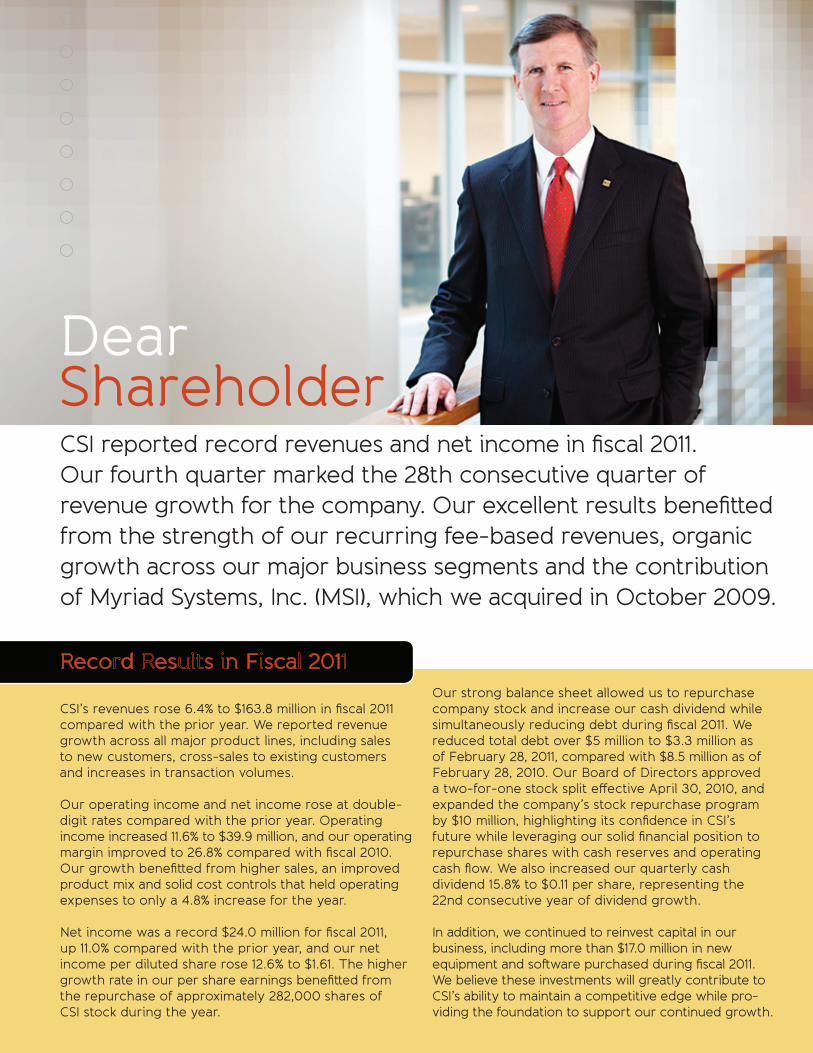
Dear ShareholderCSI reported record revenues and net income in fiscal 2011. Our fourth quarter marked the 28th consecutive quarter of revenue growth for the company. Our excellent results benefitted from the strength of our recurring fee-based revenues, organic growth across our major business segments and the contribution of Myriad Systems, Inc. (MSI), which we acquired in October 2009.
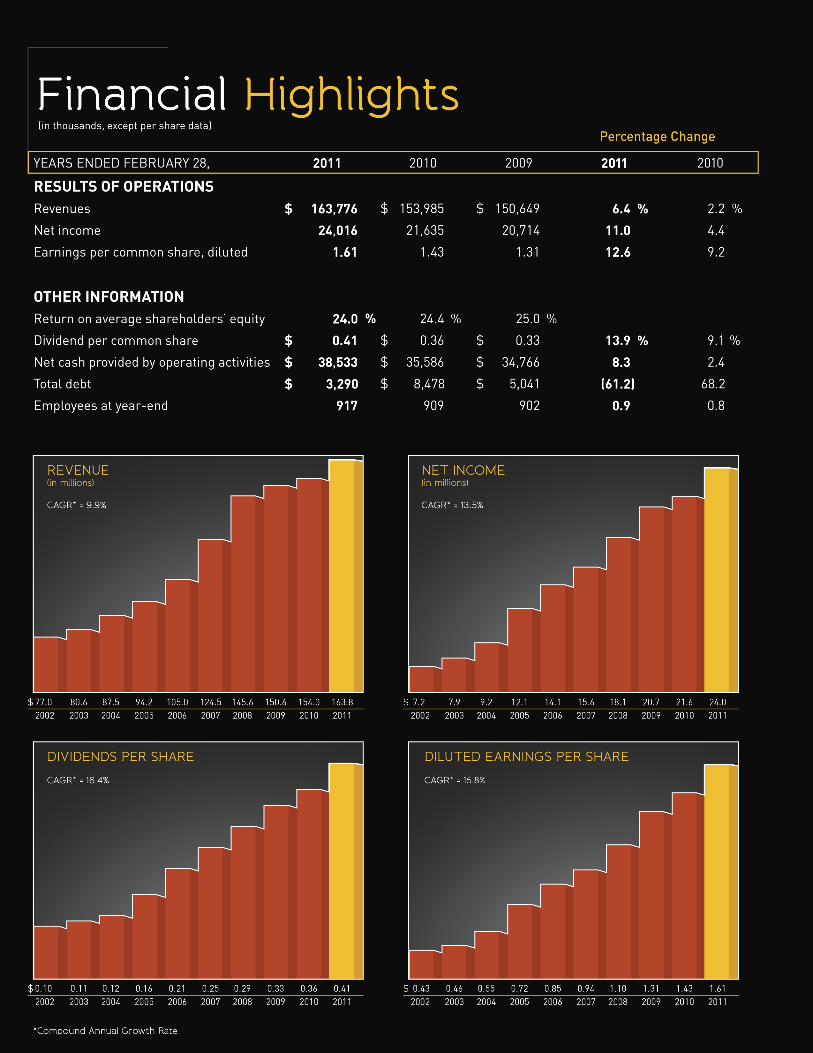
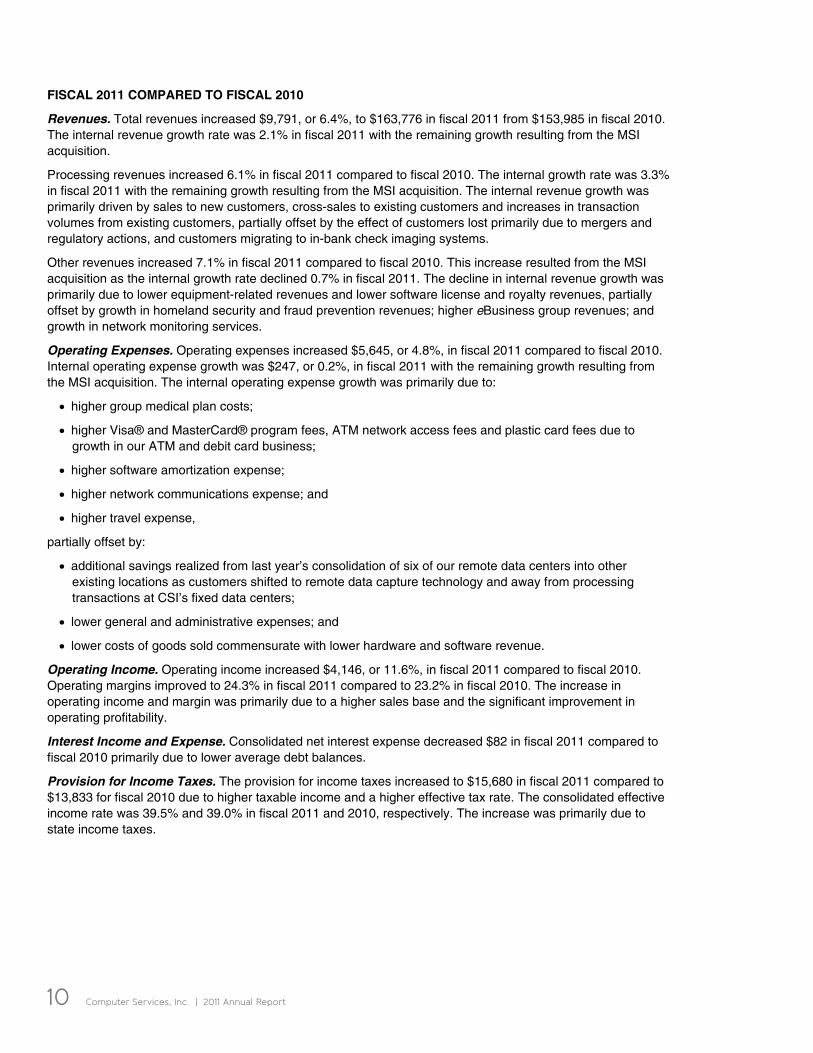
CSI’s revenues rose 6.4% to $163.8 million in fiscal 2011 compared with the prior year. We reported revenue growth across all major product lines, including sales to new customers, cross-sales to existing customers and increases in transaction volumes.
Our operating income and net income rose at double-digit rates compared with the prior year. Operating income increased 11.6% to $39.9 million, and our operating margin improved to 26.8% compared with fiscal 2010. Our growth benefitted from higher sales, an improved product mix and solid cost controls that held operating expenses to only a 4.8% increase for the year.
Net income was a record $24.0 million for fiscal 2011, up 11.0% compared with the prior year, and our net income per diluted share rose 12.6% to $1.61. The higher growth rate in our per share earnings benefitted from the repurchase of approximately 282,000 shares of CSI stock during the year.
Our strong balance sheet allowed us to repurchase company stock and increase our cash dividend while simultaneously reducing debt during fiscal 2011. We reduced total debt over $5 million to $3.3 million as of February 28, 2011, compared with $8.5 million as of February 28, 2010. Our Board of Directors approved a two-for-one stock split effective April 30, 2010, and expanded the company’s stock repurchase program by $10 million, highlighting its confidence in CSI’s future while leveraging our solid financial position to repurchase shares with cash reserves and operating cash flow. We also increased our quarterly cash dividend 15.8% to $0.11 per share, representing the 22nd consecutive year of dividend growth.
In addition, we continued to reinvest capital in our business, including more than $17.0 million in new equipment and software purchased during fiscal 2011. We believe these investments will greatly contribute to CSI’s ability to maintain a competitive edge while pro-viding the foundation to support our continued growth.
Reco d es s n F sca 201

A Forward Th nk ng P an for the FutureWe took significant steps to update our strategic plans in fiscal 2011. Our focus is on leveraging enterprise-wide opportunities to cross-sell products, to integrate the technologies we have developed and acquired and to grow CSI through selective acquisitions. We believe our new Strategic Growth Initiative provides the roadmap for CSI to accelerate growth momentum going forward.
Stan Eckenberg, President and COO, David Simon, Treasurer and CFO and Steve Powless, CEO.
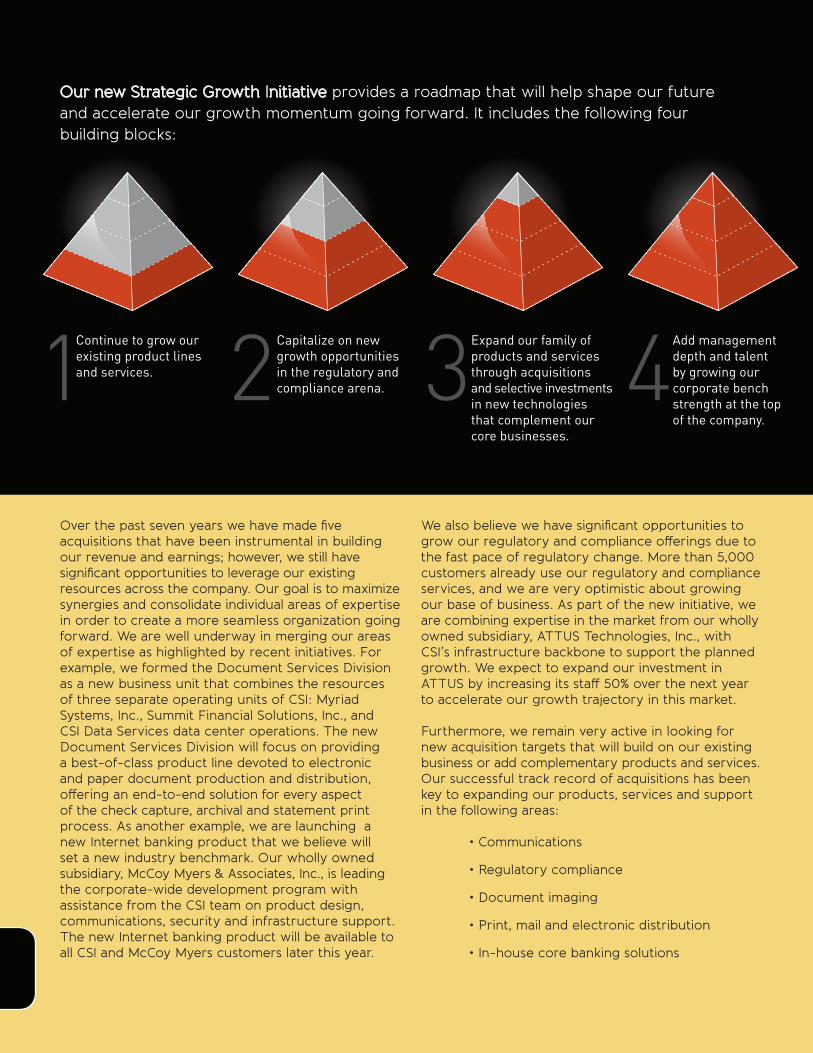
Our new Strategic Growth nitiative provides a roadmap that will help shape our future and accelerate our growth momentum going forward. It includes the following four building blocks:
Over the past seven years we have made five acquisitions that have been instrumental in building our revenue and earnings; however, we still have significant opportunities to leverage our existing resources across the company. Our goal is to maximize synergies and consolidate individual areas of expertise in order to create a more seamless organization going forward. We are well underway in merging our areas of expertise as highlighted by recent initiatives. For example, we formed the Document Services Division as a new business unit that combines the resources of three separate operating units of CSI: Myriad Systems, Inc., Summit Financial Solutions, Inc., and CSI Data Services data center operations. The new Document Services Division will focus on providing a best-of-class product line devoted to electronic and paper document production and distribution, offering an end-to-end solution for every aspect of the check capture, archival and statement print process. As another example, we are launching a new Internet banking product that we believe will set a new industry benchmark. Our wholly owned subsidiary, McCoy Myers & Associates, Inc., is leading the corporate-wide development program with assistance from the CSI team on product design, communications, security and infrastructure support. The new Internet banking product will be available to all CSI and McCoy Myers customers later this year.
We also believe we have significant opportunities to grow our regulatory and compliance offerings due to the fast pace of regulatory change. More than 5,000 customers already use our regulatory and compliance services, and we are very optimistic about growing our base of business. As part of the new initiative, we are combining expertise in the market from our wholly owned subsidiary, ATTUS Technologies, Inc., with CSI’s infrastructure backbone to support the planned growth. We expect to expand our investment in ATTUS by increasing its staff 50% over the next year to accelerate our growth trajectory in this market.
Furthermore, we remain very active in looking for new acquisition targets that will build on our existing business or add complementary products and services. Our successful track record of acquisitions has been key to expanding our products, services and support in the following areas:
•Communications
•Regulatorycompliance
•Documentimaging
•Print,mailandelectronicdistribution
•In-housecorebankingsolutions
Continue to grow our existing product lines and services.
Capitalize on new growth opportunities in the regulatory and compliance arena.
Add management depth and talent by growing our corporate bench strength at the top of the company.
Expand our family of products and services through acquisitions and selective investments in new technologies that complement our core businesses.
1 2 3 4
Along those lines, we are making selective investments in companies and technologies that provide similar opportunities for CSI. For instance, we recently made a minority investment in a start-up software company that is a leading-edge developer of mobile banking services. We believe this company holds excellent promise for future sales and collaboration with CSI.
We expect that our growth opportunities will be enhanced by a solid management team that is backed by talented managers across the company. After the close of our fiscal year, Stan Eckenberg was named President and Chief Operating Officer of CSI. Stan is a 19-year veteran of CSI and most recently served as CSI’s Executive Vice President. His promotion is part of our reorganization of business units and management team to focus on enhancing internal synergies and leveraging our services across the company. CSI’s operating units, including the new Document Services Division, will report to Stan.
I will continue to be responsible for managing CSI’s senior management team and for developing and executing CSI’s growth strategy, including our acquisition program and technology investments. We also recently hired a Corporate Development Officer and will soon add a Chief Marketing Officer to further build our senior management team. In addition to Stan and these two new positions, CSI’s Chief Financial Officer, and ATTUS’ CEO will also report to me.
As part of our Strategic Growth Initiative plans, we also identified key managers across the enterprise who comprise the first class of our management university. The new program is designed to teach these individuals the management skills needed to perform at a higher level and to expose them to products, services and veteran managers across the company.
We remain very positive about our outlook for the future. We believe the combination of an improving economy and our new strategic initiatives will provide enhanced long-term growth opportunities for CSI.We also believe our improved results during one of the worst economic periods in history highlight the essential nature of our products and services for our customers. Our record of performance is a true testament to the contributions our loyal and dedicated employees have made in building long-term shareholder value.
In closing, let me state that we remain very positive about our outlook for the future. We greatly value your investment in CSI and look forward to reporting on our continued progress in the coming year.
Steven A. PowlessChief Executive Officer
O oo o sca 20 2

2211%
Consecutive yearsof dividend growth.
Growth in net income for fiscal 2011.
7 Management’s Discussion and Analysis 18 Selected Financial Data 20 Management’s Statement of Responsibility 21 Independent Auditor’s Report 22 Consolidated Statements of Income 23 Consolidated Balance Sheets 24 Consolidated Statements of Changes in Equity 25 Consolidated Statements of Cash Flows 26 Notes to Consolidated Financial Statements 37 Quarterly Financial Information38 Investor InformationInside Back Cover Directors and Officers
Table of Contents
Computer Services, Inc. | 2011 Annual Report 7
Management’s Discussion & Analysisof Financial Condition & Results of Operations
(in thousands, except share and per share data)
The following discussion and analysis provides information that management believes is relevant to an understanding of the Company’s results of operations and financial condition. The discussion should be read in conjunction with the consolidated financial statements and notes thereto included elsewhere in this annual report.
OVERVIEW
Our Business. We provide service and information technology solutions to meet the business needs of financial institutions, predominantly, in both a service bureau and in-house environment. Our customer mix includes community banks, regional banks and multi-bank holding companies, and a variety of other business enterprises, each with a unique set of information, technology and service requirements.
We derive our revenues from processing services, maintenance, and support fees; software licensing and installation fees; eBusiness services; and equipment and supply sales. In addition to core processing, our integrated banking solutions include check imaging; cash management; branch and merchant capture; Internet banking; print and mail, and online document delivery services; corporate intranets; secure web hosting; e-messaging; teller and platform services; ATM and debit card service and support; risk assessment; network management; and compliance software and services for regulatory compliance, homeland security and fraud prevention.
Market Conditions. Market conditions and volatility over the past two years have created a difficult operating environment for financial institutions and other businesses in the United States and internationally. As a result, financial institutions have exercised caution in their information technology spending. Despite this challenging environment, our fiscal 2011 revenue, diluted net income per share and net cash provided by operating activities increased 6.4%, 12.6% and 8.3%, respectively, over the same period last year. We believe these results demonstrate the resilience of our recurring revenue model and the largely non-discretionary nature of our products and services. We believe that financial institutions are increasingly focused on technology solutions that can help them win and retain customers, generate incremental revenue and enhance their operating efficiency.
During the past two years, a number of financial institutions have failed or been subject to government intervention. To date, such actions have not significantly impacted our revenue or results of operations. In each of the past two years, approximately 1% of all financial institutions in the United States have been subject to regulatory action. We believe that the number of regulatory actions likely peaked in calendar 2010 and will begin to decline in calendar 2011, absent a significant downturn in the economy. The increase in bank failures and forced consolidations has been, to some extent, offset by a general decline in the level of acquisition activity among financial institutions. A consolidation can benefit us when a newly combined institution is processed on, or elects to move to, one of our platforms, and can negatively impact us when a newly combined institution uses a competing platform. Consolidations and acquisitions also impact our financial results due to early contract termination fees that are generally provided for in our multi-year data processing agreements. These fees are primarily generated when an existing customer is acquired by another financial institution and can vary from period-to-period based on the number and size of customers that are acquired and how early in the contract term the contract is terminated. We generally do not receive contract termination fees when a financial institution is subject to a government intervention.
In addition, new legislation, such as the Dodd-Frank Wall Street Reform and Consumer Protection Act, will result in numerous new regulations impacting the financial industry. We cannot predict the impact of this recent complex legislation on our customers and on us.
8 Computer Services, Inc. | 2011 Annual Report
Acquisitions. Our business strategy includes the acquisition of complementary businesses financed by a combination of internally generated funds, debt and common stock. Our consolidated financial statements and results of operations reflect acquired business after the completion of the acquisition and are not restated. We account for acquired businesses using the purchase method of accounting which requires that the assets acquired and liabilities assumed be recorded at the date of acquisition at their respective fair values. Any excess of the purchase price over the estimated fair values of the net assets acquired is recorded as goodwill.
On March 31, 2005, we acquired a 49% equity interest in CSI Telecom Group, Inc., formerly Heartland Communications Internet Services, Inc. (“CSI Telecom Group”), for $3,500 in cash, along with the option to purchase the remaining 51% of CSI Telecom Group during a three-year period beginning 24 months after the original transaction date under a pre-determined formula. CSI Telecom Group is a provider of Internet services, including fiber optic backbone for high bandwidth data, voice and video; telephone services including VoIP (voice over Internet protocol); and has CLEC (competitive local exchange carrier) status through its subsidiary, Aero Communications, LLC. Through July 31, 2006, we accounted for the investment under the equity method of accounting. On August 1, 2006, we increased our ownership interest in CSI Telecom Group to 67% for approximately $1,320 in cash, which required the entity to be consolidated. On March 31, 2008, we acquired additional ownership in CSI Telecom Group for approximately $189, bringing our ownership interest to 72%. As of June 1, 2008, we completed the acquisition of the remaining minority interest in CSI Telecom Group for approximately $11. The allocation of the purchase price included $570 recorded as an intangible related to the CLEC license and goodwill of $3,618. The goodwill recognized is not deductible for income tax purposes.
On January 16, 2007, we acquired 100% of the outstanding stock of Summit Financial Solutions, Inc. (“Summit”), a Jefferson City, Missouri based provider of payments processing applications, including remote check image capture, remote deposit, cash letter manager, branch capture, merchant capture, document storage and securities modules for $14,000 in cash and stock with an earn-out provision over a three-year period not to exceed $6,000 in the aggregate. The allocation of the purchase price included approximately $1,108 in intangibles, primarily customer relationships, and goodwill of $11,052. For the fiscal year ended February 28, 2009, we paid out the annual maximum $2,000 in earn-out consideration to former Summit shareholders under the terms of the Purchase Agreement, which was recognized as an increase to goodwill. Summit did not meet the requirements of the earn-out provision for the fiscal year ended February 28, 2009. As such, we did not pay additional consideration during the fiscal year ended February 28, 2010. For the fiscal year ended February 28, 2010, Summit met the requirements of the annual maximum earn-out provision and, as a result, we paid out $2,000 in the aggregate during the fiscal year ending February 28, 2011, which was recorded as an increase in goodwill. The goodwill recognized is not deductible for income tax purposes.
On October 1, 2009, we acquired 100% of the outstanding stock of Myriad Systems, Inc. (“MSI”), a privately held company based in Oklahoma City, Oklahoma for $11,224 in cash and stock with an earn-out provision over a two-year period not to exceed $4,000 in the aggregate. MSI is a leading provider of print and mail, online document delivery, and item processing solutions for financial institutions across the United States. The allocation of the purchase price included approximately $865 in intangibles, primarily customer relationships and patents, and goodwill of $10,729. The goodwill recognized is deductible for income tax purposes. The contingent consideration arrangement requires CSI to pay the former owners of MSI an earn-out based on the earnings before interest, taxes, depreciation and amortization (“EBITDA”) of MSI as defined in the Purchase Agreement during the first two consecutive 12-month periods subsequent to the acquisition date, up to a maximum amount of $4,000 (undiscounted). We made the first payment of $2,000, consisting of $1,913 in cash and $87 in common shares of CSI, during the fiscal year ended February 28, 2011 as MSI met the requirements for the maximum earn-out for the first 12-month period.
Stock Split. On April 30, 2010, the Company issued a two-for-one stock split in the form of a 100% stock dividend. All reporting periods have been adjusted for the stock split.
Computer Services, Inc. | 2011 Annual Report 9
REVENUESONS
G
NE INCOME( ONS)
CAG 1 2%
*Compound Annual Growth Rate
2007 20072008 20082009 20092010 20102011 2011
Processing Other
$99.1
$25.4
$15.6
$18.1
$20.7$21.6
$24.0
$40.2
$105.4
$41.5
$109.1
$43.9
$110.1
$47.1
$116.7
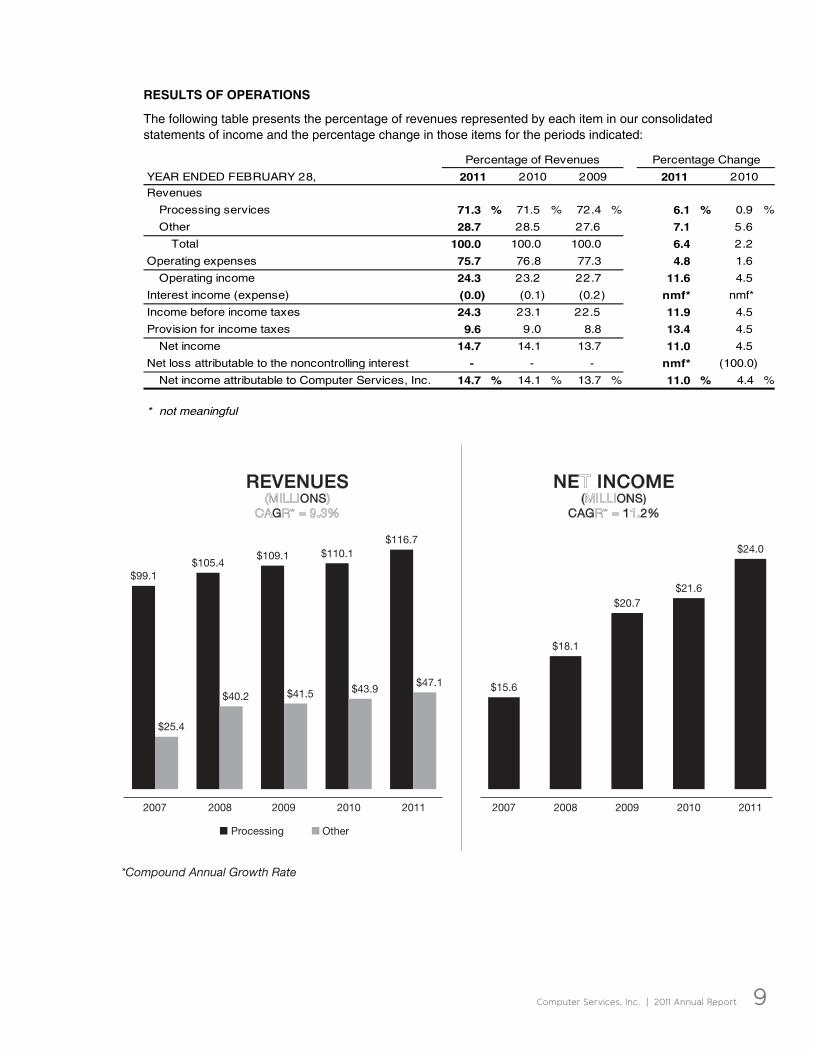
RESULTS OF OPERATIONS
The following table presents the percentage of revenues represented by each item in our consolidated statements of income and the percentage change in those items for the periods indicated:
YEAR ENDED FEBRUARY 28,
Revenues
Processing services 71.3 % 71.5 % 72.4 % 6.1 % 0.9 %
Other 28.7 28.5 27.6 7.1 5.6
Total 100.0 100.0 100.0 6.4 2.2
Operating expenses 75.7 76.8 77.3 4.8 1.6
Operating income 24.3 23.2 22.7 11.6 4.5
Interest income (expense) (0.0) (0.1) (0.2) nmf* nmf*
Income before income taxes 24.3 23.1 22.5 11.9 4.5
Provision for income taxes 9.6 9.0 8.8 13.4 4.5
Net income 14.7 14.1 13.7 11.0 4.5
Net loss attributable to the noncontrolling interest - - - nmf* (100.0)
Net income attributable to Computer Services, Inc. 14.7 % 14.1 % 13.7 % 11.0 % 4.4 %
* not meaningful
2011
Percentage of Revenues
2010
Percentage Change
2010 2009 2011
10 Computer Services, Inc. | 2011 Annual Report
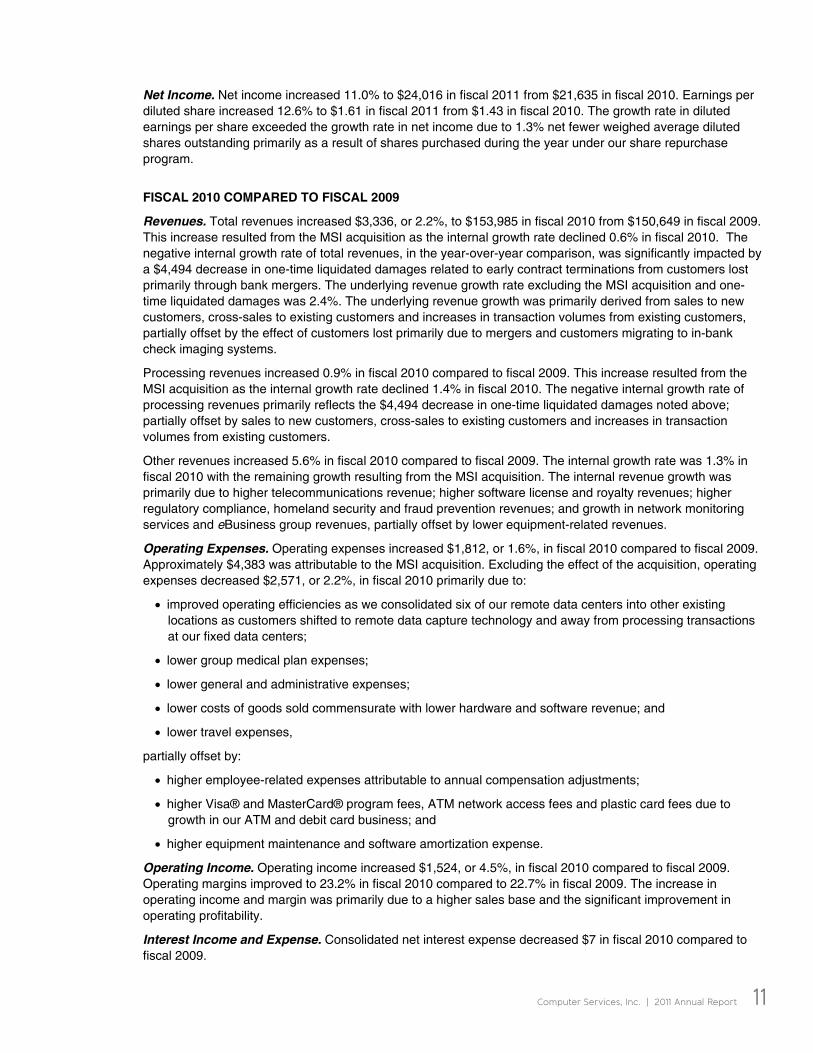
FISCAL 2011 COMPARED TO FISCAL 2010
Revenues. Total revenues increased $9,791, or 6.4%, to $163,776 in fiscal 2011 from $153,985 in fiscal 2010. The internal revenue growth rate was 2.1% in fiscal 2011 with the remaining growth resulting from the MSI acquisition.
Processing revenues increased 6.1% in fiscal 2011 compared to fiscal 2010. The internal growth rate was 3.3% in fiscal 2011 with the remaining growth resulting from the MSI acquisition. The internal revenue growth was primarily driven by sales to new customers, cross-sales to existing customers and increases in transaction volumes from existing customers, partially offset by the effect of customers lost primarily due to mergers and regulatory actions, and customers migrating to in-bank check imaging systems.
Other revenues increased 7.1% in fiscal 2011 compared to fiscal 2010. This increase resulted from the MSI acquisition as the internal growth rate declined 0.7% in fiscal 2011. The decline in internal revenue growth was primarily due to lower equipment-related revenues and lower software license and royalty revenues, partially offset by growth in homeland security and fraud prevention revenues; higher eBusiness group revenues; and growth in network monitoring services.
Operating Expenses. Operating expenses increased $5,645, or 4.8%, in fiscal 2011 compared to fiscal 2010. Internal operating expense growth was $247, or 0.2%, in fiscal 2011 with the remaining growth resulting from the MSI acquisition. The internal operating expense growth was primarily due to:
higher group medical plan costs;
higher Visa® and MasterCard® program fees, ATM network access fees and plastic card fees due to growth in our ATM and debit card business;
higher software amortization expense;
higher network communications expense; and
higher travel expense,
partially offset by:
additional savings realized from last year’s consolidation of six of our remote data centers into other existing locations as customers shifted to remote data capture technology and away from processing transactions at CSI’s fixed data centers;
lower general and administrative expenses; and
lower costs of goods sold commensurate with lower hardware and software revenue.
Operating Income. Operating income increased $4,146, or 11.6%, in fiscal 2011 compared to fiscal 2010. Operating margins improved to 24.3% in fiscal 2011 compared to 23.2% in fiscal 2010. The increase in operating income and margin was primarily due to a higher sales base and the significant improvement in operating profitability.
Interest Income and Expense. Consolidated net interest expense decreased $82 in fiscal 2011 compared to fiscal 2010 primarily due to lower average debt balances.
Provision for Income Taxes. The provision for income taxes increased to $15,680 in fiscal 2011 compared to $13,833 for fiscal 2010 due to higher taxable income and a higher effective tax rate. The consolidated effective income rate was 39.5% and 39.0% in fiscal 2011 and 2010, respectively. The increase was primarily due to state income taxes.
Computer Services, Inc. | 2011 Annual Report 11
Net Income. Net income increased 11.0% to $24,016 in fiscal 2011 from $21,635 in fiscal 2010. Earnings per diluted share increased 12.6% to $1.61 in fiscal 2011 from $1.43 in fiscal 2010. The growth rate in diluted earnings per share exceeded the growth rate in net income due to 1.3% net fewer weighed average diluted shares outstanding primarily as a result of shares purchased during the year under our share repurchase program.
FISCAL 2010 COMPARED TO FISCAL 2009
Revenues. Total revenues increased $3,336, or 2.2%, to $153,985 in fiscal 2010 from $150,649 in fiscal 2009. This increase resulted from the MSI acquisition as the internal growth rate declined 0.6% in fiscal 2010. The negative internal growth rate of total revenues, in the year-over-year comparison, was significantly impacted by a $4,494 decrease in one-time liquidated damages related to early contract terminations from customers lost primarily through bank mergers. The underlying revenue growth rate excluding the MSI acquisition and one-time liquidated damages was 2.4%. The underlying revenue growth was primarily derived from sales to new customers, cross-sales to existing customers and increases in transaction volumes from existing customers, partially offset by the effect of customers lost primarily due to mergers and customers migrating to in-bank check imaging systems.
Processing revenues increased 0.9% in fiscal 2010 compared to fiscal 2009. This increase resulted from the MSI acquisition as the internal growth rate declined 1.4% in fiscal 2010. The negative internal growth rate of processing revenues primarily reflects the $4,494 decrease in one-time liquidated damages noted above; partially offset by sales to new customers, cross-sales to existing customers and increases in transaction volumes from existing customers.
Other revenues increased 5.6% in fiscal 2010 compared to fiscal 2009. The internal growth rate was 1.3% in fiscal 2010 with the remaining growth resulting from the MSI acquisition. The internal revenue growth was primarily due to higher telecommunications revenue; higher software license and royalty revenues; higher regulatory compliance, homeland security and fraud prevention revenues; and growth in network monitoring services and eBusiness group revenues, partially offset by lower equipment-related revenues.
Operating Expenses. Operating expenses increased $1,812, or 1.6%, in fiscal 2010 compared to fiscal 2009. Approximately $4,383 was attributable to the MSI acquisition. Excluding the effect of the acquisition, operating expenses decreased $2,571, or 2.2%, in fiscal 2010 primarily due to:
improved operating efficiencies as we consolidated six of our remote data centers into other existing locations as customers shifted to remote data capture technology and away from processing transactions at our fixed data centers;
lower group medical plan expenses;
lower general and administrative expenses;
lower costs of goods sold commensurate with lower hardware and software revenue; and
lower travel expenses,
partially offset by:
higher employee-related expenses attributable to annual compensation adjustments;
higher Visa® and MasterCard® program fees, ATM network access fees and plastic card fees due to growth in our ATM and debit card business; and
higher equipment maintenance and software amortization expense.
Operating Income. Operating income increased $1,524, or 4.5%, in fiscal 2010 compared to fiscal 2009. Operating margins improved to 23.2% in fiscal 2010 compared to 22.7% in fiscal 2009. The increase in operating income and margin was primarily due to a higher sales base and the significant improvement in operating profitability.
Interest Income and Expense. Consolidated net interest expense decreased $7 in fiscal 2010 compared to fiscal 2009.
12 Computer Services, Inc. | 2011 Annual Report
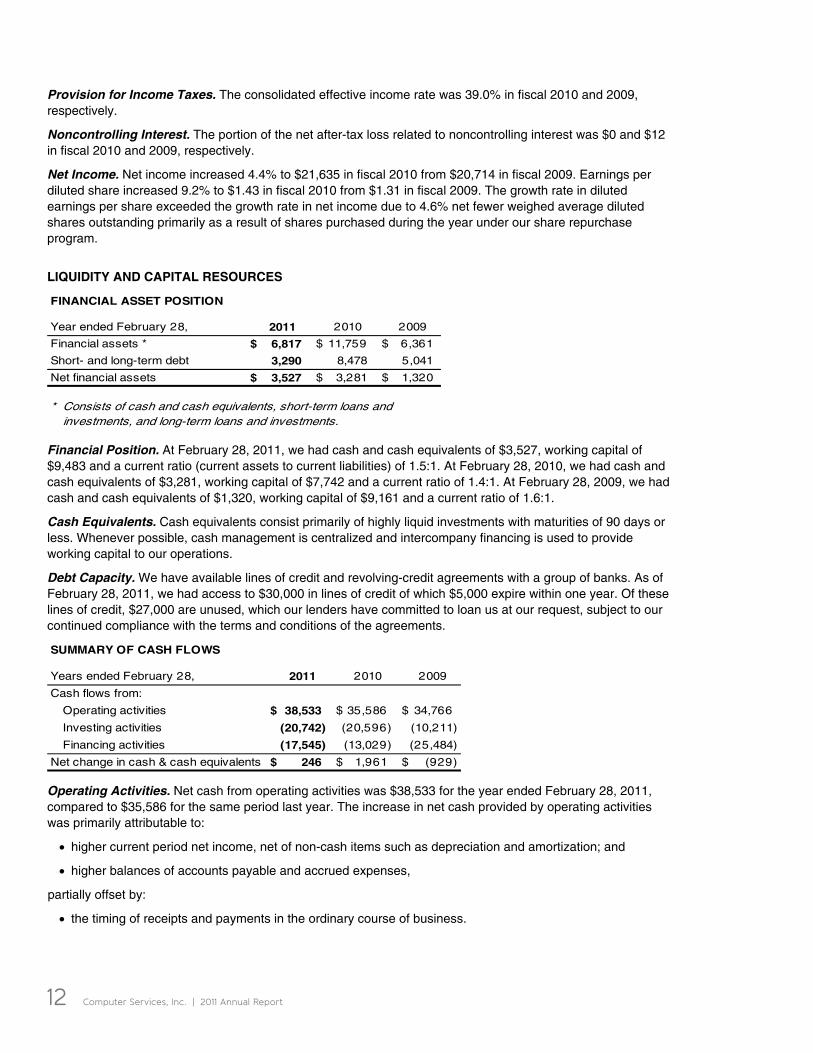
Provision for Income Taxes. The consolidated effective income rate was 39.0% in fiscal 2010 and 2009, respectively.
Noncontrolling Interest. The portion of the net after-tax loss related to noncontrolling interest was $0 and $12 in fiscal 2010 and 2009, respectively.
Net Income. Net income increased 4.4% to $21,635 in fiscal 2010 from $20,714 in fiscal 2009. Earnings per diluted share increased 9.2% to $1.43 in fiscal 2010 from $1.31 in fiscal 2009. The growth rate in diluted earnings per share exceeded the growth rate in net income due to 4.6% net fewer weighed average diluted shares outstanding primarily as a result of shares purchased during the year under our share repurchase program.
LIQUIDITY AND CAPITAL RESOURCES
FINANCIAL ASSET POSITION
Year ended February 28, 2011 2010 2009
Financial assets * 6,817$ 11,759$ 6,361$
Short- and long-term debt 3,290 8,478 5,041
Net financial assets 3,527$ 3,281$ 1,320$
* Consists of cash and cash equivalents, short-term loans and investments, and long-term loans and investments.
Financial Position. At February 28, 2011, we had cash and cash equivalents of $3,527, working capital of $9,483 and a current ratio (current assets to current liabilities) of 1.5:1. At February 28, 2010, we had cash and cash equivalents of $3,281, working capital of $7,742 and a current ratio of 1.4:1. At February 28, 2009, we had cash and cash equivalents of $1,320, working capital of $9,161 and a current ratio of 1.6:1.
Cash Equivalents. Cash equivalents consist primarily of highly liquid investments with maturities of 90 days or less. Whenever possible, cash management is centralized and intercompany financing is used to provide working capital to our operations.
Debt Capacity. We have available lines of credit and revolving-credit agreements with a group of banks. As of February 28, 2011, we had access to $30,000 in lines of credit of which $5,000 expire within one year. Of these lines of credit, $27,000 are unused, which our lenders have committed to loan us at our request, subject to our continued compliance with the terms and conditions of the agreements.
SUMMARY OF CASH FLOWS
Years ended February 28, 2011 2010 2009
Cash flows from:
Operating activities 38,533$ 35,586$ 34,766$
Investing activities (20,742) (20,596) (10,211)
Financing activities (17,545) (13,029) (25,484)
Net change in cash & cash equivalents 246$ 1,961$ (929)$
Operating Activities. Net cash from operating activities was $38,533 for the year ended February 28, 2011, compared to $35,586 for the same period last year. The increase in net cash provided by operating activities was primarily attributable to:
higher current period net income, net of non-cash items such as depreciation and amortization; and
higher balances of accounts payable and accrued expenses,
partially offset by:
the timing of receipts and payments in the ordinary course of business.
Computer Services, Inc. | 2011 Annual Report 13
Investing Activities. Net cash used by investing activities was $20,742 for the year ended February 28, 2011, compared to $20,596 for the same period last year. The increase in net cash used by investing activities was primarily attributable to:
a $4,157 increase in software purchases compared to last year;
contingent consideration of $3,513 paid on prior years’ acquisitions;
a $2,120 increase in property and equipment purchases compared to last year; and
a $500 equity investment,
partially offset by:
a $9,956 reduction related to the MSI acquisition, net of cash received in fiscal 2010.
Financing Activities. Net cash used by financing activities was $17,545 for the year ended February 28, 2011, compared to $13,029 in the same period last year. The increase in net cash used by financing activities was primarily attributable to:
a $5,868 net reduction in debt; and
a $718 increase in dividends paid,
partially offset by:
a $2,025 decrease in common stock purchased under our share repurchase program.
At February 28, 2011, we had $3,099 of long-term debt, nearly all of which was outstanding under a $25,000 revolving credit facility. The unsecured revolving credit agreement expires January 31, 2013 and bears interest at a floating rate based on the greater of 3.05% or one-month LIBOR plus 1.35% (1.61% and 1.58% at February 28, 2011 and 2010, respectively).
The credit agreement contains customary restrictive and financial covenants as well as customary events of default. The terms of the credit agreement also include standard provisions related to conditions of borrowing, including a customary material adverse effect clause which could limit our ability to borrow additional funds. We have not experienced a material adverse effect, and we know of no circumstances or events that would be reasonably likely to result in a material adverse effect. At this time, we do not believe the material adverse effect clause poses a material funding risk to us.
We renewed an unsecured bank credit line on August 19, 2010, that provides for funding of up to $5,000 and bears interest at a floating rate based on the greater of 4.00% or the prime rate less 50 basis points (2.75% at both February 28, 2011 and 2010). The credit line expires August 18, 2011. At February 28, 2011, no amount was outstanding under the credit line.
We believe our cash balances, operating cash flows, access to debt financing and borrowing capacity, taken together, provide adequate resources to fund our ongoing liquidity requirements, to fund future expansion opportunities, capital expenditures and share repurchases, and to refinance debt as it matures.
14 Computer Services, Inc. | 2011 Annual Report
The Board of Directors has authorized the Company to repurchase shares of its common stock. Under this authorization, the Company may finance its share repurchases with available cash reserves or borrowings under its existing credit facilities. The share repurchase program does not include specific price targets or timetables and may be suspended at any time.
In December 2007, the Board of Directors authorized a $5,000 increase in the share repurchase program that we completed in the second quarter of fiscal 2009. In total, under the December 2007 authorization, we purchased 307,744 shares at an average price of $16.25 per share.
In June 2008, the Board of Directors authorized a $5,000 increase in the share repurchase program that we completed in the third quarter of fiscal 2009. In total, under the June 2008 authorization, we purchased 309,070 shares at an average price of $16.18 per share.
In September 2008, the Board of Directors authorized a $5,000 increase in the share repurchase program that we completed in the fourth quarter of fiscal 2009. In total, under the September 2008 authorization, we purchased 363,940 shares at an average price of $13.74 per share.
In December 2008, the Board of Directors authorized a $5,000 increase in the share repurchase program that we completed in the second quarter of fiscal 2010. In total, under the December 2008 authorization, we purchased 370,058 shares at an average price of $13.51 per share.
In June 2009, the Board of Directors authorized a $5,000 increase in the share repurchase program that we completed in the first quarter of fiscal 2011. In total, under the June 2009 authorization, we purchased 279,055 shares at an average price of $17.92 per share.
In March 2010, the Board of Directors authorized a $5,000 increase in the share repurchase program that we completed in the fourth quarter of fiscal 2011. In total, under the March 2010 authorization, we purchased 222,611 shares at an average price of $22.46 per share.
In December 2010, the Board of Directors authorized a $5,000 increase in the share repurchase program. During fiscal 2011 we purchased a total of 39,354 shares under the current authorization at an average price of $26.99 per share.
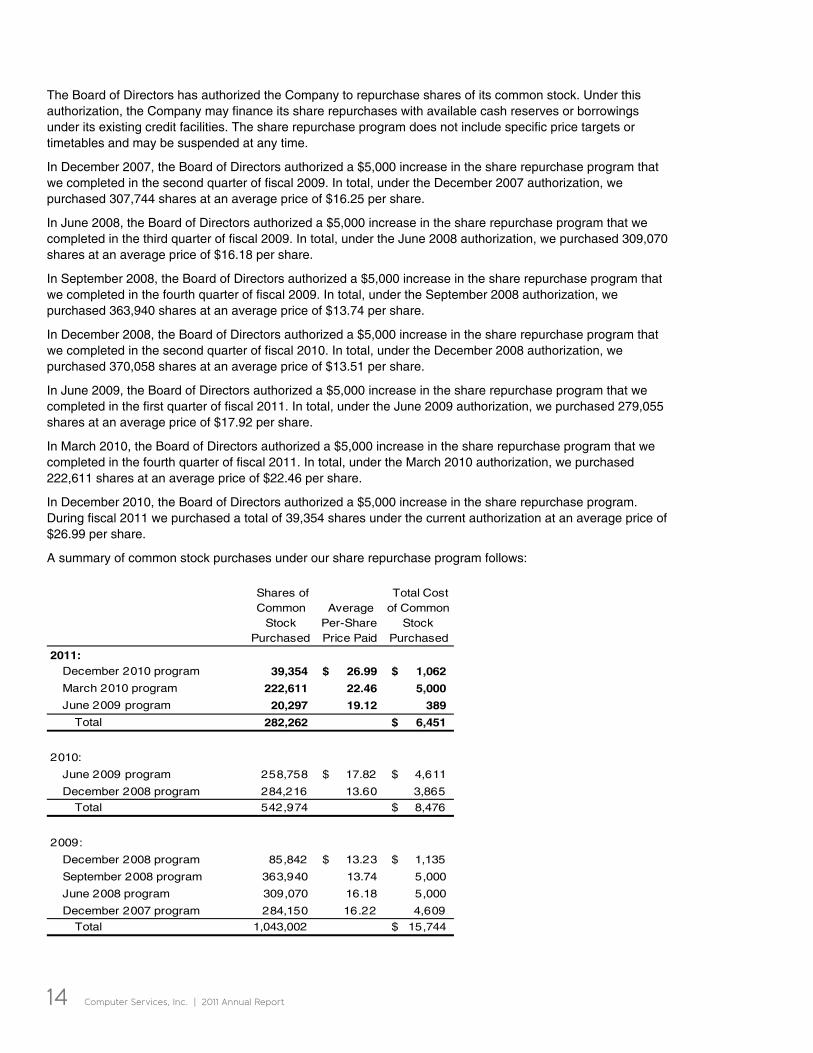
A summary of common stock purchases under our share repurchase program follows:
Shares of Common
Stock Purchased
Average Per-Share Price Paid
Total Cost of Common
Stock Purchased
2011:December 2010 program 39,354 26.99$ 1,062$
March 2010 program 222,611 22.46 5,000
June 2009 program 20,297 19.12 389
Total 282,262 6,451$
2010:
June 2009 program 258,758 17.82$ 4,611$
December 2008 program 284,216 13.60 3,865
Total 542,974 8,476$
2009:
December 2008 program 85,842 13.23$ 1,135$
September 2008 program 363,940 13.74 5,000
June 2008 program 309,070 16.18 5,000
December 2007 program 284,150 16.22 4,609
Total 1,043,002 15,744$
Computer Services, Inc. | 2011 Annual Report 15
DIVIDENDS ON COMMON STOCK
We declared and paid dividends of $5,998 in fiscal 2011 and $5,280 in fiscal 2010. Our dividend payout ratio was 25.0% in fiscal 2011 and 24.4% in fiscal 2010. We paid cash dividends of $0.41 per share in fiscal 2011, an increase of 13.9% over the $0.36 per share paid in fiscal 2010. The fiscal 2011 cash dividend marks the 22nd consecutive year with a dividend increase. We believe our current dividend provides a return to shareholders while maintaining sufficient capital to invest in growing our businesses. To the extent we have additional capital in excess of investment opportunities, we typically offer a return to our shareholders through a stock repurchase program. The Board of Directors has indicated that it plans to continue paying dividends as long as our financial performance remains favorable.
AUDIT AND NON-AUDIT FEES
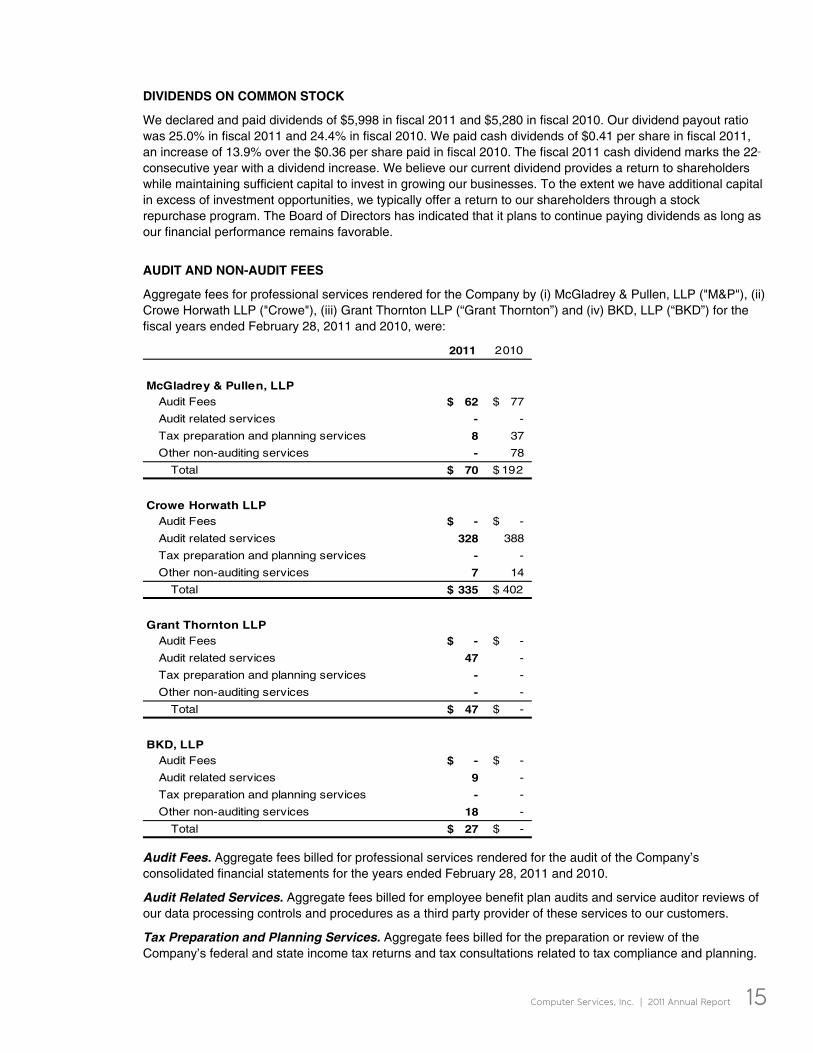
Aggregate fees for professional services rendered for the Company by (i) McGladrey & Pullen, LLP ("M&P"), (ii) Crowe Horwath LLP ("Crowe"), (iii) Grant Thornton LLP (“Grant Thornton”) and (iv) BKD, LLP (“BKD”) for the fiscal years ended February 28, 2011 and 2010, were:
2011 2010
McGladrey & Pullen, LLPAudit Fees 62$ 77$
Audit related services - -
Tax preparation and planning services 8 37
Other non-auditing services - 78
Total 70$ 192$
Crowe Horwath LLPAudit Fees -$ -$
Audit related services 328 388
Tax preparation and planning services - -
Other non-auditing services 7 14
Total 335$ 402$
Grant Thornton LLPAudit Fees -$ -$
Audit related services 47 -
Tax preparation and planning services - -
Other non-auditing services - -
Total 47$ -$
BKD, LLPAudit Fees -$ -$
Audit related services 9 -
Tax preparation and planning services - -
Other non-auditing services 18 -
Total 27$ -$
Audit Fees. Aggregate fees billed for professional services rendered for the audit of the Company’s consolidated financial statements for the years ended February 28, 2011 and 2010.
Audit Related Services. Aggregate fees billed for employee benefit plan audits and service auditor reviews of our data processing controls and procedures as a third party provider of these services to our customers.
Tax Preparation and Planning Services. Aggregate fees billed for the preparation or review of the Company’s federal and state income tax returns and tax consultations related to tax compliance and planning.
16 Computer Services, Inc. | 2011 Annual Report
Other Non-auditing Services. Aggregate fees billed for third party administration of our qualified defined contribution plan, and accounting consultations and assistance provided with respect to business acquisitions, special issues and other transactions. We do not use M&P, Crowe, Grant Thornton or BKD for financial information systems design and implementation. These services, which include designing or implementing a system that aggregates source data underlying the financial statements or generates information that is significant to our financial statements, are provided internally or by other service providers. We have a full-time internal audit department and do not engage M&P or Crowe to provide compliance outsourcing services.
The Audit Committee of the Company’s Board has responsibility for appointing, setting compensation for and overseeing the work of the independent auditor. In recognition of this responsibility, the Audit Committee has established a policy to pre-approve all audit and permissible non-audit services provided by the independent auditor.
The Audit Committee has considered the non-audit services provided by M&P, Crowe and BKD and determined that the provision of such services had no effect on M&P’s, Crowe’s and BKD’s independence from the Company.
FORWARD-LOOKING STATEMENTS
All statements except historical statements contained herein constitute “forward-looking statements” as that term is defined in the Private Securities Litigation Reform Act of 1995. This Annual Report and other written and oral statements that we make from time to time contain such forward-looking statements that may anticipate results based on management’s plans and assumptions. We have tried wherever possible to identify such statements by using words such as “anticipate,” “estimate,” “expect,” “project,” “intend,” “plan,” “believe,” and words and terms of similar substance in connection with any discussion of future operating or financial performance. Nonetheless, all statements except historical statements contained herein may be deemed to constitute “forward-looking statements.” Forward-looking statements are inherently uncertain and are based only on current expectations and assumptions that are subject to future developments that may cause results to differ materially. Readers should carefully consider: (i) economic, competitive, technological and governmental factors affecting the Company’s operations, customers, markets, services, products and prices; and (ii) other factors discussed in the Company’s Annual Report, Information and Disclosure Statements and other documents posted from time to time on the OTCQX website, including without limitation, the description of the nature of the Company’s business and its management discussion and analysis of financial condition and results of operations for reported periods. The Company undertakes no obligation to update, and is not responsible for updating, the information contained herein beyond the publication date, whether as a result of new information or future events, or to conform the statement to actual results or changes in the Company’s expectations, or otherwise or for changes made to this document by wire services or Internet services.
As of February 28, 2011, we did not have any off-balance sheet arrangements that have or are reasonably likely to have a current or future effect on our financial condition, changes in financial condition, revenues or expenses, results of operations, liquidity, capital expenditures or capital resources that are material to investors.
MARKET RISK
Market risk refers to the risk that a change in the level of one or more market prices, interest rates, indices, volatilities, correlations or other market factors such as liquidity, will result in losses for a certain financial instrument or group of financial instruments. We are exposed to credit risk on credit extended to customers, and interest rate risk and market price risk on investments and borrowings. We actively monitor these risks through a variety of control procedures involving senior management. We do not currently use any derivative financial instruments. We invest and borrow primarily on a short-term or variable rate basis. Based on the controls in place, credit worthiness of our customer base and the relative size of these financial instruments, we believe the risk associated with these instruments will not have a material adverse effect on our consolidated financial position or results of operations.
Computer Services, Inc. | 2011 Annual Report 17
LEGAL PROCEEDINGS AND CONTINGENCIES
We and certain of our subsidiaries are involved in various commercial, tax and other legal proceedings that arise from time to time in the ordinary course of our business.
We record accruals for such contingencies to the extent that we conclude their occurrence is probable and the related damages are estimable. If a range of liability is probable and estimable and some amount within the range appears to be a better estimate than any other amount within the range, we accrue that amount. If a range of liability is probable and estimable and no amount appears to be a better estimate than any other amount within the range, we accrue the maximum of such probable range. These assessments can involve a series of complex judgments about future events and can rely heavily on estimates and assumptions (see Notes to Consolidated Financial Statements, Note 2 - Significant Accounting Policies: Use of Estimates in the Preparation of Financial Statements). Our assessments are based on estimates and assumptions that have been deemed reasonable by management.
While we do not believe any of our current legal proceedings will have a material adverse effect on our financial position or results of operation, litigation is inherently unpredictable, and excessive verdicts do occur. Although we may believe we have substantial defenses in these matters, we could in the future incur judgments or enter into settlements that could have a material adverse effect on our consolidated financial position or results of operations in any particular period.
SUBSEQUENT EVENTS
In March 2011, the Company’s Board of Directors authorized a cash dividend of $1,603 that was paid March 31, 2011.
18 Computer Services, Inc. | 2011 Annual Report
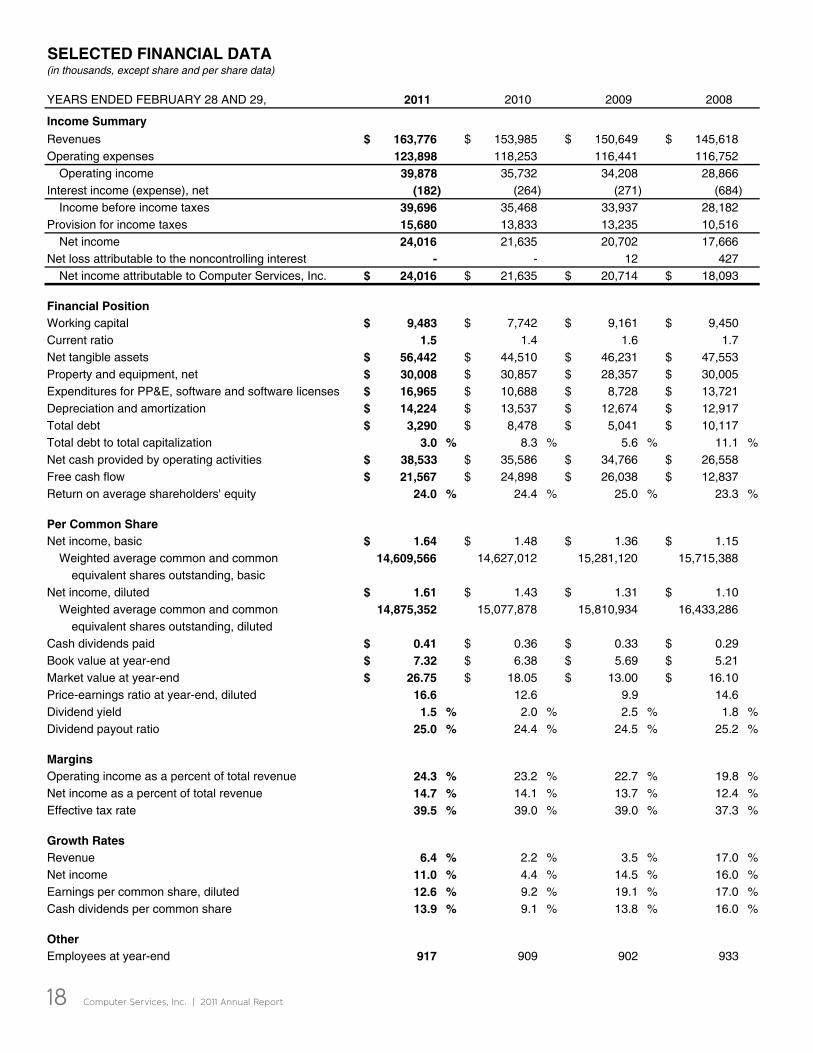
SELECTED FINANCIAL DATA(in thousands, except share and per share data)
YEARS ENDED FEBRUARY 28 AND 29, 2011 2010 2009 2008
Income Summary
Revenues 163,776$ 153,985$ 150,649$ 145,618$ Operating expenses 123,898 118,253 116,441 116,752
Operating income 39,878 35,732 34,208 28,866 Interest income (expense), net (182) (264) (271) (684)
Income before income taxes 39,696 35,468 33,937 28,182 Provision for income taxes 15,680 13,833 13,235 10,516
Net income 24,016 21,635 20,702 17,666 Net loss attributable to the noncontrolling interest - - 12 427
Net income attributable to Computer Services, Inc. 24,016$ 21,635$ 20,714$ 18,093$
Financial PositionWorking capital 9,483$ 7,742$ 9,161$ 9,450$ Current ratio 1.5 1.4 1.6 1.7 Net tangible assets 56,442$ 44,510$ 46,231$ 47,553$ Property and equipment, net 30,008$ 30,857$ 28,357$ 30,005$ Expenditures for PP&E, software and software licenses 16,965$ 10,688$ 8,728$ 13,721$ Depreciation and amortization 14,224$ 13,537$ 12,674$ 12,917$ Total debt 3,290$ 8,478$ 5,041$ 10,117$ Total debt to total capitalization 3.0 % 8.3 % 5.6 % 11.1 %Net cash provided by operating activities 38,533$ 35,586$ 34,766$ 26,558$ Free cash flow 21,567$ 24,898$ 26,038$ 12,837$ Return on average shareholders' equity 24.0 % 24.4 % 25.0 % 23.3 %
Per Common ShareNet income, basic 1.64$ 1.48$ 1.36$ 1.15$
Weighted average common and common 14,609,566 14,627,012 15,281,120 15,715,388 equivalent shares outstanding, basic
Net income, diluted 1.61$ 1.43$ 1.31$ 1.10$ Weighted average common and common 14,875,352 15,077,878 15,810,934 16,433,286
equivalent shares outstanding, dilutedCash dividends paid 0.41$ 0.36$ 0.33$ 0.29$ Book value at year-end 7.32$ 6.38$ 5.69$ 5.21$ Market value at year-end 26.75$ 18.05$ 13.00$ 16.10$ Price-earnings ratio at year-end, diluted 16.6 12.6 9.9 14.6 Dividend yield 1.5 % 2.0 % 2.5 % 1.8 %Dividend payout ratio 25.0 % 24.4 % 24.5 % 25.2 %
MarginsOperating income as a percent of total revenue 24.3 % 23.2 % 22.7 % 19.8 %Net income as a percent of total revenue 14.7 % 14.1 % 13.7 % 12.4 %Effective tax rate 39.5 % 39.0 % 39.0 % 37.3 %
Growth RatesRevenue 6.4 % 2.2 % 3.5 % 17.0 %Net income 11.0 % 4.4 % 14.5 % 16.0 %Earnings per common share, diluted 12.6 % 9.2 % 19.1 % 17.0 %Cash dividends per common share 13.9 % 9.1 % 13.8 % 16.0 %
OtherEmployees at year-end 917 909 902 933
Computer Services, Inc. | 2011 Annual Report 19
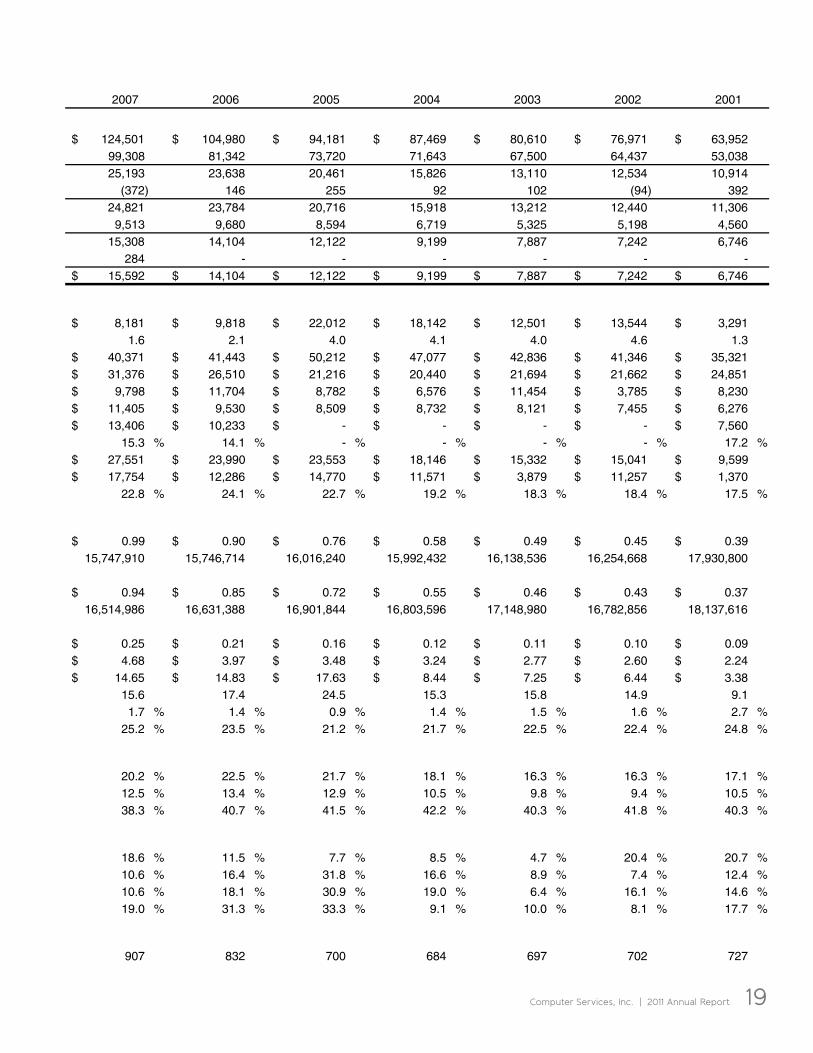
2007 2006 2005 2004 2003 2002 2001
124,501$ 104,980$ 94,181$ 87,469$ 80,610$ 76,971$ 63,952$ 99,308 81,342 73,720 71,643 67,500 64,437 53,038 25,193 23,638 20,461 15,826 13,110 12,534 10,914
(372) 146 255 92 102 (94) 392 24,821 23,784 20,716 15,918 13,212 12,440 11,306
9,513 9,680 8,594 6,719 5,325 5,198 4,560 15,308 14,104 12,122 9,199 7,887 7,242 6,746
284 - - - - - - 15,592$ 14,104$ 12,122$ 9,199$ 7,887$ 7,242$ 6,746$
8,181$ 9,818$ 22,012$ 18,142$ 12,501$ 13,544$ 3,291$ 1.6 2.1 4.0 4.1 4.0 4.6 1.3
40,371$ 41,443$ 50,212$ 47,077$ 42,836$ 41,346$ 35,321$ 31,376$ 26,510$ 21,216$ 20,440$ 21,694$ 21,662$ 24,851$
9,798$ 11,704$ 8,782$ 6,576$ 11,454$ 3,785$ 8,230$ 11,405$ 9,530$ 8,509$ 8,732$ 8,121$ 7,455$ 6,276$ 13,406$ 10,233$ -$ -$ -$ -$ 7,560$
15.3 % 14.1 % - % - % - % - % 17.2 %27,551$ 23,990$ 23,553$ 18,146$ 15,332$ 15,041$ 9,599$ 17,754$ 12,286$ 14,770$ 11,571$ 3,879$ 11,257$ 1,370$
22.8 % 24.1 % 22.7 % 19.2 % 18.3 % 18.4 % 17.5 %
0.99$ 0.90$ 0.76$ 0.58$ 0.49$ 0.45$ 0.39$ 15,747,910 15,746,714 16,016,240 15,992,432 16,138,536 16,254,668 17,930,800
0.94$ 0.85$ 0.72$ 0.55$ 0.46$ 0.43$ 0.37$ 16,514,986 16,631,388 16,901,844 16,803,596 17,148,980 16,782,856 18,137,616
0.25$ 0.21$ 0.16$ 0.12$ 0.11$ 0.10$ 0.09$ 4.68$ 3.97$ 3.48$ 3.24$ 2.77$ 2.60$ 2.24$
14.65$ 14.83$ 17.63$ 8.44$ 7.25$ 6.44$ 3.38$ 15.6 17.4 24.5 15.3 15.8 14.9 9.1
1.7 % 1.4 % 0.9 % 1.4 % 1.5 % 1.6 % 2.7 %25.2 % 23.5 % 21.2 % 21.7 % 22.5 % 22.4 % 24.8 %
20.2 % 22.5 % 21.7 % 18.1 % 16.3 % 16.3 % 17.1 %12.5 % 13.4 % 12.9 % 10.5 % 9.8 % 9.4 % 10.5 %38.3 % 40.7 % 41.5 % 42.2 % 40.3 % 41.8 % 40.3 %
18.6 % 11.5 % 7.7 % 8.5 % 4.7 % 20.4 % 20.7 %10.6 % 16.4 % 31.8 % 16.6 % 8.9 % 7.4 % 12.4 %10.6 % 18.1 % 30.9 % 19.0 % 6.4 % 16.1 % 14.6 %19.0 % 31.3 % 33.3 % 9.1 % 10.0 % 8.1 % 17.7 %
907 832 700 684 697 702 727
20 Computer Services, Inc. | 2011 Annual Report
Management’s Statement of ResponsibilityManagement of Computer Services, Inc. is
responsible for the integrity and objectivity of
the information contained in this annual report.
The financial statements have been prepared
in conformity with accounting principles
generally accepted in the United States of
America and, as such, include amounts based
on judgments of management. Other financial
information in this annual report is consistent
with these financial statements.
It is the Company’s policy to maintain
a system of internal controls designed
to provide reasonable assurance that
transactions authorized by management
are recorded and reported properly and
that assets are safeguarded against loss or
unauthorized use. Importantly, the system
of controls is continually reviewed for its
effectiveness and is augmented by written
policies and guidelines, the careful selection
and training of qualified personnel, and a
strong program of internal audit.
The control environment is complemented
by internal auditors who perform extensive
audits and evaluate the adequacy of and
the adherence to these controls, policies
and procedures. In addition, the Company’s
independent public accountants have audited
the financial statements in accordance with
auditing standards generally accepted in
the United States of America, which include
the consideration of the Company’s internal
controls to the extent necessary to form
an independent opinion on the financial
statements prepared by management.
The Board of Directors, through the Audit
Committee, is responsible for assuring
that management fulfills its responsibilities
in the preparation of the Company’s
financial statements, the appointment of the
independent accountants, and reviews with
the independent accountants, management,
and the internal auditors. The Audit Committee
meets regularly with management, the
internal auditors and the independent
accountants, jointly and separately, to
receive reports on management’s process of
implementation and administration of internal
accounting controls, as well as auditing and
financial reporting matters. The independent
accountants and the internal auditors have
unfettered access to the Audit Committee.
Steven A. Powless
CEO
David L. Simon
Treasurer & CFO
Computer Services, Inc. | 2011 Annual Report 21
Independent Auditor’s ReportTo the Shareholders and Board of Directors
Computer Services, Inc.
Paducah, Kentucky
We have audited the accompanying consolidated balance sheets of Computer Services, Inc. and
Subsidiaries as of February 28, 2011 and 2010, and the related consolidated statements of income,
changes in equity and cash flows for each of the three years in the period ended February 28, 2011.
These financial statements are the responsibility of the Company's management. Our responsibility is
to express an opinion on these financial statements based on our audits.
We conducted our audits in accordance with auditing standards generally accepted in the United
States of America. Those standards require that we plan and perform the audit to obtain reasonable
assurance about whether the financial statements are free of material misstatement. An audit includes
consideration of internal control over financial reporting as a basis for designing audit procedures that
are appropriate in the circumstances, but not for the purpose of expressing an opinion on the
effectiveness of Computer Services, Inc.’s internal control over financial reporting. Accordingly, we
express no such opinion. An audit also includes examining, on a test basis, evidence supporting the
amounts and disclosures in the financial statements, assessing the accounting principles used and
significant estimates made by management, as well as evaluating the overall financial statement
presentation. We believe that our audits provide a reasonable basis for our opinion.
In our opinion, the consolidated financial statements referred to above present fairly, in all material
respects, the financial position of Computer Services, Inc. and Subsidiaries as of February 28, 2011
and 2010, and the results of its operations and its cash flows for each of the three years in the period
ended February 28, 2011, in conformity with accounting principles generally accepted in the United
States of America.
McGladrey & Pullen, LLP
Peoria, Illinois
April 27, 2011
22 Computer Services, Inc. | 2011 Annual Report
*See accompanying notes to consolidated financial statements.
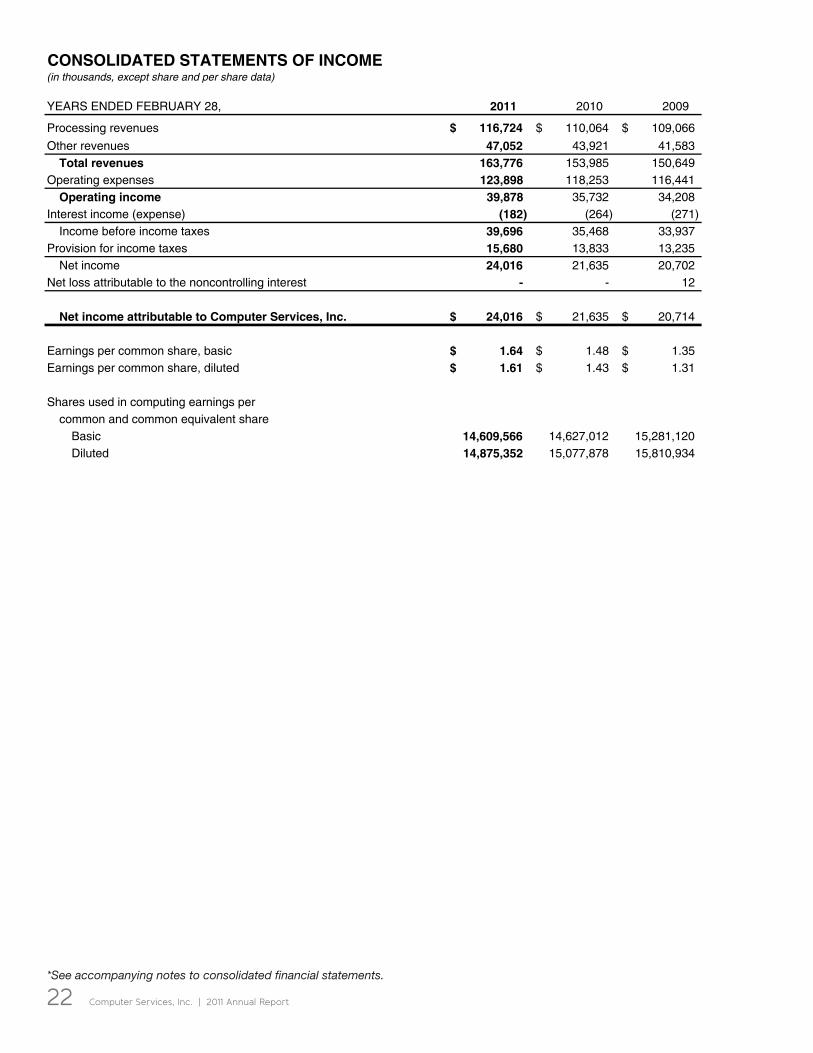
CONSOLIDATED STATEMENTS OF INCOME(in thousands, except share and per share data)
YEARS ENDED FEBRUARY 28, 2011 2010 2009
Processing revenues 116,724$ 110,064$ 109,066$
Other revenues 47,052 43,921 41,583 Total revenues 163,776 153,985 150,649
Operating expenses 123,898 118,253 116,441 Operating income 39,878 35,732 34,208
Interest income (expense) (182) (264) (271) Income before income taxes 39,696 35,468 33,937
Provision for income taxes 15,680 13,833 13,235 Net income 24,016 21,635 20,702
Net loss attributable to the noncontrolling interest - - 12
Net income attributable to Computer Services, Inc. 24,016$ 21,635$ 20,714$
Earnings per common share, basic 1.64$ 1.48$ 1.35$ Earnings per common share, diluted 1.61$ 1.43$ 1.31$
Shares used in computing earnings per common and common equivalent share
Basic 14,609,566 14,627,012 15,281,120 Diluted 14,875,352 15,077,878 15,810,934
Computer Services, Inc. | 2011 Annual Report 23*See accompanying notes to consolidated financial statements.
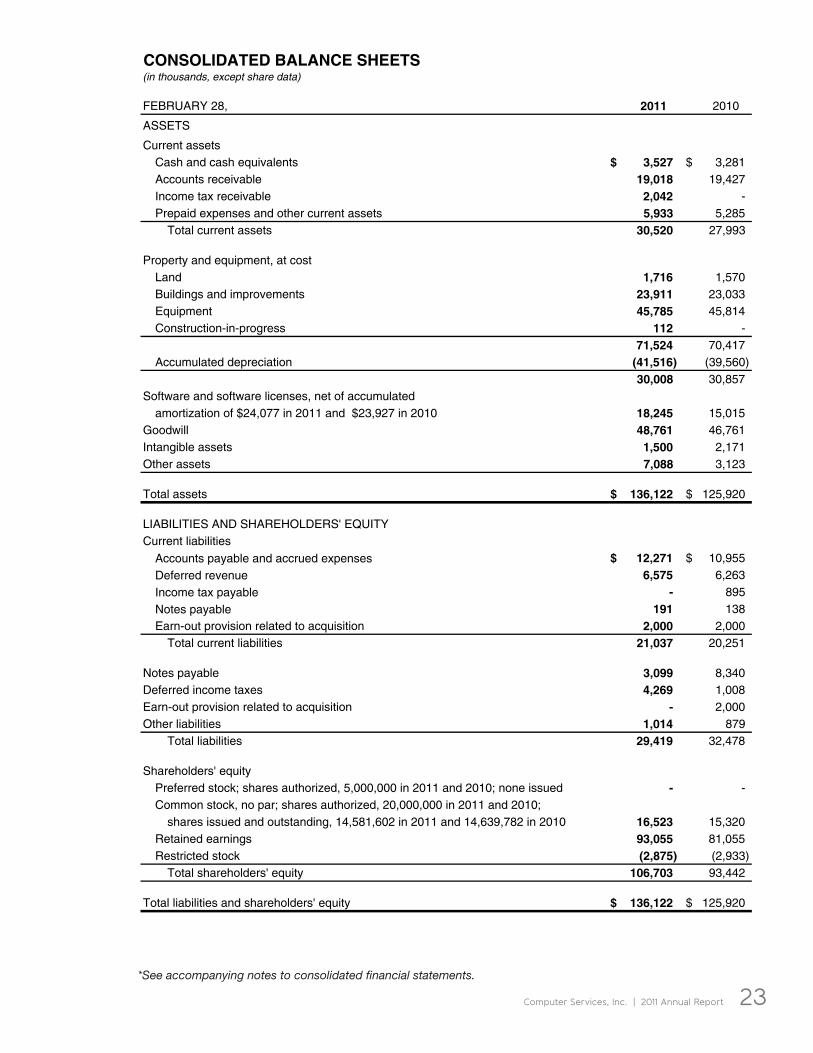
CONSOLIDATED BALANCE SHEETS(in thousands, except share data)
FEBRUARY 28, 2011 2010
ASSETS
Current assetsCash and cash equivalents 3,527$ 3,281$ Accounts receivable 19,018 19,427 Income tax receivable 2,042 - Prepaid expenses and other current assets 5,933 5,285
Total current assets 30,520 27,993
Property and equipment, at costLand 1,716 1,570 Buildings and improvements 23,911 23,033 Equipment 45,785 45,814 Construction-in-progress 112 -
71,524 70,417 Accumulated depreciation (41,516) (39,560)
30,008 30,857 Software and software licenses, net of accumulated
amortization of $24,077 in 2011 and $23,927 in 2010 18,245 15,015 Goodwill 48,761 46,761 Intangible assets 1,500 2,171 Other assets 7,088 3,123
Total assets 136,122$ 125,920$
LIABILITIES AND SHAREHOLDERS' EQUITYCurrent liabilities
Accounts payable and accrued expenses 12,271$ 10,955$
Deferred revenue 6,575 6,263
Income tax payable - 895
Notes payable 191 138 Earn-out provision related to acquisition 2,000 2,000
Total current liabilities 21,037 20,251
Notes payable 3,099 8,340 Deferred income taxes 4,269 1,008 Earn-out provision related to acquisition - 2,000 Other liabilities 1,014 879
Total liabilities 29,419 32,478
Shareholders' equityPreferred stock; shares authorized, 5,000,000 in 2011 and 2010; none issued - - Common stock, no par; shares authorized, 20,000,000 in 2011 and 2010;
shares issued and outstanding, 14,581,602 in 2011 and 14,639,782 in 2010 16,523 15,320 Retained earnings 93,055 81,055 Restricted stock (2,875) (2,933)
Total shareholders' equity 106,703 93,442
Total liabilities and shareholders' equity 136,122$ 125,920$
24 Computer Services, Inc. | 2011 Annual Report
*See accompanying notes to consolidated financial statements.
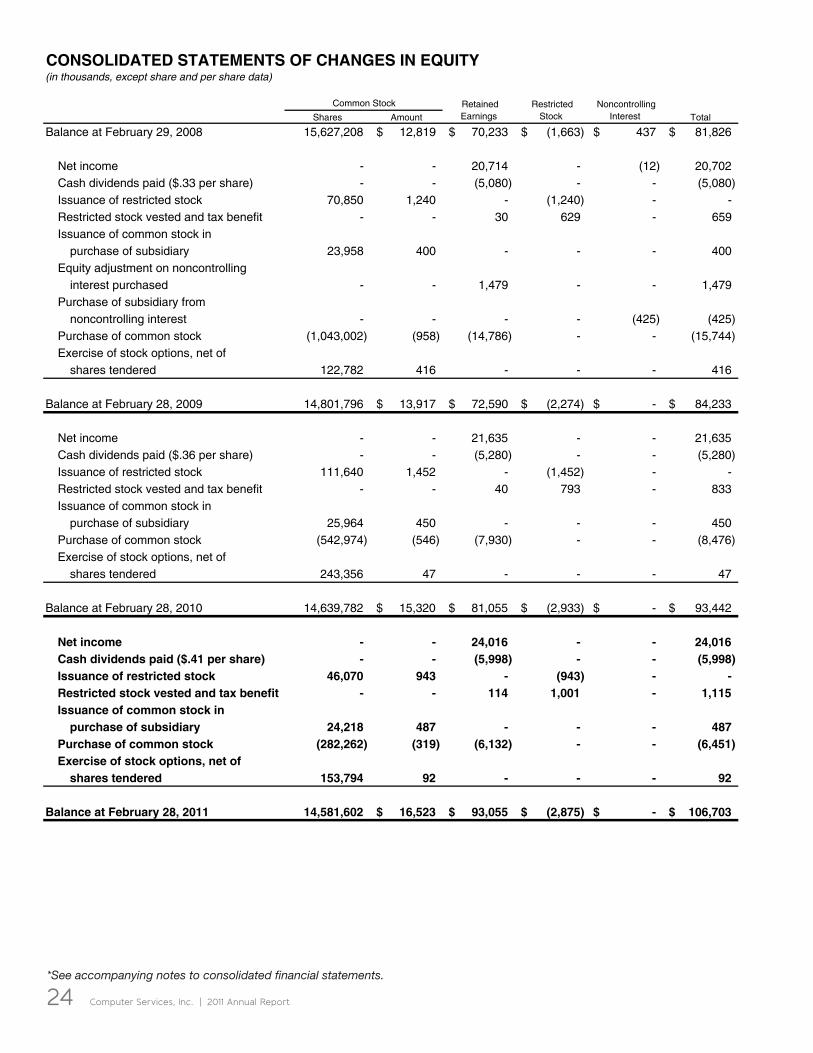
CONSOLIDATED STATEMENTS OF CHANGES IN EQUITY(in thousands, except share and per share data)
Shares Amount Total
Balance at February 29, 2008 15,627,208 12,819$ 70,233$ (1,663)$ 437$ 81,826$
Net income - - 20,714 - (12) 20,702 Cash dividends paid ($.33 per share) - - (5,080) - - (5,080) Issuance of restricted stock 70,850 1,240 - (1,240) - - Restricted stock vested and tax benefit - - 30 629 - 659 Issuance of common stock in
purchase of subsidiary 23,958 400 - - - 400 Equity adjustment on noncontrolling
interest purchased - - 1,479 - - 1,479 Purchase of subsidiary from
noncontrolling interest - - - - (425) (425) Purchase of common stock (1,043,002) (958) (14,786) - - (15,744) Exercise of stock options, net of
shares tendered 122,782 416 - - - 416
Balance at February 28, 2009 14,801,796 13,917$ 72,590$ (2,274)$ -$ 84,233$
Net income - - 21,635 - - 21,635 Cash dividends paid ($.36 per share) - - (5,280) - - (5,280) Issuance of restricted stock 111,640 1,452 - (1,452) - - Restricted stock vested and tax benefit - - 40 793 - 833 Issuance of common stock in
purchase of subsidiary 25,964 450 - - - 450 Purchase of common stock (542,974) (546) (7,930) - - (8,476) Exercise of stock options, net of
shares tendered 243,356 47 - - - 47
Balance at February 28, 2010 14,639,782 15,320$ 81,055$ (2,933)$ -$ 93,442$
Net income - - 24,016 - - 24,016 Cash dividends paid ($.41 per share) - - (5,998) - - (5,998) Issuance of restricted stock 46,070 943 - (943) - - Restricted stock vested and tax benefit - - 114 1,001 - 1,115 Issuance of common stock in
purchase of subsidiary 24,218 487 - - - 487 Purchase of common stock (282,262) (319) (6,132) - - (6,451) Exercise of stock options, net of
shares tendered 153,794 92 - - - 92
Balance at February 28, 2011 14,581,602 16,523$ 93,055$ (2,875)$ -$ 106,703$
Common Stock Retained Earnings
Restricted Stock
Noncontrolling Interest
Computer Services, Inc. | 2011 Annual Report 25*See accompanying notes to consolidated financial statements.
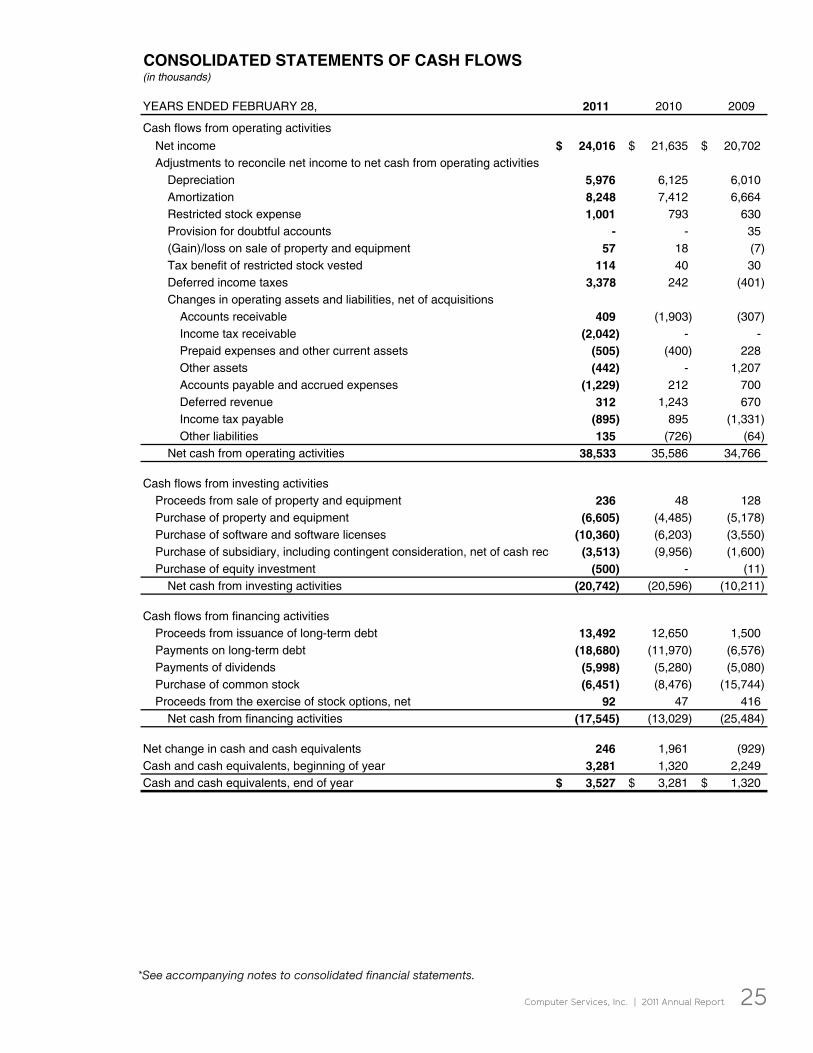
CONSOLIDATED STATEMENTS OF CASH FLOWS(in thousands)
YEARS ENDED FEBRUARY 28, 2011 2010 2009
Cash flows from operating activities
Net income 24,016$ 21,635$ 20,702$ Adjustments to reconcile net income to net cash from operating activities
Depreciation 5,976 6,125 6,010 Amortization 8,248 7,412 6,664 Restricted stock expense 1,001 793 630 Provision for doubtful accounts - - 35 (Gain)/loss on sale of property and equipment 57 18 (7) Tax benefit of restricted stock vested 114 40 30 Deferred income taxes 3,378 242 (401) Changes in operating assets and liabilities, net of acquisitions
Accounts receivable 409 (1,903) (307) Income tax receivable (2,042) - - Prepaid expenses and other current assets (505) (400) 228 Other assets (442) - 1,207 Accounts payable and accrued expenses (1,229) 212 700 Deferred revenue 312 1,243 670 Income tax payable (895) 895 (1,331) Other liabilities 135 (726) (64)
Net cash from operating activities 38,533 35,586 34,766
Cash flows from investing activitiesProceeds from sale of property and equipment 236 48 128 Purchase of property and equipment (6,605) (4,485) (5,178) Purchase of software and software licenses (10,360) (6,203) (3,550) Purchase of subsidiary, including contingent consideration, net of cash rec (3,513) (9,956) (1,600) Purchase of equity investment (500) - (11)
Net cash from investing activities (20,742) (20,596) (10,211)
Cash flows from financing activitiesProceeds from issuance of long-term debt 13,492 12,650 1,500 Payments on long-term debt (18,680) (11,970) (6,576) Payments of dividends (5,998) (5,280) (5,080) Purchase of common stock (6,451) (8,476) (15,744) Proceeds from the exercise of stock options, net 92 47 416
Net cash from financing activities (17,545) (13,029) (25,484)
Net change in cash and cash equivalents 246 1,961 (929) Cash and cash equivalents, beginning of year 3,281 1,320 2,249 Cash and cash equivalents, end of year 3,527$ 3,281$ 1,320$
26 Computer Services, Inc. | 2011 Annual Report
Notes to Consolidated Financial Statements
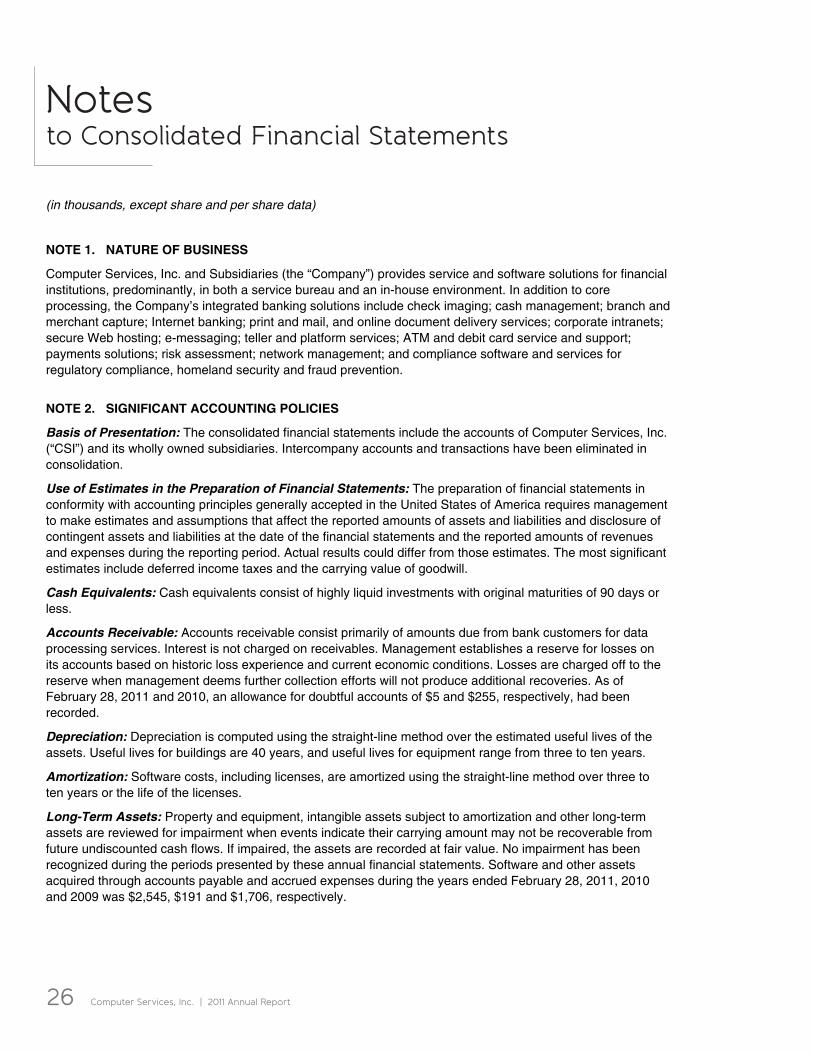
(in thousands, except share and per share data) NOTE 1. NATURE OF BUSINESS
Computer Services, Inc. and Subsidiaries (the “Company”) provides service and software solutions for financial institutions, predominantly, in both a service bureau and an in-house environment. In addition to core processing, the Company’s integrated banking solutions include check imaging; cash management; branch and merchant capture; Internet banking; print and mail, and online document delivery services; corporate intranets; secure Web hosting; e-messaging; teller and platform services; ATM and debit card service and support; payments solutions; risk assessment; network management; and compliance software and services for regulatory compliance, homeland security and fraud prevention.
NOTE 2. SIGNIFICANT ACCOUNTING POLICIES
Basis of Presentation: The consolidated financial statements include the accounts of Computer Services, Inc. (“CSI”) and its wholly owned subsidiaries. Intercompany accounts and transactions have been eliminated in consolidation.
Use of Estimates in the Preparation of Financial Statements: The preparation of financial statements in conformity with accounting principles generally accepted in the United States of America requires management to make estimates and assumptions that affect the reported amounts of assets and liabilities and disclosure of contingent assets and liabilities at the date of the financial statements and the reported amounts of revenues and expenses during the reporting period. Actual results could differ from those estimates. The most significant estimates include deferred income taxes and the carrying value of goodwill.
Cash Equivalents: Cash equivalents consist of highly liquid investments with original maturities of 90 days or less.
Accounts Receivable: Accounts receivable consist primarily of amounts due from bank customers for data processing services. Interest is not charged on receivables. Management establishes a reserve for losses on its accounts based on historic loss experience and current economic conditions. Losses are charged off to the reserve when management deems further collection efforts will not produce additional recoveries. As of February 28, 2011 and 2010, an allowance for doubtful accounts of $5 and $255, respectively, had been recorded.
Depreciation: Depreciation is computed using the straight-line method over the estimated useful lives of the assets. Useful lives for buildings are 40 years, and useful lives for equipment range from three to ten years.
Amortization: Software costs, including licenses, are amortized using the straight-line method over three to ten years or the life of the licenses.
Long-Term Assets: Property and equipment, intangible assets subject to amortization and other long-term assets are reviewed for impairment when events indicate their carrying amount may not be recoverable from future undiscounted cash flows. If impaired, the assets are recorded at fair value. No impairment has been recognized during the periods presented by these annual financial statements. Software and other assets acquired through accounts payable and accrued expenses during the years ended February 28, 2011, 2010 and 2009 was $2,545, $191 and $1,706, respectively.
Computer Services, Inc. | 2011 Annual Report 27
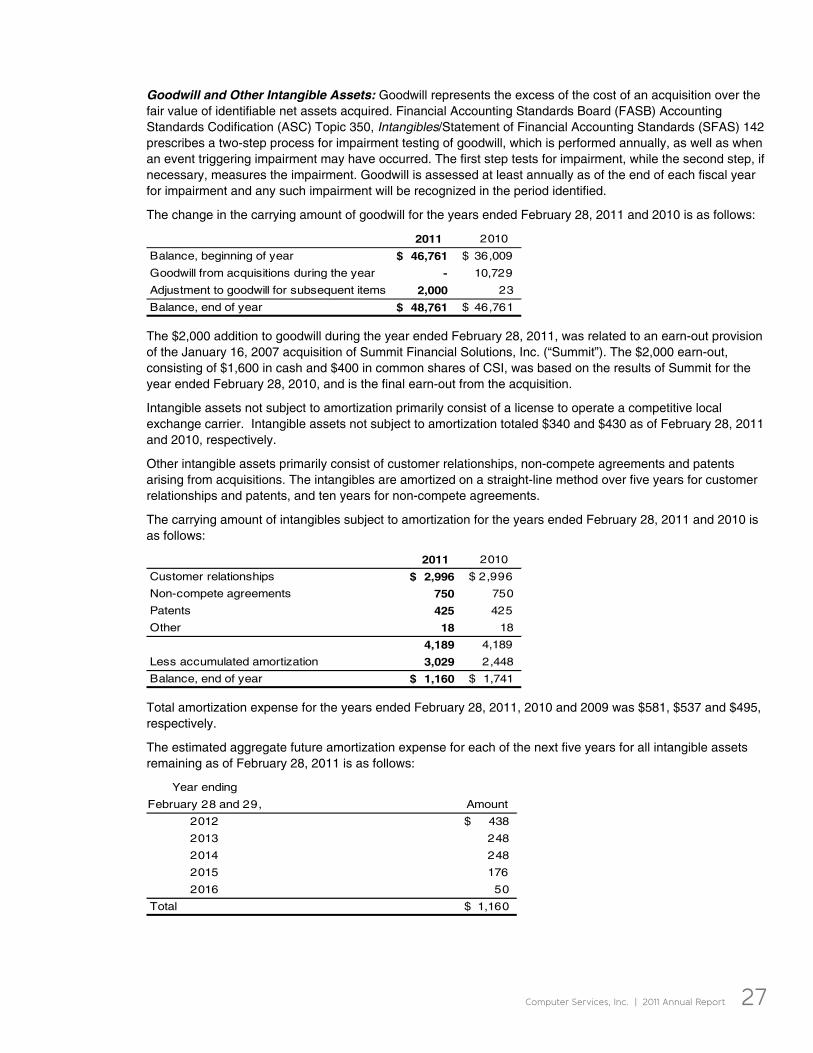
Goodwill and Other Intangible Assets: Goodwill represents the excess of the cost of an acquisition over the fair value of identifiable net assets acquired. Financial Accounting Standards Board (FASB) Accounting Standards Codification (ASC) Topic 350, Intangibles/Statement of Financial Accounting Standards (SFAS) 142 prescribes a two-step process for impairment testing of goodwill, which is performed annually, as well as when an event triggering impairment may have occurred. The first step tests for impairment, while the second step, if necessary, measures the impairment. Goodwill is assessed at least annually as of the end of each fiscal year for impairment and any such impairment will be recognized in the period identified.
The change in the carrying amount of goodwill for the years ended February 28, 2011 and 2010 is as follows:
2011 2010
Balance, beginning of year 46,761$ 36,009$
Goodwill from acquisitions during the year - 10,729
Adjustment to goodwill for subsequent items 2,000 23
Balance, end of year 48,761$ 46,761$
The $2,000 addition to goodwill during the year ended February 28, 2011, was related to an earn-out provision of the January 16, 2007 acquisition of Summit Financial Solutions, Inc. (“Summit”). The $2,000 earn-out, consisting of $1,600 in cash and $400 in common shares of CSI, was based on the results of Summit for the year ended February 28, 2010, and is the final earn-out from the acquisition.
Intangible assets not subject to amortization primarily consist of a license to operate a competitive local exchange carrier. Intangible assets not subject to amortization totaled $340 and $430 as of February 28, 2011 and 2010, respectively.
Other intangible assets primarily consist of customer relationships, non-compete agreements and patents arising from acquisitions. The intangibles are amortized on a straight-line method over five years for customer relationships and patents, and ten years for non-compete agreements.
The carrying amount of intangibles subject to amortization for the years ended February 28, 2011 and 2010 is as follows:
2011 2010
Customer relationships 2,996$ 2,996$
Non-compete agreements 750 750
Patents 425 425
Other 18 18
4,189 4,189
Less accumulated amortization 3,029 2,448
Balance, end of year 1,160$ 1,741$
Total amortization expense for the years ended February 28, 2011, 2010 and 2009 was $581, $537 and $495, respectively.
The estimated aggregate future amortization expense for each of the next five years for all intangible assets remaining as of February 28, 2011 is as follows:
Year ending
February 28 and 29, Amount
2012 438$
2013 248
2014 248
2015 176
2016 50
Total 1,160$
28 Computer Services, Inc. | 2011 Annual Report
Deferred Revenue: Deferred revenue consists primarily of payments received from customers for annual software licenses and software maintenance agreements. These revenues are recognized on a straight-line method over an 11 to 60 month rolling basis as the revenue is earned.
Earnings Per Common Share: Basic earnings per common share is based on net income available to common shareholders divided by the weighted average number of common shares considered to be outstanding during the period. The earnings per common share for the years ended February 28, 2010 and 2009 have been adjusted to give retroactive effect to the two-for-one stock split effected in the form of a stock dividend on April 30, 2010, as if the stock split had occurred on March 1, 2008. The weighted average number of common shares outstanding was 14,609,566, 14,627,012 and 15,281,120 for the years ended February 28, 2011, 2010 and 2009, respectively. Diluted earnings per common share shows the dilutive effect of any additional potential common shares issuable under stock options. Incremental dilutive shares, calculated using the treasury stock method, were 265,786, 450,866 and 529,814 for the years ended February 28, 2011, 2010 and 2009, respectively.
Income Taxes: Deferred income taxes are provided using the liability method whereby deferred tax assets are recognized for deductible temporary differences and operating loss and tax credit carry-forwards and deferred tax liabilities are recognized for taxable temporary differences. Temporary differences are the differences between the reported amounts of assets and liabilities and their tax bases. Deferred tax assets are reduced by a valuation allowance when, in the opinion of management, some portion or all of the deferred tax assets will, more likely than not, not be realized. Deferred tax assets and liabilities are adjusted for the effects of the changes in tax laws and rates on the date of enactment.
When tax returns are filed, some positions taken are highly likely to be sustained upon examination by the taxing authorities, while others are subject to uncertainty about the merits of the position taken or the amount of the position that would be sustained ultimately. The benefit of a tax position is recognized in the financial statements in the period during which, based on all available evidence, management believes the position will, more likely than not, be sustained upon examination, including the resolution of appeals or litigation processes, if any. Tax positions taken are not offset or aggregated with other positions. Tax positions that meet the more-likely-than-not recognition threshold are measured as the largest amount of tax benefit that is more than 50% likely of being realized upon settlement with the applicable taxing authority. The portion of the benefits associated with tax positions taken that exceeds the amount measured as described above is reflected as a liability for unrecognized tax benefits in the accompanying balance sheet along with any associated interest and penalties that would be payable to the taxing authorities upon examination.
Interest and penalties associated with unrecognized tax benefits are classified as additional income taxes in the statement of income.
Revenue Recognition: The Company generates revenue through the sale of data processing services, equipment and supplies, maintenance contracts, software, eBusiness services, and other service products. The Company enters into data processing contracts with its bank customers primarily of three to ten years in length. Revenues are recognized as services are provided on these contracts. Each contract contains an early contract termination clause that allows the Company to collect a percentage of the remaining contract as liquidated damages if the bank terminates the Company’s services prior to the end of the contract term. Revenues from early contract termination fees are recognized in the year received and reported as a component of processing revenues in the financial statements. Total early contract termination fees for the years ended February 28, 2011, 2010 and 2009 were $409, $275 and $4,769, respectively.
The Company records revenue under certain contracts for postage and telecommunications net of the related expenses. The Company provides these services as a convenience to the banks and provides these services at the Company’s cost. The total pass-through revenues for the years ended February 28, 2011, 2010 and 2009 were $36,864, $26,544 and $21,020, respectively.
Financial Instruments: The fair value approximates the carrying value for all financial instruments.
Reclassifications: Certain amounts in the accompanying fiscal years 2010 and 2009 statements of income were reclassified, with no effect on net income or equity, to be consistent with classifications adopted for fiscal year 2011.
Computer Services, Inc. | 2011 Annual Report 29
Concentration of Credit Risk: The Company maintains cash balances at several financial institutions in excess of the insurance limits provided by the Federal Deposit Insurance Corporation. The Company has not experienced any losses and does not believe it is exposed to any significant credit risk.
Recent Accounting Pronouncements: In October 2009, the FASB issued Accounting Standards Update (“ASU”) 2009-13, Revenue Recognition (Topic 605)—Multiple-Deliverable Revenue Arrangements, which amends ASC 605, Revenue Recognition, to require companies to allocate revenue in multiple-element arrangements based on an element’s estimated selling price if vendor-specific or other third-party evidence of value is not available. ASU 2009-13 is effective for revenue arrangements entered into or materially modified in fiscal years beginning on or after June 15, 2010. Earlier application is permitted. The adoption of this ASU is not expected to have a material impact on the Company’s financial position, results of operations or cash flows.
In October 2009, the FASB issued ASU 2009-14, Certain Revenue Arrangements That Include Software Elements. ASU 2009-14 modifies the software revenue recognition guidance to exclude from its scope tangible products that contain both software and non-software components that function together to deliver a product’s essential functionality. ASU 2009-14 is effective for revenue arrangements entered into or materially modified in fiscal years beginning on or after June 15, 2010. Early adoption is permitted. The adoption of this ASU is not expected to have a material impact on the Company’s financial position, results of operations or cash flows.
NOTE 3. LAND HELD FOR RESALE
The cost of land held for resale of $1,540 and $1,731 at February 28, 2011 and 2010, primarily represents costs incurred during the development of an office park in Paducah, Kentucky. These costs are allocated to each lot based upon each lot’s proportionate share of salable acreage. The project is substantially complete and any future associated costs will not be material. During the year ended February 28, 2011, land with a carrying value of $191 was transferred into property and equipment because it is land expected to be used in Company operations and is no longer held for resale. As of February 28, 2011 and 2010, land held for sale is included in other assets on the balance sheets.
30 Computer Services, Inc. | 2011 Annual Report
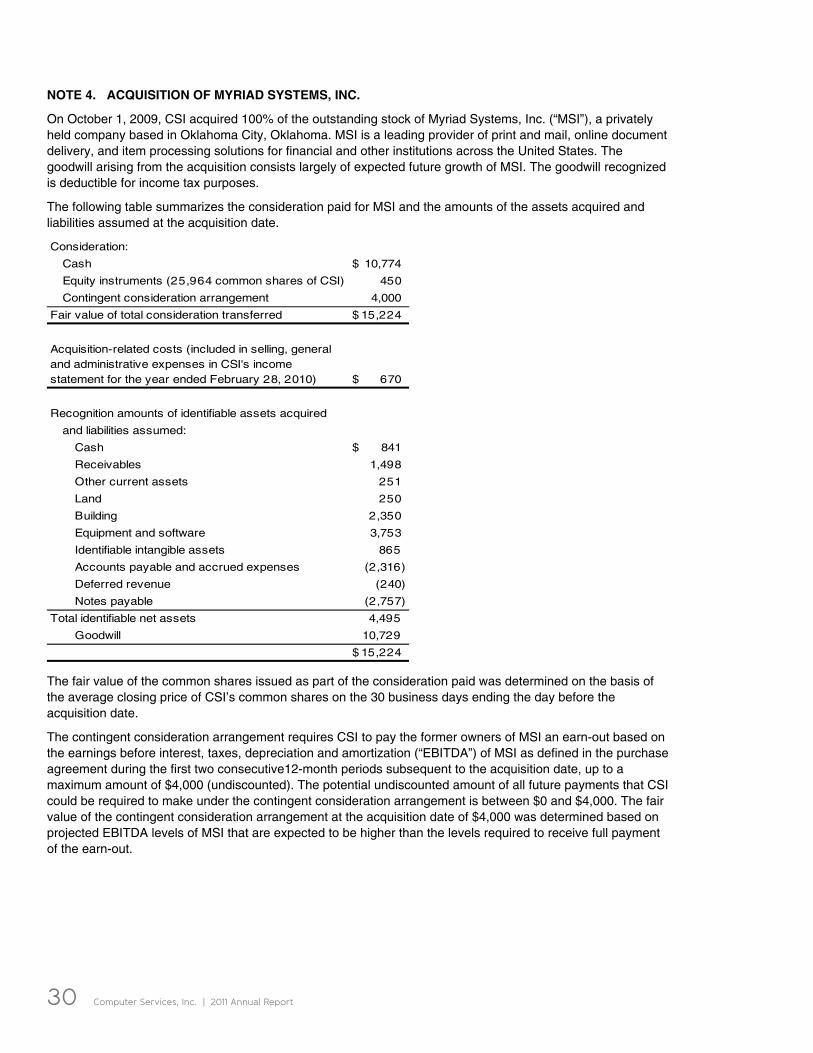
NOTE 4. ACQUISITION OF MYRIAD SYSTEMS, INC.
On October 1, 2009, CSI acquired 100% of the outstanding stock of Myriad Systems, Inc. (“MSI”), a privately held company based in Oklahoma City, Oklahoma. MSI is a leading provider of print and mail, online document delivery, and item processing solutions for financial and other institutions across the United States. The goodwill arising from the acquisition consists largely of expected future growth of MSI. The goodwill recognized is deductible for income tax purposes.
The following table summarizes the consideration paid for MSI and the amounts of the assets acquired and liabilities assumed at the acquisition date.
Consideration:
Cash 10,774$
Equity instruments (25,964 common shares of CSI) 450
Contingent consideration arrangement 4,000
Fair value of total consideration transferred 15,224$
670$
Recognition amounts of identifiable assets acquired
and liabilities assumed:
Cash 841$
Receivables 1,498
Other current assets 251
Land 250
Building 2,350
Equipment and software 3,753
Identifiable intangible assets 865
Accounts payable and accrued expenses (2,316)
Deferred revenue (240)
Notes payable (2,757)
Total identifiable net assets 4,495
Goodwill 10,729
15,224$
Acquisition-related costs (included in selling, general and administrative expenses in CSI's income statement for the year ended February 28, 2010)
The fair value of the common shares issued as part of the consideration paid was determined on the basis of the average closing price of CSI’s common shares on the 30 business days ending the day before the acquisition date.
The contingent consideration arrangement requires CSI to pay the former owners of MSI an earn-out based on the earnings before interest, taxes, depreciation and amortization (“EBITDA”) of MSI as defined in the purchase agreement during the first two consecutive12-month periods subsequent to the acquisition date, up to a maximum amount of $4,000 (undiscounted). The potential undiscounted amount of all future payments that CSI could be required to make under the contingent consideration arrangement is between $0 and $4,000. The fair value of the contingent consideration arrangement at the acquisition date of $4,000 was determined based on projected EBITDA levels of MSI that are expected to be higher than the levels required to receive full payment of the earn-out.
Computer Services, Inc. | 2011 Annual Report 31
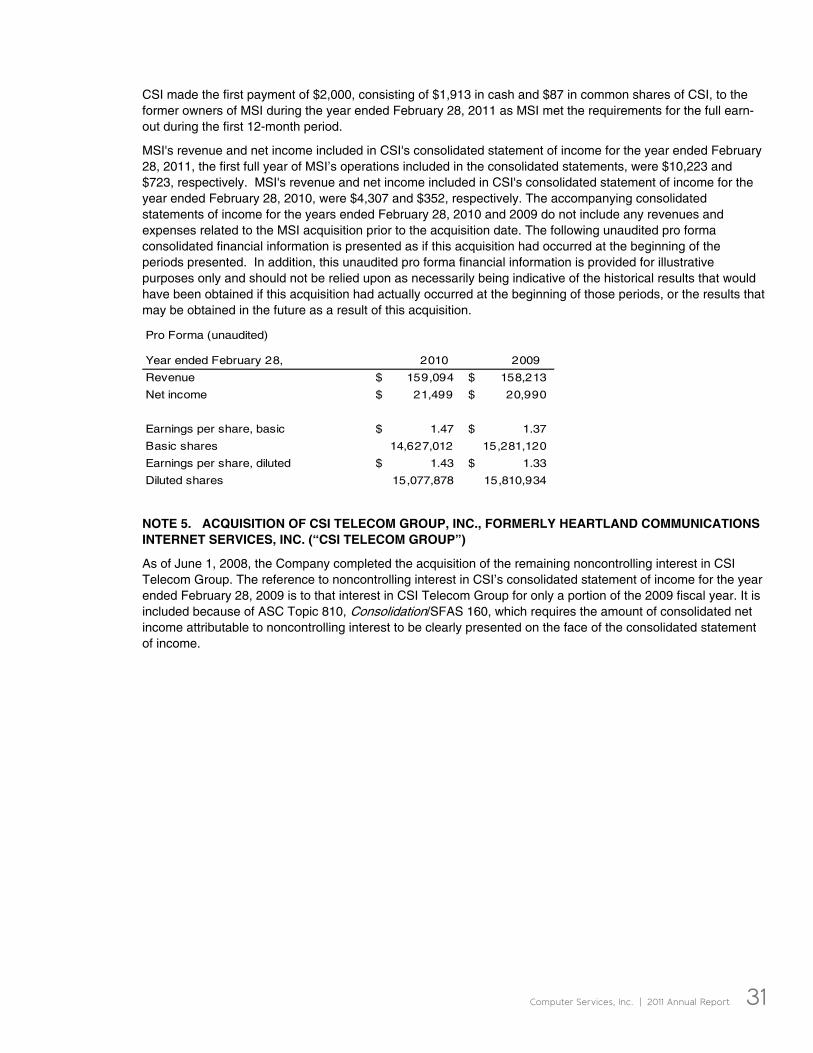
CSI made the first payment of $2,000, consisting of $1,913 in cash and $87 in common shares of CSI, to the former owners of MSI during the year ended February 28, 2011 as MSI met the requirements for the full earn-out during the first 12-month period.
MSI's revenue and net income included in CSI's consolidated statement of income for the year ended February 28, 2011, the first full year of MSI’s operations included in the consolidated statements, were $10,223 and $723, respectively. MSI's revenue and net income included in CSI's consolidated statement of income for the year ended February 28, 2010, were $4,307 and $352, respectively. The accompanying consolidated statements of income for the years ended February 28, 2010 and 2009 do not include any revenues and expenses related to the MSI acquisition prior to the acquisition date. The following unaudited pro forma consolidated financial information is presented as if this acquisition had occurred at the beginning of the periods presented. In addition, this unaudited pro forma financial information is provided for illustrative purposes only and should not be relied upon as necessarily being indicative of the historical results that would have been obtained if this acquisition had actually occurred at the beginning of those periods, or the results that may be obtained in the future as a result of this acquisition.
Pro Forma (unaudited)
Year ended February 28, 2010 2009
Revenue 159,094$ 158,213$
Net income 21,499$ 20,990$
Earnings per share, basic 1.47$ 1.37$
Basic shares 14,627,012 15,281,120
Earnings per share, diluted 1.43$ 1.33$
Diluted shares 15,077,878 15,810,934
NOTE 5. ACQUISITION OF CSI TELECOM GROUP, INC., FORMERLY HEARTLAND COMMUNICATIONS INTERNET SERVICES, INC. (“CSI TELECOM GROUP”)
As of June 1, 2008, the Company completed the acquisition of the remaining noncontrolling interest in CSI Telecom Group. The reference to noncontrolling interest in CSI’s consolidated statement of income for the year ended February 28, 2009 is to that interest in CSI Telecom Group for only a portion of the 2009 fiscal year. It is included because of ASC Topic 810, Consolidation/SFAS 160, which requires the amount of consolidated net income attributable to noncontrolling interest to be clearly presented on the face of the consolidated statement of income.
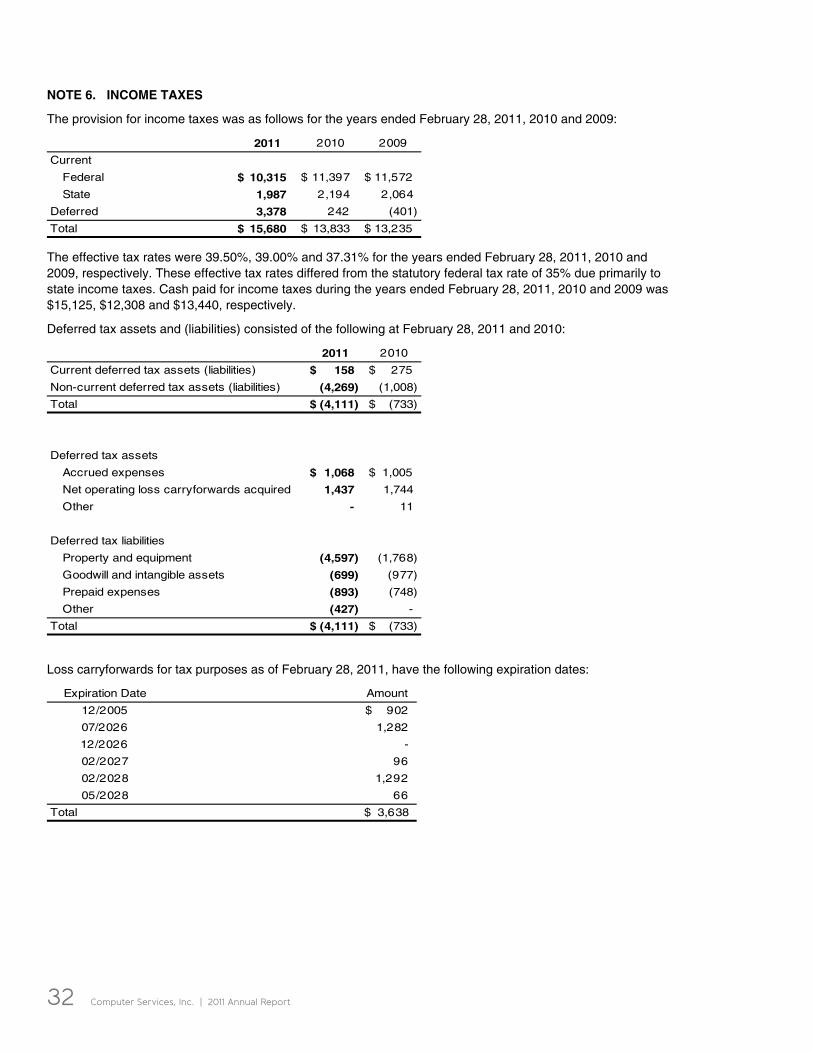
32 Computer Services, Inc. | 2011 Annual Report
NOTE 6. INCOME TAXES
The provision for income taxes was as follows for the years ended February 28, 2011, 2010 and 2009:
2011 2010 2009
Current
Federal 10,315$ 11,397$ 11,572$
State 1,987 2,194 2,064
Deferred 3,378 242 (401)
Total 15,680$ 13,833$ 13,235$
The effective tax rates were 39.50%, 39.00% and 37.31% for the years ended February 28, 2011, 2010 and 2009, respectively. These effective tax rates differed from the statutory federal tax rate of 35% due primarily to state income taxes. Cash paid for income taxes during the years ended February 28, 2011, 2010 and 2009 was $15,125, $12,308 and $13,440, respectively.
Deferred tax assets and (liabilities) consisted of the following at February 28, 2011 and 2010:
2011 2010
Current deferred tax assets (liabilities) 158$ 275$
Non-current deferred tax assets (liabilities) (4,269) (1,008)
Total (4,111)$ (733)$
Deferred tax assets
Accrued expenses 1,068$ 1,005$
Net operating loss carryforwards acquired 1,437 1,744
Other - 11
Deferred tax liabilities
Property and equipment (4,597) (1,768)
Goodwill and intangible assets (699) (977)
Prepaid expenses (893) (748)
Other (427) -
Total (4,111)$ (733)$
Loss carryforwards for tax purposes as of February 28, 2011, have the following expiration dates:
Expiration Date Amount
12/2005 902$
07/2026 1,282
12/2026 -
02/2027 96
02/2028 1,292
05/2028 66
Total 3,638$
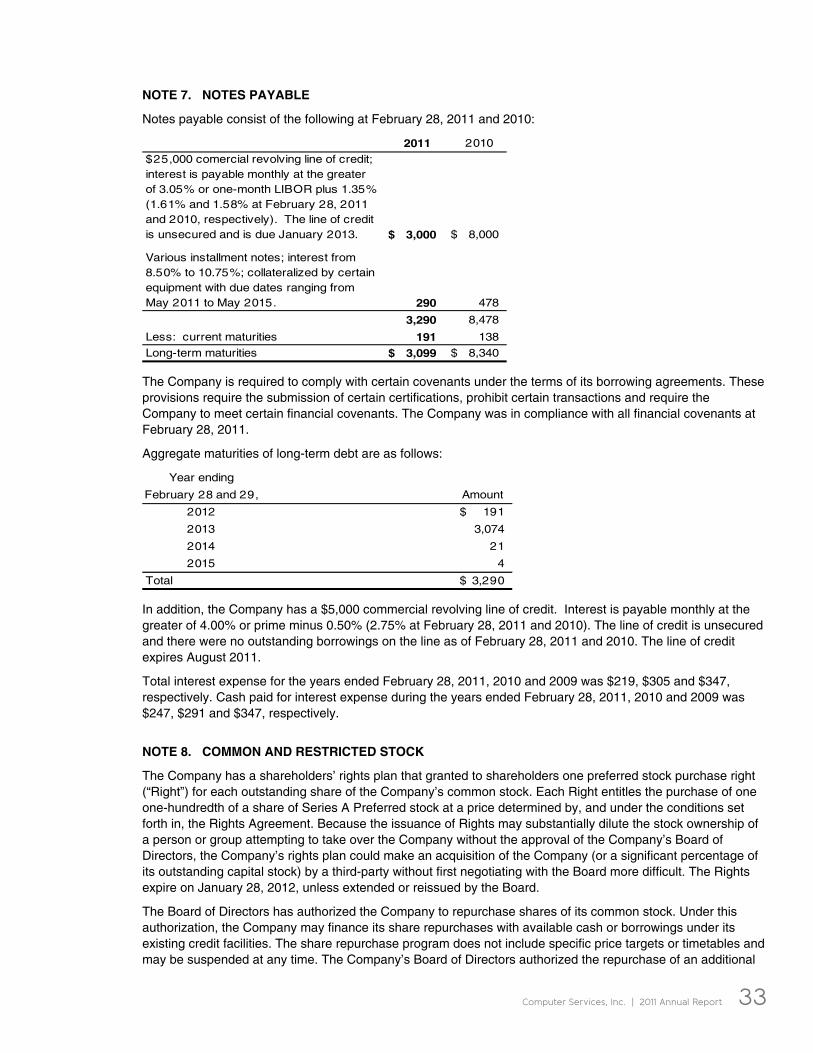
NOTE 7. NOTES PAYABLE
Notes payable consist of the following at February 28, 2011 and 2010:
2011 2010
$25,000 comercial revolving line of credit; interest is payable monthly at the greater of 3.05% or one-month LIBOR plus 1.35% (1.61% and 1.58% at February 28, 2011 and 2010, respectively). The line of credit is unsecured and is due January 2013. 3,000$ 8,000$
Various installment notes; interest from 8.50% to 10.75%; collateralized by certain equipment with due dates ranging from May 2011 to May 2015. 290 478
3,290 8,478
Less: current maturities 191 138
Long-term maturities 3,099$ 8,340$
The Company is required to comply with certain covenants under the terms of its borrowing agreements. These provisions require the submission of certain certifications, prohibit certain transactions and require the Company to meet certain financial covenants. The Company was in compliance with all financial covenants at February 28, 2011.
Aggregate maturities of long-term debt are as follows:
Year ending
February 28 and 29, Amount
2012 191$
2013 3,074
2014 21
2015 4
Total 3,290$
In addition, the Company has a $5,000 commercial revolving line of credit. Interest is payable monthly at the greater of 4.00% or prime minus 0.50% (2.75% at February 28, 2011 and 2010). The line of credit is unsecured and there were no outstanding borrowings on the line as of February 28, 2011 and 2010. The line of credit expires August 2011.
Total interest expense for the years ended February 28, 2011, 2010 and 2009 was $219, $305 and $347, respectively. Cash paid for interest expense during the years ended February 28, 2011, 2010 and 2009 was $247, $291 and $347, respectively.
NOTE 8. COMMON AND RESTRICTED STOCK
The Company has a shareholders’ rights plan that granted to shareholders one preferred stock purchase right (“Right”) for each outstanding share of the Company’s common stock. Each Right entitles the purchase of one one-hundredth of a share of Series A Preferred stock at a price determined by, and under the conditions set forth in, the Rights Agreement. Because the issuance of Rights may substantially dilute the stock ownership of a person or group attempting to take over the Company without the approval of the Company’s Board of Directors, the Company’s rights plan could make an acquisition of the Company (or a significant percentage of its outstanding capital stock) by a third-party without first negotiating with the Board more difficult. The Rights expire on January 28, 2012, unless extended or reissued by the Board.
The Board of Directors has authorized the Company to repurchase shares of its common stock. Under this authorization, the Company may finance its share repurchases with available cash or borrowings under its existing credit facilities. The share repurchase program does not include specific price targets or timetables and may be suspended at any time. The Company’s Board of Directors authorized the repurchase of an additional
Computer Services, Inc. | 2011 Annual Report 33
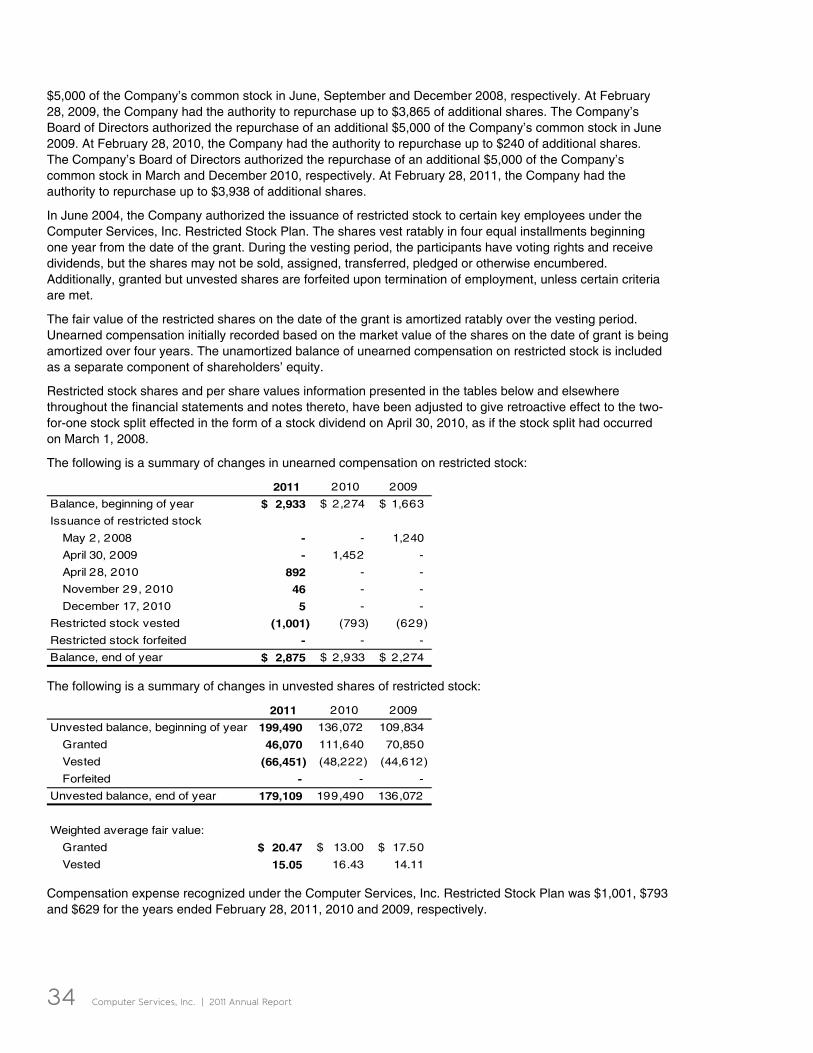
34 Computer Services, Inc. | 2011 Annual Report
$5,000 of the Company’s common stock in June, September and December 2008, respectively. At February 28, 2009, the Company had the authority to repurchase up to $3,865 of additional shares. The Company’s Board of Directors authorized the repurchase of an additional $5,000 of the Company’s common stock in June 2009. At February 28, 2010, the Company had the authority to repurchase up to $240 of additional shares. The Company’s Board of Directors authorized the repurchase of an additional $5,000 of the Company’s common stock in March and December 2010, respectively. At February 28, 2011, the Company had the authority to repurchase up to $3,938 of additional shares.
In June 2004, the Company authorized the issuance of restricted stock to certain key employees under the Computer Services, Inc. Restricted Stock Plan. The shares vest ratably in four equal installments beginning one year from the date of the grant. During the vesting period, the participants have voting rights and receive dividends, but the shares may not be sold, assigned, transferred, pledged or otherwise encumbered. Additionally, granted but unvested shares are forfeited upon termination of employment, unless certain criteria are met.
The fair value of the restricted shares on the date of the grant is amortized ratably over the vesting period. Unearned compensation initially recorded based on the market value of the shares on the date of grant is being amortized over four years. The unamortized balance of unearned compensation on restricted stock is included as a separate component of shareholders’ equity.
Restricted stock shares and per share values information presented in the tables below and elsewhere throughout the financial statements and notes thereto, have been adjusted to give retroactive effect to the two-for-one stock split effected in the form of a stock dividend on April 30, 2010, as if the stock split had occurred on March 1, 2008.
The following is a summary of changes in unearned compensation on restricted stock:
2011 2010 2009
Balance, beginning of year 2,933$ 2,274$ 1,663$
Issuance of restricted stock
May 2, 2008 - - 1,240
April 30, 2009 - 1,452 -
April 28, 2010 892 - -
November 29, 2010 46 - -
December 17, 2010 5 - -
Restricted stock vested (1,001) (793) (629)
Restricted stock forfeited - - -
Balance, end of year 2,875$ 2,933$ 2,274$
The following is a summary of changes in unvested shares of restricted stock:
2011 2010 2009
Unvested balance, beginning of year 199,490 136,072 109,834
Granted 46,070 111,640 70,850
Vested (66,451) (48,222) (44,612)
Forfeited - - -
Unvested balance, end of year 179,109 199,490 136,072
Weighted average fair value:
Granted 20.47$ 13.00$ 17.50$
Vested 15.05 16.43 14.11
Compensation expense recognized under the Computer Services, Inc. Restricted Stock Plan was $1,001, $793 and $629 for the years ended February 28, 2011, 2010 and 2009, respectively.
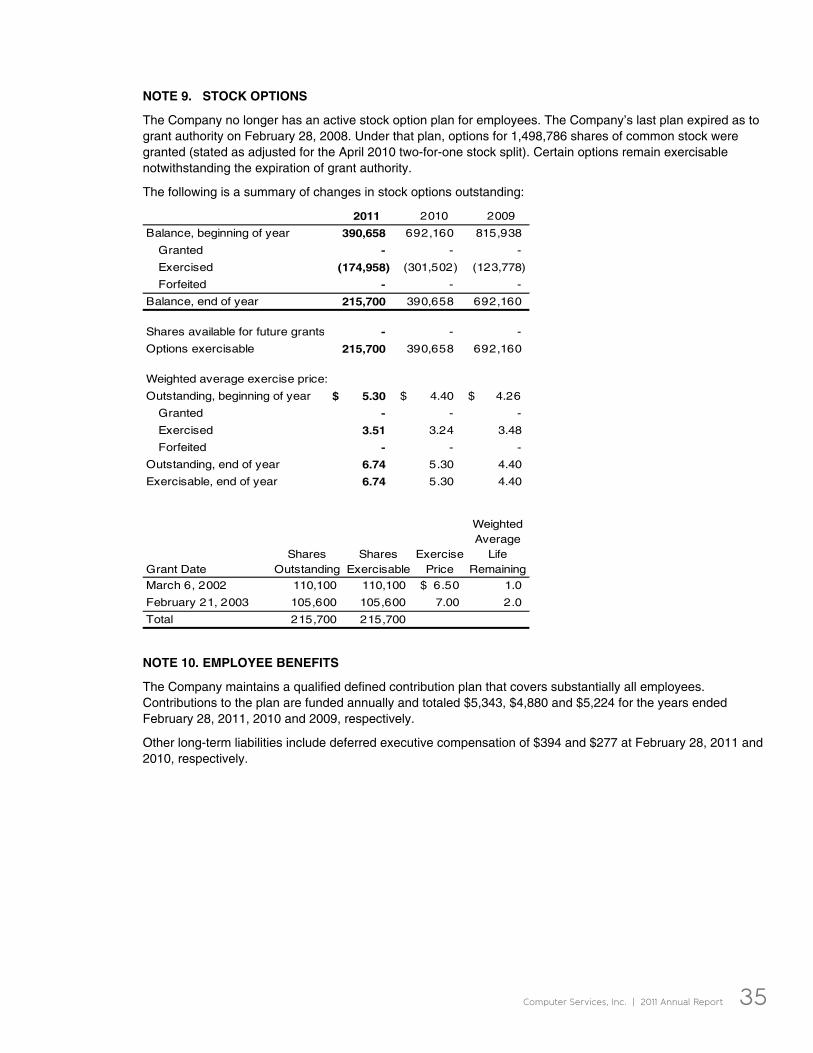
Computer Services, Inc. | 2011 Annual Report 35
NOTE 9. STOCK OPTIONS
The Company no longer has an active stock option plan for employees. The Company’s last plan expired as to grant authority on February 28, 2008. Under that plan, options for 1,498,786 shares of common stock were granted (stated as adjusted for the April 2010 two-for-one stock split). Certain options remain exercisable notwithstanding the expiration of grant authority.
The following is a summary of changes in stock options outstanding:
2011 2010 2009
Balance, beginning of year 390,658 692,160 815,938
Granted - - -
Exercised (174,958) (301,502) (123,778)
Forfeited - - -
Balance, end of year 215,700 390,658 692,160
Shares available for future grants - - -
Options exercisable 215,700 390,658 692,160
Weighted average exercise price:
Outstanding, beginning of year 5.30$ 4.40$ 4.26$
Granted - - -
Exercised 3.51 3.24 3.48
Forfeited - - -
Outstanding, end of year 6.74 5.30 4.40
Exercisable, end of year 6.74 5.30 4.40
Grant DateShares
OutstandingShares
ExercisableExercise
Price
Weighted Average
Life Remaining
March 6, 2002 110,100 110,100 6.50$ 1.0
February 21, 2003 105,600 105,600 7.00 2.0
Total 215,700 215,700
NOTE 10. EMPLOYEE BENEFITS
The Company maintains a qualified defined contribution plan that covers substantially all employees. Contributions to the plan are funded annually and totaled $5,343, $4,880 and $5,224 for the years ended February 28, 2011, 2010 and 2009, respectively.
Other long-term liabilities include deferred executive compensation of $394 and $277 at February 28, 2011 and 2010, respectively.
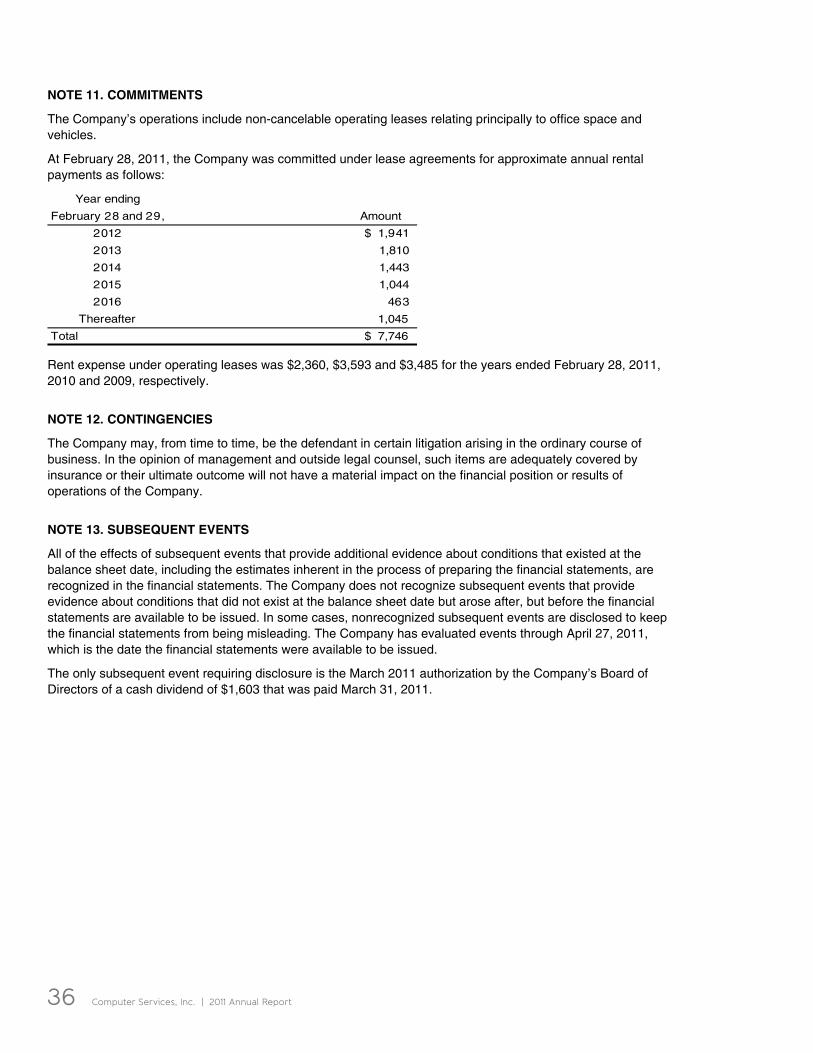
36 Computer Services, Inc. | 2011 Annual Report
NOTE 11. COMMITMENTS
The Company’s operations include non-cancelable operating leases relating principally to office space and vehicles.
At February 28, 2011, the Company was committed under lease agreements for approximate annual rental payments as follows:
Year ending
February 28 and 29, Amount
2012 1,941$
2013 1,810
2014 1,443
2015 1,044
2016 463
Thereafter 1,045
Total 7,746$
Rent expense under operating leases was $2,360, $3,593 and $3,485 for the years ended February 28, 2011, 2010 and 2009, respectively.
NOTE 12. CONTINGENCIES
The Company may, from time to time, be the defendant in certain litigation arising in the ordinary course of business. In the opinion of management and outside legal counsel, such items are adequately covered by insurance or their ultimate outcome will not have a material impact on the financial position or results of operations of the Company.
NOTE 13. SUBSEQUENT EVENTS
All of the effects of subsequent events that provide additional evidence about conditions that existed at the balance sheet date, including the estimates inherent in the process of preparing the financial statements, are recognized in the financial statements. The Company does not recognize subsequent events that provide evidence about conditions that did not exist at the balance sheet date but arose after, but before the financial statements are available to be issued. In some cases, nonrecognized subsequent events are disclosed to keep the financial statements from being misleading. The Company has evaluated events through April 27, 2011, which is the date the financial statements were available to be issued.
The only subsequent event requiring disclosure is the March 2011 authorization by the Company’s Board of Directors of a cash dividend of $1,603 that was paid March 31, 2011.
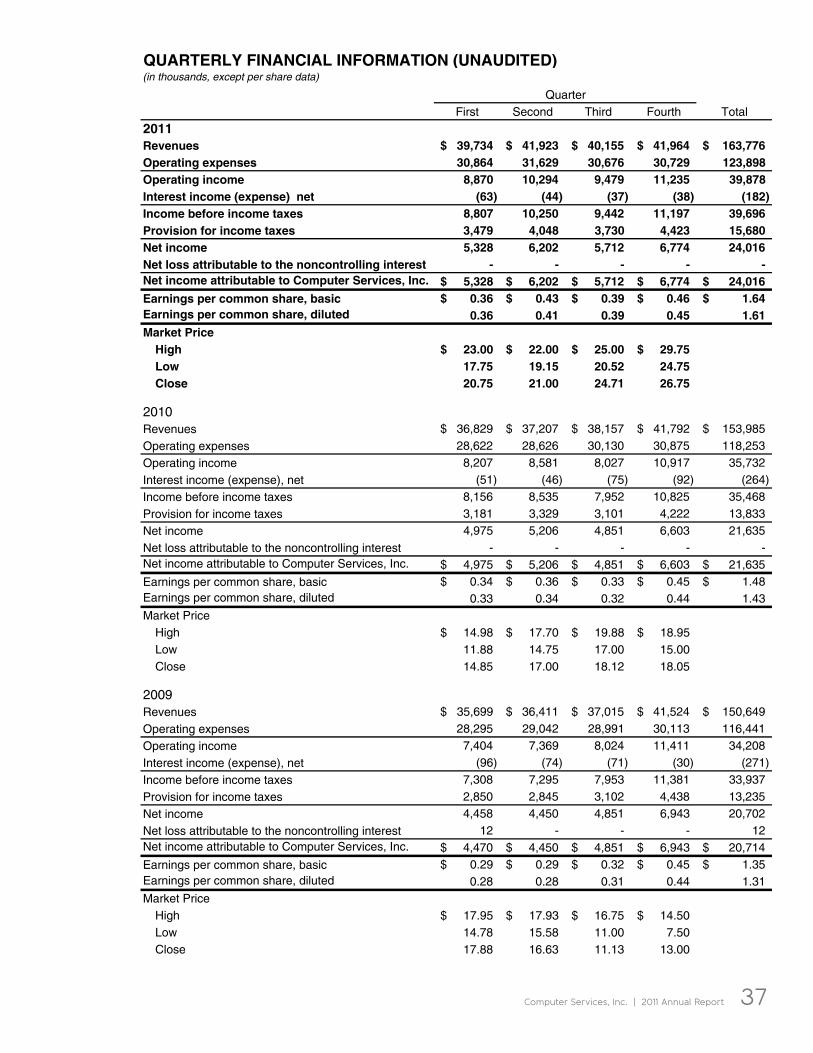
Computer Services, Inc. | 2011 Annual Report 37
QUARTERLY FINANCIAL INFORMATION (UNAUDITED)(in thousands, except per share data)
First Second Third Fourth Total
2011Revenues 39,734$ 41,923$ 40,155$ 41,964$ 163,776$ Operating expenses 30,864 31,629 30,676 30,729 123,898 Operating income 8,870 10,294 9,479 11,235 39,878 Interest income (expense) net (63) (44) (37) (38) (182) Income before income taxes 8,807 10,250 9,442 11,197 39,696 Provision for income taxes 3,479 4,048 3,730 4,423 15,680 Net income 5,328 6,202 5,712 6,774 24,016 Net loss attributable to the noncontrolling interest - - - - - Net income attributable to Computer Services, Inc. 5,328$ 6,202$ 5,712$ 6,774$ 24,016$ Earnings per common share, basic 0.36$ 0.43$ 0.39$ 0.46$ 1.64$ Earnings per common share, diluted 0.36 0.41 0.39 0.45 1.61 Market Price
High 23.00$ 22.00$ 25.00$ 29.75$ Low 17.75 19.15 20.52 24.75 Close 20.75 21.00 24.71 26.75
Quarter
QUARTERL FINANCIAL INFORMATION (UNAUDITED)(i th t h t )
First Second Third Fourth Tot l
2011Re enues 3 734$ 41 23$ 4 155$ 41 4$ 1 3 77$
perating expenses 30 86 31 629 30 676 30 729 123 898 perating income 8 87 1 2 4 47 11 235 3 878
Interest income (expense) net ( 3) (44) (37) (38) (182) Income before income taxes 8 8 7 1 25 442 11 1 7 3 Pro ision for income taxes 3 79 0 8 3 730 23 15 680 N t i 5 328 2 2 5 712 774 24 1 Net loss attributable to the noncontrolling interest Net income attributable to omputer Ser ices Inc 5 328$ 2 2$ 5 712$ 774$ 24 1$ Earnings per common share basic 3$ 43$ 3$ 4$ 1 4$ Earnings per common share diluted 0 36 0 1 0 39 0 5 1 61 Market Price
High 23$ 22$ 25$ 2 75$ Lo 17 75 1 15 2 52 24 75 Cl 20 75 21 00 2 71 26 75
2010Revenues 36,829$ 37,207$ 38,157$ 41,792$ 153,985$
Operating expenses 28,622 28,626 30,130 30,875 118,253
Operating income 8,207 8,581 8,027 10,917 35,732
Interest income (expense), net (51) (46) (75) (92) (264)
Income before income taxes 8,156 8,535 7,952 10,825 35,468
Provision for income taxes 3,181 3,329 3,101 4,222 13,833
Net income 4,975 5,206 4,851 6,603 21,635
Net loss attributable to the noncontrolling interest - - - - - Net income attributable to Computer Services, Inc. 4,975$ 5,206$ 4,851$ 6,603$ 21,635$
Earnings per common share, basic 0.34$ 0.36$ 0.33$ 0.45$ 1.48$ Earnings per common share, diluted 0.33 0.34 0.32 0.44 1.43 Market Price
High 14.98$ 17.70$ 19.88$ 18.95$ Low 11.88 14.75 17.00 15.00 Close 14.85 17.00 18.12 18.05
Q t
( )(in thousa ds excep per share data)
d
Re Op rating 3 4 31 2 3 76 3 29 123 8 8
perating inc me 8 870 1 294 4 11 235 3 8 8 I t in ( ( 3 ( 7 (38 (1 2 Incom efore i come taxe 8 7 50 442 1 7 6 Pr v si for i om t xes 3 47 4 048 3 73 23 15 8
t incom 5 328 6 202 5 12 6 774 4 016 et l ss tt
Net income ttrib ta l t om te S rv s In E i i 3$ 43$ 9$ 6$ 1 4$ Earnings per c mm n share dil te 3 41 3 45 1 61 M t P i
High L w 17 75 19 15 20 52 24 5
l s 5 1 0 24 71 26 5
201036 829$ 3 20$ 38 15$ 1 92$ 153 985$
O t g 2 22 2 2 3 13 3 5 11 253
Oper ting inco e 2 5 1 2 1 1 35 32
Interest inco e (expense net (51 (4 ( 5 ( 2 (264
Inco e before inco e t xes 8 156 8 535 952 10 825 35 68
f t 3 1 1 3 32 3 1 1 4 222 13 33
Net inco e 4 5 5 2 4 51 3 21 35
Net loss ttribut ble to the noncontrolling interest Net inco e ttribut ble to Co puter Ser ices Inc 9 5$ 5 206$ 851$ 6 603$ 21 635$
E g b 0 3$ 0 36$ 0 33$ 0 5$ 1 8$ E g l t 33 34 32 44 1 43 M rket Price
H g 1 98$ 1 0$ 19 88$ 18 95$ L 11 88 1 5 1 00 15 00 Close 14 5 1 1 12 1 5
2009Revenues 35,699$ 36,411$ 37,015$ 41,524$ 150,649$
Operating expenses 28,295 29,042 28,991 30,113 116,441
Operating income 7,404 7,369 8,024 11,411 34,208
Interest income (expense), net (96) (74) (71) (30) (271)
Income before income taxes 7,308 7,295 7,953 11,381 33,937
Provision for income taxes 2,850 2,845 3,102 4,438 13,235
Net income 4,458 4,450 4,851 6,943 20,702
Net loss attributable to the noncontrolling interest 12 - - - 12 Net income attributable to Computer Services, Inc. 4,470$ 4,450$ 4,851$ 6,943$ 20,714$
Earnings per common share, basic 0.29$ 0.29$ 0.32$ 0.45$ 1.35$ Earnings per common share, diluted 0.28 0.28 0.31 0.44 1.31 Market Price
High 17.95$ 17.93$ 16.75$ 14.50$ Low 14.78 15.58 11.00 7.50 Close 17.88 16.63 11.13 13.00
38 Computer Services, Inc. | 2011 Annual Report 38 Computer Services, Inc. | 2011 Annual Report
Annual Shareholders Meeting CSI Corporate Headquarters3901 Technology DrivePaducah, Kentucky
Thursday, June 23, 20119:00 a.m. CDT
Join the live webcast at www.csiweb.com.
Shareholder InquiriesCommunications regarding stock holdings, stock certificates, dividend payments, changes of address, consolidation of accounts, transfers of ownership or other stock matters may be directed to BNY Mellon Shareowner Services.
Transfer AgentBNY Mellon Shareowner ServicesPO Box 358015Pittsburgh, PA 15252-8015
or
480 Washington BoulevardJersey City, NJ 07310-1900
Telephone: 888.213.0965
TDD for Hearing Impaired: 800.231.5469
www.bnymellon.com/shareowner/isd
Investor Relations The Computer Services, Inc. annual report, quarterly reports, press releases and current stock price information are available on the Company’s home page at www.csiweb.com. Visitors to our Web site may use the email updates option to automatically receive electronic notification of company announcements. Prospective investors, securities analysts, portfolio managers and representatives of financial institutions seeking these reports or other information regarding the Company may contact:
David L. Simon, Treasurer & CFOComputer Services, Inc.3901 Technology DrivePaducah, KY 42001-5201
Telephone: 270.442.7361, ext. 10126
Fax: 270.575.6716
Email: [email protected]
Common StockComputer Services, Inc. has over 3,000 shareholders based on the number of record holders of the Company’s common stock and an estimate of the number of individual participants represented by security position listings. The Company’s common stock is traded on the Premier QX tier of the Pink OTC Markets (www.otcqx.com) under the symbol CSVI. Quarterly dividends on Computer Services, Inc.common stock, when declared by the Board of Directors, are paid on or about March 31, June 25, September 25, and December 26. The Company does not currently offer a dividend reinvestment program.
Investor Information