Embed Size (px)
Citation preview

CRYSTAL REPORTS XI FOR MIMSY XG
A practical guide
Crystal Reports XI User Guide

S E L A G O D E S I G N
Crystal Reports XI User Guide
for Mimsy XG
Copyright and Photocopying Notice
Copyright 2010 by Selago Design.
All Rights Reserved.
This book is copyrighted and all rights are reserved. This document may not, in whole or in part, be copied, photocopied, reproduced, translated, or reduced to any electronic medium or machine readable form without prior consent in writing from Willoughby Press with the following exception:
Licensees of Mimsy XG may make as many copies as needed for in-house use only but may not distribute this manual or any portion of this manual in any form whatsoever to third parties.
Version A
September 2010

TABLE OF CONTENTS
Table of Contents
Chapter 1 - Introduction .......................................................................................................3 How Crystal Reports Works ...............................................................................................4 Start Page .........................................................................................................................4 Report Screen ...................................................................................................................4
Chapter 2 - Report Wizard ....................................................................................................7 Create a New Report with the Wizard ................................................................................8
Chapter 3 - Blank Reports ................................................................................................... 17 Quick Start: Blank Reports ............................................................................................... 18 Blank Reports .................................................................................................................. 19
Chapter 4 - Links ................................................................................................................ 27 What is a Link? ............................................................................................................... 28 Link Types ....................................................................................................................... 29 Enforce Join and Link Type ............................................................................................... 31 Creating a Table Link ....................................................................................................... 31 Common Links ................................................................................................................. 33
Chapter 5 - Report Formatting in Design View..................................................................... 35 Design View at a Glance .................................................................................................. 36 Report Style .................................................................................................................... 40 Text Block ....................................................................................................................... 42 Floating ........................................................................................................................... 43 Stacked ........................................................................................................................... 44 Sections .......................................................................................................................... 44
Chapter 6 - Save, Export, and Print Your Reports ................................................................. 49 Saving Reports ................................................................................................................ 50 Exporting Report as PDF, DOC, or XML ............................................................................. 50 Exporting Report as XLS ................................................................................................... 52 Printing a Report ............................................................................................................. 54
Chapter 7 - Selection Criteria .............................................................................................. 55 Crystal Searching ............................................................................................................. 56 Select Expert ................................................................................................................... 56 Add Selection Criteria ...................................................................................................... 56 Revise Search Criteria ...................................................................................................... 59 Formula Editor ................................................................................................................ 59 Selection Criteria with Parameters ................................................................................... 63
Chapter 8 - Parameter Fields .............................................................................................. 65 Quick Start: Parameters................................................................................................... 66 Using Parameters ............................................................................................................ 66 Response Options ........................................................................................................... 70
Chapter 9 - Formula Fields .................................................................................................. 77 Quick Start: Formulas ...................................................................................................... 78 Formula Workshop .......................................................................................................... 78 Create a Formula Field using Crystal Formulas .................................................................. 80 Create a Formula Field using SQL Expressions .................................................................. 81 Add the Formula Field to the Report ................................................................................ 82
Chapter 10 - Sub-reports .................................................................................................... 83

TABLE OF CONTENTS
1-2
Quick Start: Subreports ................................................................................................... 84 Adding a Subreport ......................................................................................................... 84 Changing Subreport Links ................................................................................................ 88 Deleting a Subreport ....................................................................................................... 88 Formatting a Subreport ................................................................................................... 88
Chapter 11 - Grouping ........................................................................................................ 89 Add a Group .................................................................................................................... 90 Record Hierarchies .......................................................................................................... 91
Chapter 12 - Common Questions ......................................................................................... 93 Add a Count to a Report .................................................................................................. 94 Add a Sum....................................................................................................................... 94 Page Numbering .............................................................................................................. 95 Format Currency ............................................................................................................. 95 Format Numbers ............................................................................................................. 96 Reformat Dates ............................................................................................................... 97 Signature at Bottom of Page ............................................................................................ 98 Add Brief Bio to a Report ................................................................................................. 98 Display Individual Measurements as Fractions ................................................................. 99 Reverse Name Format ..................................................................................................... 99 Concatenate Fields with a Semicolon ............................................................................. 100 Print Multiple Columns .................................................................................................. 100 Print 1 Item on a Page, Otherwise See Attached List ....................................................... 101 How Do I Turn Off Automatic Linking? ........................................................................... 104
Chapter 13 - Reporting with Images.................................................................................. 105 Images .......................................................................................................................... 106 Common Imaging Questions .......................................................................................... 111
Chapter 14 - Create A Connection to Mimsy XG ................................................................. 117 Oracle Server Connection .............................................................................................. 118 ODBC / RDO Connection to Mimsy XG ........................................................................... 120
INTRODUCTION
3
Chapter 1 - Introduction
This illustrated guide will take you through the most commonly used parts of Crystal Reports so you can begin reporting on your data quickly and with confidence.
How Crystal Reports Works
Welcome Screen
Pull Down Menus
Report Design Definitions
This guide is intended for novice users, people who need review with Crystal Reports, and people who have used reporting tools other than Crystal Reports. It is illustrated using Crystal Reports XI, so your screens may look a bit different than the examples pictured.
INTRODUCTION
4
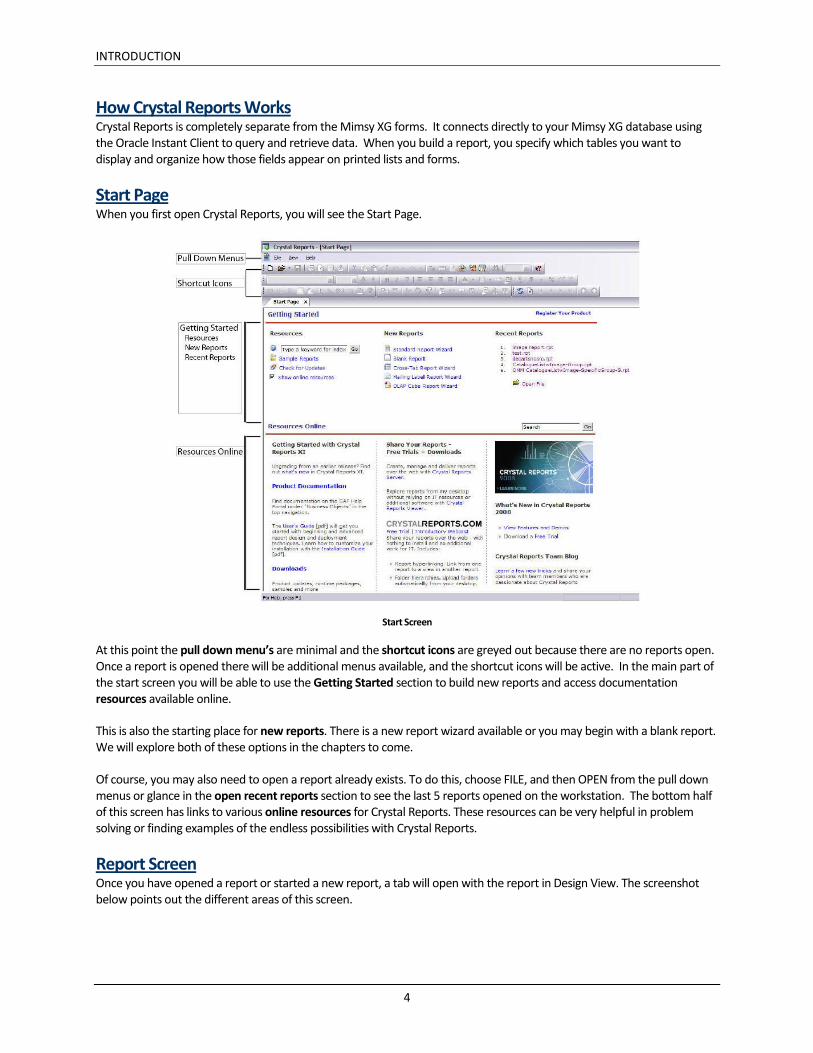
How Crystal Reports Works Crystal Reports is completely separate from the Mimsy XG forms. It connects directly to your Mimsy XG database using the Oracle Instant Client to query and retrieve data. When you build a report, you specify which tables you want to display and organize how those fields appear on printed lists and forms.
Start Page When you first open Crystal Reports, you will see the Start Page.
Start Screen
At this point the pull down menu’s are minimal and the shortcut icons are greyed out because there are no reports open. Once a report is opened there will be additional menus available, and the shortcut icons will be active. In the main part of the start screen you will be able to use the Getting Started section to build new reports and access documentation resources available online.
This is also the starting place for new reports. There is a new report wizard available or you may begin with a blank report. We will explore both of these options in the chapters to come.
Of course, you may also need to open a report already exists. To do this, choose FILE, and then OPEN from the pull down menus or glance in the open recent reports section to see the last 5 reports opened on the workstation. The bottom half of this screen has links to various online resources for Crystal Reports. These resources can be very helpful in problem solving or finding examples of the endless possibilities with Crystal Reports.
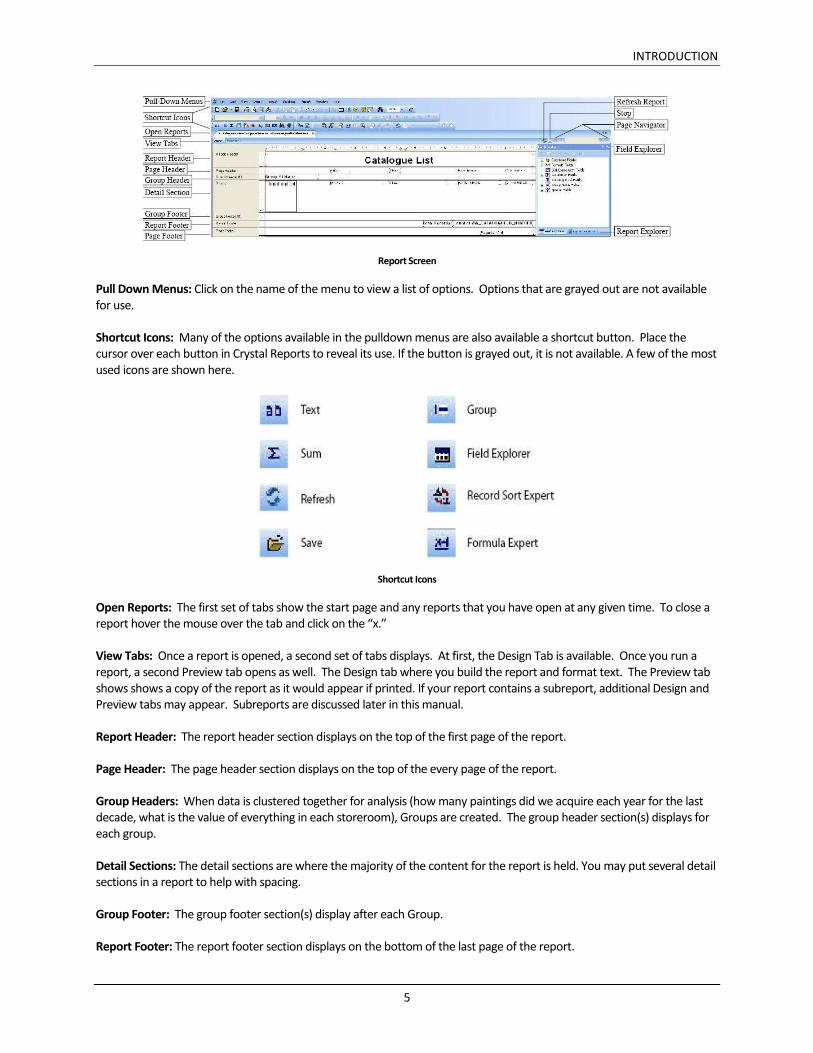
Report Screen Once you have opened a report or started a new report, a tab will open with the report in Design View. The screenshot below points out the different areas of this screen.
INTRODUCTION
5
Report Screen
Pull Down Menus: Click on the name of the menu to view a list of options. Options that are grayed out are not available for use.
Shortcut Icons: Many of the options available in the pulldown menus are also available a shortcut button. Place the cursor over each button in Crystal Reports to reveal its use. If the button is grayed out, it is not available. A few of the most used icons are shown here.
Shortcut Icons
Open Reports: The first set of tabs show the start page and any reports that you have open at any given time. To close a report hover the mouse over the tab and click on the “x.”
View Tabs: Once a report is opened, a second set of tabs displays. At first, the Design Tab is available. Once you run a report, a second Preview tab opens as well. The Design tab where you build the report and format text. The Preview tab shows shows a copy of the report as it would appear if printed. If your report contains a subreport, additional Design and Preview tabs may appear. Subreports are discussed later in this manual.
Report Header: The report header section displays on the top of the first page of the report.
Page Header: The page header section displays on the top of the every page of the report.
Group Headers: When data is clustered together for analysis (how many paintings did we acquire each year for the last decade, what is the value of everything in each storeroom), Groups are created. The group header section(s) displays for each group.
Detail Sections: The detail sections are where the majority of the content for the report is held. You may put several detail sections in a report to help with spacing.
Group Footer: The group footer section(s) display after each Group.
Report Footer: The report footer section displays on the bottom of the last page of the report.
INTRODUCTION
6
Page Footer: The page footer section displays at the bottom of the every page of the report.
Refresh Report: Displays (refreshes) data in the report with the most recent database information.
Stop: Halts the current retrieval of database information and displays the data you do have in Preview. The more information being pulled from the database, the longer it will take to run the report.
Page Navigator: Use the arrows to navigate from one page to the next or to skip to the first or the last page of the report.
Field Explorer: The Field Explorer contains is like a toobox of functions you may add to your report. It includes database fields, formulas, and parameters. It is usually placed on the right side of the screen (as shown above) or just above the open reports tabs. If the Field Explorer is not visible it can be found under the View pull down menu.
Report Explorer: The Report Explorer is usually placed with the Field Explorer on the right side of the screen (as shown above) or just above the open reports tabs. If the Report Explorer is not visible it can be found under the view pull down menu. Use the Report Explorer to view the outline of the report and reorder items manually.

REPORT WIZARD
7
Chapter 2 - Report Wizard
The Report Wizard is a pre-built routine that guides you through the creation of a report. The wizard is a time-saving tool; however, it is not as flexible as building the report using a Blank Report.
Choose a Data Source
Select Table(s)
Link Table(s)
Select Fields
Apply Grouping
Add Selection Criteria
Apply a Template
Preview the Report
The example in this chapter uses a single table (VW_CATALOGUE).
REPORT WIZARD
8
Create a New Report with the Wizard The Report Wizard contains a series of prompts to guide you through the report design process. It is very handy for reports that use a single table and for designing labels of a specific size.
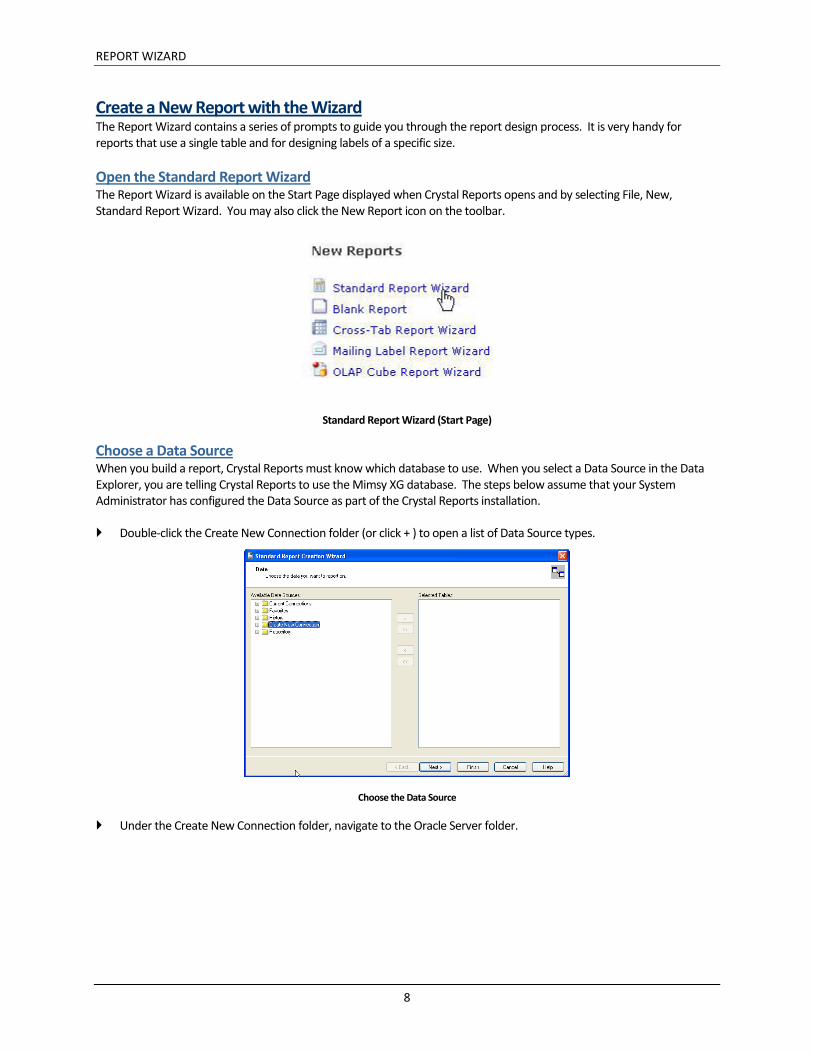
Open the Standard Report Wizard The Report Wizard is available on the Start Page displayed when Crystal Reports opens and by selecting File, New, Standard Report Wizard. You may also click the New Report icon on the toolbar.
Standard Report Wizard (Start Page)
Choose a Data Source When you build a report, Crystal Reports must know which database to use. When you select a Data Source in the Data Explorer, you are telling Crystal Reports to use the Mimsy XG database. The steps below assume that your System Administrator has configured the Data Source as part of the Crystal Reports installation.
Double-click the Create New Connection folder (or click + ) to open a list of Data Source types.
Choose the Data Source
Under the Create New Connection folder, navigate to the Oracle Server folder.
REPORT WIZARD
9
Select Oracle Server Data Source
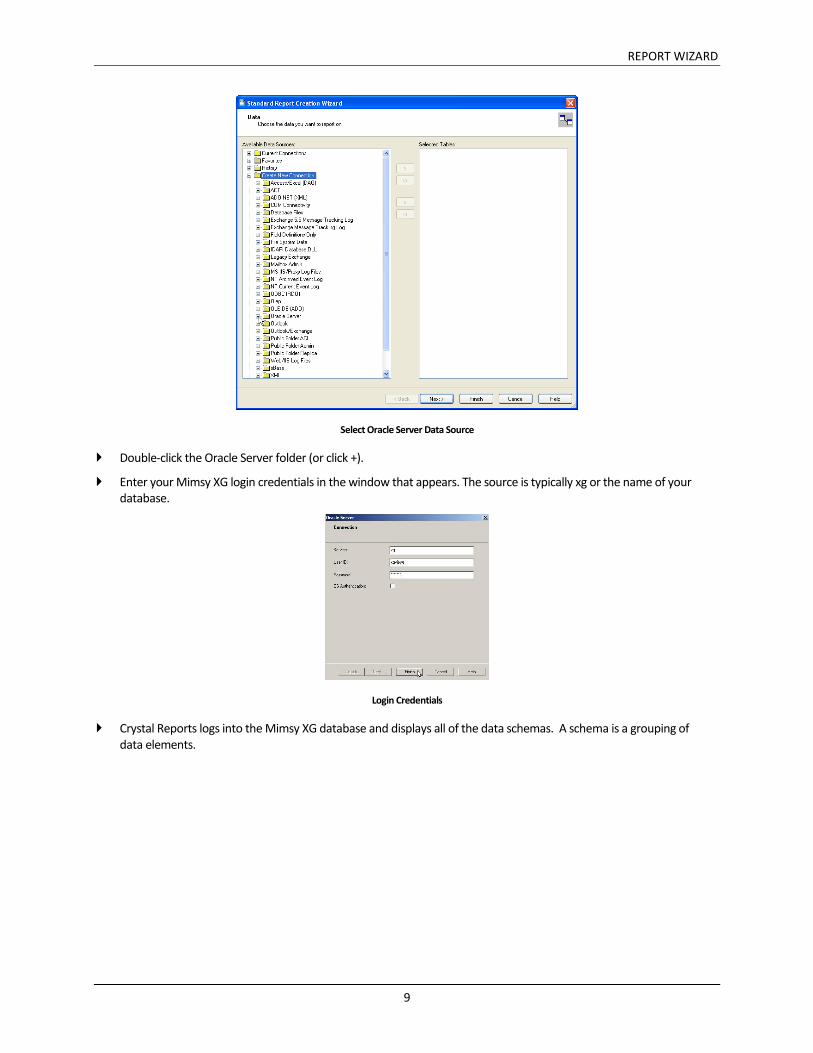
Double-click the Oracle Server folder (or click +).
Enter your Mimsy XG login credentials in the window that appears. The source is typically xg or the name of your database.
Login Credentials
Crystal Reports logs into the Mimsy XG database and displays all of the data schemas. A schema is a grouping of data elements.
REPORT WIZARD
10
Oracle Server Entry
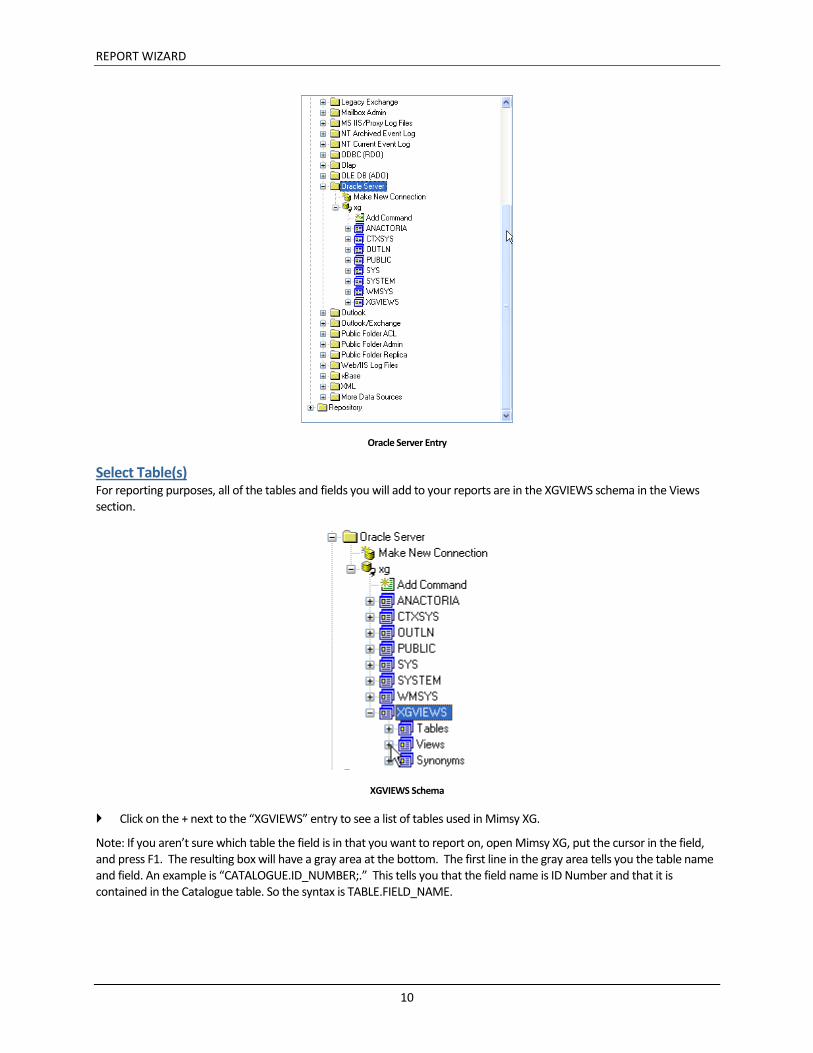
Select Table(s) For reporting purposes, all of the tables and fields you will add to your reports are in the XGVIEWS schema in the Views section.
XGVIEWS Schema
Click on the + next to the “XGVIEWS” entry to see a list of tables used in Mimsy XG.
Note: If you aren’t sure which table the field is in that you want to report on, open Mimsy XG, put the cursor in the field, and press F1. The resulting box will have a gray area at the bottom. The first line in the gray area tells you the table name and field. An example is “CATALOGUE.ID_NUMBER;.” This tells you that the field name is ID Number and that it is contained in the Catalogue table. So the syntax is TABLE.FIELD_NAME.

REPORT WIZARD
11
Choose the VW_Catalogue table and any other tables you want to report on, then press the > button to carry the tables over to the Selected Tables column. Additional information about creating reports with multiple tables is in the Linking Table chapter of this manual.
Table List
Press the “Next” button at the bottom of the Standard Report Creation Wizard.
Link Tables This example only uses a single table so the wizard skips this step. If you did select multiple tables, you will need to link the tables so that Crystal Reports will know how the tables are related. Refer to the Links chapter of this manual for instructions. After the tables are linked press the “Next” button at the bottom of the Standard Report Creation Wizard.
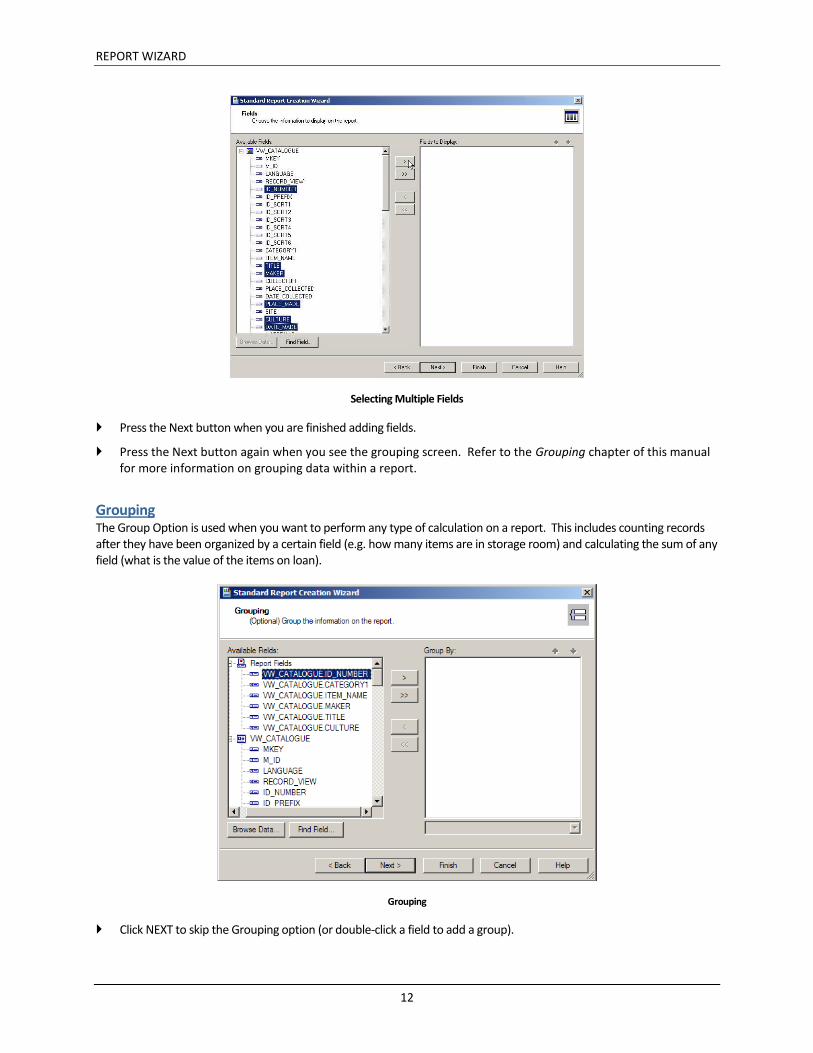
Select Fields The fields available for display on your report are determined by the table(s) you added when you began building the report.
To select fields:
Hold the CTRL key down and click on the fields you would like to display in the report. Press the > button to carry them over OR double-click each field to add them one by one.
REPORT WIZARD
12
Selecting Multiple Fields
Press the Next button when you are finished adding fields.
Press the Next button again when you see the grouping screen. Refer to the Grouping chapter of this manual for more information on grouping data within a report.
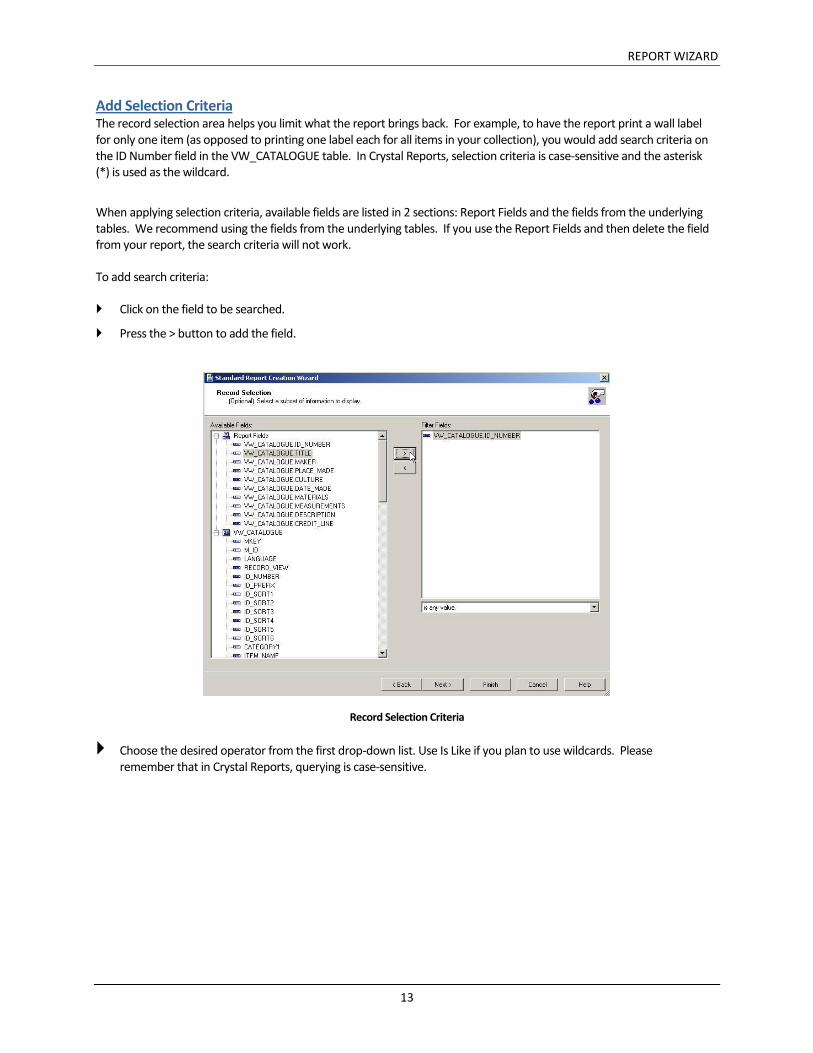
Grouping The Group Option is used when you want to perform any type of calculation on a report. This includes counting records after they have been organized by a certain field (e.g. how many items are in storage room) and calculating the sum of any field (what is the value of the items on loan).
Grouping
Click NEXT to skip the Grouping option (or double-click a field to add a group).
REPORT WIZARD
13
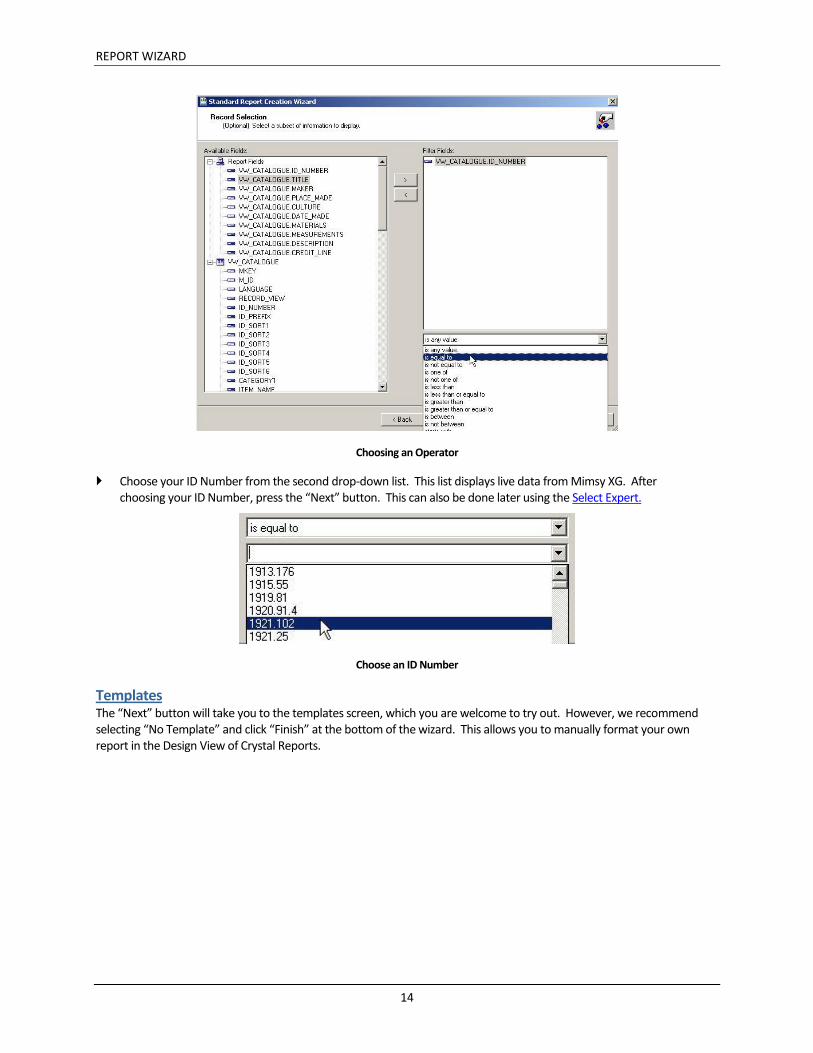
Add Selection Criteria The record selection area helps you limit what the report brings back. For example, to have the report print a wall label for only one item (as opposed to printing one label each for all items in your collection), you would add search criteria on the ID Number field in the VW_CATALOGUE table. In Crystal Reports, selection criteria is case-sensitive and the asterisk (*) is used as the wildcard.
When applying selection criteria, available fields are listed in 2 sections: Report Fields and the fields from the underlying tables. We recommend using the fields from the underlying tables. If you use the Report Fields and then delete the field from your report, the search criteria will not work.
To add search criteria:
Click on the field to be searched.
Press the > button to add the field.
Record Selection Criteria
Choose the desired operator from the first drop-down list. Use Is Like if you plan to use wildcards. Please remember that in Crystal Reports, querying is case-sensitive.
REPORT WIZARD
14
Choosing an Operator
Choose your ID Number from the second drop-down list. This list displays live data from Mimsy XG. After choosing your ID Number, press the “Next” button. This can also be done later using the Select Expert.
Choose an ID Number
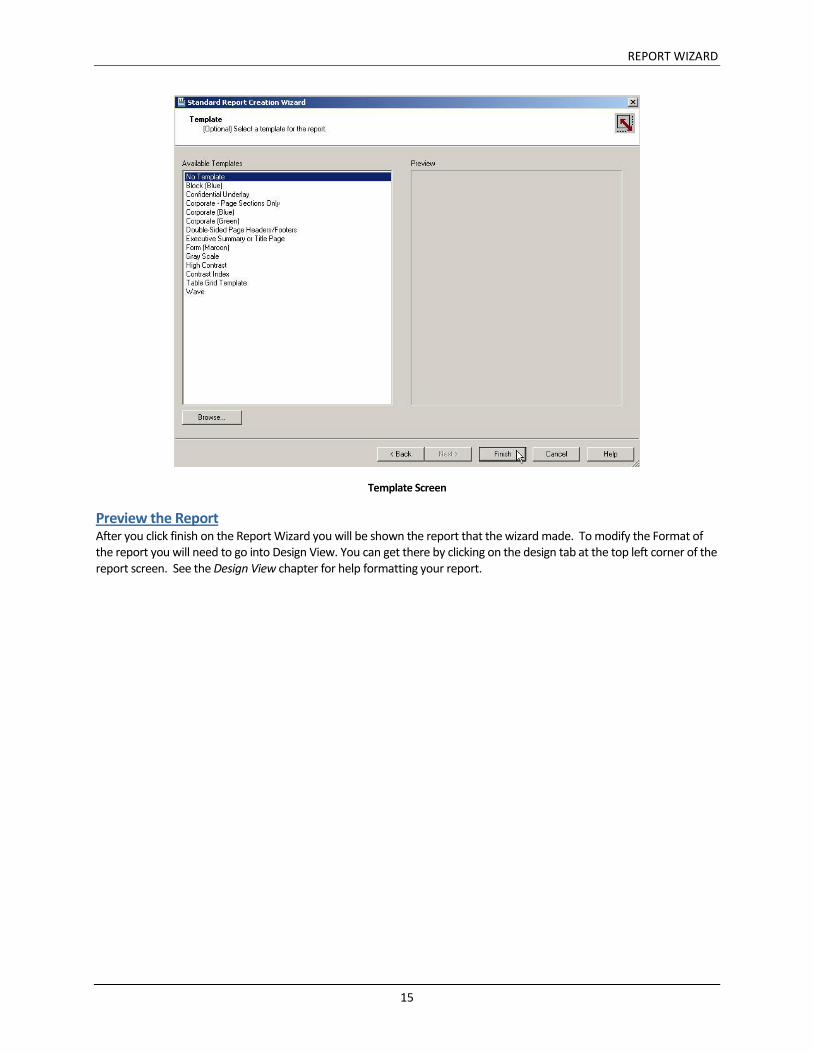
Templates The “Next” button will take you to the templates screen, which you are welcome to try out. However, we recommend selecting “No Template” and click “Finish” at the bottom of the wizard. This allows you to manually format your own report in the Design View of Crystal Reports.
REPORT WIZARD
15
Template Screen
Preview the Report After you click finish on the Report Wizard you will be shown the report that the wizard made. To modify the Format of the report you will need to go into Design View. You can get there by clicking on the design tab at the top left corner of the report screen. See the Design View chapter for help formatting your report.

BLANK REPORTS
17
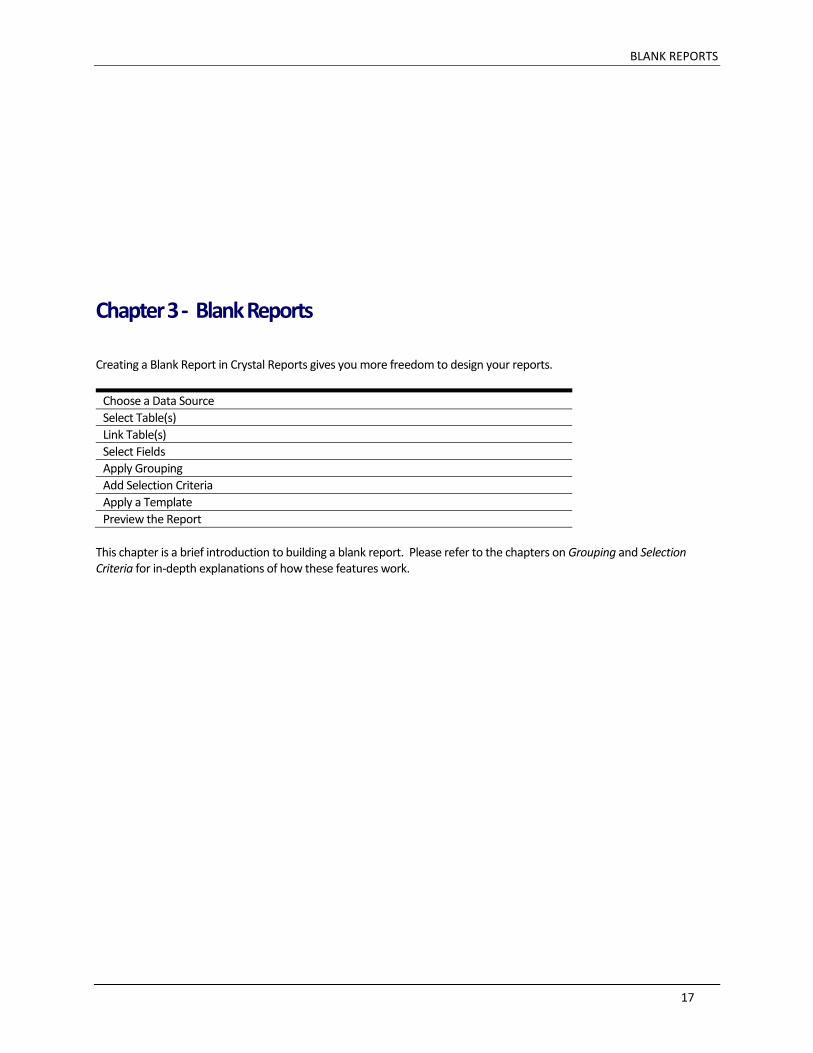
Chapter 3 - Blank Reports
Creating a Blank Report in Crystal Reports gives you more freedom to design your reports.
Choose a Data Source
Select Table(s)
Link Table(s)
Select Fields
Apply Grouping
Add Selection Criteria
Apply a Template
Preview the Report
This chapter is a brief introduction to building a blank report. Please refer to the chapters on Grouping and Selection Criteria for in-depth explanations of how these features work.
BLANK REPORTS
18
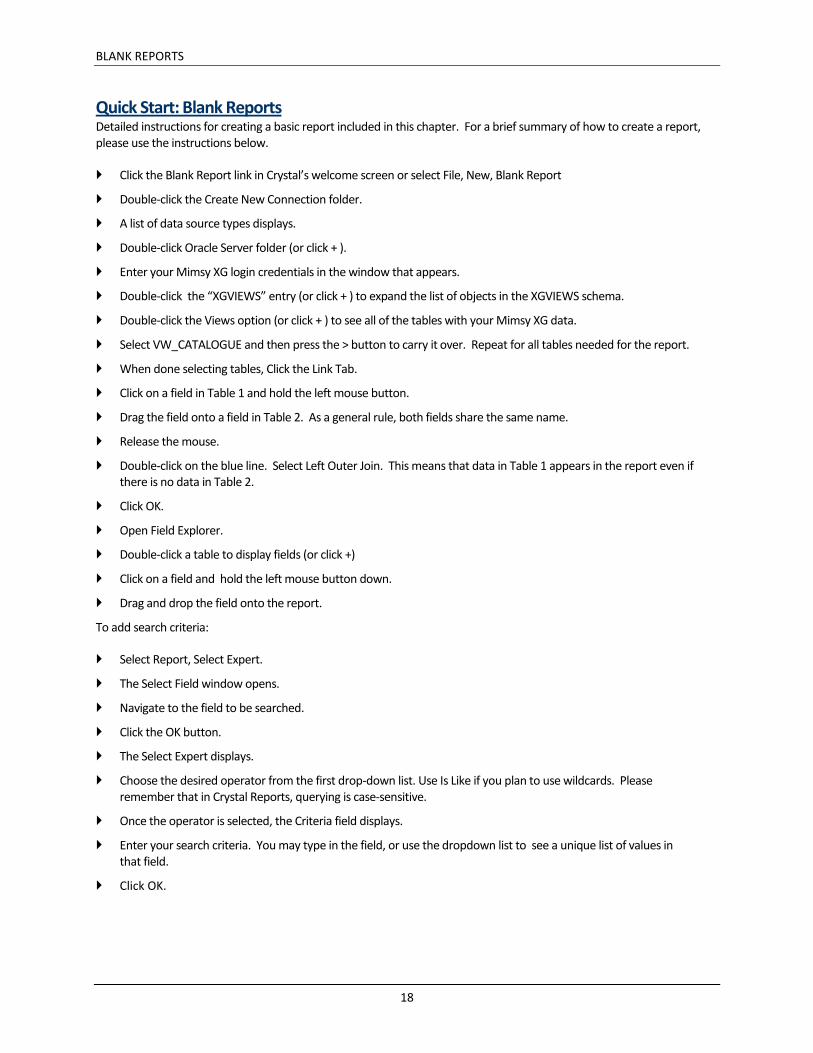
Quick Start: Blank Reports Detailed instructions for creating a basic report included in this chapter. For a brief summary of how to create a report, please use the instructions below.
Click the Blank Report link in Crystal’s welcome screen or select File, New, Blank Report
Double-click the Create New Connection folder.
A list of data source types displays.
Double-click Oracle Server folder (or click + ).
Enter your Mimsy XG login credentials in the window that appears.
Double-click the “XGVIEWS” entry (or click + ) to expand the list of objects in the XGVIEWS schema.
Double-click the Views option (or click + ) to see all of the tables with your Mimsy XG data.
Select VW_CATALOGUE and then press the > button to carry it over. Repeat for all tables needed for the report.
When done selecting tables, Click the Link Tab.
Click on a field in Table 1 and hold the left mouse button.
Drag the field onto a field in Table 2. As a general rule, both fields share the same name.
Release the mouse.
Double-click on the blue line. Select Left Outer Join. This means that data in Table 1 appears in the report even if there is no data in Table 2.
Click OK.
Open Field Explorer.
Double-click a table to display fields (or click +)
Click on a field and hold the left mouse button down.
Drag and drop the field onto the report.
To add search criteria:
Select Report, Select Expert.
The Select Field window opens.
Navigate to the field to be searched.
Click the OK button.
The Select Expert displays.
Choose the desired operator from the first drop-down list. Use Is Like if you plan to use wildcards. Please remember that in Crystal Reports, querying is case-sensitive.
Once the operator is selected, the Criteria field displays.
Enter your search criteria. You may type in the field, or use the dropdown list to see a unique list of values in that field.
Click OK.
BLANK REPORTS
19
Blank Reports Beginning with a Blank Report provides you with the opportunity to manually select your tables and add fields to your report without having to answer all of the prompts integrated into the Standard Report Wizard.
Select Blank Report The following instructions explain how to create a basic report on the Catalogue table.
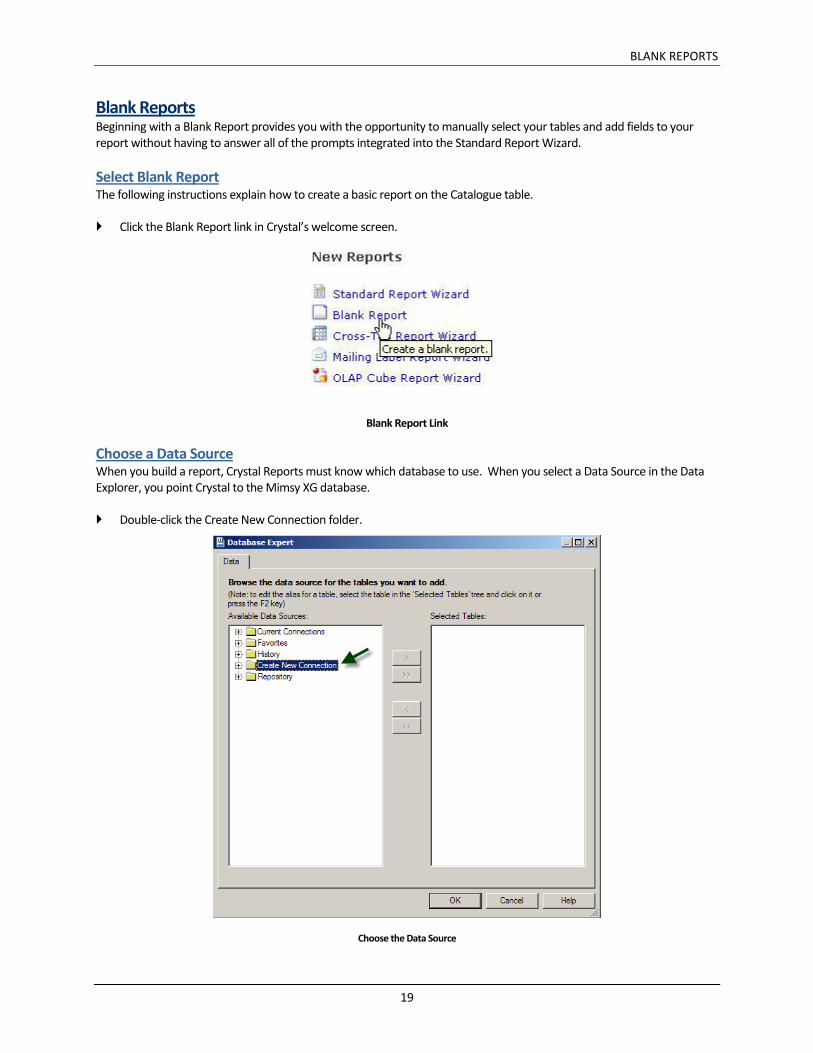
Click the Blank Report link in Crystal’s welcome screen.
Blank Report Link
Choose a Data Source When you build a report, Crystal Reports must know which database to use. When you select a Data Source in the Data Explorer, you point Crystal to the Mimsy XG database.
Double-click the Create New Connection folder.
Choose the Data Source

BLANK REPORTS
20
A list of data source types displays.
Data Source Types
Double-click Oracle Server folder (or click + ).
Enter your Mimsy XG login credentials in the window that appears.
Login Credentials
Crystal Reports logs into the Mimsy XG database and displays all of the data schemas. A schema is a grouping of data elements. All of the tables you use in Mimsy XG are part of the XGVIEWS schema.
BLANK REPORTS
21
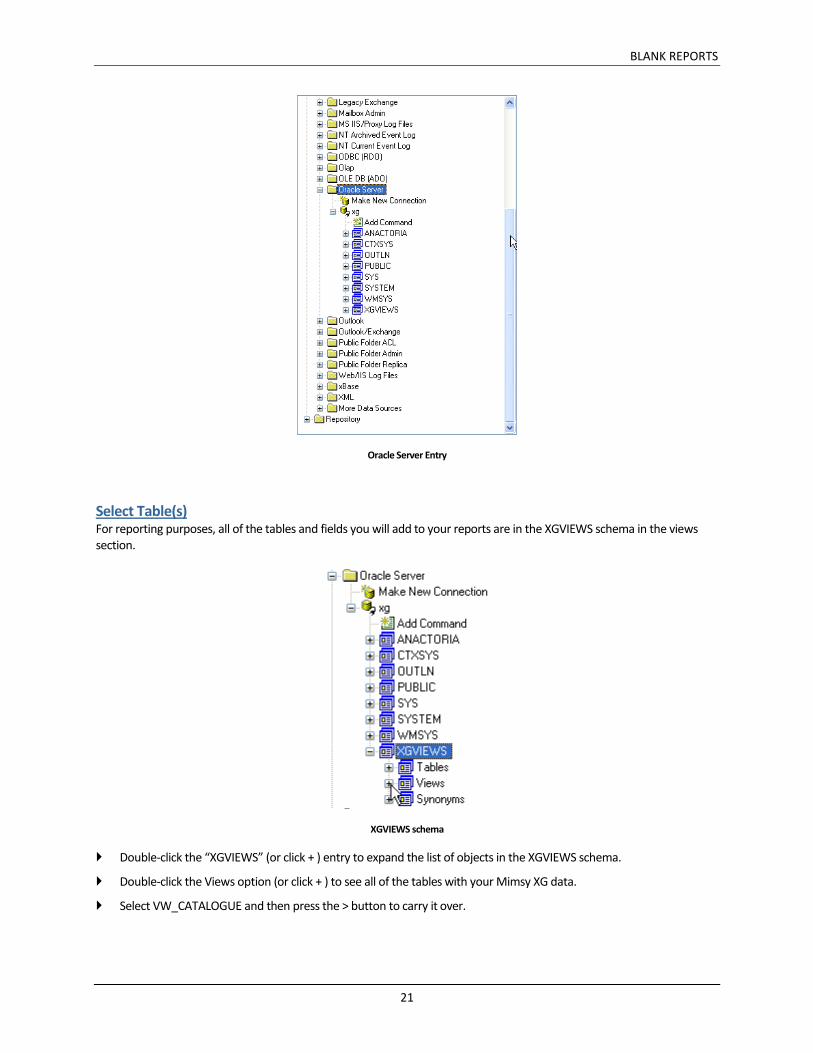
Oracle Server Entry
Select Table(s) For reporting purposes, all of the tables and fields you will add to your reports are in the XGVIEWS schema in the views section.
XGVIEWS schema
Double-click the “XGVIEWS” (or click + ) entry to expand the list of objects in the XGVIEWS schema.
Double-click the Views option (or click + ) to see all of the tables with your Mimsy XG data.
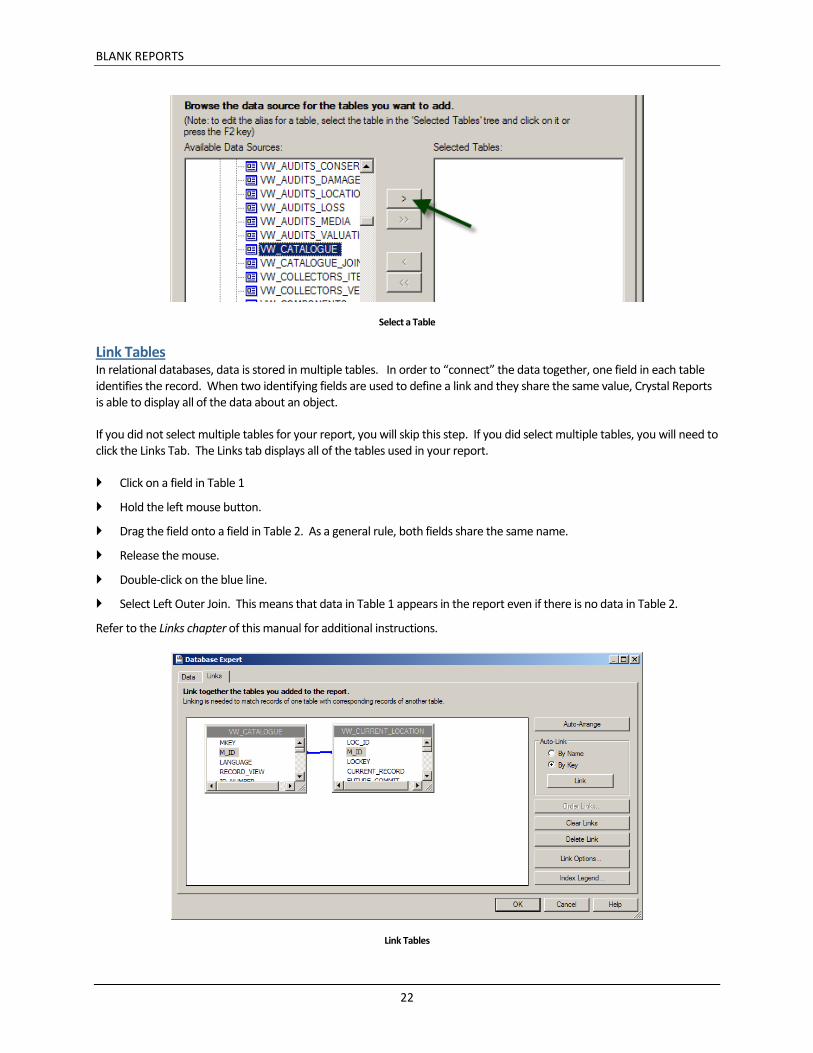
Select VW_CATALOGUE and then press the > button to carry it over.
BLANK REPORTS
22
Select a Table
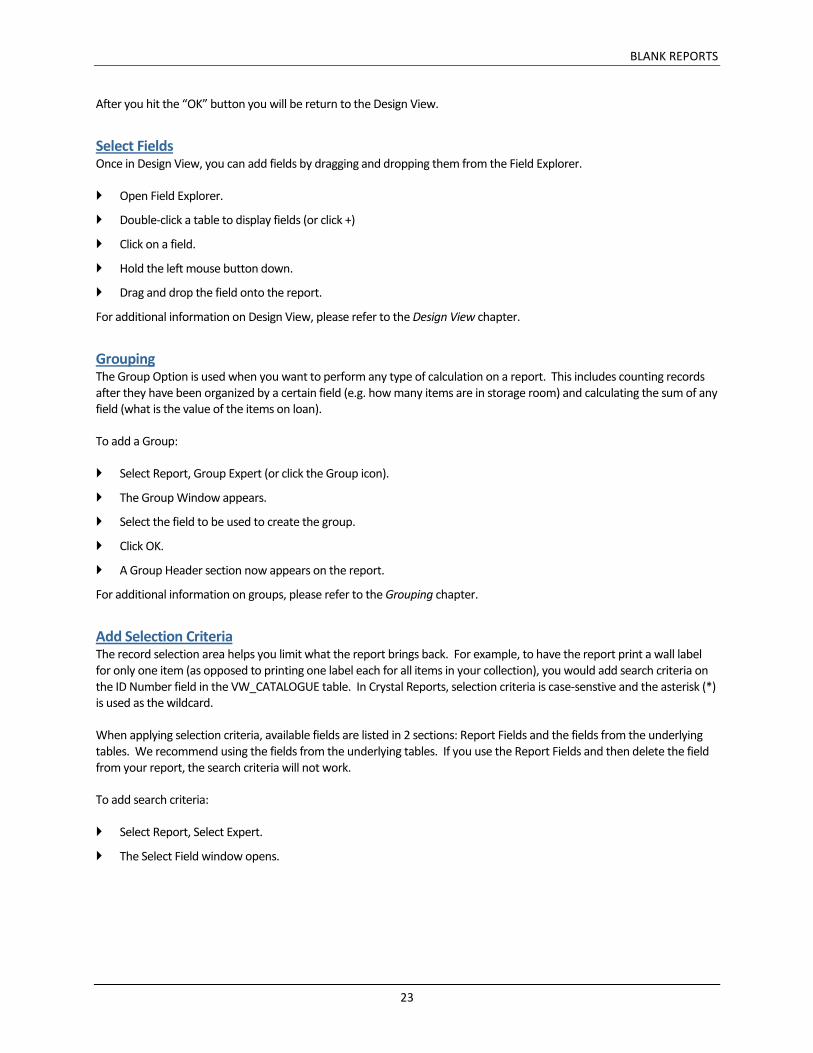
Link Tables In relational databases, data is stored in multiple tables. In order to “connect” the data together, one field in each table identifies the record. When two identifying fields are used to define a link and they share the same value, Crystal Reports is able to display all of the data about an object.
If you did not select multiple tables for your report, you will skip this step. If you did select multiple tables, you will need to click the Links Tab. The Links tab displays all of the tables used in your report.
Click on a field in Table 1
Hold the left mouse button.
Drag the field onto a field in Table 2. As a general rule, both fields share the same name.
Release the mouse.
Double-click on the blue line.
Select Left Outer Join. This means that data in Table 1 appears in the report even if there is no data in Table 2.
Refer to the Links chapter of this manual for additional instructions.
Link Tables
BLANK REPORTS
23
After you hit the “OK” button you will be return to the Design View.
Select Fields Once in Design View, you can add fields by dragging and dropping them from the Field Explorer.
Open Field Explorer.
Double-click a table to display fields (or click +)
Click on a field.
Hold the left mouse button down.
Drag and drop the field onto the report.
For additional information on Design View, please refer to the Design View chapter.
Grouping The Group Option is used when you want to perform any type of calculation on a report. This includes counting records after they have been organized by a certain field (e.g. how many items are in storage room) and calculating the sum of any field (what is the value of the items on loan).
To add a Group:
Select Report, Group Expert (or click the Group icon).
The Group Window appears.
Select the field to be used to create the group.
Click OK.
A Group Header section now appears on the report.
For additional information on groups, please refer to the Grouping chapter.
Add Selection Criteria The record selection area helps you limit what the report brings back. For example, to have the report print a wall label for only one item (as opposed to printing one label each for all items in your collection), you would add search criteria on the ID Number field in the VW_CATALOGUE table. In Crystal Reports, selection criteria is case-senstive and the asterisk (*) is used as the wildcard.
When applying selection criteria, available fields are listed in 2 sections: Report Fields and the fields from the underlying tables. We recommend using the fields from the underlying tables. If you use the Report Fields and then delete the field from your report, the search criteria will not work.
To add search criteria:
Select Report, Select Expert.
The Select Field window opens.

BLANK REPORTS
24
Select Expert
Navigate to the field to be searched.
Click the OK button.
The Select Expert displays.
Record Selection Criteria
Choose the desired operator from the first drop-down list. Use Is Like if you plan to use wildcards. Please remember that in Crystal Reports, querying is case-sensitive.
Once the operator is selected, the Criteria field displays.
Enter your search criteria. You may type in the field, or use the dropdown list to see a unique list of values in that field.
Choose an ID Number

BLANK REPORTS
25
Click OK.
Preview the Report After you have added all of the fields, click the Refresh Button to preview your report. You can go back to Design View to add, delete or edit the fields as many times as you wish.


LINKS
27
Chapter 4 - Links
Many reports that you will create in Crystal require more than one table. For example, you may need to display a list of loans and associated items. This requires including the parent and the child tables in the report. Tables can be added while creating a report, or they may be added long after the report has been made.
Link Definition
Link Types
Creating a Link
Also included in this chapter is a listing of common links. For a an extended linking guide, please visit the Selago Design Support site (support.selagodesign.com) and download the Link Appendix.
LINKS
28
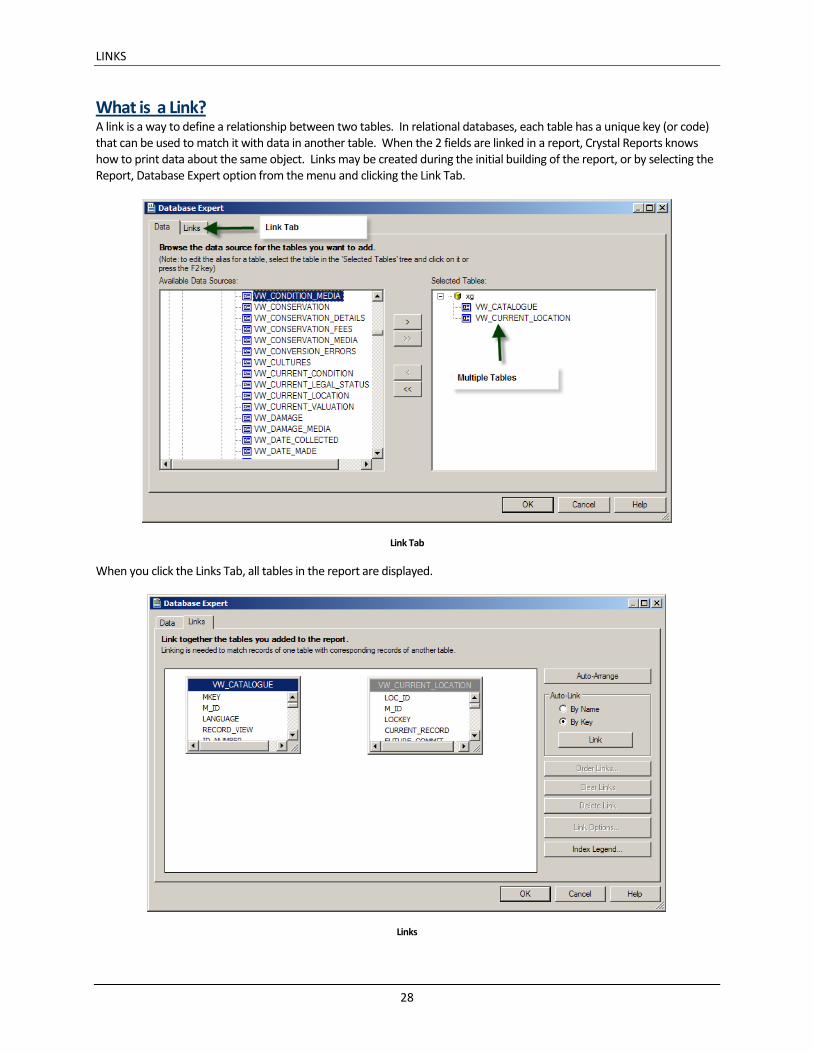
What is a Link? A link is a way to define a relationship between two tables. In relational databases, each table has a unique key (or code) that can be used to match it with data in another table. When the 2 fields are linked in a report, Crystal Reports knows how to print data about the same object. Links may be created during the initial building of the report, or by selecting the Report, Database Expert option from the menu and clicking the Link Tab.
Link Tab
When you click the Links Tab, all tables in the report are displayed.
Links
LINKS
29
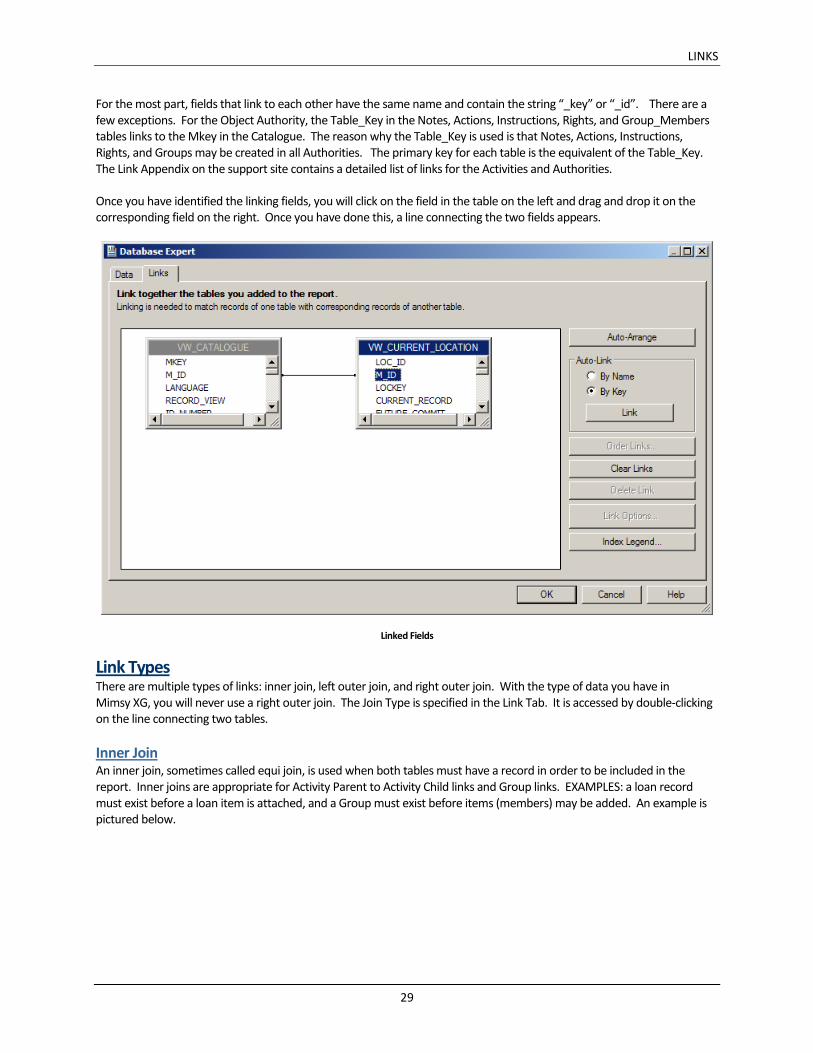
For the most part, fields that link to each other have the same name and contain the string “_key” or “_id”. There are a few exceptions. For the Object Authority, the Table_Key in the Notes, Actions, Instructions, Rights, and Group_Members tables links to the Mkey in the Catalogue. The reason why the Table_Key is used is that Notes, Actions, Instructions, Rights, and Groups may be created in all Authorities. The primary key for each table is the equivalent of the Table_Key. The Link Appendix on the support site contains a detailed list of links for the Activities and Authorities.
Once you have identified the linking fields, you will click on the field in the table on the left and drag and drop it on the corresponding field on the right. Once you have done this, a line connecting the two fields appears.
Linked Fields
Link Types There are multiple types of links: inner join, left outer join, and right outer join. With the type of data you have in Mimsy XG, you will never use a right outer join. The Join Type is specified in the Link Tab. It is accessed by double-clicking on the line connecting two tables.
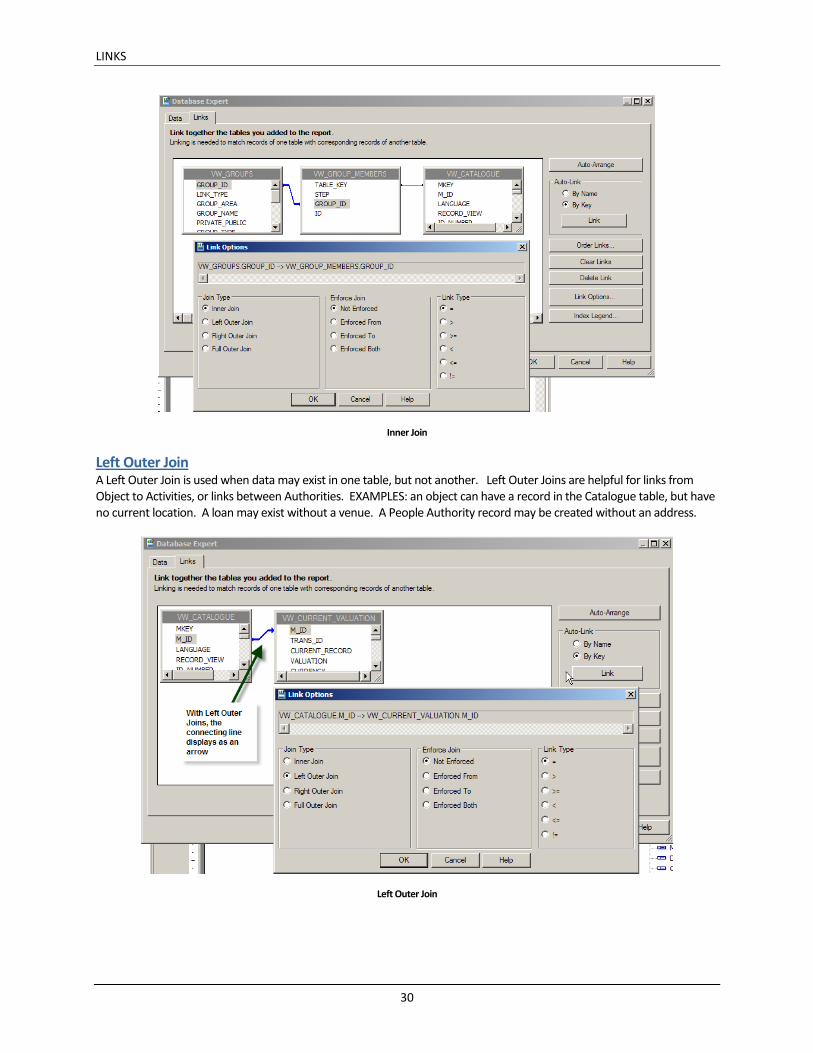
Inner Join An inner join, sometimes called equi join, is used when both tables must have a record in order to be included in the report. Inner joins are appropriate for Activity Parent to Activity Child links and Group links. EXAMPLES: a loan record must exist before a loan item is attached, and a Group must exist before items (members) may be added. An example is pictured below.
LINKS
30
Inner Join
Left Outer Join A Left Outer Join is used when data may exist in one table, but not another. Left Outer Joins are helpful for links from Object to Activities, or links between Authorities. EXAMPLES: an object can have a record in the Catalogue table, but have no current location. A loan may exist without a venue. A People Authority record may be created without an address.
Left Outer Join
LINKS
31
Enforce Join and Link Type Please accept the defaults for these two options. You will not use these features in the types of reports you are building. They control the underlying select statements for the tables.
Creating a Table Link Links will only be made if there are 2 or more tables in a report. You can add tables when you begin creating your report, or you can add the table after the fact via the Database Expert.
To create a link:
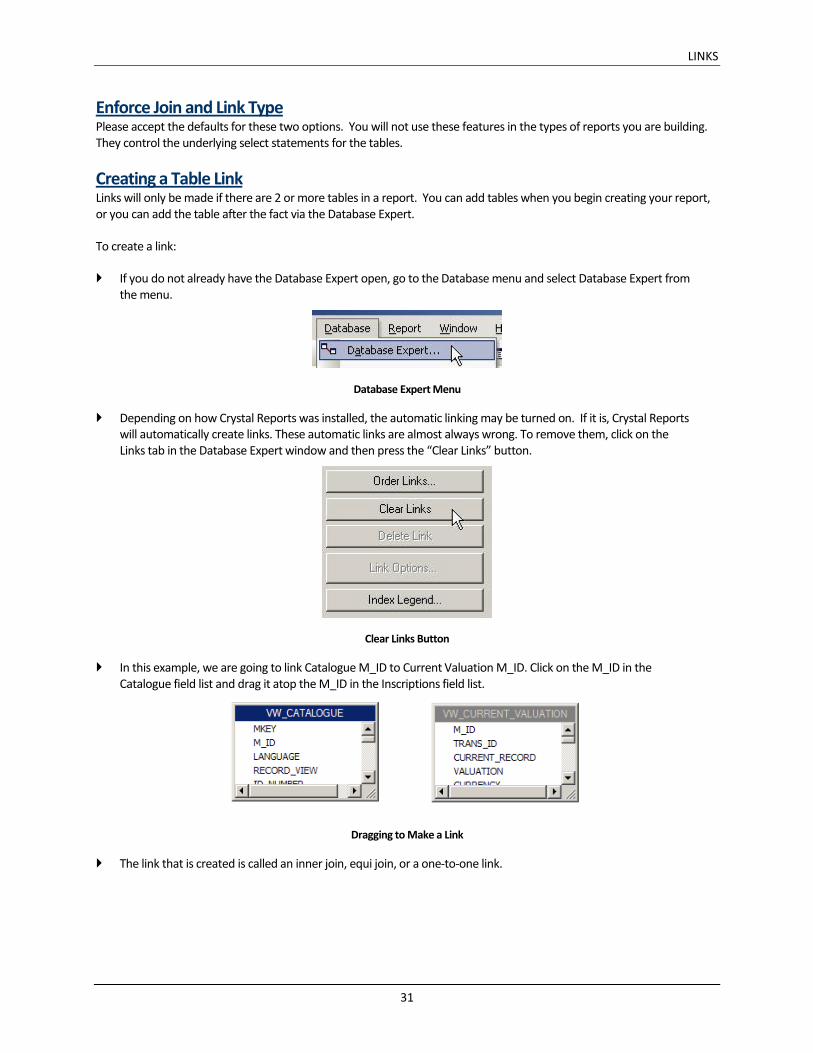
If you do not already have the Database Expert open, go to the Database menu and select Database Expert from the menu.
Database Expert Menu
Depending on how Crystal Reports was installed, the automatic linking may be turned on. If it is, Crystal Reports will automatically create links. These automatic links are almost always wrong. To remove them, click on the Links tab in the Database Expert window and then press the “Clear Links” button.
Clear Links Button
In this example, we are going to link Catalogue M_ID to Current Valuation M_ID. Click on the M_ID in the Catalogue field list and drag it atop the M_ID in the Inscriptions field list.
Dragging to Make a Link
The link that is created is called an inner join, equi join, or a one-to-one link.
LINKS
32
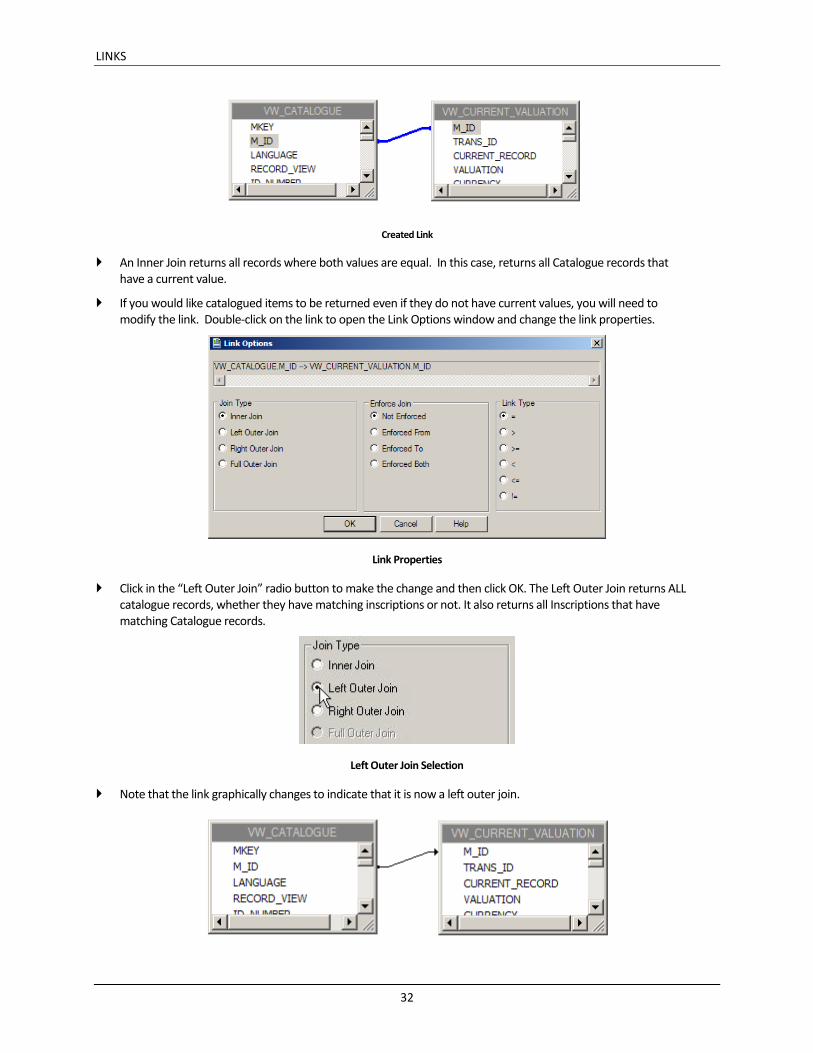
Created Link
An Inner Join returns all records where both values are equal. In this case, returns all Catalogue records that have a current value.
If you would like catalogued items to be returned even if they do not have current values, you will need to modify the link. Double-click on the link to open the Link Options window and change the link properties.
Link Properties
Click in the “Left Outer Join” radio button to make the change and then click OK. The Left Outer Join returns ALL catalogue records, whether they have matching inscriptions or not. It also returns all Inscriptions that have matching Catalogue records.
Left Outer Join Selection
Note that the link graphically changes to indicate that it is now a left outer join.
LINKS
33
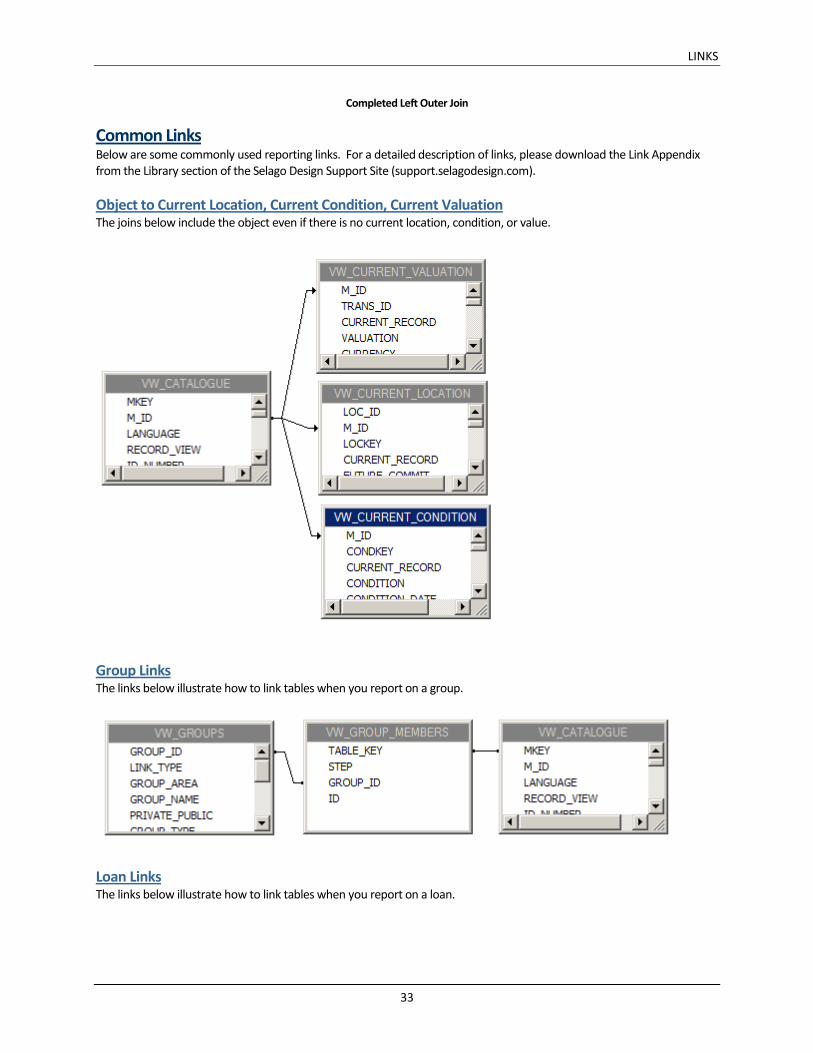
Completed Left Outer Join
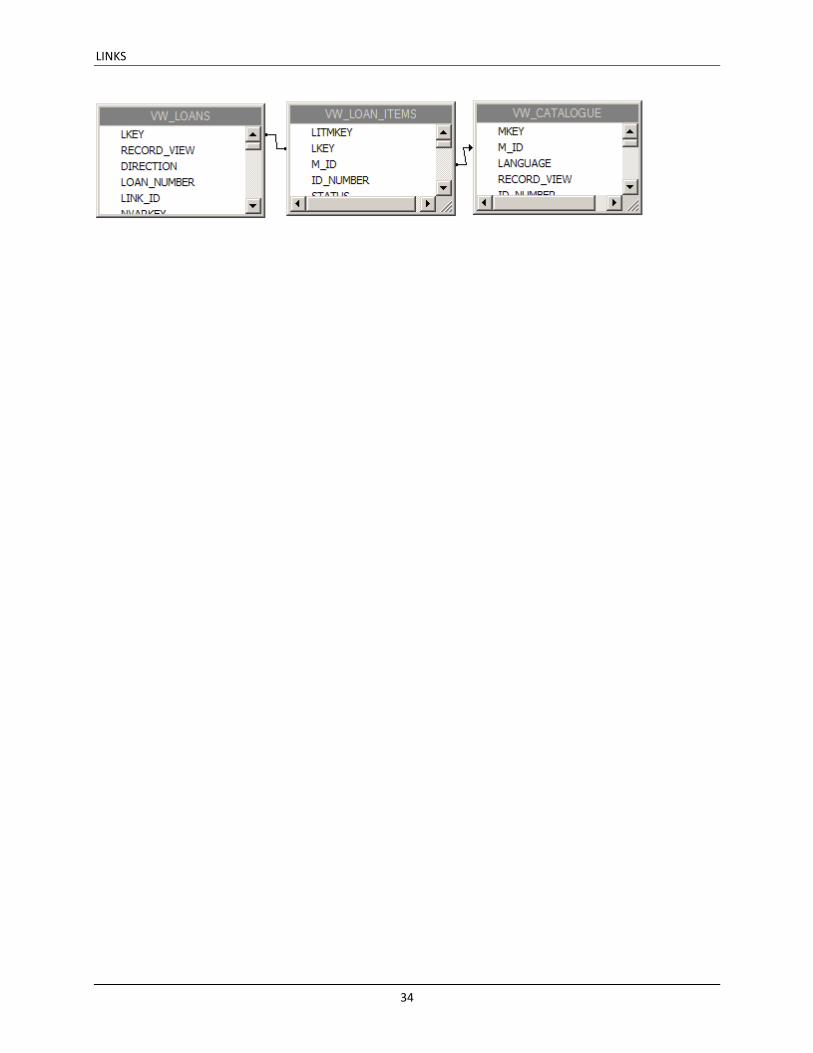
Common Links Below are some commonly used reporting links. For a detailed description of links, please download the Link Appendix from the Library section of the Selago Design Support Site (support.selagodesign.com).
Object to Current Location, Current Condition, Current Valuation The joins below include the object even if there is no current location, condition, or value.
Group Links The links below illustrate how to link tables when you report on a group.
Loan Links The links below illustrate how to link tables when you report on a loan.
LINKS
34
REPORT FORMATTING
35
Chapter 5 - Report Formatting in Design View
Design View is where all additions, deletions, and modifications to your report are made. When you open a report in Design View, you can see all of its sections and controls.
Design View at a Glance
Report Sections
Report Layout
Work in Design View after you have selected and linked (if necessary) the tables the report. You will use either the Report Wizard or the Database Expert to choose and link the tables.
REPORT FORMATTING
36
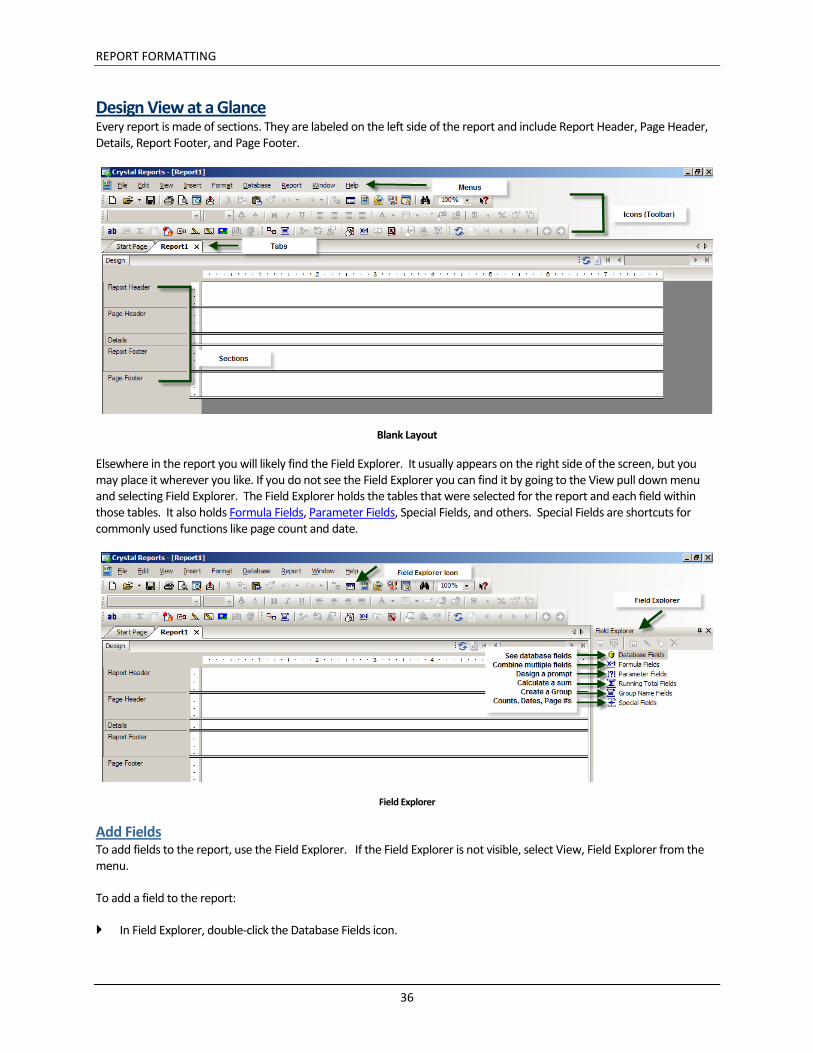
Design View at a Glance Every report is made of sections. They are labeled on the left side of the report and include Report Header, Page Header, Details, Report Footer, and Page Footer.
Blank Layout
Elsewhere in the report you will likely find the Field Explorer. It usually appears on the right side of the screen, but you may place it wherever you like. If you do not see the Field Explorer you can find it by going to the View pull down menu and selecting Field Explorer. The Field Explorer holds the tables that were selected for the report and each field within those tables. It also holds Formula Fields, Parameter Fields, Special Fields, and others. Special Fields are shortcuts for commonly used functions like page count and date.
Field Explorer
Add Fields To add fields to the report, use the Field Explorer. If the Field Explorer is not visible, select View, Field Explorer from the menu.
To add a field to the report:
In Field Explorer, double-click the Database Fields icon.
REPORT FORMATTING
37
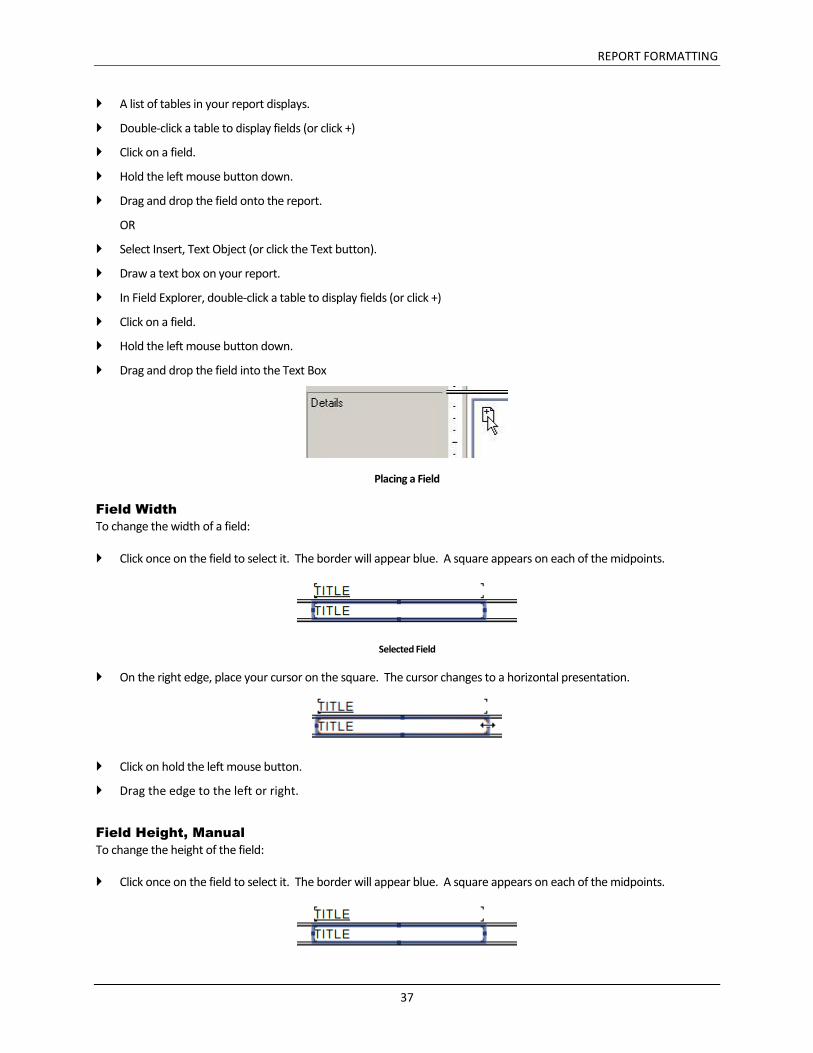
A list of tables in your report displays.
Double-click a table to display fields (or click +)
Click on a field.
Hold the left mouse button down.
Drag and drop the field onto the report.
OR
Select Insert, Text Object (or click the Text button).
Draw a text box on your report.
In Field Explorer, double-click a table to display fields (or click +)
Click on a field.
Hold the left mouse button down.
Drag and drop the field into the Text Box
Placing a Field
Field Width
To change the width of a field:
Click once on the field to select it. The border will appear blue. A square appears on each of the midpoints.
Selected Field
On the right edge, place your cursor on the square. The cursor changes to a horizontal presentation.
Click on hold the left mouse button.
Drag the edge to the left or right.
Field Height, Manual
To change the height of the field:
Click once on the field to select it. The border will appear blue. A square appears on each of the midpoints.

REPORT FORMATTING
38
Selected Field
On the lower edge, place your cursor on the square. The cursor changes to a vertical presentation.
Vertical Cursor
Click on hold the left mouse button.
Drag the edge to the up or down.
Field Height, Auto
To automatically resize the height of a field based on the length of the data:
Click once on the field to select it. The border will appear blue. A square appears on each of the midpoints.
Selected Field
Right click on the selected field to display a menu.
Field Properties Menu
Select Format Field.
REPORT FORMATTING
39
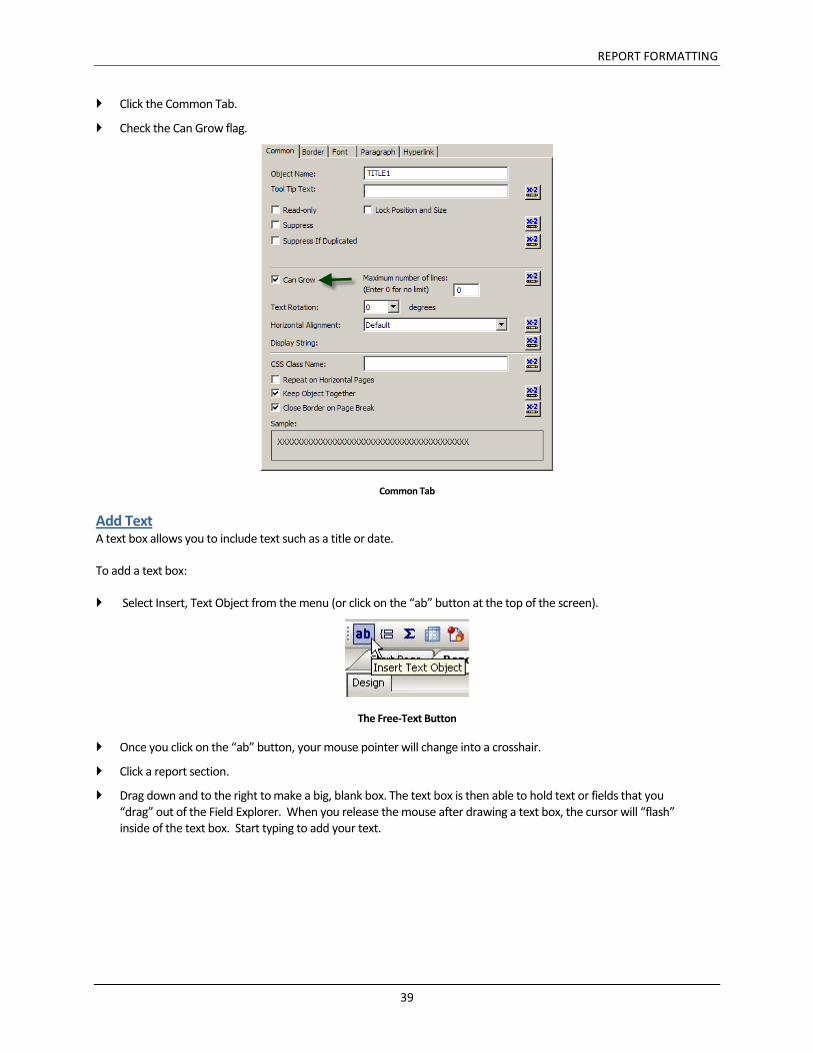
Click the Common Tab.
Check the Can Grow flag.
Common Tab
Add Text A text box allows you to include text such as a title or date.
To add a text box:
Select Insert, Text Object from the menu (or click on the “ab” button at the top of the screen).
The Free-Text Button
Once you click on the “ab” button, your mouse pointer will change into a crosshair.
Click a report section.
Drag down and to the right to make a big, blank box. The text box is then able to hold text or fields that you “drag” out of the Field Explorer. When you release the mouse after drawing a text box, the cursor will “flash” inside of the text box. Start typing to add your text.
REPORT FORMATTING
40
Adding/Resizing a Free-Text Field
Report Style When using the Field Explorer to drag and drop fields onto your report, you have several options to control the data display: columnar, text block, stacked, and floating. Since each section may have different formatting, multiple styles may often be combined in a single report.
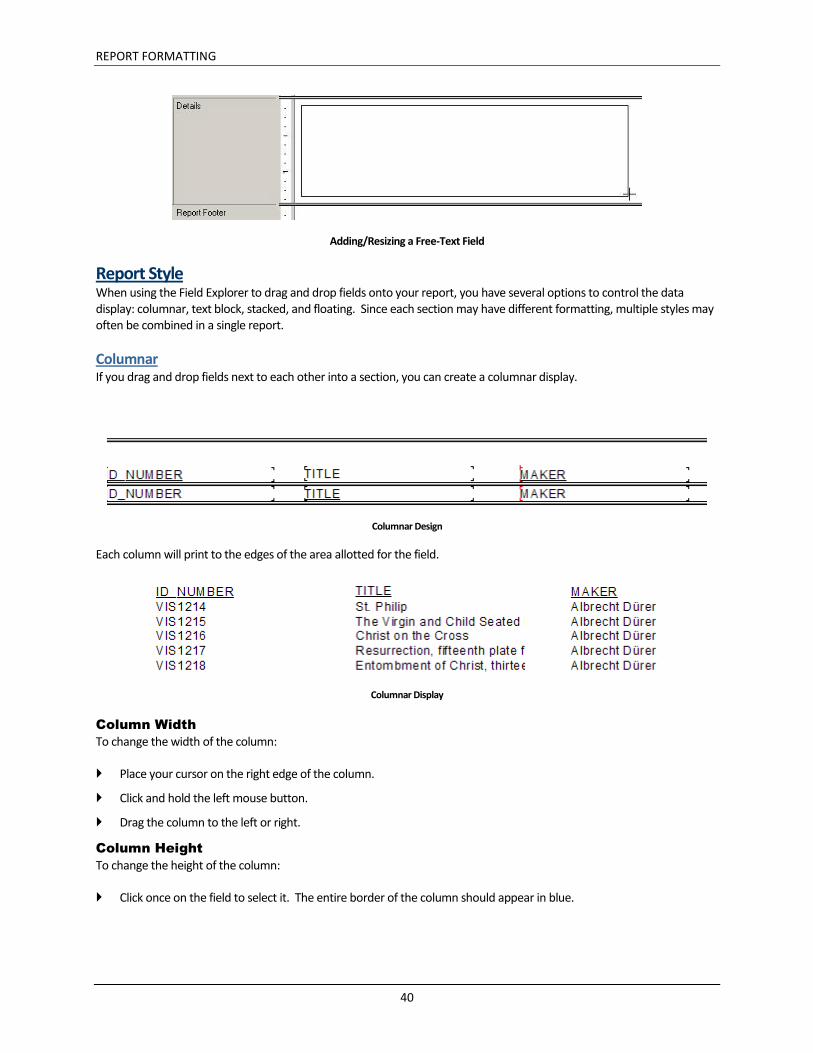
Columnar If you drag and drop fields next to each other into a section, you can create a columnar display.
Columnar Design
Each column will print to the edges of the area allotted for the field.
Columnar Display
Column Width
To change the width of the column:
Place your cursor on the right edge of the column.
Click and hold the left mouse button.
Drag the column to the left or right.
Column Height
To change the height of the column:
Click once on the field to select it. The entire border of the column should appear in blue.
REPORT FORMATTING
41
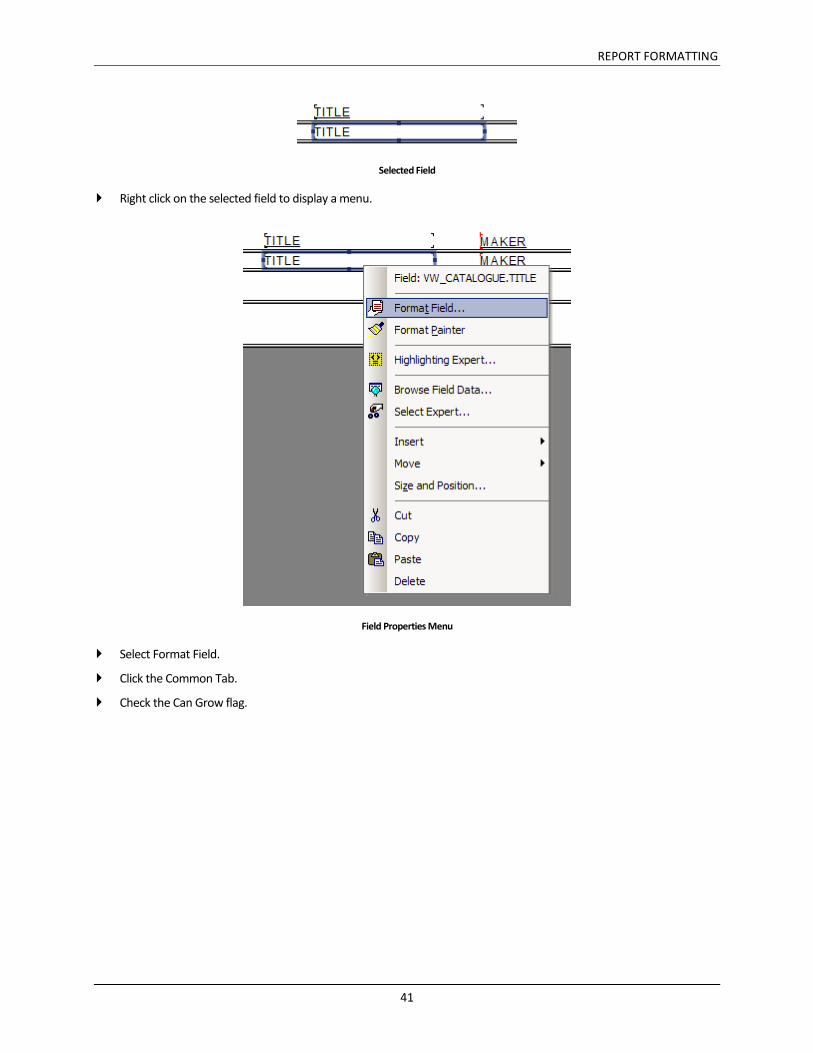
Selected Field
Right click on the selected field to display a menu.
Field Properties Menu
Select Format Field.
Click the Common Tab.
Check the Can Grow flag.

REPORT FORMATTING
42
Common Tab
You can click on the “+” next to Database Tables to view what fields are available. Click on a field and drag it into a section of the report, or into a textbox. A green check appears in the Field Explorer once the field has been added to the report or used with selection criteria.
Placing a Field
If you wish, you can put each field in a new details section. This often results in a cleaner-looking report, with less white-space.
Text Block A Text Block is very useful if you wish to print multiple fields in a single column. Since the fields are treated as a single unit, this style is often used when field tags are not needed, or when you wish to print text side by side with an image.
Select Insert, Text Object from the menu (or click on the “ab” button at the top of the screen).
The Free-Text Button
Once you click on the “ab” button, your mouse pointer will change into a crosshair.
REPORT FORMATTING
43
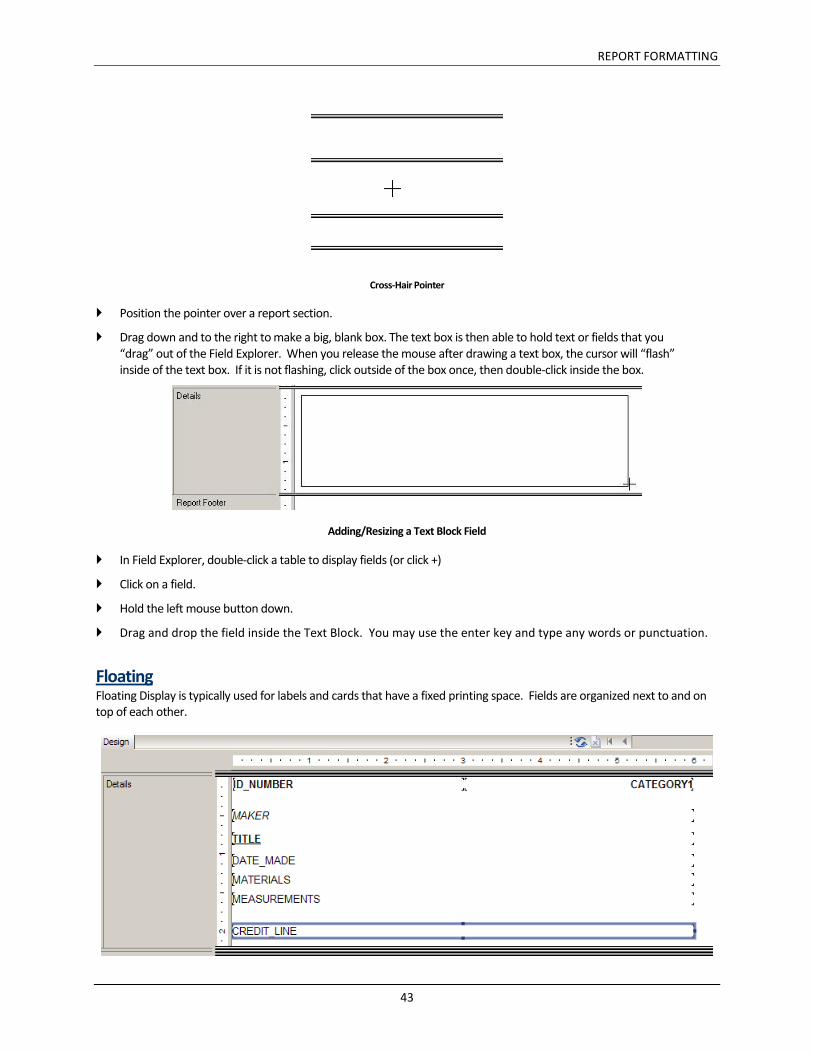
Cross-Hair Pointer
Position the pointer over a report section.
Drag down and to the right to make a big, blank box. The text box is then able to hold text or fields that you “drag” out of the Field Explorer. When you release the mouse after drawing a text box, the cursor will “flash” inside of the text box. If it is not flashing, click outside of the box once, then double-click inside the box.
Adding/Resizing a Text Block Field
In Field Explorer, double-click a table to display fields (or click +)
Click on a field.
Hold the left mouse button down.
Drag and drop the field inside the Text Block. You may use the enter key and type any words or punctuation.
Floating Floating Display is typically used for labels and cards that have a fixed printing space. Fields are organized next to and on top of each other.
REPORT FORMATTING
44
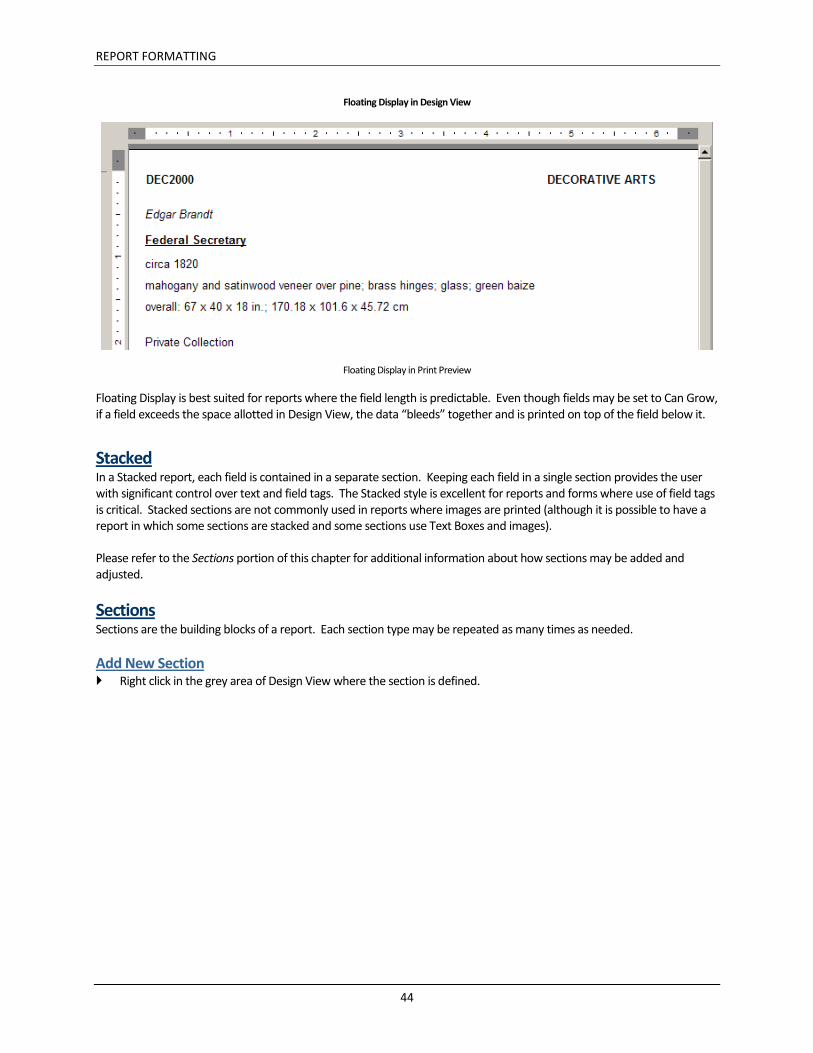
Floating Display in Design View
Floating Display in Print Preview
Floating Display is best suited for reports where the field length is predictable. Even though fields may be set to Can Grow, if a field exceeds the space allotted in Design View, the data “bleeds” together and is printed on top of the field below it.
Stacked In a Stacked report, each field is contained in a separate section. Keeping each field in a single section provides the user with significant control over text and field tags. The Stacked style is excellent for reports and forms where use of field tags is critical. Stacked sections are not commonly used in reports where images are printed (although it is possible to have a report in which some sections are stacked and some sections use Text Boxes and images).
Please refer to the Sections portion of this chapter for additional information about how sections may be added and adjusted.
Sections Sections are the building blocks of a report. Each section type may be repeated as many times as needed.
Add New Section Right click in the grey area of Design View where the section is defined.

REPORT FORMATTING
45
Add Section
Select Insert Section Below.
A new section is added to the report.
Sections may also be added using the Section Expert. For more information on the Section Expert, please continue reading this chapter.
Section Expert Section Expert enables you to add and configure the properties of each report section. Section Expert may be accessed in multiple ways:
In Design View, right click in the grey area where the sections are labeled and select Section Expert from the Pop-Up window.
OR
Select Report, Section Expert from the menu.
The Section Expert Window displays.
REPORT FORMATTING
46
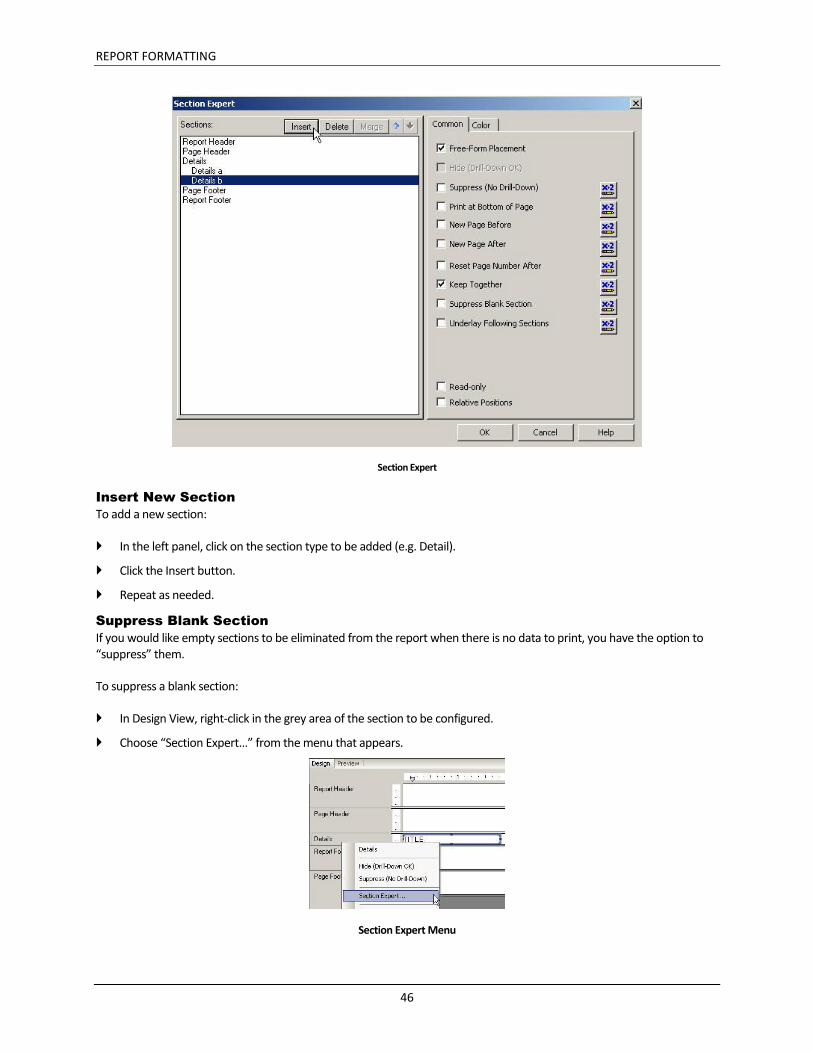
Section Expert
Insert New Section
To add a new section:
In the left panel, click on the section type to be added (e.g. Detail).
Click the Insert button.
Repeat as needed.
Suppress Blank Section
If you would like empty sections to be eliminated from the report when there is no data to print, you have the option to “suppress” them.
To suppress a blank section:
In Design View, right-click in the grey area of the section to be configured.
Choose “Section Expert…” from the menu that appears.
Section Expert Menu
REPORT FORMATTING
47
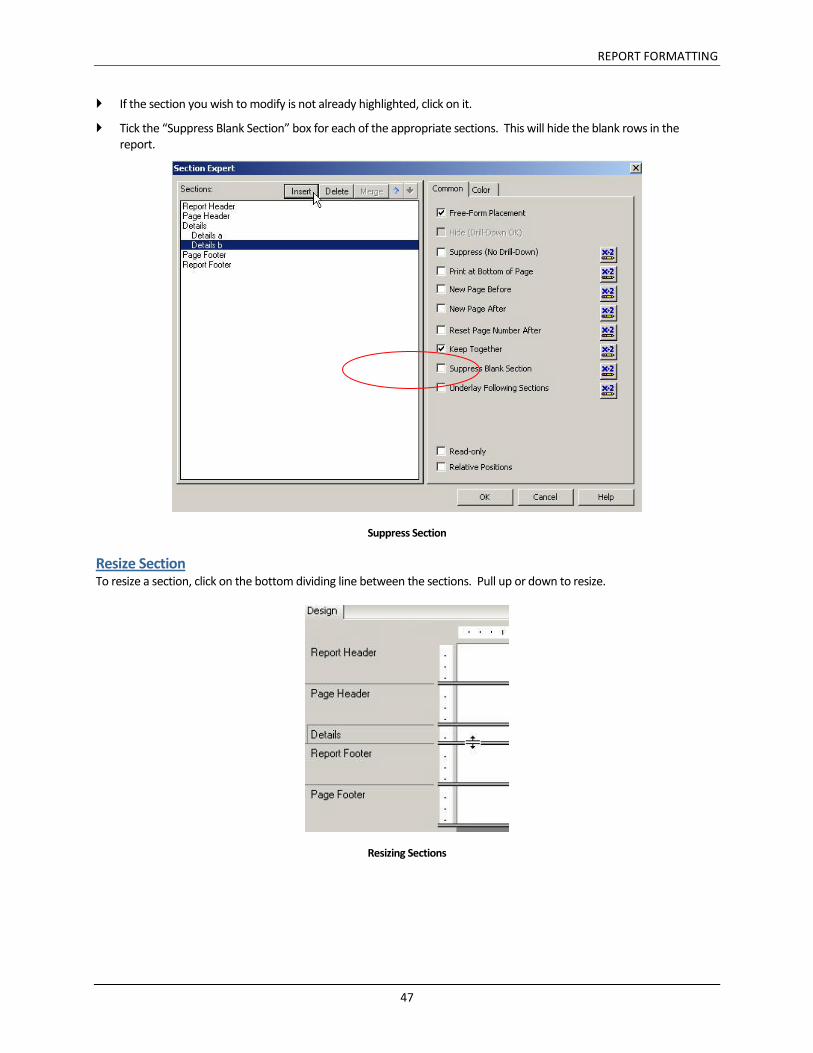
If the section you wish to modify is not already highlighted, click on it.
Tick the “Suppress Blank Section” box for each of the appropriate sections. This will hide the blank rows in the report.
Suppress Section
Resize Section To resize a section, click on the bottom dividing line between the sections. Pull up or down to resize.
Resizing Sections


CHAPTER 5
5-1

SAVE, EXPORT, AND PRINT YOUR REPORTS
49
Chapter 6 - Save, Export, and Print Your Reports
Once you have previewed your report and like what you see, you can save, export, and print the report.
Saving Reports
Exporting Report Data
Printing a Report
SAVE, EXPORT, AND PRINT YOUR REPORTS
50
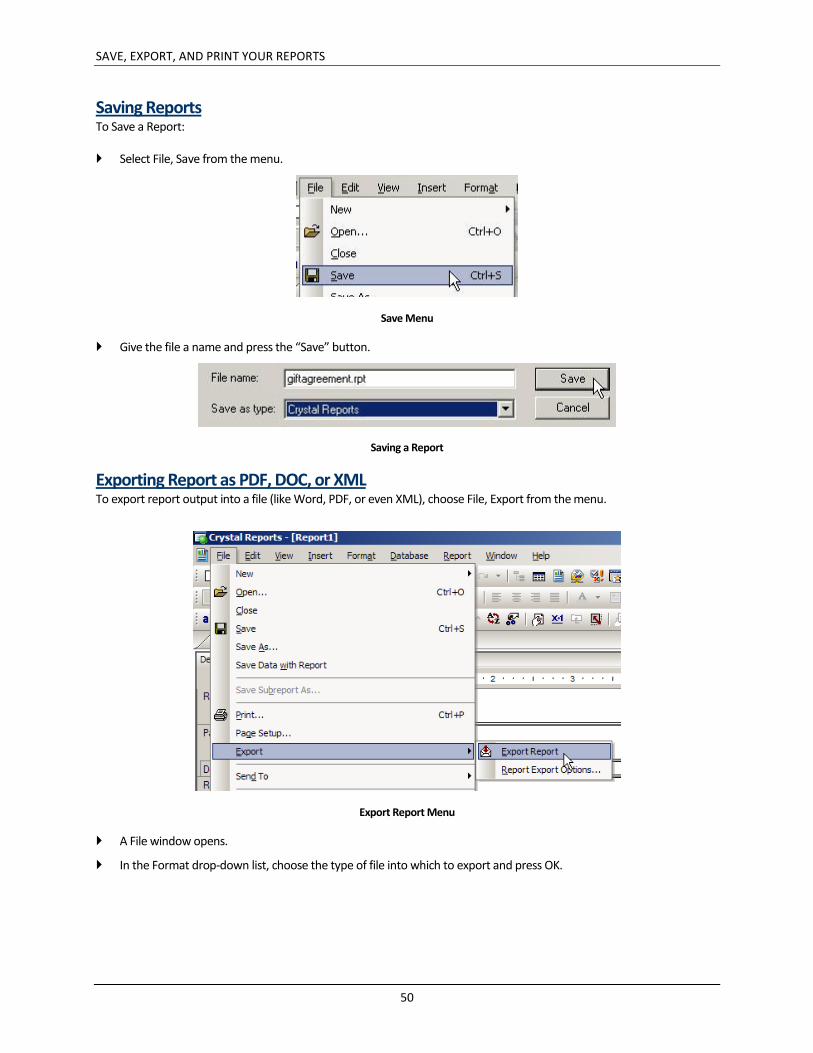
Saving Reports To Save a Report:
Select File, Save from the menu.
Save Menu
Give the file a name and press the “Save” button.
Saving a Report
Exporting Report as PDF, DOC, or XML To export report output into a file (like Word, PDF, or even XML), choose File, Export from the menu.
Export Report Menu
A File window opens.
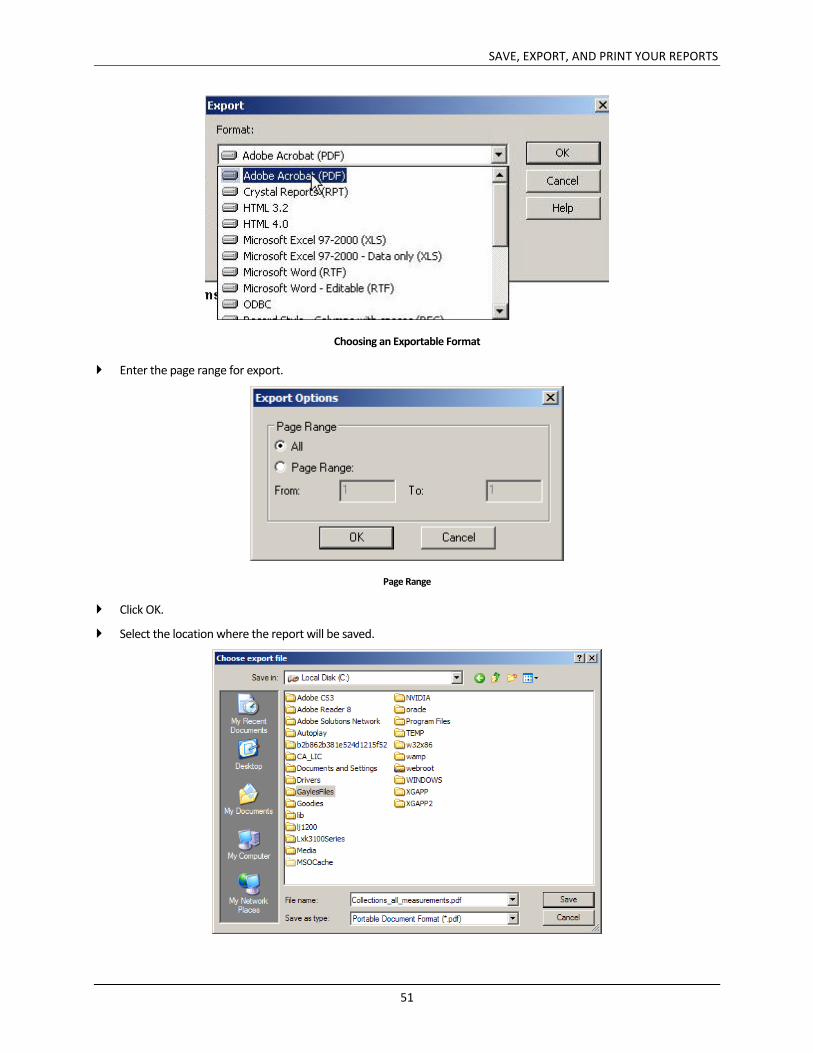
In the Format drop-down list, choose the type of file into which to export and press OK.
SAVE, EXPORT, AND PRINT YOUR REPORTS
51
Choosing an Exportable Format
Enter the page range for export.
Page Range
Click OK.
Select the location where the report will be saved.
SAVE, EXPORT, AND PRINT YOUR REPORTS
52
File Save Location
Click Save.
A window displays the progress of the export and closes when it is complete.
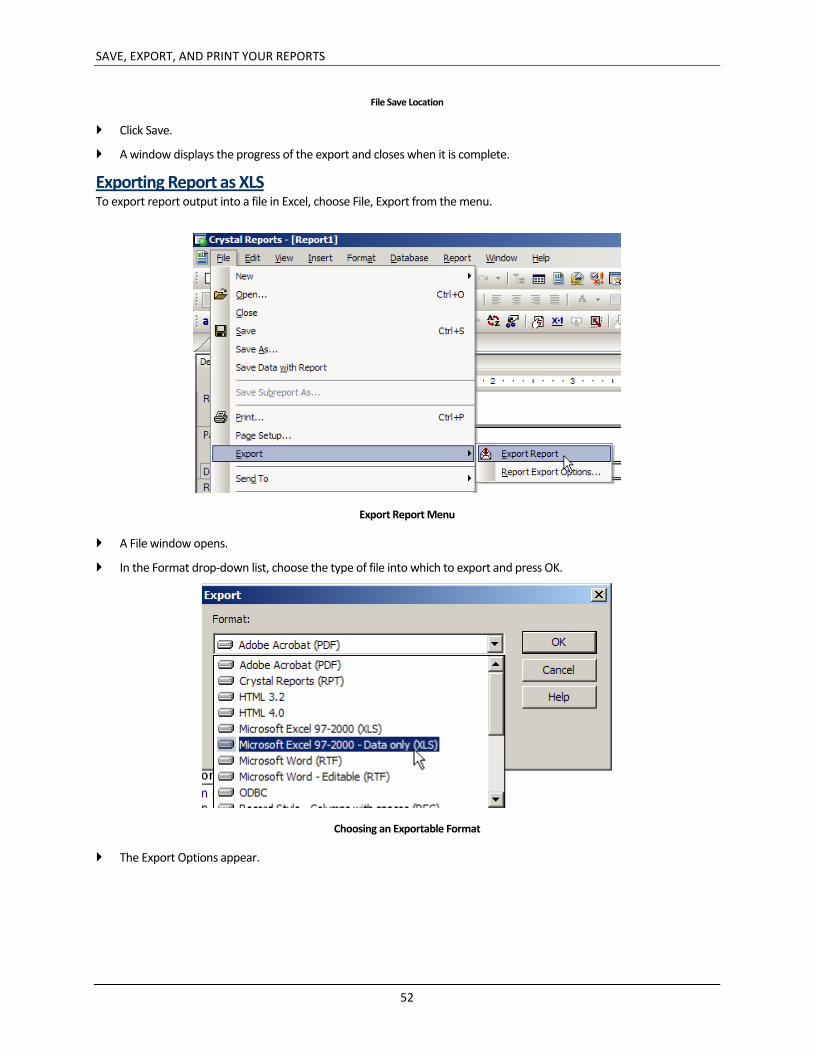
Exporting Report as XLS To export report output into a file in Excel, choose File, Export from the menu.
Export Report Menu
A File window opens.
In the Format drop-down list, choose the type of file into which to export and press OK.
Choosing an Exportable Format
The Export Options appear.
SAVE, EXPORT, AND PRINT YOUR REPORTS
53
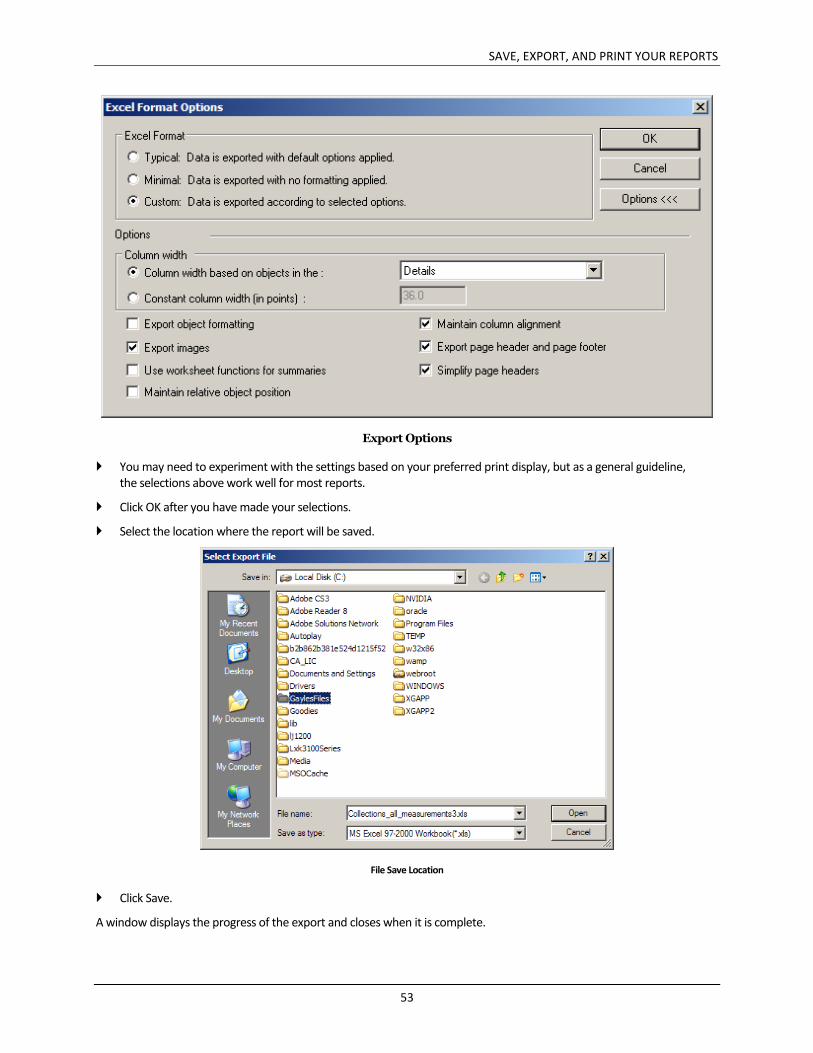
Export Options
You may need to experiment with the settings based on your preferred print display, but as a general guideline, the selections above work well for most reports.
Click OK after you have made your selections.
Select the location where the report will be saved.
File Save Location
Click Save.
A window displays the progress of the export and closes when it is complete.

SAVE, EXPORT, AND PRINT YOUR REPORTS
54
Printing a Report Select File, Print from the menu.
Print Menu
SELECTION CRITERIA
55
Chapter 7 - Selection Criteria
Most reports require some kind of selection criteria to streamline the data that the report returns. Selection criteria can be anything: an ID Number; an acquisition source; or a group created within Mimsy XG. This chapter introduces you to the fundamentals of using the Select Expert in Crystal Reports.
Crystal Search Rules
Select Expert
Adding Search Criteria
Formula Editor
Parameters as Selections
SELECTION CRITERIA
56
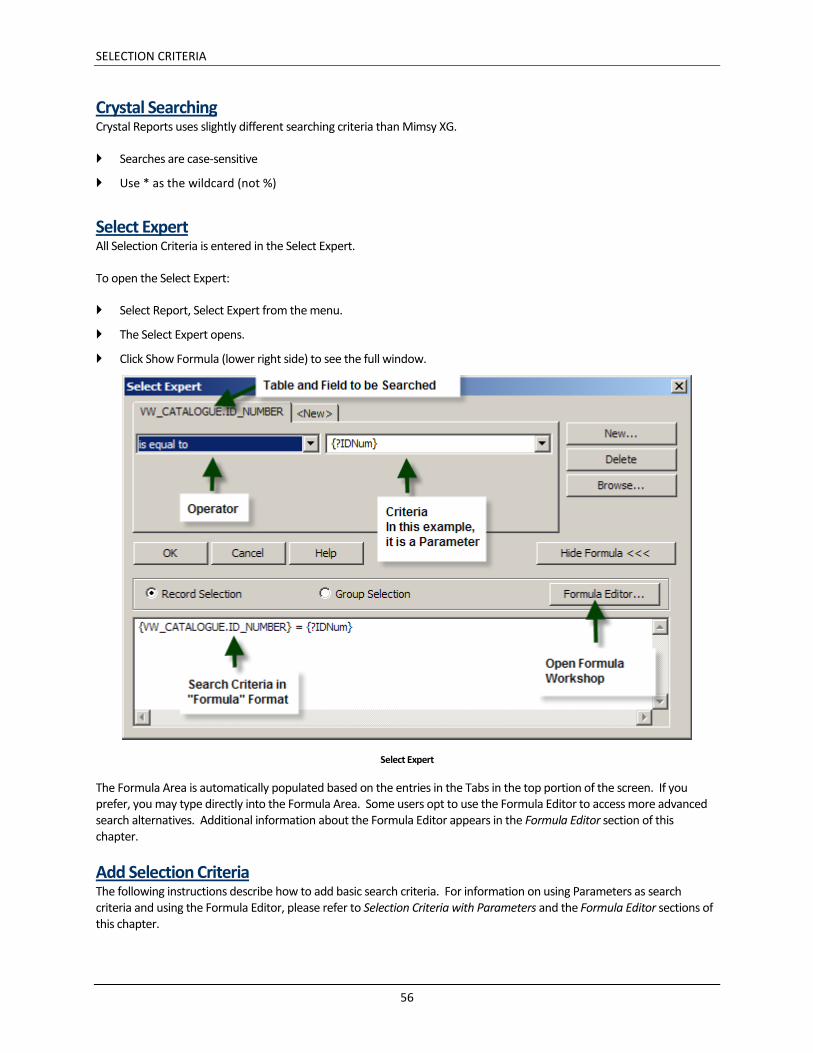
Crystal Searching Crystal Reports uses slightly different searching criteria than Mimsy XG.
Searches are case-sensitive
Use * as the wildcard (not %)
Select Expert All Selection Criteria is entered in the Select Expert.
To open the Select Expert:
Select Report, Select Expert from the menu.
The Select Expert opens.
Click Show Formula (lower right side) to see the full window.
Select Expert
The Formula Area is automatically populated based on the entries in the Tabs in the top portion of the screen. If you prefer, you may type directly into the Formula Area. Some users opt to use the Formula Editor to access more advanced search alternatives. Additional information about the Formula Editor appears in the Formula Editor section of this chapter.
Add Selection Criteria The following instructions describe how to add basic search criteria. For information on using Parameters as search criteria and using the Formula Editor, please refer to Selection Criteria with Parameters and the Formula Editor sections of this chapter.
SELECTION CRITIERA
57
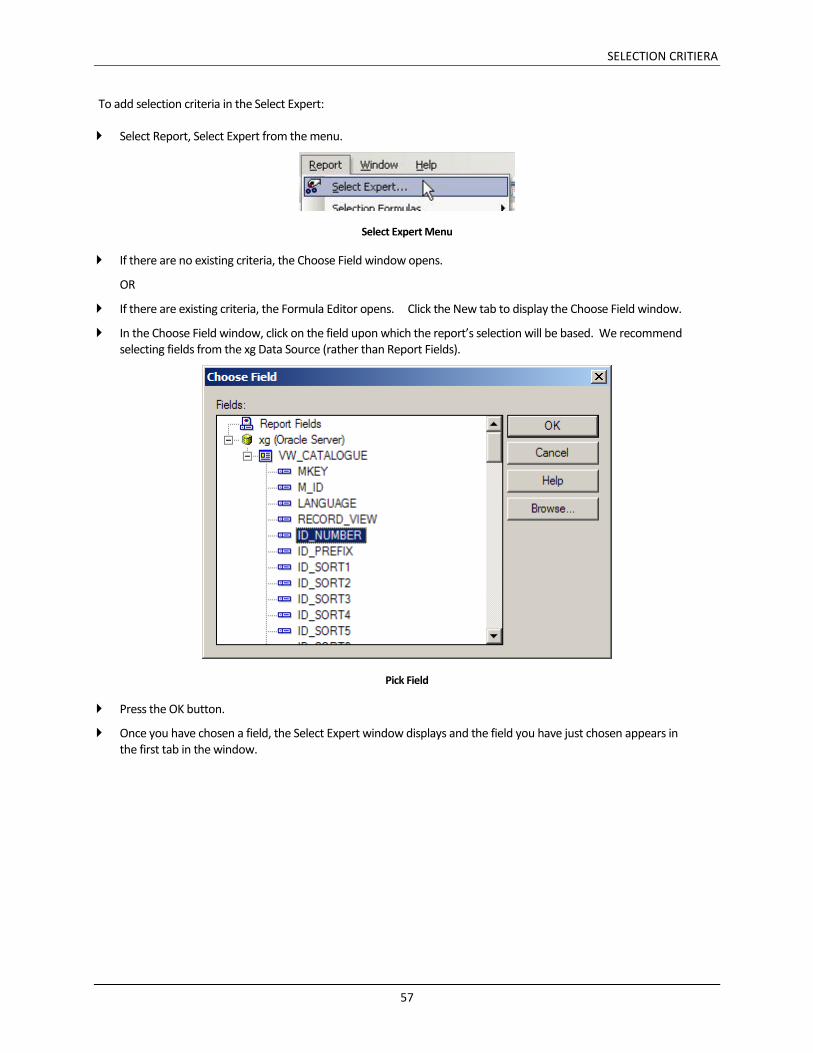
To add selection criteria in the Select Expert:
Select Report, Select Expert from the menu.
Select Expert Menu
If there are no existing criteria, the Choose Field window opens.
OR
If there are existing criteria, the Formula Editor opens. Click the New tab to display the Choose Field window.
In the Choose Field window, click on the field upon which the report’s selection will be based. We recommend selecting fields from the xg Data Source (rather than Report Fields).
Pick Field
Press the OK button.
Once you have chosen a field, the Select Expert window displays and the field you have just chosen appears in the first tab in the window.
SELECTION CRITERIA
58
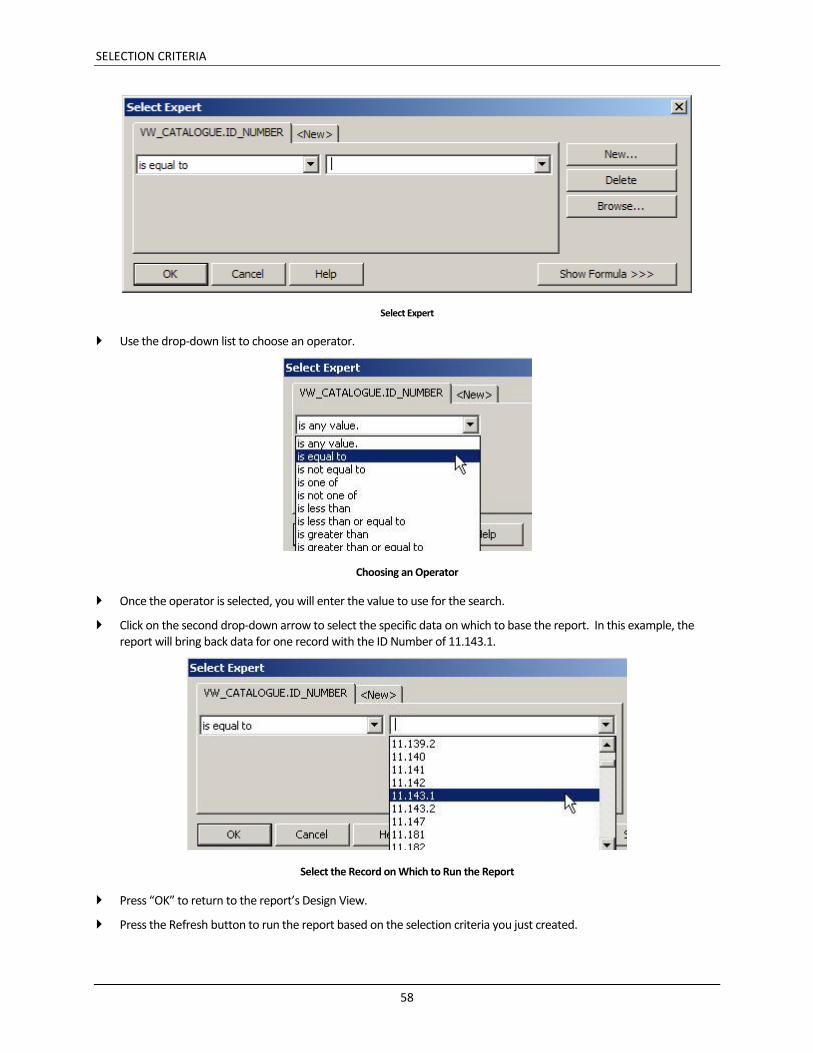
Select Expert
Use the drop-down list to choose an operator.
Choosing an Operator
Once the operator is selected, you will enter the value to use for the search.
Click on the second drop-down arrow to select the specific data on which to base the report. In this example, the report will bring back data for one record with the ID Number of 11.143.1.
Select the Record on Which to Run the Report
Press “OK” to return to the report’s Design View.
Press the Refresh button to run the report based on the selection criteria you just created.
SELECTION CRITIERA
59
Refresh Button
Revise Search Criteria You may decide to revise your search by changing the search value, deleting existing criteria, or adding additional criteria.
Modify Existing Criteria To modify existing search criteria:
Select Report, Select Expert from the menu.
Use the second drop-down list to choose a different data set on which to report.
Press “OK” to return to the report’s Design View.
Delete Existing Criteria To delete existing criteria:
Select Report, Select Expert from the menu.
On the right side, click the DELETE button.
Add Additional Criteria To add new criteria to an existing selection:
Select Report, Select Expert from the menu.
On the right side, click the NEW button (or click on the <New> tab to add the criteria).
A new Search tab is added.
Select the Operator.
Enter the criteria.
Click OK to return to Design View.
Press the Refresh button to run the report based on the selection criteria you just created.
Formula Editor The Formula Editor provides another method of applying search criteria to a report. It is typically used if your search criteria require some kind of calculation between two fields or a Function is applied to the criteria (e.g. IsNull).
To open the Formula Editor:
Select Report, Select Expert from the menu.
If there are already selection criteria, the Selection Criteria window/tabs displays. If there are no existing criteria, select a field and press OK.
Click the Show Formula button to access the Formula Editor button.

SELECTION CRITERIA
60
Show Formula
Click on the Formula Editor button to get to the Formula Workshop.
Formula Editor
OR
Select Report, Formula Editor from the menu. If there are existing criteria, it will display. If there are no criteria, the formula is blank.
The Formula Editor opens.
SELECTION CRITIERA
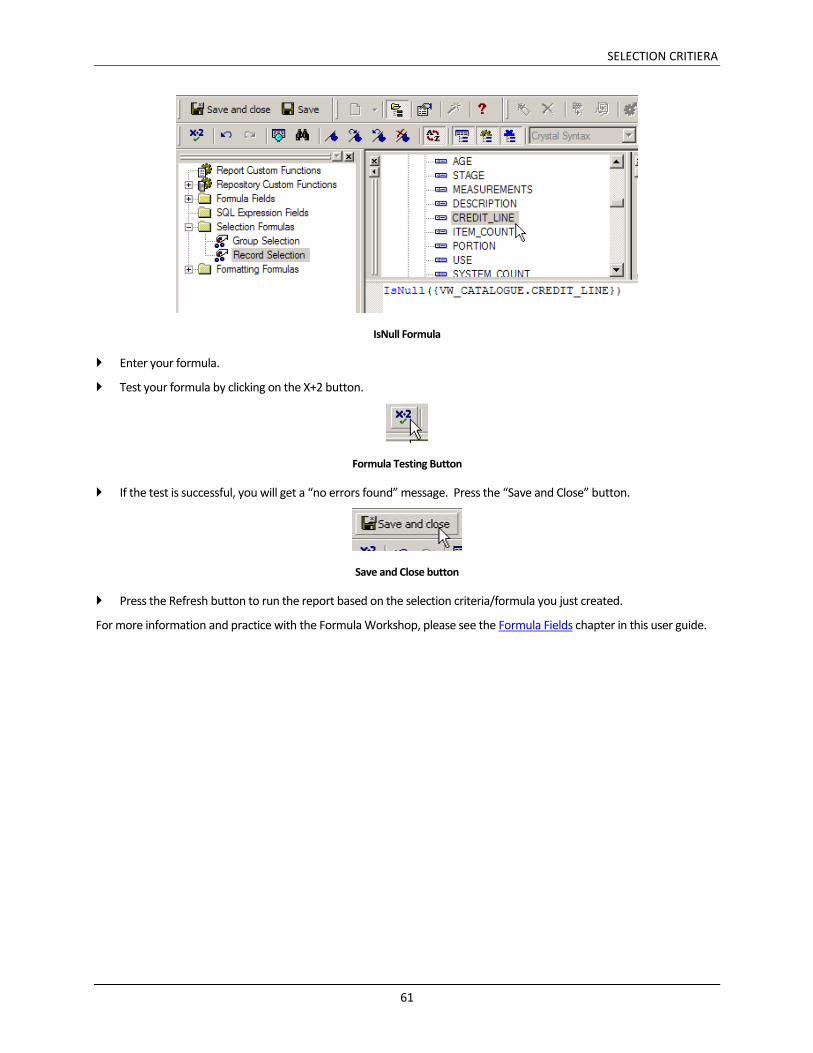
61
IsNull Formula
Enter your formula.
Test your formula by clicking on the X+2 button.
Formula Testing Button
If the test is successful, you will get a “no errors found” message. Press the “Save and Close” button.
Save and Close button
Press the Refresh button to run the report based on the selection criteria/formula you just created.
For more information and practice with the Formula Workshop, please see the Formula Fields chapter in this user guide.
SELECTION CRITERIA
62
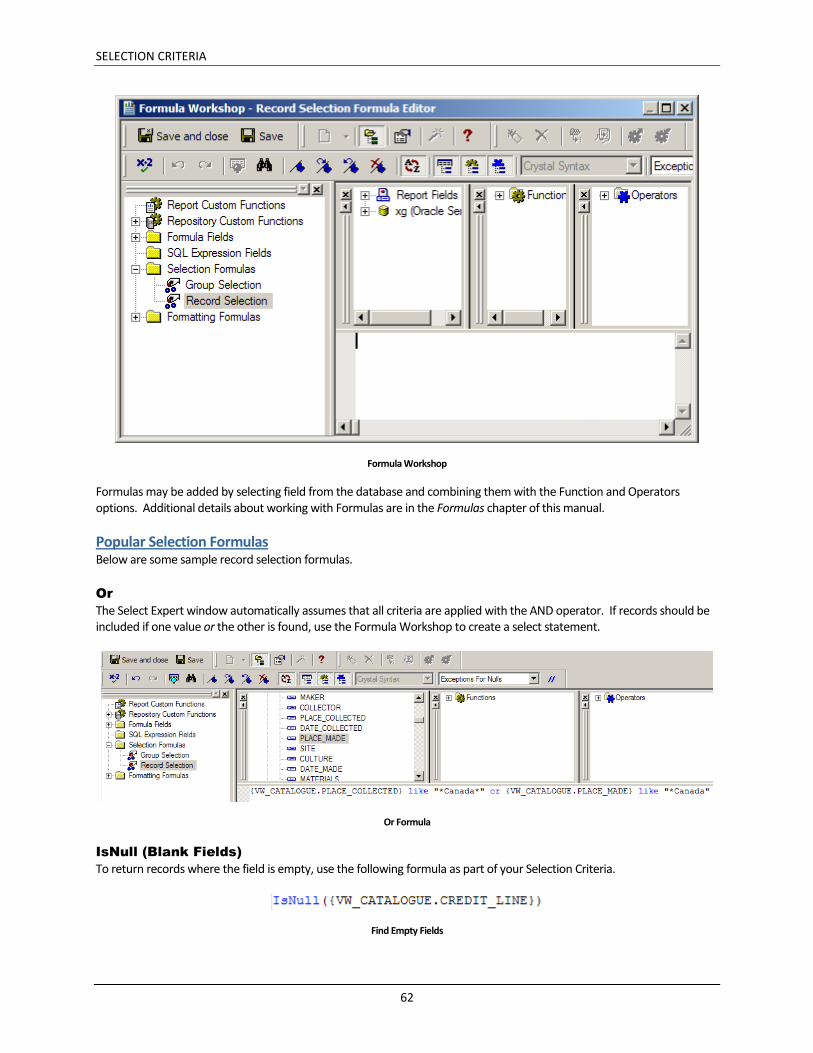
Formula Workshop
Formulas may be added by selecting field from the database and combining them with the Function and Operators options. Additional details about working with Formulas are in the Formulas chapter of this manual.
Popular Selection Formulas Below are some sample record selection formulas.
Or
The Select Expert window automatically assumes that all criteria are applied with the AND operator. If records should be included if one value or the other is found, use the Formula Workshop to create a select statement.
Or Formula
IsNull (Blank Fields)
To return records where the field is empty, use the following formula as part of your Selection Criteria.
Find Empty Fields
SELECTION CRITIERA
63
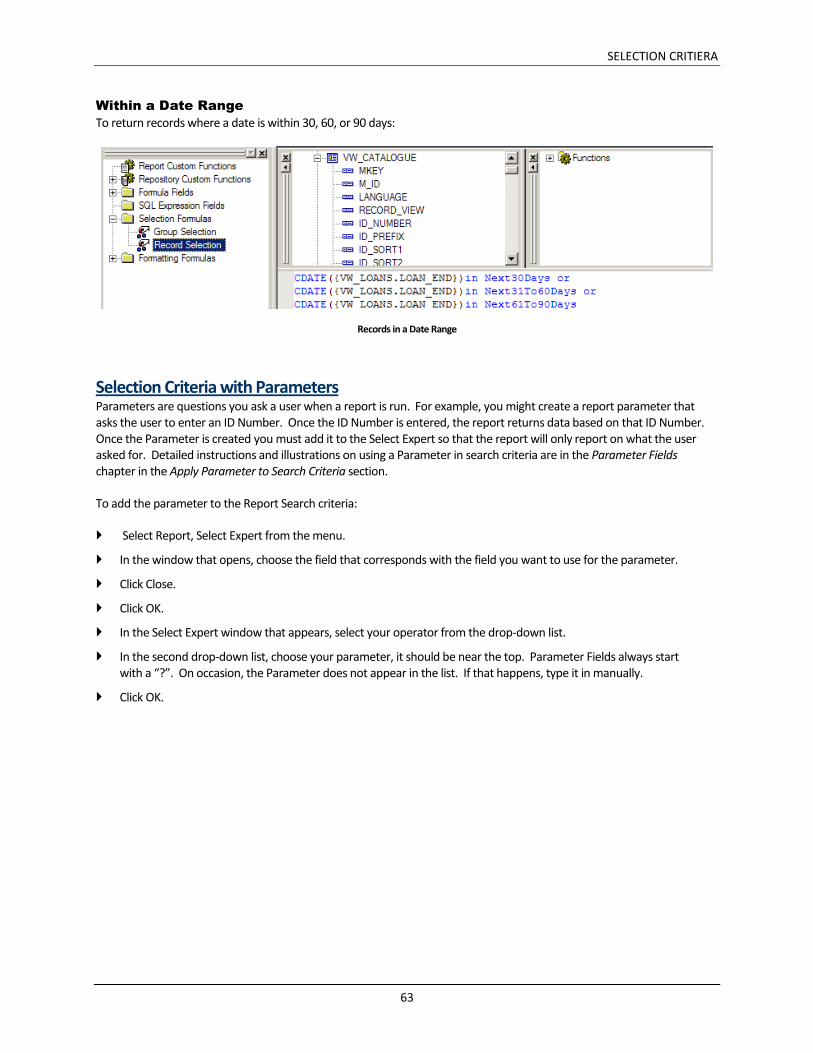
Within a Date Range
To return records where a date is within 30, 60, or 90 days:
Records in a Date Range
Selection Criteria with Parameters Parameters are questions you ask a user when a report is run. For example, you might create a report parameter that asks the user to enter an ID Number. Once the ID Number is entered, the report returns data based on that ID Number. Once the Parameter is created you must add it to the Select Expert so that the report will only report on what the user asked for. Detailed instructions and illustrations on using a Parameter in search criteria are in the Parameter Fields chapter in the Apply Parameter to Search Criteria section.
To add the parameter to the Report Search criteria:
Select Report, Select Expert from the menu.
In the window that opens, choose the field that corresponds with the field you want to use for the parameter.
Click Close.
Click OK.
In the Select Expert window that appears, select your operator from the drop-down list.
In the second drop-down list, choose your parameter, it should be near the top. Parameter Fields always start with a “?”. On occasion, the Parameter does not appear in the list. If that happens, type it in manually.
Click OK.

PARAMETER FIELDS
65
Chapter 8 - Parameter Fields
Parameter Fields in Crystal Reports allow you to run the same report on different data over and over again. For example, you might run the report on one Maker name one day and then on a different Maker name the next. Instead of creating two separate reports for each Maker, build one report that uses a Parameter Field to ask the person running the report a question. The users answer determines what data Crystal Reports outputs.
Parameter Configuration
Parameter Types
Response Options
Create a New Parameter Field
Apply Parameter to a Report

PARAMETER FIELDS
66
Quick Start: Parameters Detailed instructions for creating Parameters are included in this chapter. For a brief summary of how to create Parameters, please use the instructions below.
In the Field Explorer, right click on Parameters.
Select NEW from the Pop-Up menu.
The Parameter Window displays.
Click in the Name field and give your Parameter Field a name.
In the Type dropdown field, select String.
For List of Values, select Static.
In the Options Section, modify the Prompt Text and set Allow Custom Values = Y.
Using Parameters A parameter is a question you ask the user when a report opens. By prompting the user for reply, Crystal Reports can then use that information to display particular records in a report. Examples of common parameters include asking for a Group Name, a location, or a date. When working with parameters, you will first create the parameter and then add it to the Select Expert.
Below is an example of a parameter that prompts the user for a Group Name.
Parameter
Parameter Configuration Before creating your parameter, it is helpful to consider the following elements:
Parameter Type: what type of data will the user enter? Text, number, date?
List Type & Availability: will the user answer the parameter using free text, select from a static list of pre-defined values, or from a dynamic list of values created from the database?
Response Options: when configuring the prompt, what message will be displayed? Will the user be able to enter more than one answer to the prompt?
All of the configuration elements are defined in the Parameter Window.
PARAMETER FIELDS
67
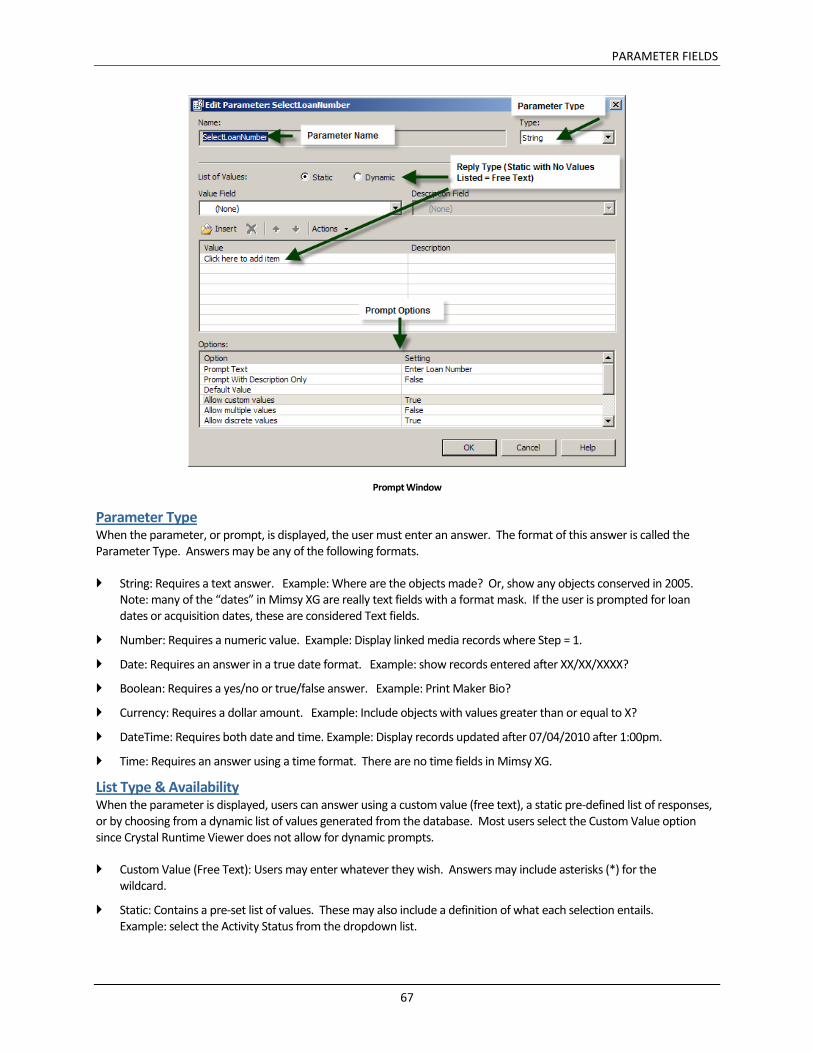
Prompt Window
Parameter Type When the parameter, or prompt, is displayed, the user must enter an answer. The format of this answer is called the Parameter Type. Answers may be any of the following formats.
String: Requires a text answer. Example: Where are the objects made? Or, show any objects conserved in 2005. Note: many of the “dates” in Mimsy XG are really text fields with a format mask. If the user is prompted for loan dates or acquisition dates, these are considered Text fields.
Number: Requires a numeric value. Example: Display linked media records where Step = 1.
Date: Requires an answer in a true date format. Example: show records entered after XX/XX/XXXX?
Boolean: Requires a yes/no or true/false answer. Example: Print Maker Bio?
Currency: Requires a dollar amount. Example: Include objects with values greater than or equal to X?
DateTime: Requires both date and time. Example: Display records updated after 07/04/2010 after 1:00pm.
Time: Requires an answer using a time format. There are no time fields in Mimsy XG.
List Type & Availability When the parameter is displayed, users can answer using a custom value (free text), a static pre-defined list of responses, or by choosing from a dynamic list of values generated from the database. Most users select the Custom Value option since Crystal Runtime Viewer does not allow for dynamic prompts.
Custom Value (Free Text): Users may enter whatever they wish. Answers may include asterisks (*) for the wildcard.
Static: Contains a pre-set list of values. These may also include a definition of what each selection entails. Example: select the Activity Status from the dropdown list.
PARAMETER FIELDS
68
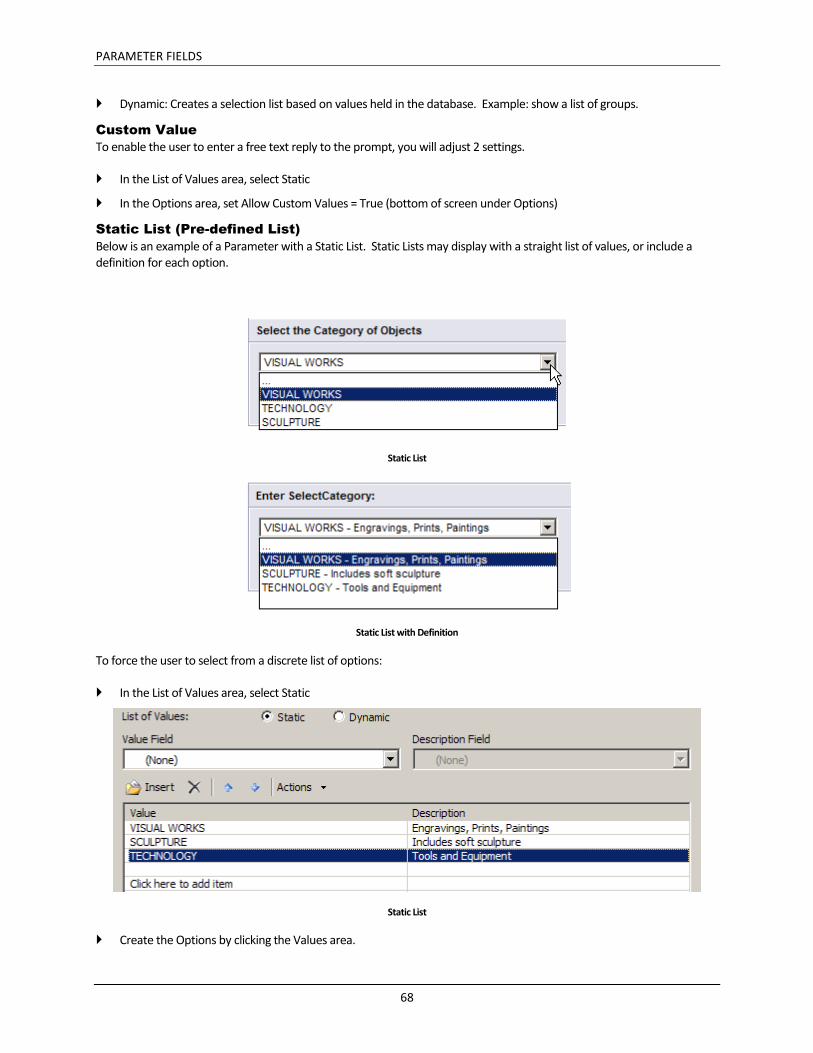
Dynamic: Creates a selection list based on values held in the database. Example: show a list of groups.
Custom Value
To enable the user to enter a free text reply to the prompt, you will adjust 2 settings.
In the List of Values area, select Static
In the Options area, set Allow Custom Values = True (bottom of screen under Options)
Static List (Pre-defined List)
Below is an example of a Parameter with a Static List. Static Lists may display with a straight list of values, or include a definition for each option.
Static List
Static List with Definition
To force the user to select from a discrete list of options:
In the List of Values area, select Static
Static List
Create the Options by clicking the Values area.
PARAMETER FIELDS
69
When you click in the Value area, a cursor appears and you may type the value.
If you would like to define each list option, enter a brief description.
In the Options area (bottom of screen),In the Options area, set Allow Custom Values = False (bottom of screen under Options).
OPTIONAL: it is also possible to have the Static List display the definition of the option and then substitute the corresponding value. This is done in the Options area by setting Prompt with Description = TRUE.
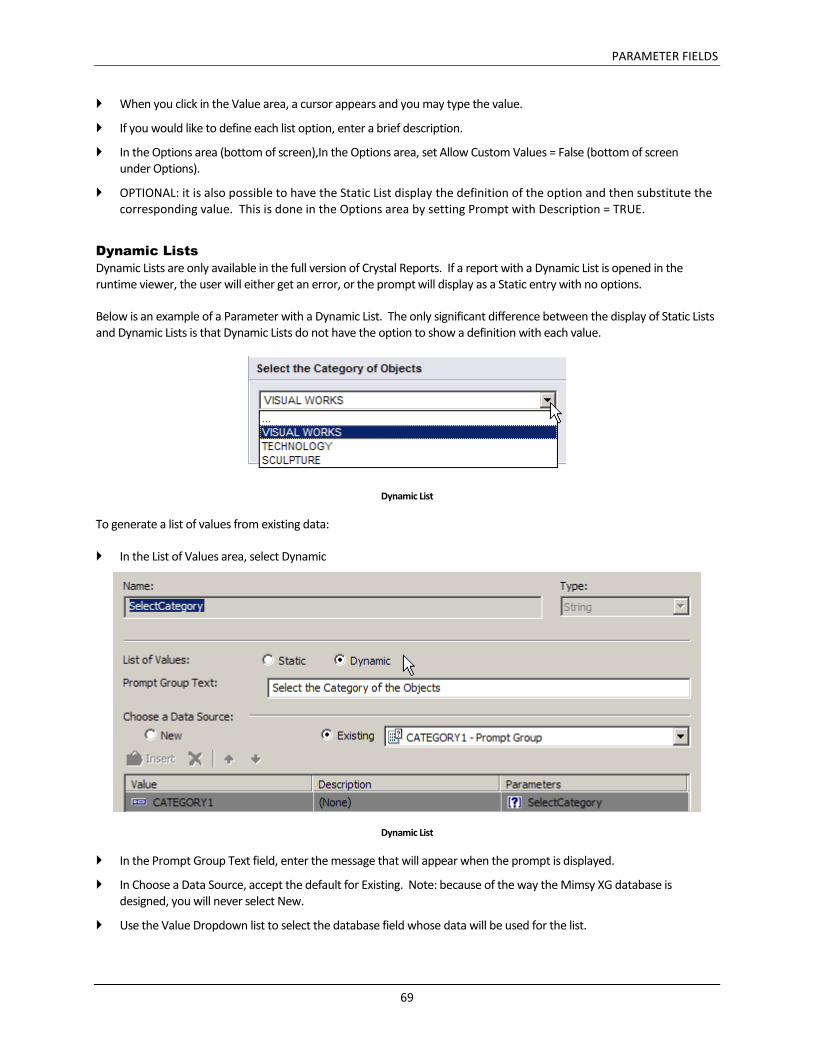
Dynamic Lists
Dynamic Lists are only available in the full version of Crystal Reports. If a report with a Dynamic List is opened in the runtime viewer, the user will either get an error, or the prompt will display as a Static entry with no options.
Below is an example of a Parameter with a Dynamic List. The only significant difference between the display of Static Lists and Dynamic Lists is that Dynamic Lists do not have the option to show a definition with each value.
Dynamic List
To generate a list of values from existing data:
In the List of Values area, select Dynamic
Dynamic List
In the Prompt Group Text field, enter the message that will appear when the prompt is displayed.
In Choose a Data Source, accept the default for Existing. Note: because of the way the Mimsy XG database is designed, you will never select New.
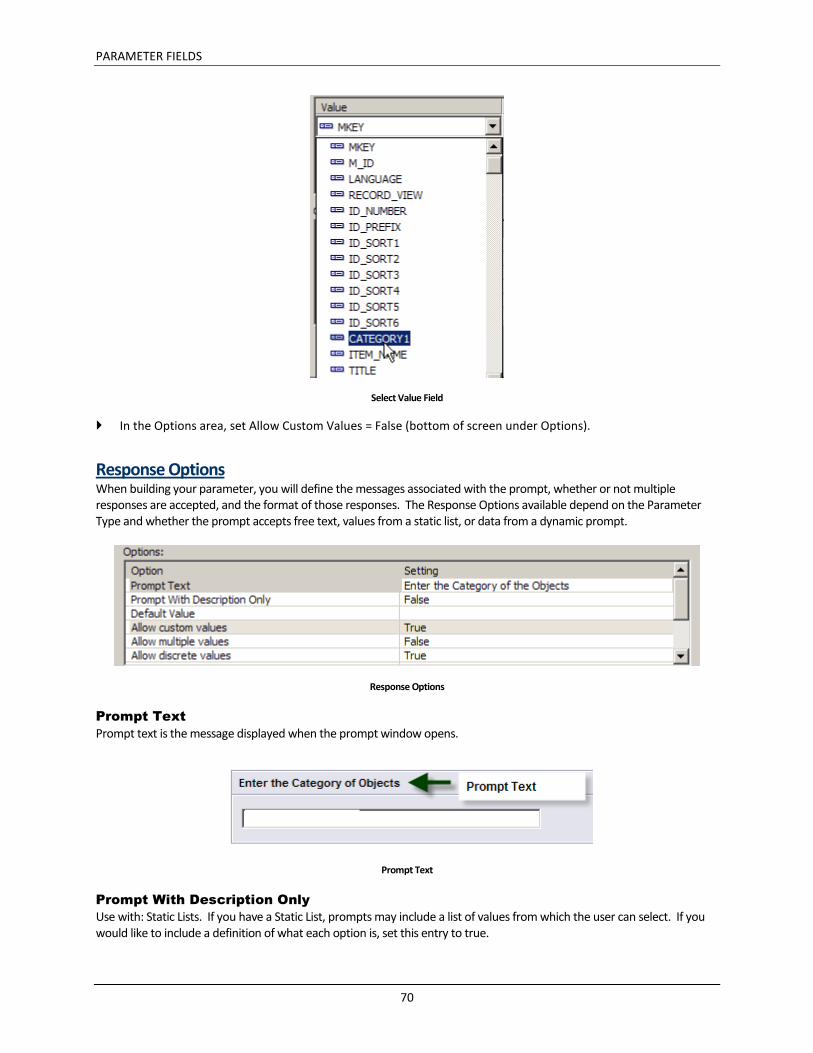
Use the Value Dropdown list to select the database field whose data will be used for the list.
PARAMETER FIELDS
70
Select Value Field
In the Options area, set Allow Custom Values = False (bottom of screen under Options).
Response Options When building your parameter, you will define the messages associated with the prompt, whether or not multiple responses are accepted, and the format of those responses. The Response Options available depend on the Parameter Type and whether the prompt accepts free text, values from a static list, or data from a dynamic prompt.
Response Options
Prompt Text
Prompt text is the message displayed when the prompt window opens.
Prompt Text
Prompt With Description Only
Use with: Static Lists. If you have a Static List, prompts may include a list of values from which the user can select. If you would like to include a definition of what each option is, set this entry to true.
PARAMETER FIELDS
71
Default Value
Use with Static Lists, Custom Values. You may set the parameter window to open with a particular value already entered. Users may accept that value or backspace over it and enter a new one. This is helpful if you routinely run a report on specific criteria, but want the option to change it on demand.
Allow Custom Values
Use with Static Lists, Custom Values. When you set Allow Custom Values = True, users may provide more than one answer to the parameter. For example, if you have a parameter that prompts for a Loan Number, setting Allow Multiple Values = True enables the user to enter more than one Loan.
Allow Multiple Values
Use with Static Lists, Dynamic Lists, and Custom Values. When you set Allow Multiple Values = True, users may provide more than one answer to the parameter. For example, if you have a parameter that prompts for a Loan Number, setting Allow Multiple Values = True enables the user to enter more than one Loan.
Allow Discrete Values
Use with Static Lists, Dynamic Lists, and Custom Values. Allow Discrete Values restricts the user to entering a single value for the parameter. If you have Allow Multiple Values = True, this overrides the Discrete value option.
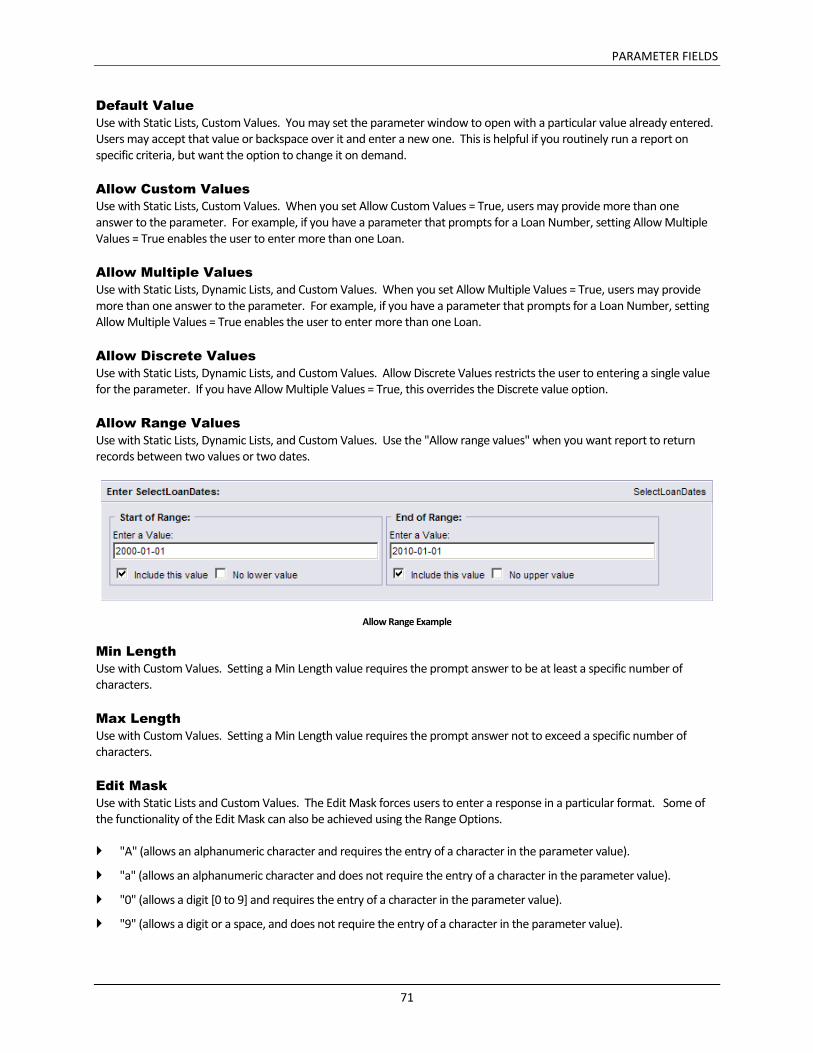
Allow Range Values
Use with Static Lists, Dynamic Lists, and Custom Values. Use the "Allow range values" when you want report to return records between two values or two dates.
Allow Range Example
Min Length
Use with Custom Values. Setting a Min Length value requires the prompt answer to be at least a specific number of characters.
Max Length
Use with Custom Values. Setting a Min Length value requires the prompt answer not to exceed a specific number of characters.
Edit Mask
Use with Static Lists and Custom Values. The Edit Mask forces users to enter a response in a particular format. Some of the functionality of the Edit Mask can also be achieved using the Range Options.
"A" (allows an alphanumeric character and requires the entry of a character in the parameter value).
"a" (allows an alphanumeric character and does not require the entry of a character in the parameter value).
"0" (allows a digit [0 to 9] and requires the entry of a character in the parameter value).
"9" (allows a digit or a space, and does not require the entry of a character in the parameter value).

PARAMETER FIELDS
72
"#" (allows a digit, space, or plus/minus sign, and does not require the entry of a character in the parameter value).
"L" (allows a letter [A to Z], and requires the entry of a character in the parameter value).
"?" (allows a letter, and does not require the entry of a character in the parameter value).
"&" (allows any character or space, and requires the entry of a character in the parameter value).
"C" (allows any character or space, and does not require the entry of a character in the parameter value).
". , : ; - /" (separator characters). Inserting separator characters into an edit mask is something like hard coding the formatting for the parameter field. When the field is placed on the report, the separator character will appear in the field object frame, like this: LLLL/0000. This example depicts an edit mask that requires four letters followed by four numbers.
"<" (causes subsequent characters to be converted to lowercase).
">" (causes subsequent characters to be converted to uppercase).
"\" (causes the subsequent character to be displayed as a literal). For example, the edit mask "\A" would display a parameter value of "A." If the edit mask is "00\A00," then a valid parameter value would consist of two digits, the letter "A," and then two additional digits.
"Password". Allows you to set the edit mask to "Password," you can create conditional formulas specifying that certain sections of the report become visible only when certain user passwords are entered.
Create Parameter To create a parameter
Right-click on the Parameter Fields entry in the Field Explorer. NOTE: If you do not see the Field Explorer, choose View, Field Explorer from the menu to add it).
Parameter Fields Entry
Select “New” from the Pop-Up menu.
PARAMETER FIELDS
73
New Parameter Field Menu
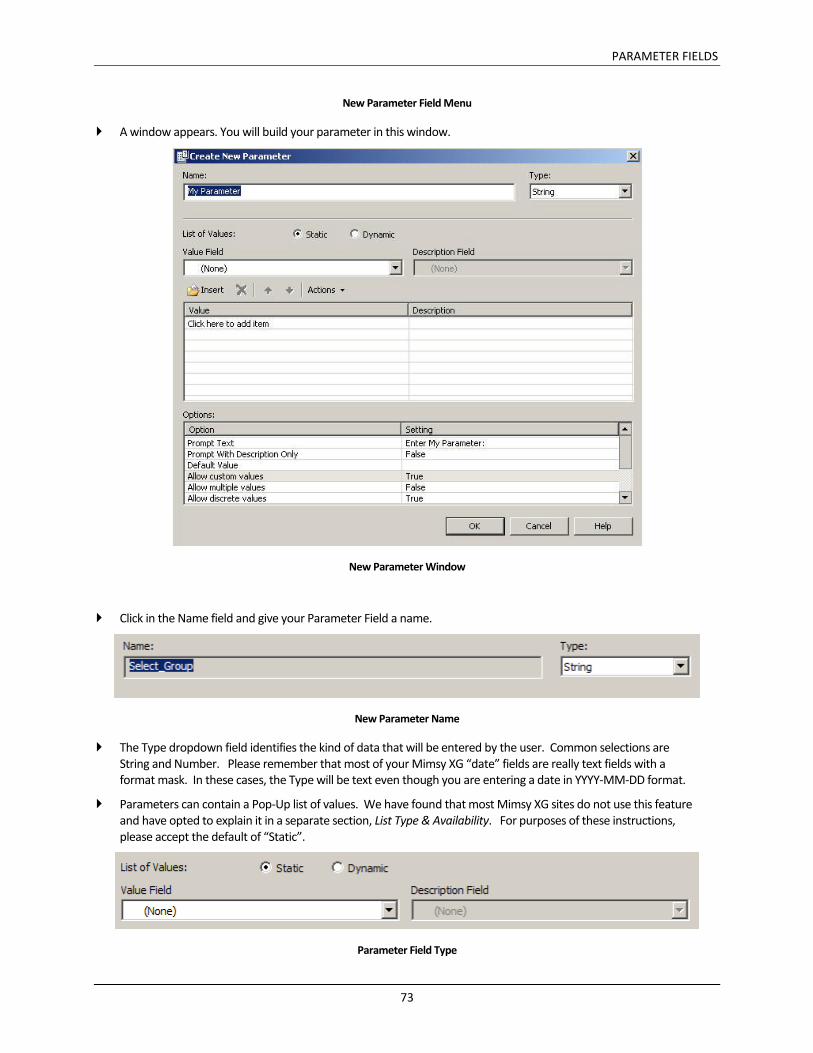
A window appears. You will build your parameter in this window.
New Parameter Window
Click in the Name field and give your Parameter Field a name.
New Parameter Name
The Type dropdown field identifies the kind of data that will be entered by the user. Common selections are String and Number. Please remember that most of your Mimsy XG “date” fields are really text fields with a format mask. In these cases, the Type will be text even though you are entering a date in YYYY-MM-DD format.
Parameters can contain a Pop-Up list of values. We have found that most Mimsy XG sites do not use this feature and have opted to explain it in a separate section, List Type & Availability. For purposes of these instructions, please accept the default of “Static”.
Parameter Field Type
PARAMETER FIELDS
74
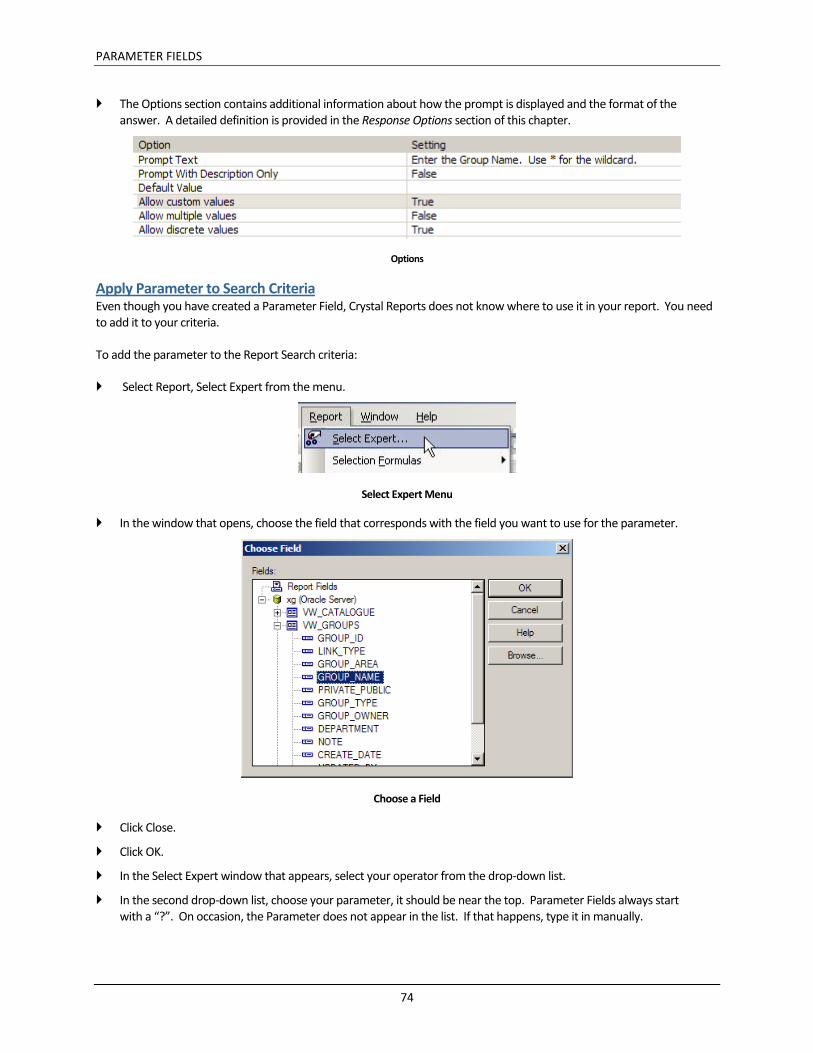
The Options section contains additional information about how the prompt is displayed and the format of the answer. A detailed definition is provided in the Response Options section of this chapter.
Options
Apply Parameter to Search Criteria Even though you have created a Parameter Field, Crystal Reports does not know where to use it in your report. You need to add it to your criteria.
To add the parameter to the Report Search criteria:
Select Report, Select Expert from the menu.
Select Expert Menu
In the window that opens, choose the field that corresponds with the field you want to use for the parameter.
Choose a Field
Click Close.
Click OK.
In the Select Expert window that appears, select your operator from the drop-down list.
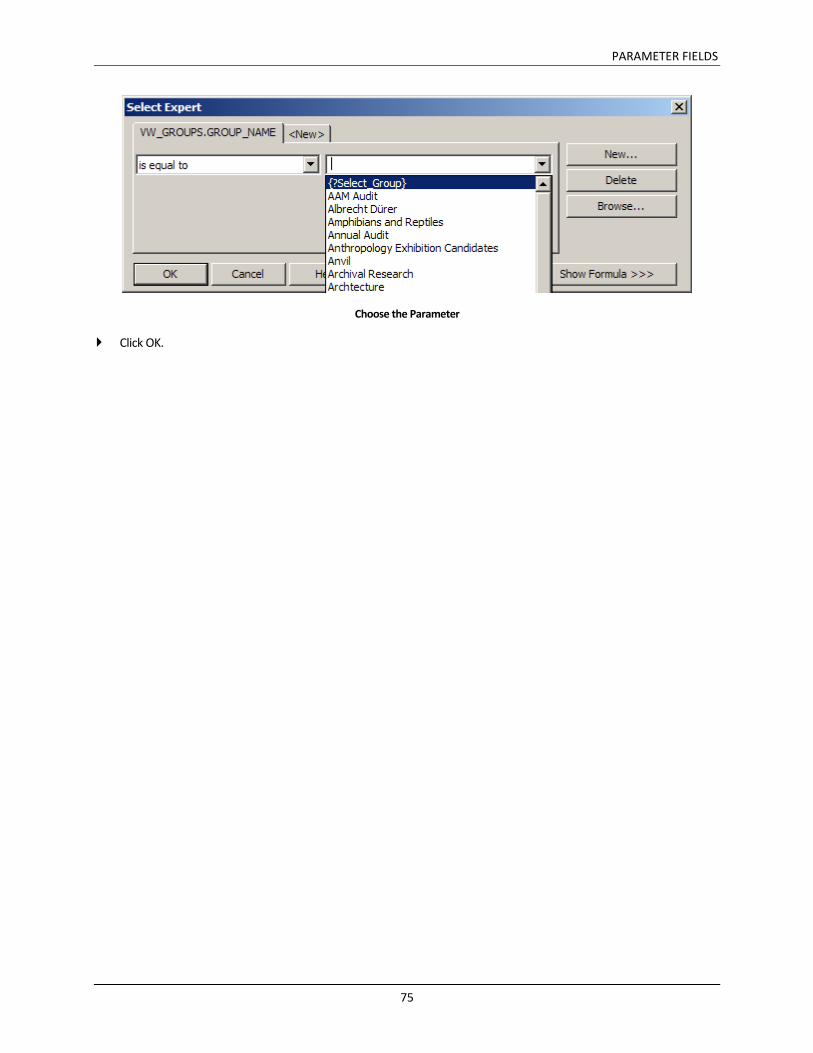
In the second drop-down list, choose your parameter, it should be near the top. Parameter Fields always start with a “?”. On occasion, the Parameter does not appear in the list. If that happens, type it in manually.
PARAMETER FIELDS
75
Choose the Parameter
Click OK.

FORMULA FIELDS
77
Chapter 9 - Formula Fields
Using Crystal Reports, you can create formula fields that concatenate (string together) data fields and punctuation. This is valuable because data (like Makers and Dates Made) can differ in length, which can cause data in the report to overlap. To remedy, create a Formula Field that connects these data fields together.
FORMULA FIELDS
78
Quick Start: Formulas Detailed instructions for creating Formulas are included in this chapter. For a brief summary of how to create formulas, please use the instructions below.
In the Field Explorer, right click on Formula Fields.
Select NEW from the Pop-Up menu.
The Formula Window displays.
Click in the Name field and give your formula a name.
Click OK.
Create your formula in the Formula Workshop.
Formula Workshop Any criteria used to select records or create a field are considered a formula. Formulas may be made using the Crystal Formula Language (Formula Fields), the Select Expert (Selection Formulas) and SQL Expressions (by using the SQL Plus programming commands). You may also create Formatting Formulas that may be used to apply characteristics such as inserting page breaks and printing sections with different background colors.
Most formulas are built using the Formula Workshop.
To access the Formula Workshop:
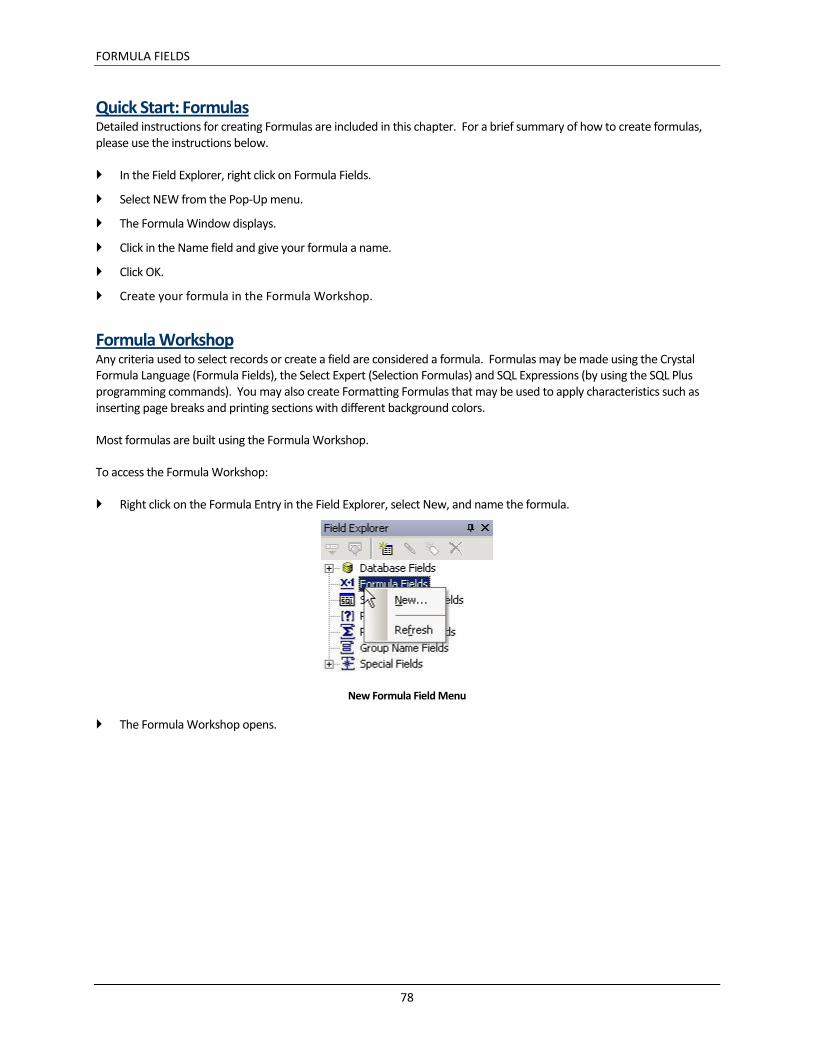
Right click on the Formula Entry in the Field Explorer, select New, and name the formula.
New Formula Field Menu
The Formula Workshop opens.

FORMULA FIELDS
79
Formula Workshop
Once the Formula is made, it can be added to the report just like any other field
Report Formulas All Report Formulas appear on the left panel of the Formula Workshop. As mentioned previously, any criteria used to select records or create a field are considered a formula.
Report Fields Formulas may only be created using the Tables and Fields available in a report. The Report Fields column displays each table in the report. Clicking on a table displays the fields in that table. Double-clicking on any field name adds it to the Formula Workspace.
Report Functions Functions are pre-defined programming shortcuts that can be applied to a field. They include procedures such as converting a field to a true date, counting records, and shifting a field to uppercase. The functions are grouped by category. Clicking a category adds the function to the report.
Operators Operators are actions that are applied to two or more fields. Operations include adding two fields together and calculating the sum of two fields. There will be very few occasions where you will need an operator as Report Functions enable you to accomplish common reporting requests.
Formula Workspace The workspace displays the current formula. You may either click on Fields, Functions, or Operators to build your formula, or you may type in the space.
FORMULA FIELDS
80
Create a Formula Field using Crystal Formulas The following steps describe how to create a new formula. In this example, we are going to create a formula that checks to see if the Maker field is filled in. If it is, the Maker field will print; if it is not filled in, the Place Made will print.
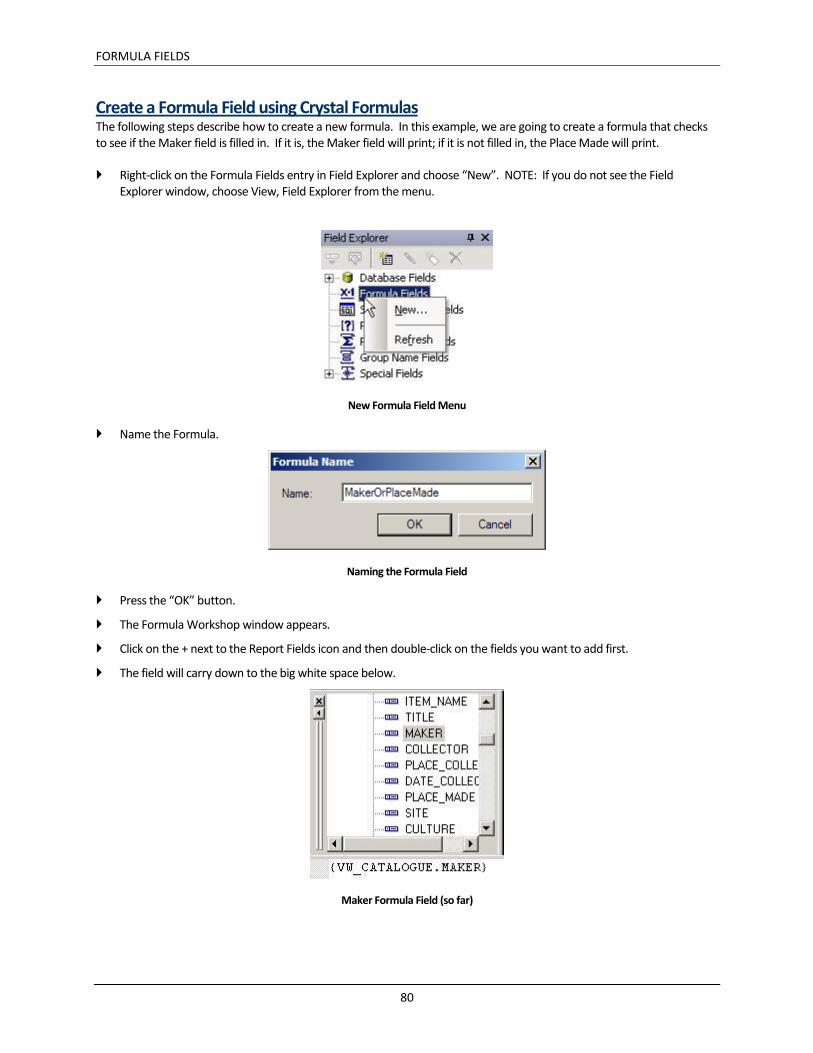
Right-click on the Formula Fields entry in Field Explorer and choose “New”. NOTE: If you do not see the Field Explorer window, choose View, Field Explorer from the menu.
New Formula Field Menu
Name the Formula.
Naming the Formula Field
Press the “OK” button.
The Formula Workshop window appears.
Click on the + next to the Report Fields icon and then double-click on the fields you want to add first.
The field will carry down to the big white space below.
Maker Formula Field (so far)
FORMULA FIELDS
81
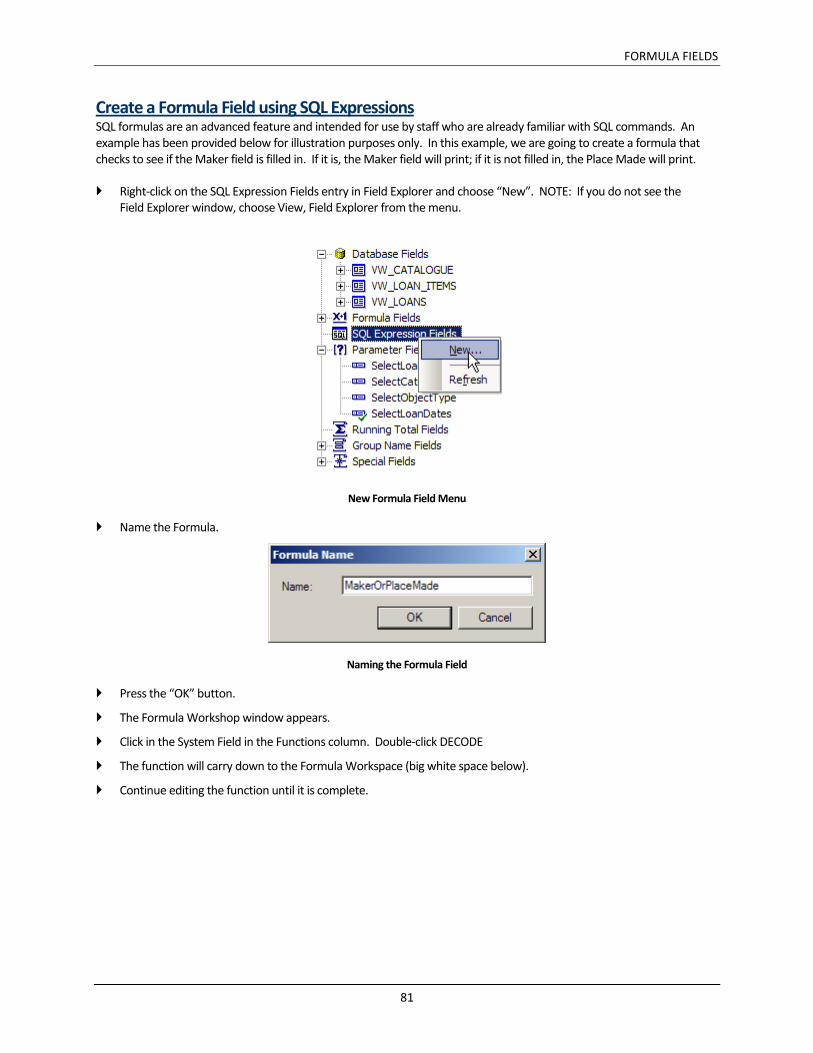
Create a Formula Field using SQL Expressions SQL formulas are an advanced feature and intended for use by staff who are already familiar with SQL commands. An example has been provided below for illustration purposes only. In this example, we are going to create a formula that checks to see if the Maker field is filled in. If it is, the Maker field will print; if it is not filled in, the Place Made will print.
Right-click on the SQL Expression Fields entry in Field Explorer and choose “New”. NOTE: If you do not see the Field Explorer window, choose View, Field Explorer from the menu.
New Formula Field Menu
Name the Formula.
Naming the Formula Field
Press the “OK” button.
The Formula Workshop window appears.
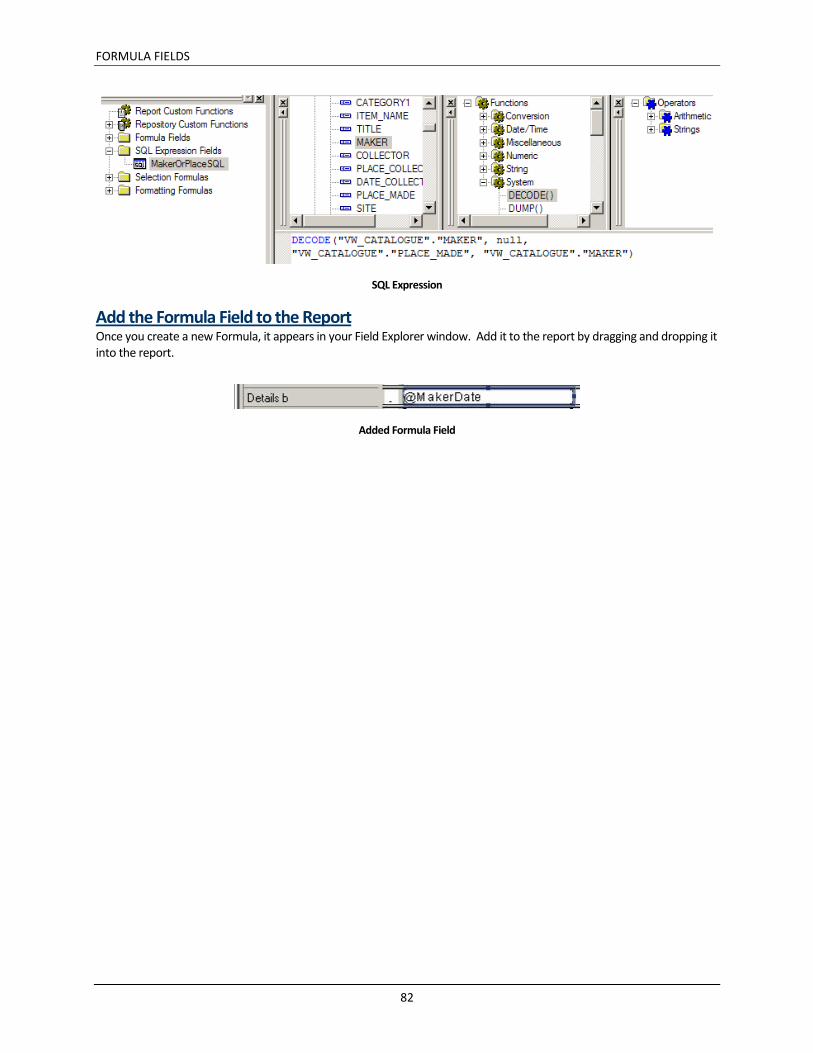
Click in the System Field in the Functions column. Double-click DECODE
The function will carry down to the Formula Workspace (big white space below).
Continue editing the function until it is complete.
FORMULA FIELDS
82
SQL Expression
Add the Formula Field to the Report Once you create a new Formula, it appears in your Field Explorer window. Add it to the report by dragging and dropping it into the report.
Added Formula Field
SUBREPORTS
83
Chapter 10 - Sub-reports
Sub-reports are reports embedded in existing reports. They are frequently used to insert images into a report and for repeating data elements.
Adding Images to an Existing Report
We recommend using a subreport when you will have multiple instances of repeating data.

SUBREPORTS
84
Quick Start: Subreports Detailed instructions for creating Formulas are included in this chapter. For a brief summary of how to add subreports, please use the instructions below.
Create the subreport as if if were a “regular” report. Close the subreport.
Open the report to which you wish to add the sub-report.
Choose Insert, Sub-report from the menu.
Choose an Existing Report radio button.
Click BROWSE to navigate to the location of your sub-report.
Select the sub-report to insert.
Click OPEN.
Click the Link tab. When 2 reports are joined, you must tell Crystal how they are related.
The fields on the left are the fields in the main report. When you double-click the linking field in the main report, Crystal automatically links to the sub-report. To verify the link, use the dropdown list in the right panel. You are able to change the link at this point.
Click OK
You will return to Design View and are able to drop the sub-report in the appropriate location.
Adding a Subreport The instructions below assume you have already created at least two reports (one is the “main” report and one will be used as the subreport).
To add a subreport:
Open the report to which you wish to add the sub-report.
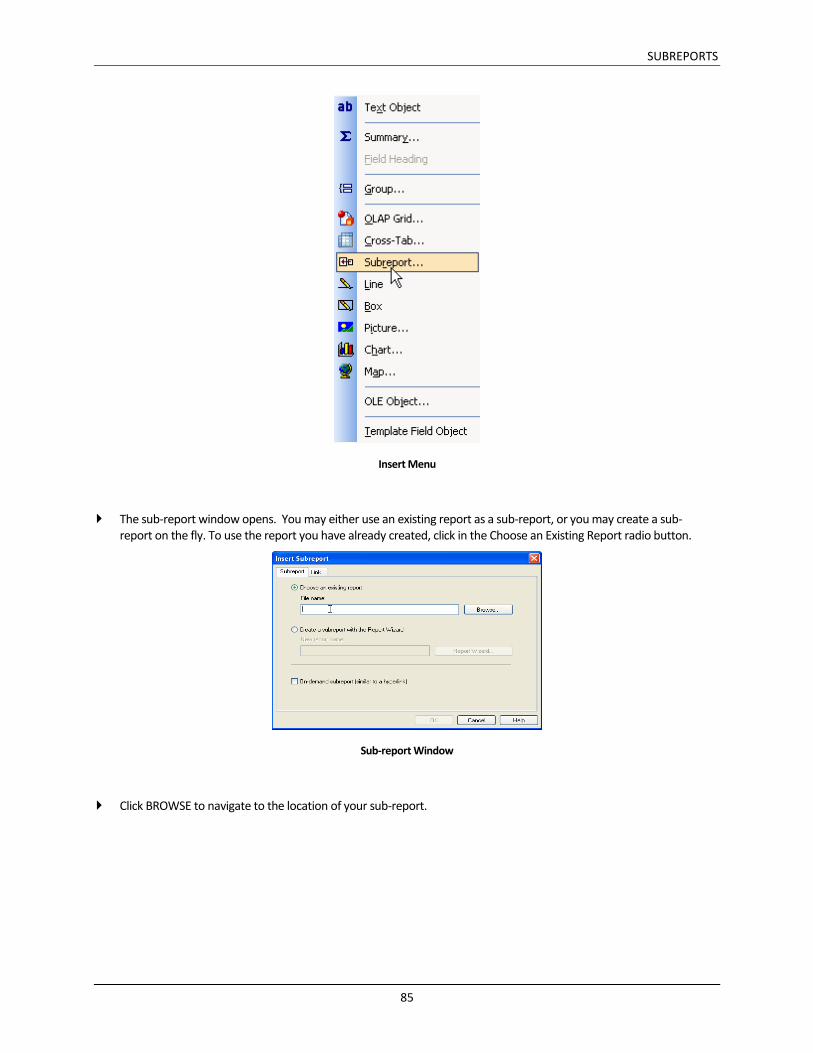
Choose Insert, Sub-report from the menu.
SUBREPORTS
85
Insert Menu
The sub-report window opens. You may either use an existing report as a sub-report, or you may create a sub-report on the fly. To use the report you have already created, click in the Choose an Existing Report radio button.
Sub-report Window
Click BROWSE to navigate to the location of your sub-report.
SUBREPORTS
86
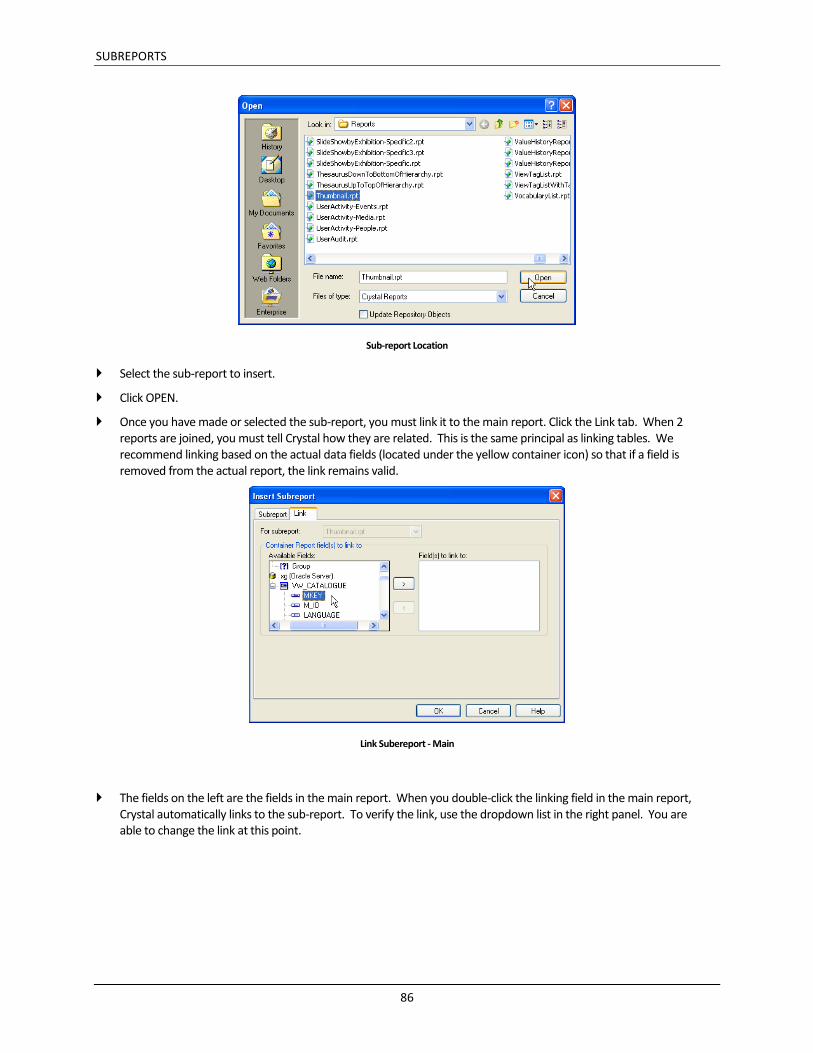
Sub-report Location
Select the sub-report to insert.
Click OPEN.
Once you have made or selected the sub-report, you must link it to the main report. Click the Link tab. When 2 reports are joined, you must tell Crystal how they are related. This is the same principal as linking tables. We recommend linking based on the actual data fields (located under the yellow container icon) so that if a field is removed from the actual report, the link remains valid.
Link Subereport - Main
The fields on the left are the fields in the main report. When you double-click the linking field in the main report, Crystal automatically links to the sub-report. To verify the link, use the dropdown list in the right panel. You are able to change the link at this point.
SUBREPORTS
87
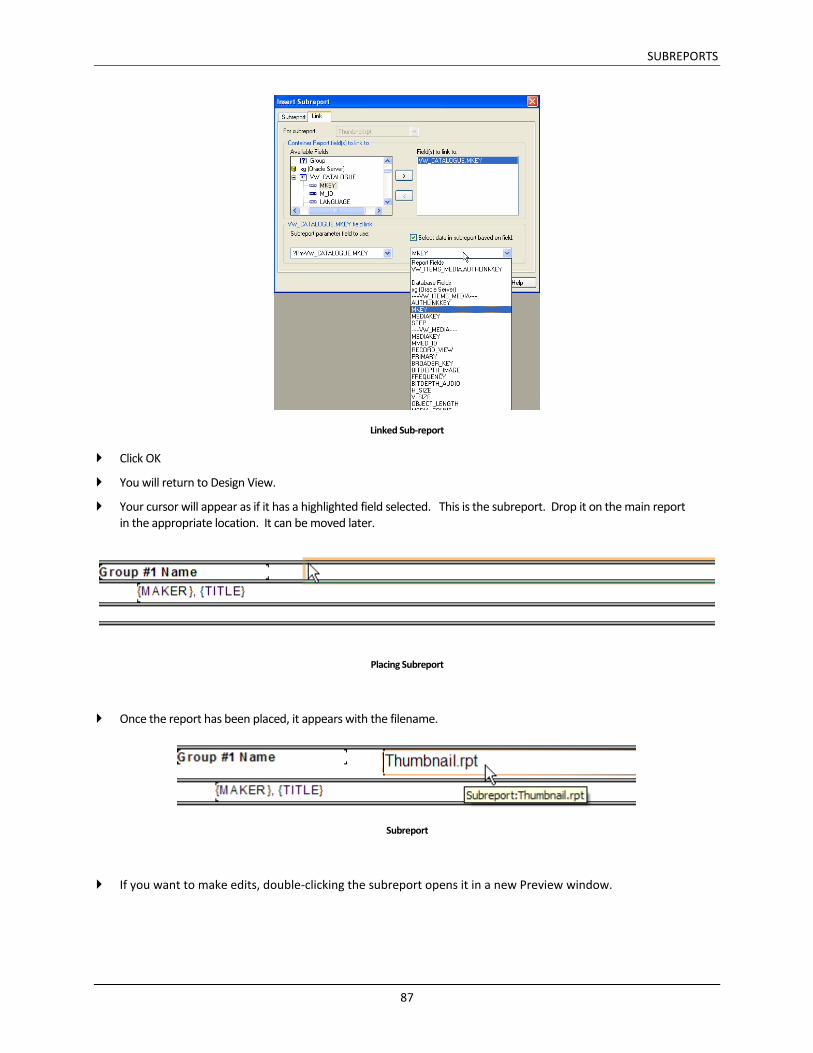
Linked Sub-report
Click OK
You will return to Design View.
Your cursor will appear as if it has a highlighted field selected. This is the subreport. Drop it on the main report in the appropriate location. It can be moved later.
Placing Subreport
Once the report has been placed, it appears with the filename.
Subreport
If you want to make edits, double-clicking the subreport opens it in a new Preview window.
SUBREPORTS
88
Changing Subreport Links To change an existing link (or if you forgot to create one):
Select Edit, Subreport Links or right click on the subreport and select Change Subreport Links.
The Link window displays.
Make any modifications.
Click OK.
Refresh your report data.
Deleting a Subreport To delete a subreport:
Click on the subreport.
Press the DELETE key on your keyboard.
Formatting a Subreport Once the subreport is placed in the main report, you may wish to change the properties.
To format the subreport:
Right click on the subreport.
Select Fomat Subreport from the Pop-Up menu.
Make any necessary adjustments.

GROUPING
89
Chapter 11 - Grouping
The concept of Groups in Crystal Reports is different than a Mimsy XG Group. In Mimsy XG, a group is a list of records. In Crystal, a Group is a cluster of records used for analysis.
Create a Group-Based Report
GROUPING
90
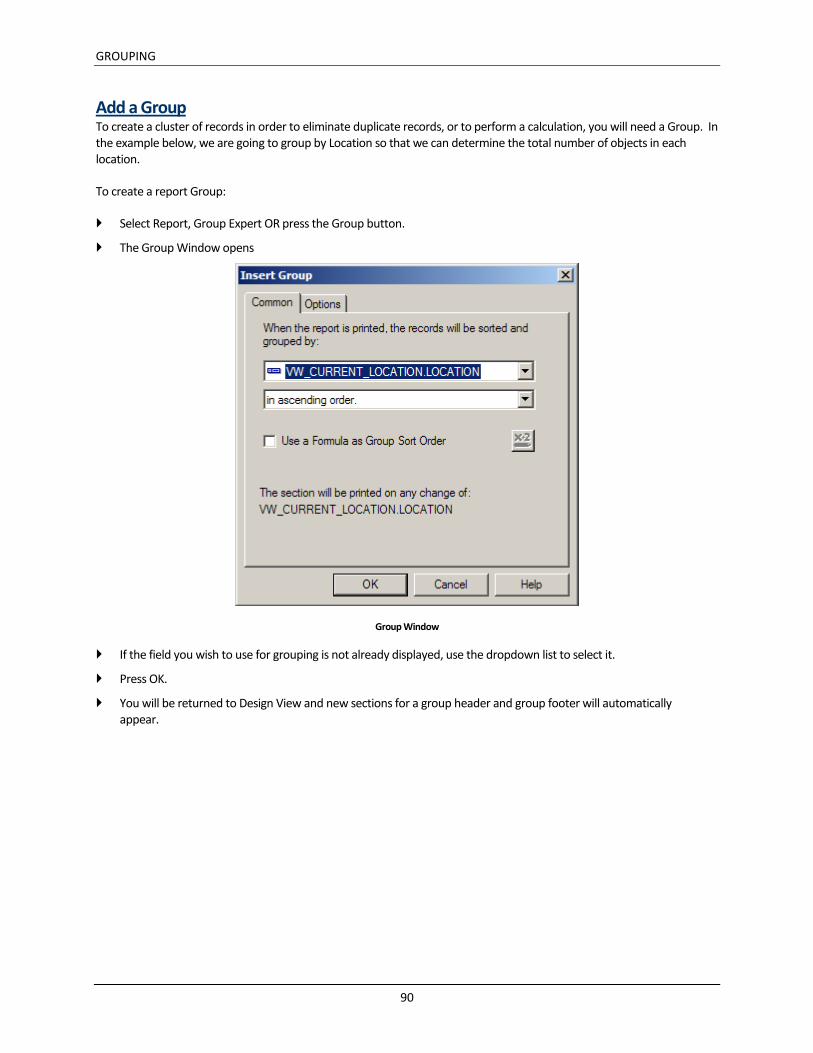
Add a Group To create a cluster of records in order to eliminate duplicate records, or to perform a calculation, you will need a Group. In the example below, we are going to group by Location so that we can determine the total number of objects in each location.
To create a report Group:
Select Report, Group Expert OR press the Group button.
The Group Window opens
Group Window
If the field you wish to use for grouping is not already displayed, use the dropdown list to select it.
Press OK.
You will be returned to Design View and new sections for a group header and group footer will automatically appear.

GROUPING
91
New Sections
Once a Group has been created, you may add any sums or counts to the Group Footer or Report Footer.
Record Hierarchies Grouping is also used when you want to display parent child relationships in a “tree.”
Record Hierarchy in a “Tree”
To show a record hierarchy on your report:
Select Report, Group Expert OR press the Group button.
The Group Window opens.
Select Catalogue.Mkey as the Group By field.
Click OK.

GROUPING
92
Select Report, Hierarchical Grouping from the menu.
A Hierarchical Group window displays.
Click Sort Data Hierarchically.
Set the Parent ID Field to Parent_Key.
Hierarchy Window
Click OK.
At this time, the hierarchy display forces you to sort by MKEY (rather than ID Number). We are not able to change this with the current Business Objects functionality.

COMMON QUESTIONS
93
Chapter 12 - Common Questions
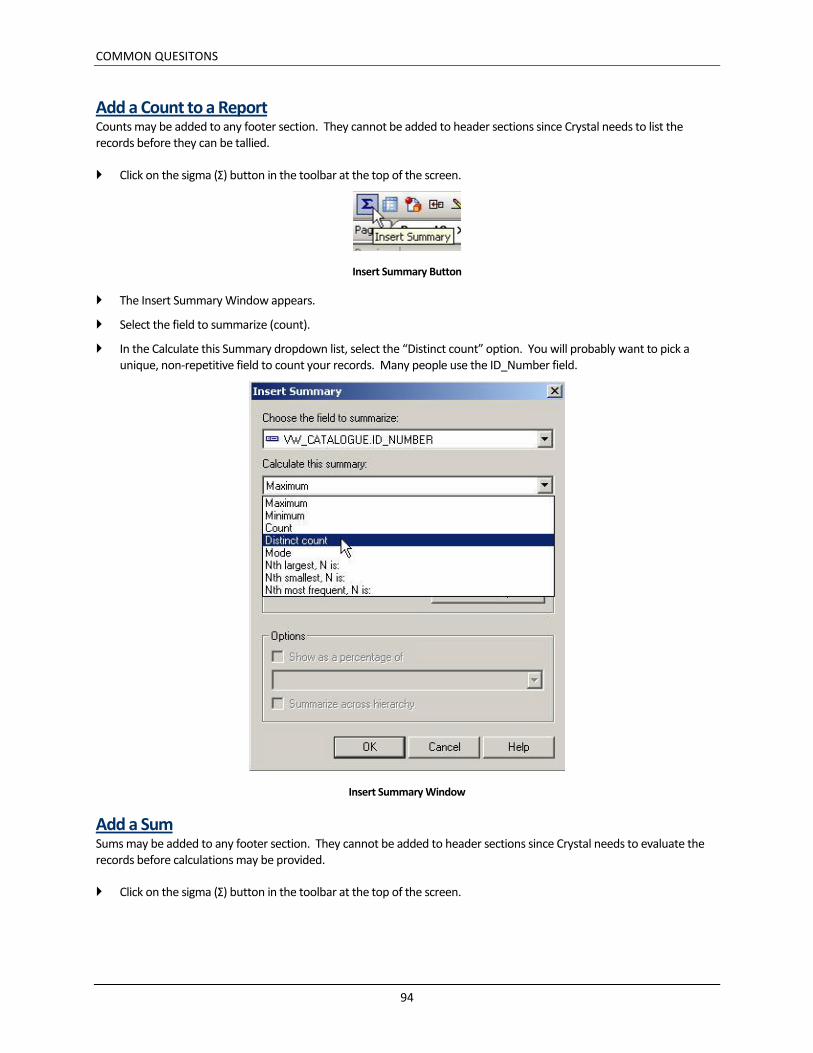
COMMON QUESITONS
94
Add a Count to a Report Counts may be added to any footer section. They cannot be added to header sections since Crystal needs to list the records before they can be tallied.
Click on the sigma (Σ) button in the toolbar at the top of the screen.
Insert Summary Button
The Insert Summary Window appears.
Select the field to summarize (count).
In the Calculate this Summary dropdown list, select the “Distinct count” option. You will probably want to pick a unique, non-repetitive field to count your records. Many people use the ID_Number field.
Insert Summary Window
Add a Sum Sums may be added to any footer section. They cannot be added to header sections since Crystal needs to evaluate the records before calculations may be provided.
Click on the sigma (Σ) button in the toolbar at the top of the screen.
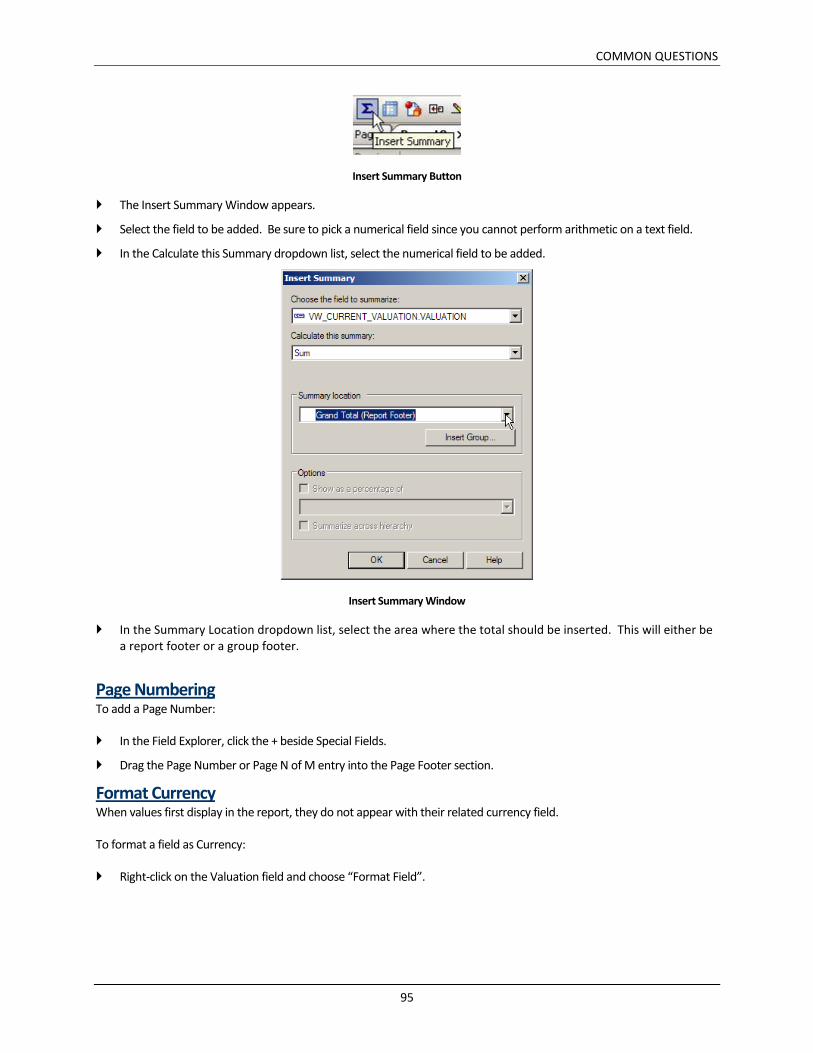
COMMON QUESTIONS
95
Insert Summary Button
The Insert Summary Window appears.
Select the field to be added. Be sure to pick a numerical field since you cannot perform arithmetic on a text field.
In the Calculate this Summary dropdown list, select the numerical field to be added.
Insert Summary Window
In the Summary Location dropdown list, select the area where the total should be inserted. This will either be a report footer or a group footer.
Page Numbering To add a Page Number:
In the Field Explorer, click the + beside Special Fields.
Drag the Page Number or Page N of M entry into the Page Footer section.
Format Currency When values first display in the report, they do not appear with their related currency field.
To format a field as Currency:
Right-click on the Valuation field and choose “Format Field”.
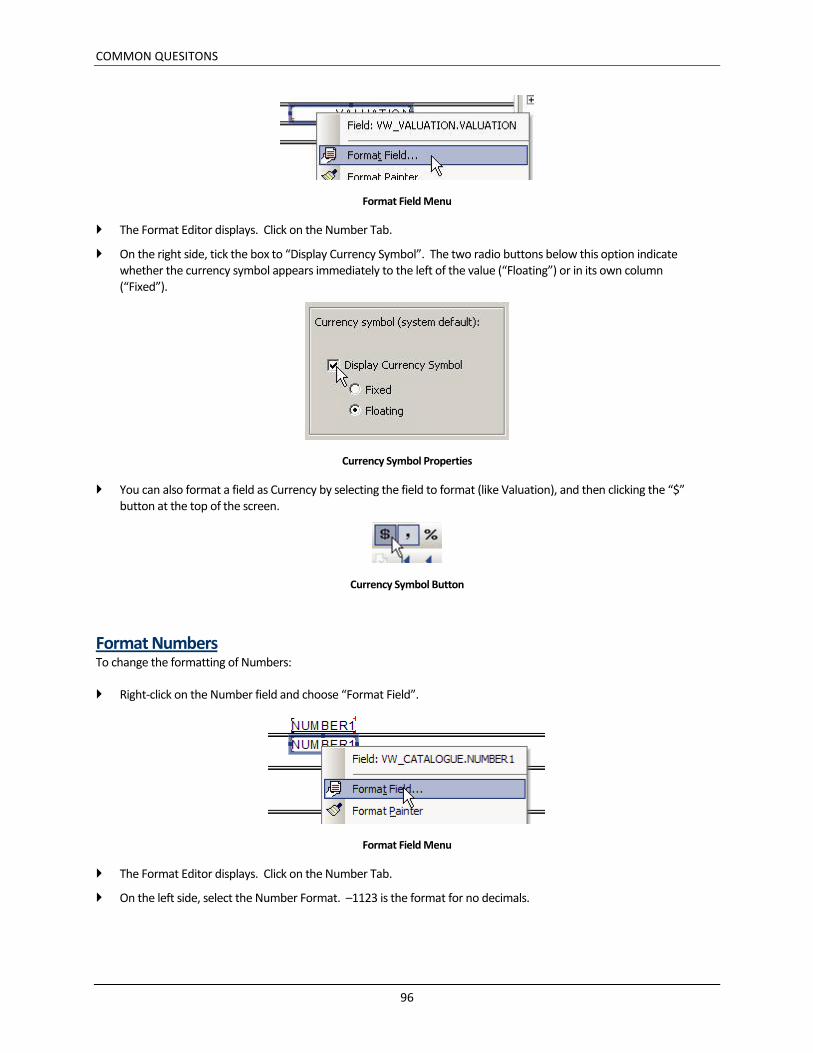
COMMON QUESITONS
96
Format Field Menu
The Format Editor displays. Click on the Number Tab.
On the right side, tick the box to “Display Currency Symbol”. The two radio buttons below this option indicate whether the currency symbol appears immediately to the left of the value (“Floating”) or in its own column (“Fixed”).
Currency Symbol Properties
You can also format a field as Currency by selecting the field to format (like Valuation), and then clicking the “$” button at the top of the screen.
Currency Symbol Button
Format Numbers To change the formatting of Numbers:
Right-click on the Number field and choose “Format Field”.
Format Field Menu
The Format Editor displays. Click on the Number Tab.
On the left side, select the Number Format. –1123 is the format for no decimals.
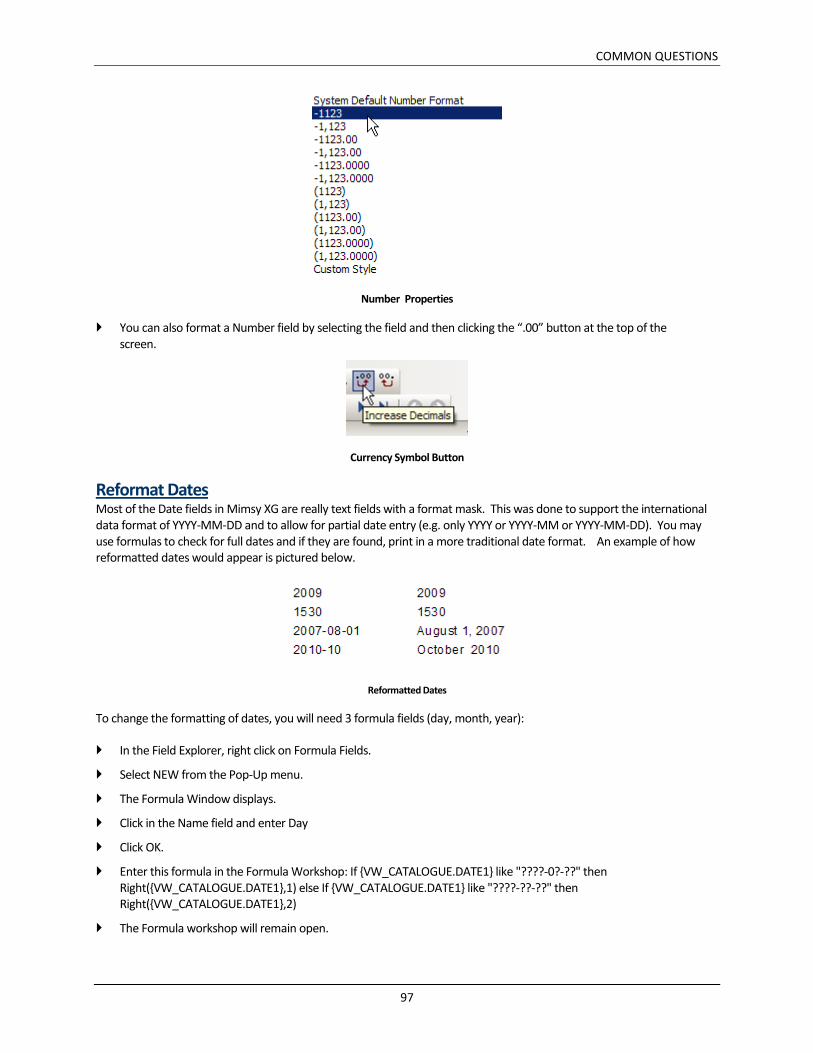
COMMON QUESTIONS
97
Number Properties
You can also format a Number field by selecting the field and then clicking the “.00” button at the top of the screen.
Currency Symbol Button
Reformat Dates Most of the Date fields in Mimsy XG are really text fields with a format mask. This was done to support the international data format of YYYY-MM-DD and to allow for partial date entry (e.g. only YYYY or YYYY-MM or YYYY-MM-DD). You may use formulas to check for full dates and if they are found, print in a more traditional date format. An example of how reformatted dates would appear is pictured below.
Reformatted Dates
To change the formatting of dates, you will need 3 formula fields (day, month, year):
In the Field Explorer, right click on Formula Fields.
Select NEW from the Pop-Up menu.
The Formula Window displays.
Click in the Name field and enter Day
Click OK.
Enter this formula in the Formula Workshop: If {VW_CATALOGUE.DATE1} like "????-0?-??" then Right({VW_CATALOGUE.DATE1},1) else If {VW_CATALOGUE.DATE1} like "????-??-??" then Right({VW_CATALOGUE.DATE1},2)
The Formula workshop will remain open.
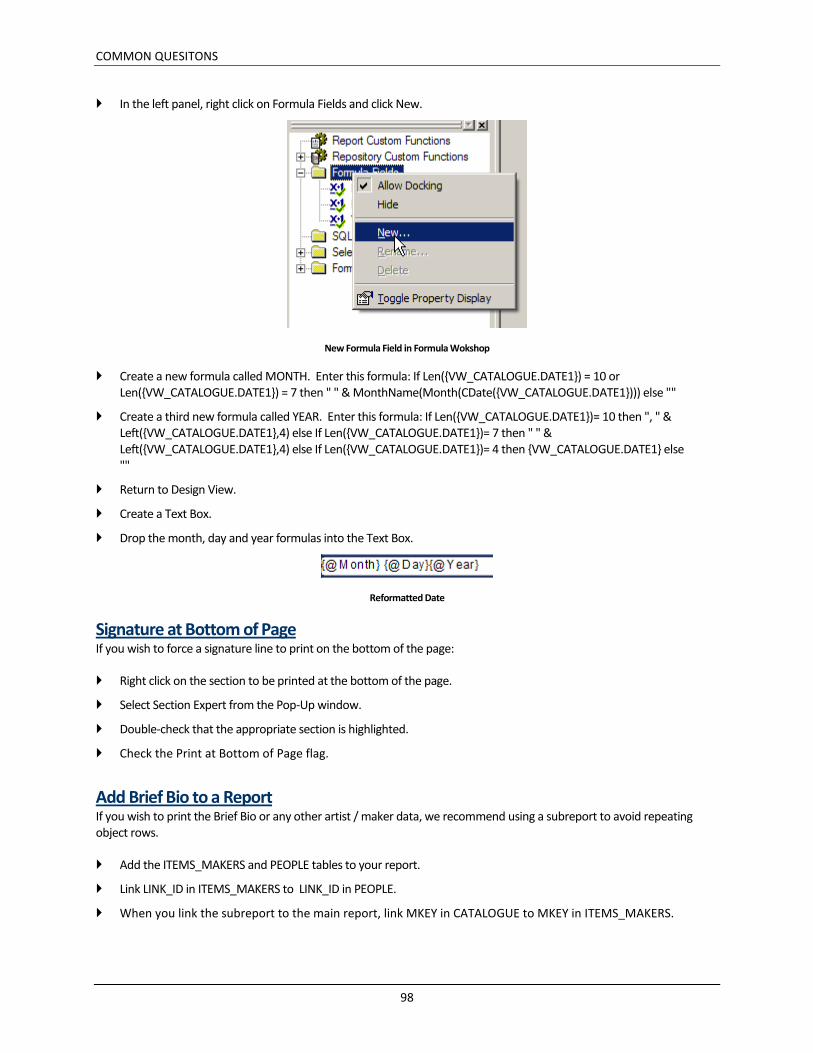
COMMON QUESITONS
98
In the left panel, right click on Formula Fields and click New.
New Formula Field in Formula Wokshop
Create a new formula called MONTH. Enter this formula: If Len({VW_CATALOGUE.DATE1}) = 10 or Len({VW_CATALOGUE.DATE1}) = 7 then " " & MonthName(Month(CDate({VW_CATALOGUE.DATE1}))) else ""
Create a third new formula called YEAR. Enter this formula: If Len({VW_CATALOGUE.DATE1})= 10 then ", " & Left({VW_CATALOGUE.DATE1},4) else If Len({VW_CATALOGUE.DATE1})= 7 then " " & Left({VW_CATALOGUE.DATE1},4) else If Len({VW_CATALOGUE.DATE1})= 4 then {VW_CATALOGUE.DATE1} else ""
Return to Design View.
Create a Text Box.
Drop the month, day and year formulas into the Text Box.
Reformatted Date
Signature at Bottom of Page If you wish to force a signature line to print on the bottom of the page:
Right click on the section to be printed at the bottom of the page.
Select Section Expert from the Pop-Up window.
Double-check that the appropriate section is highlighted.
Check the Print at Bottom of Page flag.
Add Brief Bio to a Report If you wish to print the Brief Bio or any other artist / maker data, we recommend using a subreport to avoid repeating object rows.
Add the ITEMS_MAKERS and PEOPLE tables to your report.
Link LINK_ID in ITEMS_MAKERS to LINK_ID in PEOPLE.
When you link the subreport to the main report, link MKEY in CATALOGUE to MKEY in ITEMS_MAKERS.
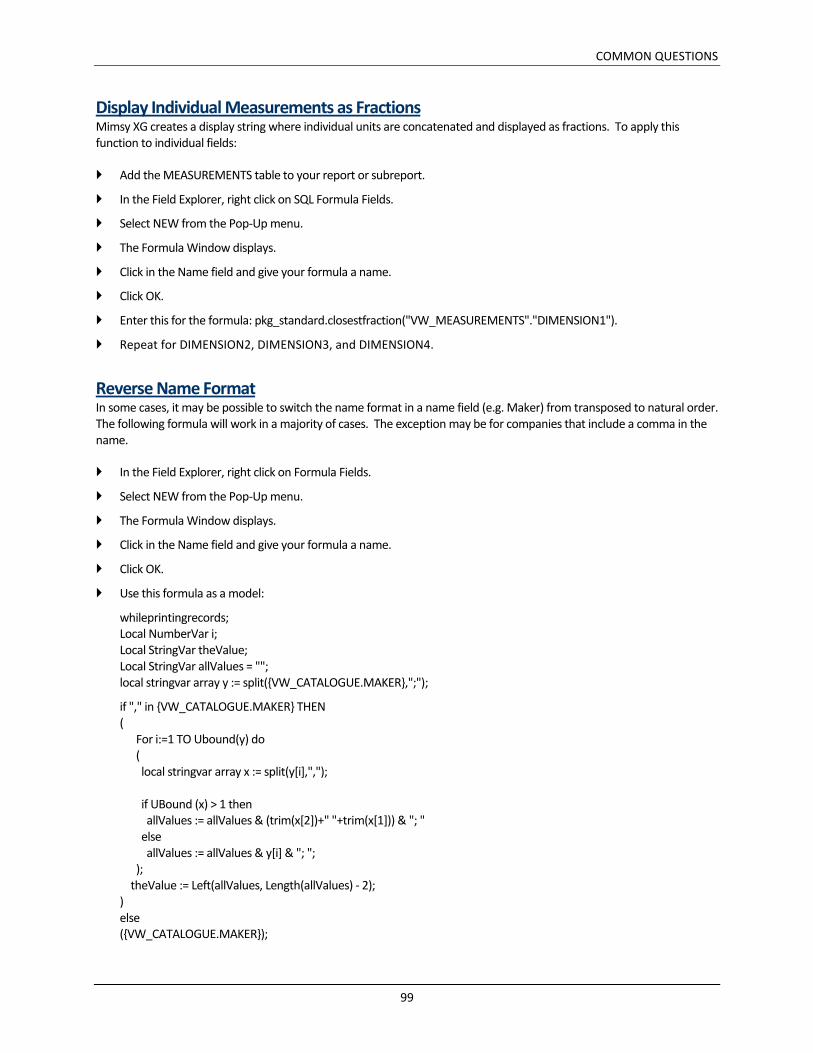
COMMON QUESTIONS
99
Display Individual Measurements as Fractions Mimsy XG creates a display string where individual units are concatenated and displayed as fractions. To apply this function to individual fields:
Add the MEASUREMENTS table to your report or subreport.
In the Field Explorer, right click on SQL Formula Fields.
Select NEW from the Pop-Up menu.
The Formula Window displays.
Click in the Name field and give your formula a name.
Click OK.
Enter this for the formula: pkg_standard.closestfraction("VW_MEASUREMENTS"."DIMENSION1").
Repeat for DIMENSION2, DIMENSION3, and DIMENSION4.
Reverse Name Format In some cases, it may be possible to switch the name format in a name field (e.g. Maker) from transposed to natural order. The following formula will work in a majority of cases. The exception may be for companies that include a comma in the name.
In the Field Explorer, right click on Formula Fields.
Select NEW from the Pop-Up menu.
The Formula Window displays.
Click in the Name field and give your formula a name.
Click OK.
Use this formula as a model:
whileprintingrecords; Local NumberVar i; Local StringVar theValue; Local StringVar allValues = ""; local stringvar array y := split({VW_CATALOGUE.MAKER},";");
if "," in {VW_CATALOGUE.MAKER} THEN ( For i:=1 TO Ubound(y) do ( local stringvar array x := split(y[i],","); if UBound (x) > 1 then allValues := allValues & (trim(x[2])+" "+trim(x[1])) & "; " else allValues := allValues & y[i] & "; "; ); theValue := Left(allValues, Length(allValues) - 2); ) else ({VW_CATALOGUE.MAKER});
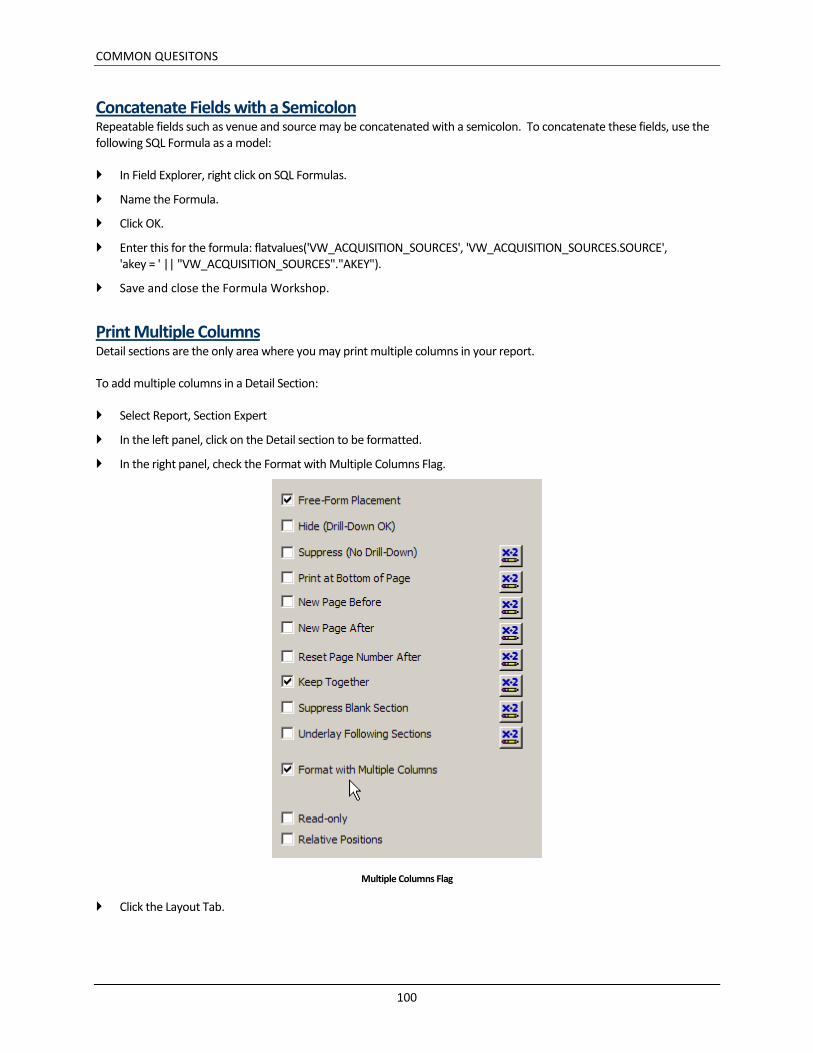
COMMON QUESITONS
100
Concatenate Fields with a Semicolon Repeatable fields such as venue and source may be concatenated with a semicolon. To concatenate these fields, use the following SQL Formula as a model:
In Field Explorer, right click on SQL Formulas.
Name the Formula.
Click OK.
Enter this for the formula: flatvalues('VW_ACQUISITION_SOURCES', 'VW_ACQUISITION_SOURCES.SOURCE', 'akey = ' || "VW_ACQUISITION_SOURCES"."AKEY").
Save and close the Formula Workshop.
Print Multiple Columns Detail sections are the only area where you may print multiple columns in your report.
To add multiple columns in a Detail Section:
Select Report, Section Expert
In the left panel, click on the Detail section to be formatted.
In the right panel, check the Format with Multiple Columns Flag.
Multiple Columns Flag
Click the Layout Tab.
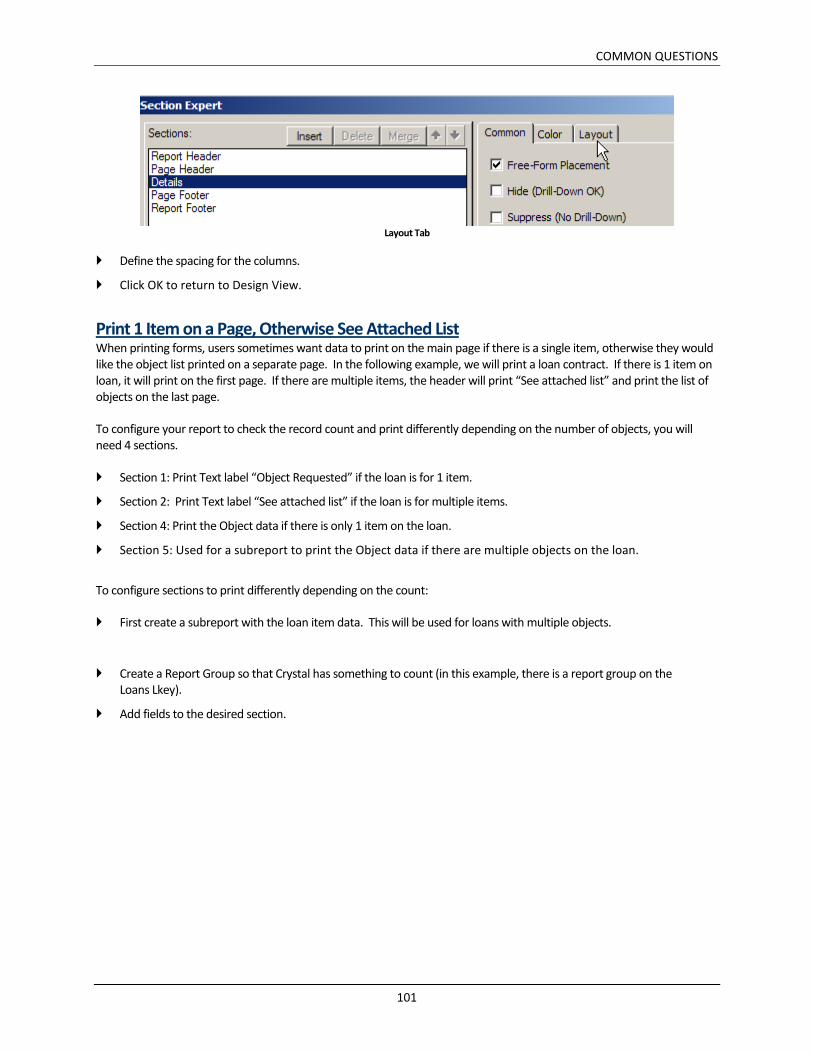
COMMON QUESTIONS
101
Layout Tab
Define the spacing for the columns.
Click OK to return to Design View.
Print 1 Item on a Page, Otherwise See Attached List When printing forms, users sometimes want data to print on the main page if there is a single item, otherwise they would like the object list printed on a separate page. In the following example, we will print a loan contract. If there is 1 item on loan, it will print on the first page. If there are multiple items, the header will print “See attached list” and print the list of objects on the last page.
To configure your report to check the record count and print differently depending on the number of objects, you will need 4 sections.
Section 1: Print Text label “Object Requested” if the loan is for 1 item.
Section 2: Print Text label “See attached list” if the loan is for multiple items.
Section 4: Print the Object data if there is only 1 item on the loan.
Section 5: Used for a subreport to print the Object data if there are multiple objects on the loan.
To configure sections to print differently depending on the count:
First create a subreport with the loan item data. This will be used for loans with multiple objects.
Create a Report Group so that Crystal has something to count (in this example, there is a report group on the Loans Lkey).
Add fields to the desired section.
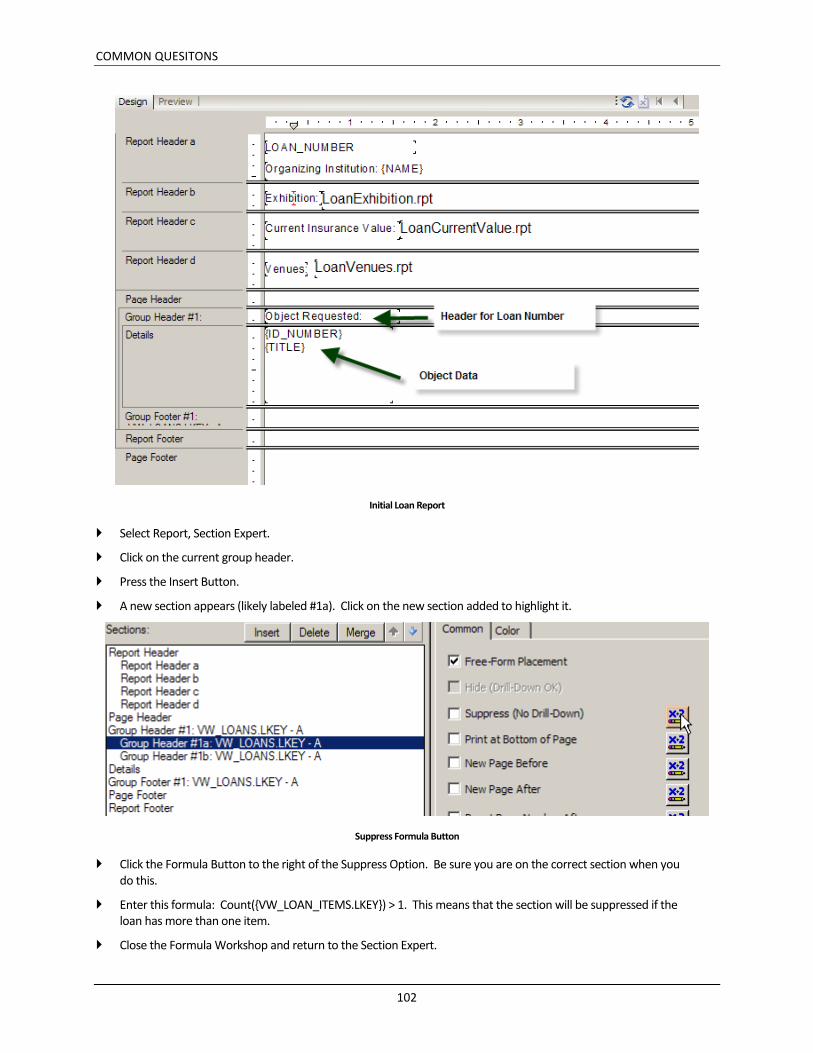
COMMON QUESITONS
102
Initial Loan Report
Select Report, Section Expert.
Click on the current group header.
Press the Insert Button.
A new section appears (likely labeled #1a). Click on the new section added to highlight it.
Suppress Formula Button
Click the Formula Button to the right of the Suppress Option. Be sure you are on the correct section when you do this.
Enter this formula: Count({VW_LOAN_ITEMS.LKEY}) > 1. This means that the section will be suppressed if the loan has more than one item.
Close the Formula Workshop and return to the Section Expert.
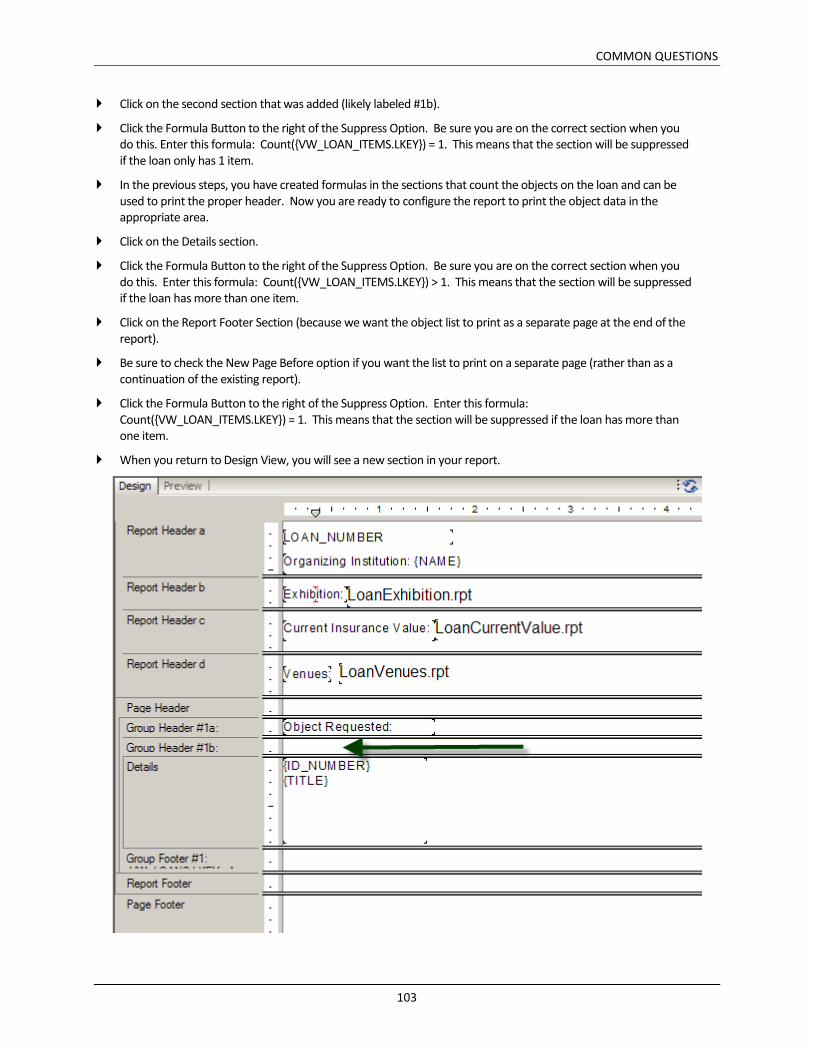
COMMON QUESTIONS
103
Click on the second section that was added (likely labeled #1b).
Click the Formula Button to the right of the Suppress Option. Be sure you are on the correct section when you do this. Enter this formula: Count({VW_LOAN_ITEMS.LKEY}) = 1. This means that the section will be suppressed if the loan only has 1 item.
In the previous steps, you have created formulas in the sections that count the objects on the loan and can be used to print the proper header. Now you are ready to configure the report to print the object data in the appropriate area.
Click on the Details section.
Click the Formula Button to the right of the Suppress Option. Be sure you are on the correct section when you do this. Enter this formula: Count({VW_LOAN_ITEMS.LKEY}) > 1. This means that the section will be suppressed if the loan has more than one item.
Click on the Report Footer Section (because we want the object list to print as a separate page at the end of the report).
Be sure to check the New Page Before option if you want the list to print on a separate page (rather than as a continuation of the existing report).
Click the Formula Button to the right of the Suppress Option. Enter this formula: Count({VW_LOAN_ITEMS.LKEY}) = 1. This means that the section will be suppressed if the loan has more than one item.
When you return to Design View, you will see a new section in your report.
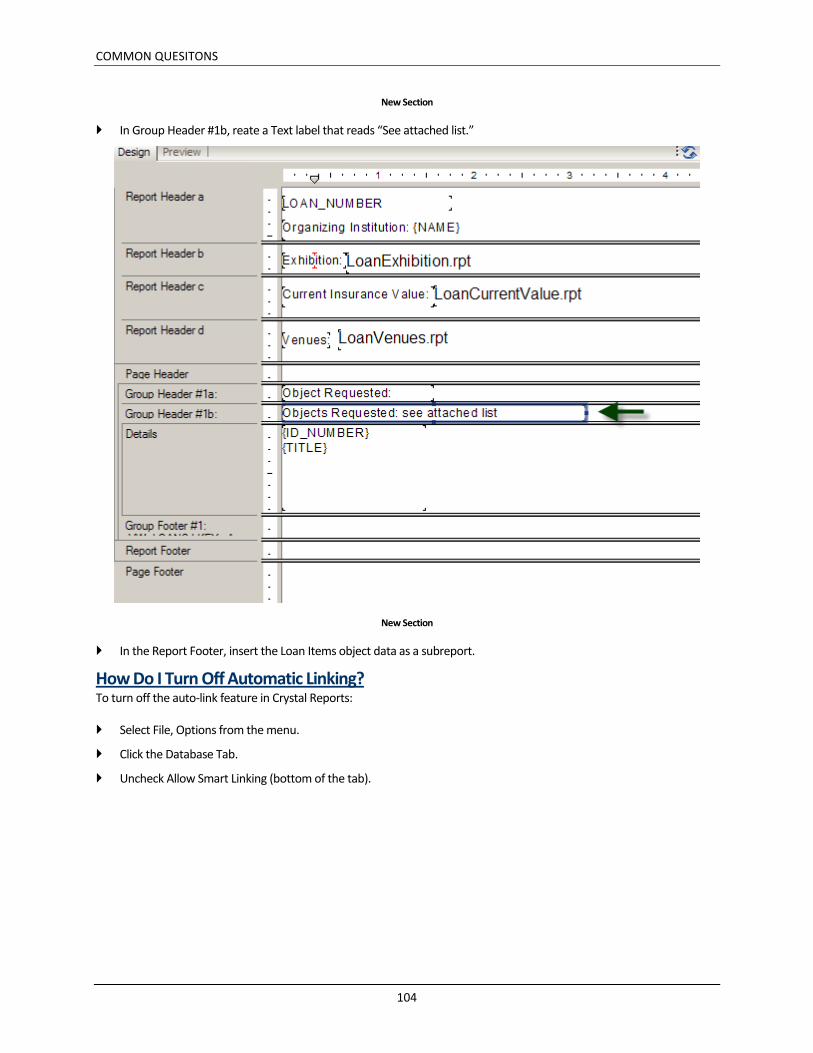
COMMON QUESITONS
104
New Section
In Group Header #1b, reate a Text label that reads “See attached list.”
New Section
In the Report Footer, insert the Loan Items object data as a subreport.
How Do I Turn Off Automatic Linking? To turn off the auto-link feature in Crystal Reports:
Select File, Options from the menu.
Click the Database Tab.
Uncheck Allow Smart Linking (bottom of the tab).
REPORTING WITH IMAGES
105
Chapter 13 - Reporting with Images
Follow the steps in this chapter to make images appear in your reports.
Adding Images to an Existing Report
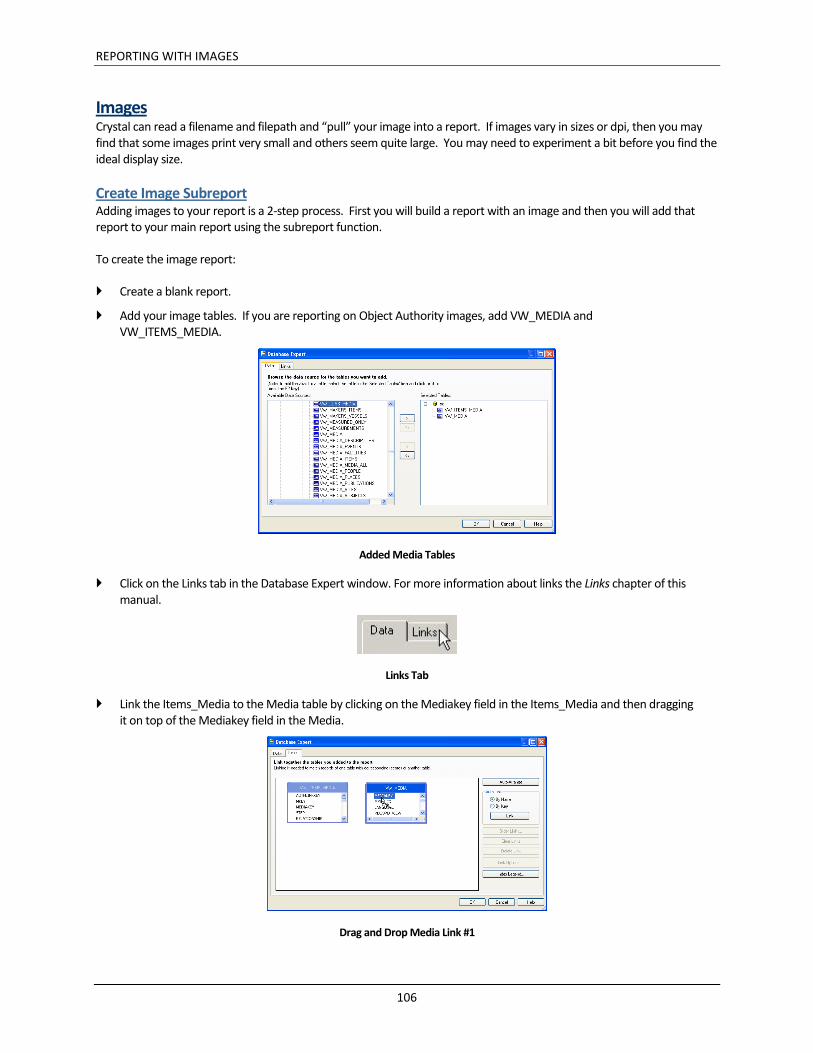
REPORTING WITH IMAGES
106
Images Crystal can read a filename and filepath and “pull” your image into a report. If images vary in sizes or dpi, then you may find that some images print very small and others seem quite large. You may need to experiment a bit before you find the ideal display size.
Create Image Subreport Adding images to your report is a 2-step process. First you will build a report with an image and then you will add that report to your main report using the subreport function.
To create the image report:
Create a blank report.
Add your image tables. If you are reporting on Object Authority images, add VW_MEDIA and VW_ITEMS_MEDIA.
Added Media Tables
Click on the Links tab in the Database Expert window. For more information about links the Links chapter of this manual.
Links Tab
Link the Items_Media to the Media table by clicking on the Mediakey field in the Items_Media and then dragging it on top of the Mediakey field in the Media.
Drag and Drop Media Link #1
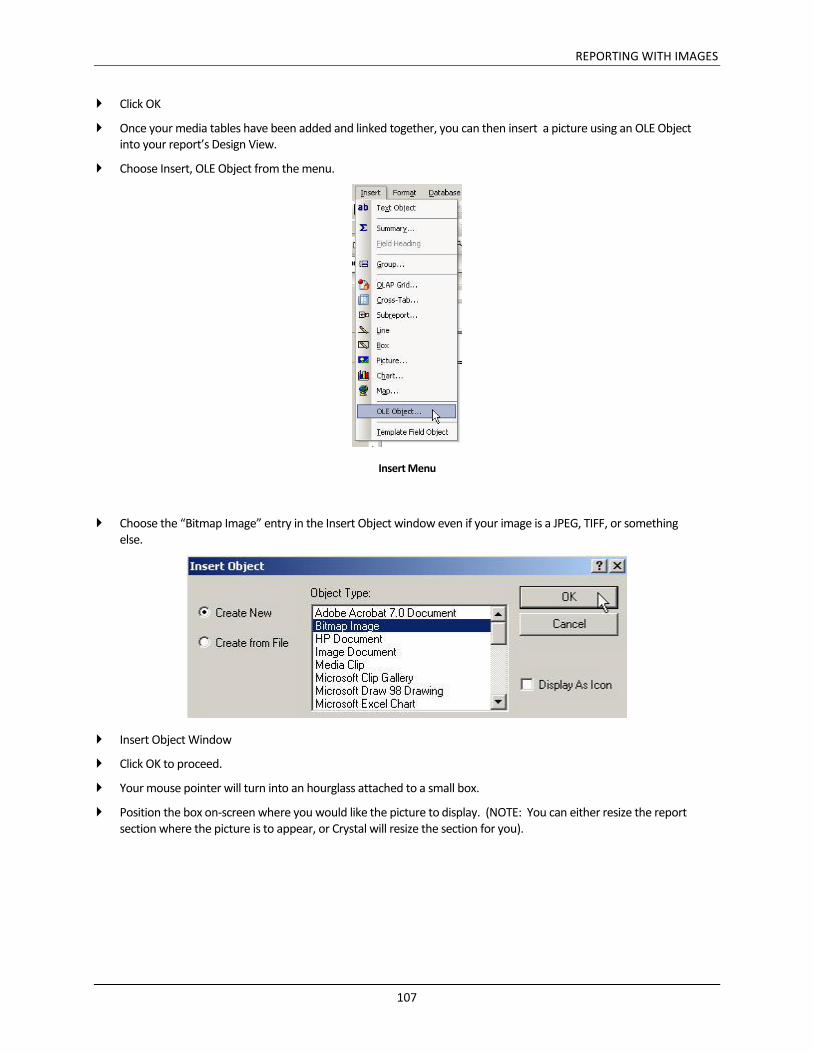
REPORTING WITH IMAGES
107
Click OK
Once your media tables have been added and linked together, you can then insert a picture using an OLE Object into your report’s Design View.
Choose Insert, OLE Object from the menu.
Insert Menu
Choose the “Bitmap Image” entry in the Insert Object window even if your image is a JPEG, TIFF, or something else.
Insert Object Window
Click OK to proceed.
Your mouse pointer will turn into an hourglass attached to a small box.
Position the box on-screen where you would like the picture to display. (NOTE: You can either resize the report section where the picture is to appear, or Crystal will resize the section for you).

REPORTING WITH IMAGES
108
Adding the Picture Box
Once the picture box is placed, it looks like this:
Placed Picture Box
Click outside the picture window to complete the OLE picture box placement. NOTE: if you want the image area to be resized, we suggest that you right click on the OLE Picture Object and select Format Graphic. Click the Picture Tab. In the Scaling fields, adjust both height and width to a different percentage. We have found that it is very difficult to keep the precise aspect ratio if you change the height or width by dragging the side up / down / left / right.
Right-click in the picture window and choose “Format Graphic…” from the menu that appears.
Format Graphic Menu
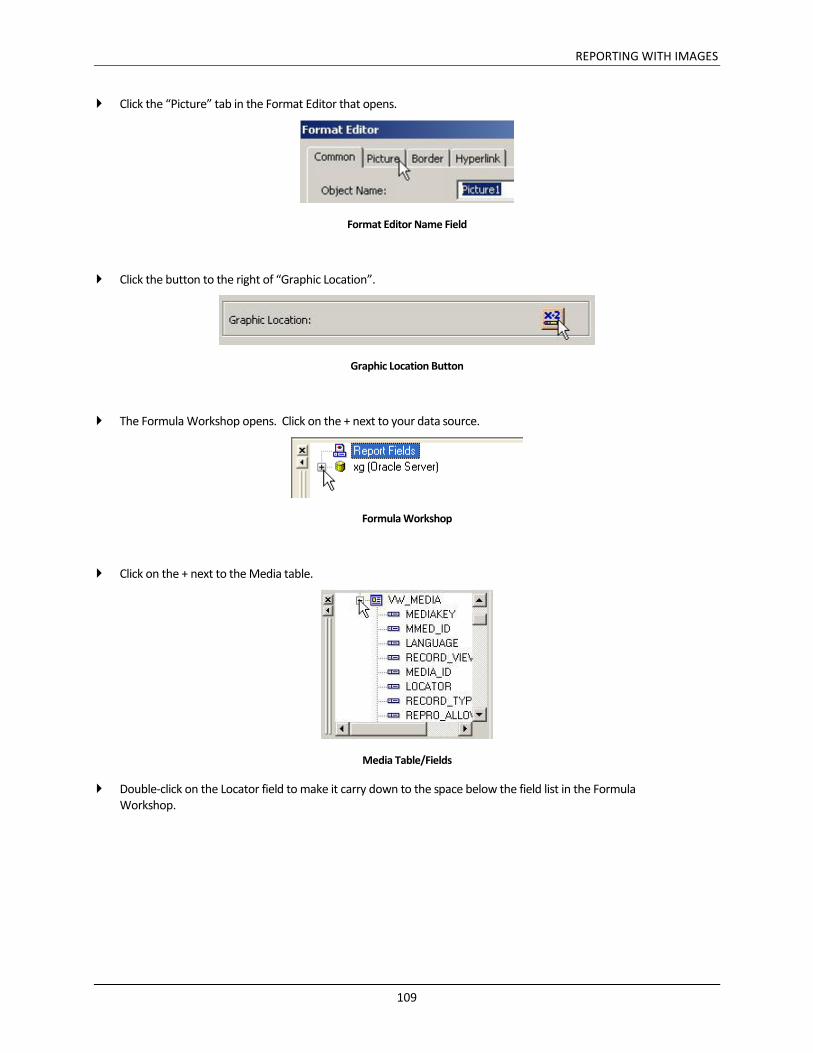
REPORTING WITH IMAGES
109
Click the “Picture” tab in the Format Editor that opens.
Format Editor Name Field
Click the button to the right of “Graphic Location”.
Graphic Location Button
The Formula Workshop opens. Click on the + next to your data source.
Formula Workshop
Click on the + next to the Media table.
Media Table/Fields
Double-click on the Locator field to make it carry down to the space below the field list in the Formula Workshop.

REPORTING WITH IMAGES
110
Media Locator Field
Click immediately after the field name that appears in the whitespace and type a “+”.
Completed Formula Field
Double-click on the Media_ID field.
Close the Formula Workshop.
Click OK.
Save the Report.
Add Image Subreport to Main Report Now that the image report is complete, be sure to save it so that it can be added to other reports as a sub-report.
To add the Image as a Subreport:
Open the “main” report (the one to which the image will be added).
Select Insert, Subreport.
Click the Choose Existing Report option.
Click the Browse Button.
Navigate to the Image Subreport.
Click the LINK tab.
Select the Link Field. If you are linking to an object, the selection will be Catalogue.Mkey.
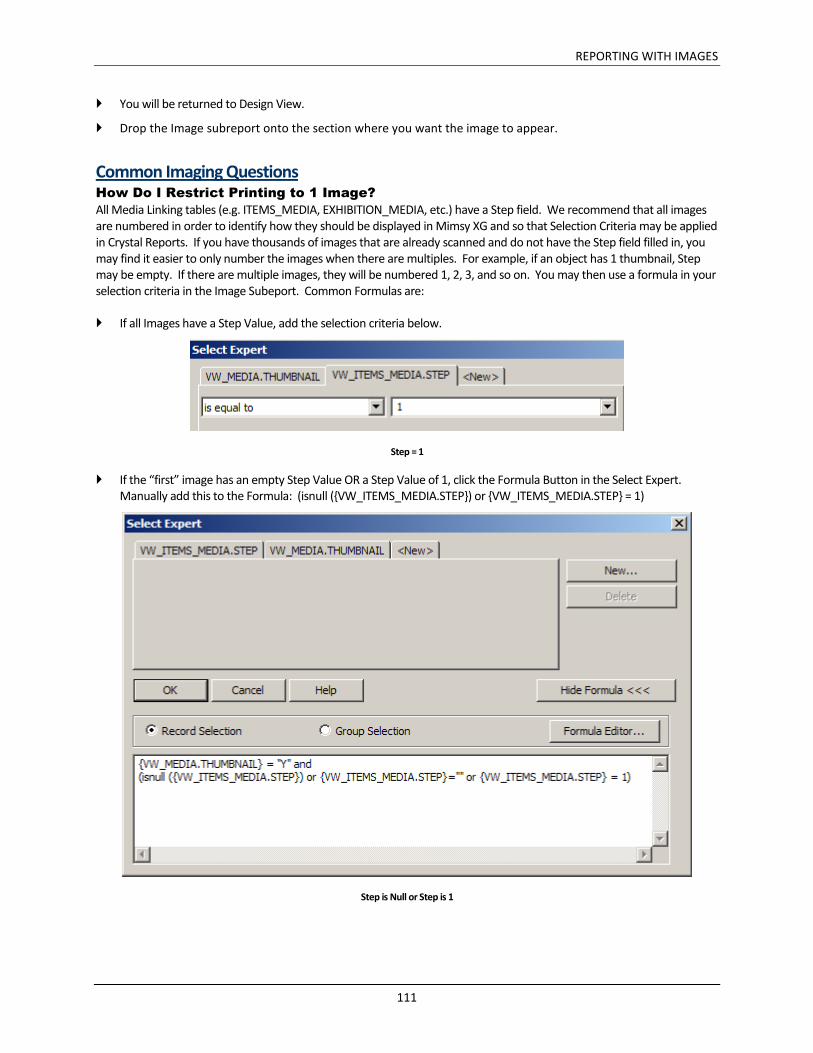
REPORTING WITH IMAGES
111
You will be returned to Design View.
Drop the Image subreport onto the section where you want the image to appear.
Common Imaging Questions How Do I Restrict Printing to 1 Image?
All Media Linking tables (e.g. ITEMS_MEDIA, EXHIBITION_MEDIA, etc.) have a Step field. We recommend that all images are numbered in order to identify how they should be displayed in Mimsy XG and so that Selection Criteria may be applied in Crystal Reports. If you have thousands of images that are already scanned and do not have the Step field filled in, you may find it easier to only number the images when there are multiples. For example, if an object has 1 thumbnail, Step may be empty. If there are multiple images, they will be numbered 1, 2, 3, and so on. You may then use a formula in your selection criteria in the Image Subeport. Common Formulas are:
If all Images have a Step Value, add the selection criteria below.
Step = 1
If the “first” image has an empty Step Value OR a Step Value of 1, click the Formula Button in the Select Expert. Manually add this to the Formula: (isnull ({VW_ITEMS_MEDIA.STEP}) or {VW_ITEMS_MEDIA.STEP} = 1)
Step is Null or Step is 1
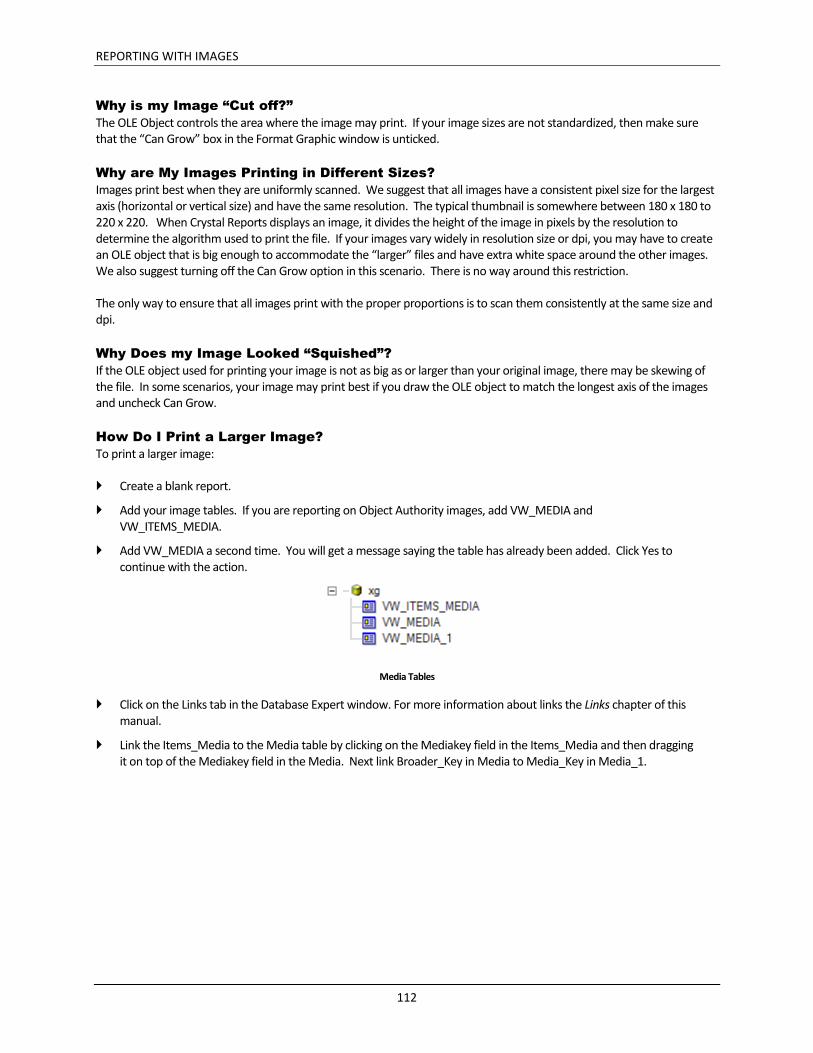
REPORTING WITH IMAGES
112
Why is my Image “Cut off?”
The OLE Object controls the area where the image may print. If your image sizes are not standardized, then make sure that the “Can Grow” box in the Format Graphic window is unticked.
Why are My Images Printing in Different Sizes?
Images print best when they are uniformly scanned. We suggest that all images have a consistent pixel size for the largest axis (horizontal or vertical size) and have the same resolution. The typical thumbnail is somewhere between 180 x 180 to 220 x 220. When Crystal Reports displays an image, it divides the height of the image in pixels by the resolution to determine the algorithm used to print the file. If your images vary widely in resolution size or dpi, you may have to create an OLE object that is big enough to accommodate the “larger” files and have extra white space around the other images. We also suggest turning off the Can Grow option in this scenario. There is no way around this restriction.
The only way to ensure that all images print with the proper proportions is to scan them consistently at the same size and dpi.
Why Does my Image Looked “Squished”?
If the OLE object used for printing your image is not as big as or larger than your original image, there may be skewing of the file. In some scenarios, your image may print best if you draw the OLE object to match the longest axis of the images and uncheck Can Grow.
How Do I Print a Larger Image?
To print a larger image:
Create a blank report.
Add your image tables. If you are reporting on Object Authority images, add VW_MEDIA and VW_ITEMS_MEDIA.
Add VW_MEDIA a second time. You will get a message saying the table has already been added. Click Yes to continue with the action.
Media Tables
Click on the Links tab in the Database Expert window. For more information about links the Links chapter of this manual.
Link the Items_Media to the Media table by clicking on the Mediakey field in the Items_Media and then dragging it on top of the Mediakey field in the Media. Next link Broader_Key in Media to Media_Key in Media_1.
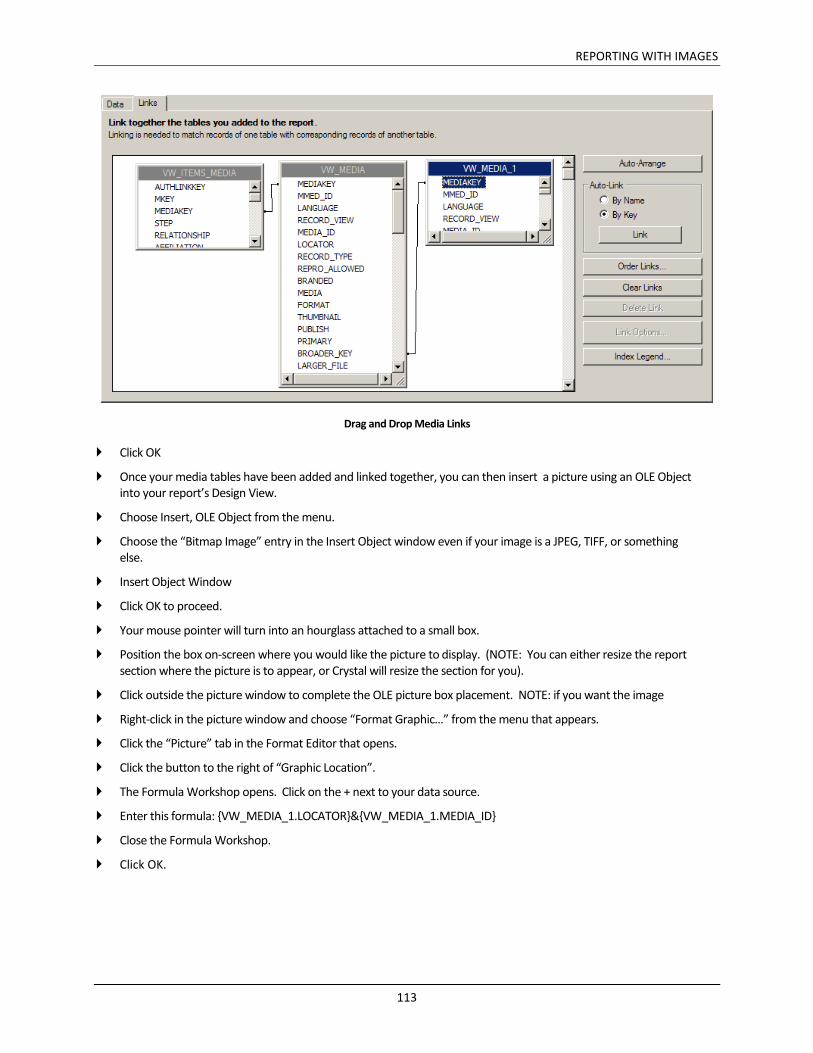
REPORTING WITH IMAGES
113
Drag and Drop Media Links
Click OK
Once your media tables have been added and linked together, you can then insert a picture using an OLE Object into your report’s Design View.
Choose Insert, OLE Object from the menu.
Choose the “Bitmap Image” entry in the Insert Object window even if your image is a JPEG, TIFF, or something else.
Insert Object Window
Click OK to proceed.
Your mouse pointer will turn into an hourglass attached to a small box.
Position the box on-screen where you would like the picture to display. (NOTE: You can either resize the report section where the picture is to appear, or Crystal will resize the section for you).
Click outside the picture window to complete the OLE picture box placement. NOTE: if you want the image
Right-click in the picture window and choose “Format Graphic…” from the menu that appears.
Click the “Picture” tab in the Format Editor that opens.
Click the button to the right of “Graphic Location”.
The Formula Workshop opens. Click on the + next to your data source.
Enter this formula: {VW_MEDIA_1.LOCATOR}&{VW_MEDIA_1.MEDIA_ID}
Close the Formula Workshop.
Click OK.
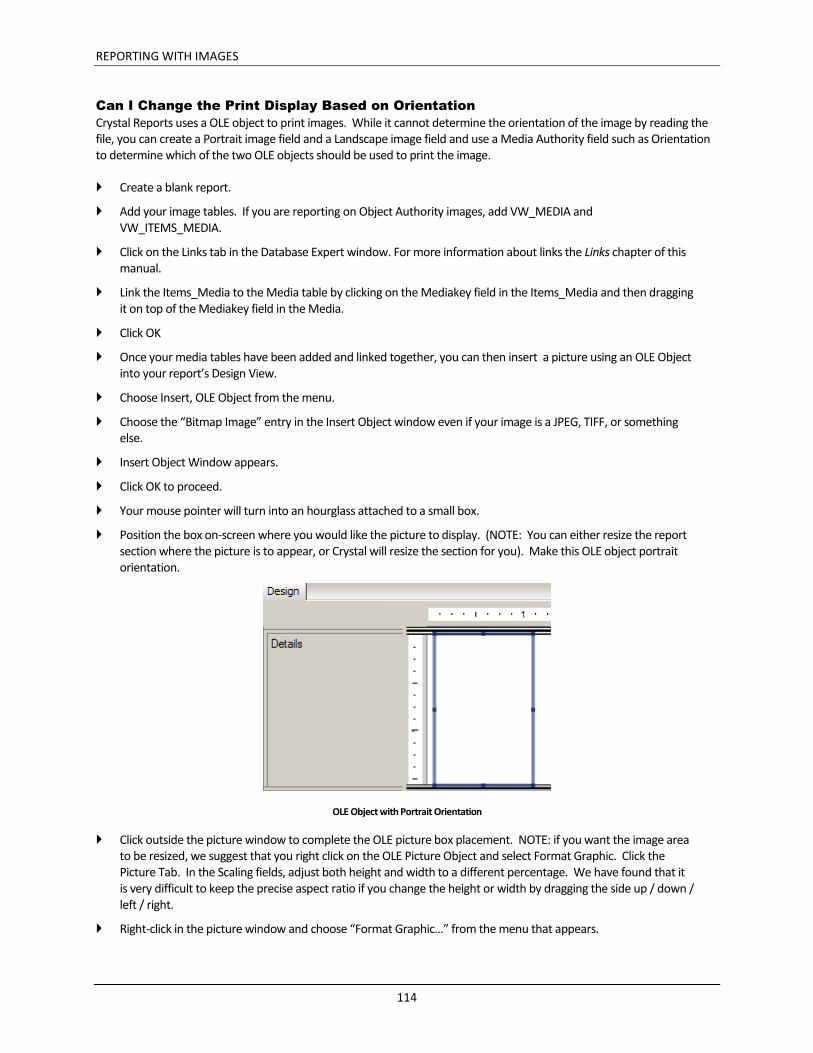
REPORTING WITH IMAGES
114
Can I Change the Print Display Based on Orientation
Crystal Reports uses a OLE object to print images. While it cannot determine the orientation of the image by reading the file, you can create a Portrait image field and a Landscape image field and use a Media Authority field such as Orientation to determine which of the two OLE objects should be used to print the image.
Create a blank report.
Add your image tables. If you are reporting on Object Authority images, add VW_MEDIA and VW_ITEMS_MEDIA.
Click on the Links tab in the Database Expert window. For more information about links the Links chapter of this manual.
Link the Items_Media to the Media table by clicking on the Mediakey field in the Items_Media and then dragging it on top of the Mediakey field in the Media.
Click OK
Once your media tables have been added and linked together, you can then insert a picture using an OLE Object into your report’s Design View.
Choose Insert, OLE Object from the menu.
Choose the “Bitmap Image” entry in the Insert Object window even if your image is a JPEG, TIFF, or something else.
Insert Object Window appears.
Click OK to proceed.
Your mouse pointer will turn into an hourglass attached to a small box.
Position the box on-screen where you would like the picture to display. (NOTE: You can either resize the report section where the picture is to appear, or Crystal will resize the section for you). Make this OLE object portrait orientation.
OLE Object with Portrait Orientation
Click outside the picture window to complete the OLE picture box placement. NOTE: if you want the image area to be resized, we suggest that you right click on the OLE Picture Object and select Format Graphic. Click the Picture Tab. In the Scaling fields, adjust both height and width to a different percentage. We have found that it is very difficult to keep the precise aspect ratio if you change the height or width by dragging the side up / down / left / right.
Right-click in the picture window and choose “Format Graphic…” from the menu that appears.

REPORTING WITH IMAGES
115
Click the “Picture” tab in the Format Editor that opens.
Click the button to the right of “Graphic Location”.
The Formula Workshop opens. Click on the + next to your data source.
Click on the + next to the Media table.
Double-click on the Locator field to make it carry down to the space below the field list in the Formula Workshop.
Click immediately after the field name that appears in the whitespace and type a “&”.
Double-click on the Media_ID field.
Close the Formula Workshop.
Click the Common Tab.
Click the Suppress Formula Button.
Suppress Formula
In the Formula, enter: {VW_MEDIA.ORIENTATION}="H"
Close the Formula Workshop.
Click OK to close the Format Editor and return to Design View.
Click on the OLE object you just created.
Click CTRL + C to copy it.
Paste the copy on the report.
Change the orientation of the copy to landscape.
REPORTING WITH IMAGES
116
Landscape Image
Right click on the copied OLE object and select Format Graphic from the Pop-Up menu.
Click the Common Tab.
In the Formula, enter: {VW_MEDIA.ORIENTATION}="H"
Click the Suppress Formula Button.
In the Formula, enter: {VW_MEDIA.ORIENTATION}="V"
Now you have 2 fields with 2 different formulas. If the image is flagged as Vertical, it will display in the “portrait” OLE object. If it is flagged as Horizontal, it will display in the “landscape” OLE object.
CREATE A CONNECTION TO MIMSY XG
117
Chapter 14 - Create A Connection to Mimsy XG
When Crystal Reports is first installed, it does not know how to connect to the data in Mimsy XG. Follow these steps on each PC loaded with Crystal Reports. You will only need to do this once!
Create a Connection to Mimsy XG data in Crystal Reports via Oracle Server
Create a Connection to Mimsy XG data in Crystal Reports via ODBC
Our preferred connection method is the Oracle Server connection since it does not require unique connections for the training and production databases.
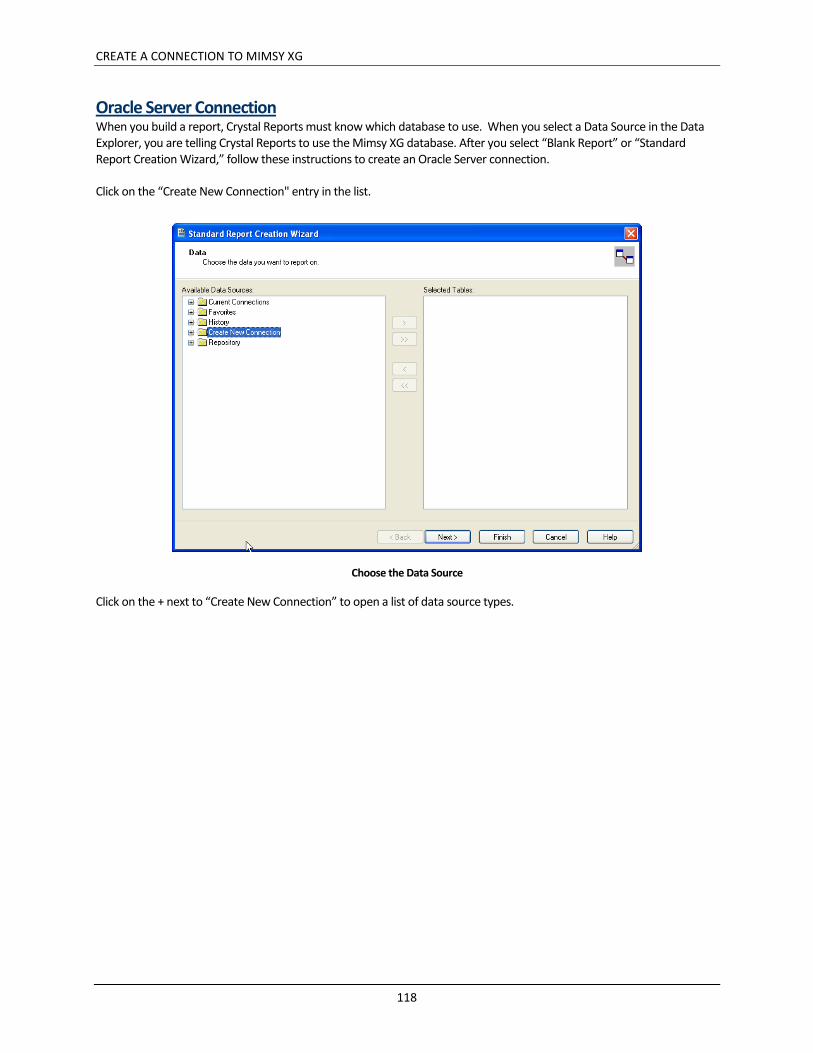
CREATE A CONNECTION TO MIMSY XG
118
Oracle Server Connection When you build a report, Crystal Reports must know which database to use. When you select a Data Source in the Data Explorer, you are telling Crystal Reports to use the Mimsy XG database. After you select “Blank Report” or “Standard Report Creation Wizard,” follow these instructions to create an Oracle Server connection.
Click on the “Create New Connection" entry in the list.
Choose the Data Source
Click on the + next to “Create New Connection” to open a list of data source types.
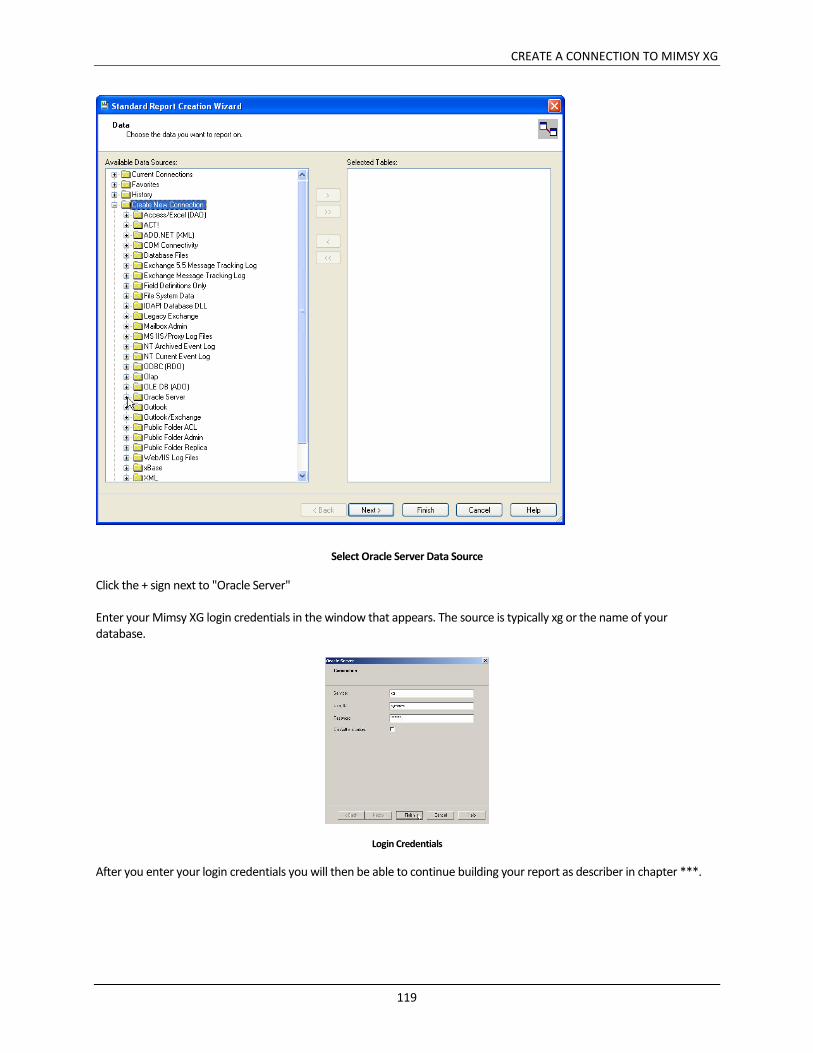
CREATE A CONNECTION TO MIMSY XG
119
Select Oracle Server Data Source
Click the + sign next to "Oracle Server"
Enter your Mimsy XG login credentials in the window that appears. The source is typically xg or the name of your database.
Login Credentials
After you enter your login credentials you will then be able to continue building your report as describer in chapter ***.
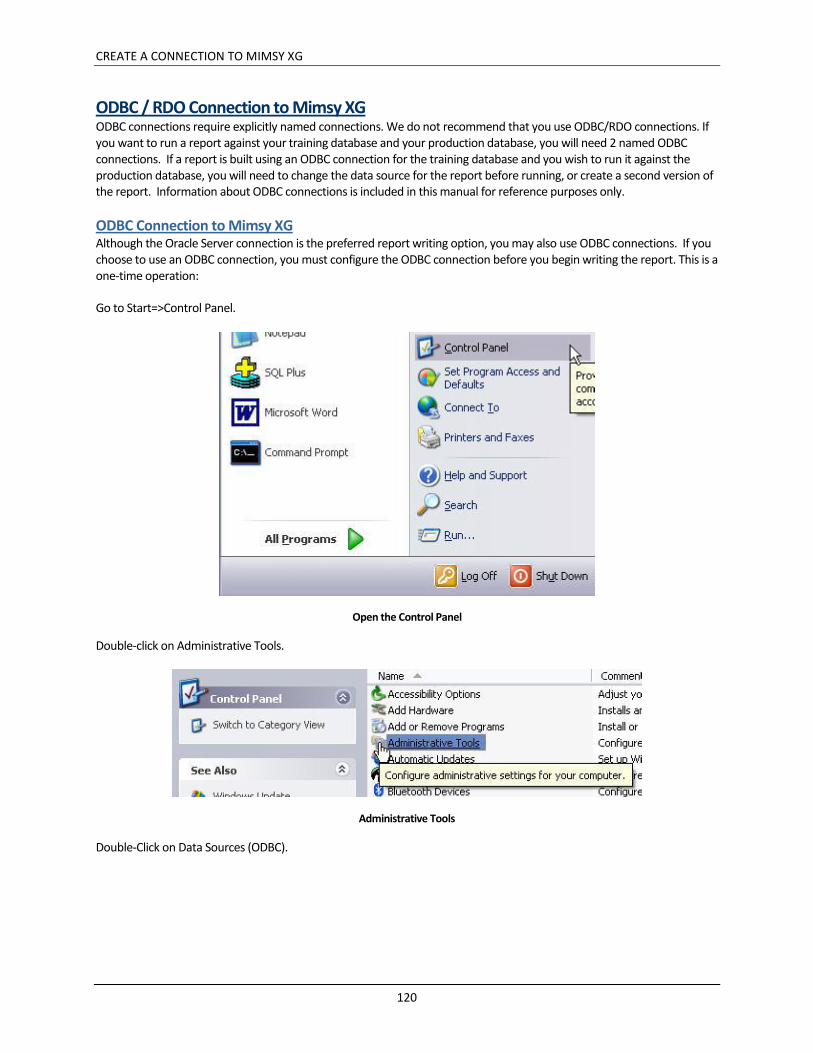
CREATE A CONNECTION TO MIMSY XG
120
ODBC / RDO Connection to Mimsy XG ODBC connections require explicitly named connections. We do not recommend that you use ODBC/RDO connections. If you want to run a report against your training database and your production database, you will need 2 named ODBC connections. If a report is built using an ODBC connection for the training database and you wish to run it against the production database, you will need to change the data source for the report before running, or create a second version of the report. Information about ODBC connections is included in this manual for reference purposes only.
ODBC Connection to Mimsy XG Although the Oracle Server connection is the preferred report writing option, you may also use ODBC connections. If you choose to use an ODBC connection, you must configure the ODBC connection before you begin writing the report. This is a one-time operation:
Go to Start=>Control Panel.
Open the Control Panel
Double-click on Administrative Tools.
Administrative Tools
Double-Click on Data Sources (ODBC).
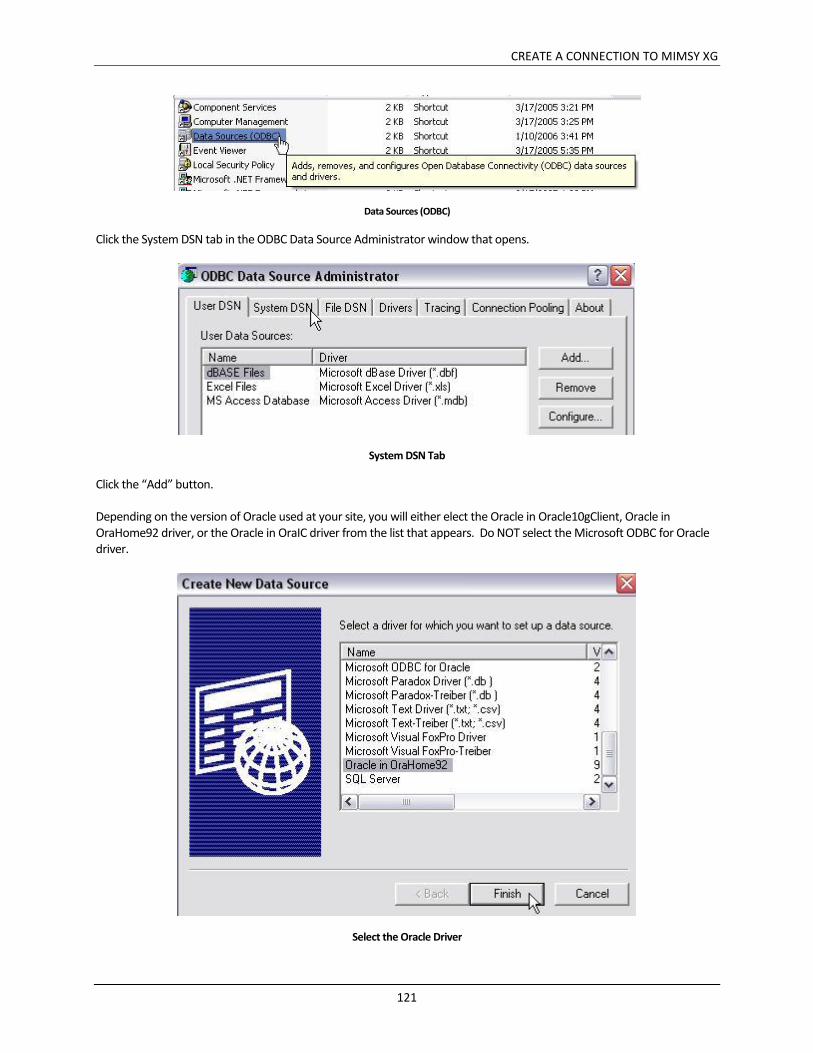
CREATE A CONNECTION TO MIMSY XG
121
Data Sources (ODBC)
Click the System DSN tab in the ODBC Data Source Administrator window that opens.
System DSN Tab
Click the “Add” button.
Depending on the version of Oracle used at your site, you will either elect the Oracle in Oracle10gClient, Oracle in OraHome92 driver, or the Oracle in OraIC driver from the list that appears. Do NOT select the Microsoft ODBC for Oracle driver.
Select the Oracle Driver

CREATE A CONNECTION TO MIMSY XG
122
Enter your data connection information.
Configuring the Data Connection
Press the “Test Connection” button to verify the data source information. Enter your passwork.
Test the Connection
If correct, you should get the following message:
Connection Succeeded!
Click OK and exit the Control Panel. You can now configure Crystal Reports to use this data connection for reporting.
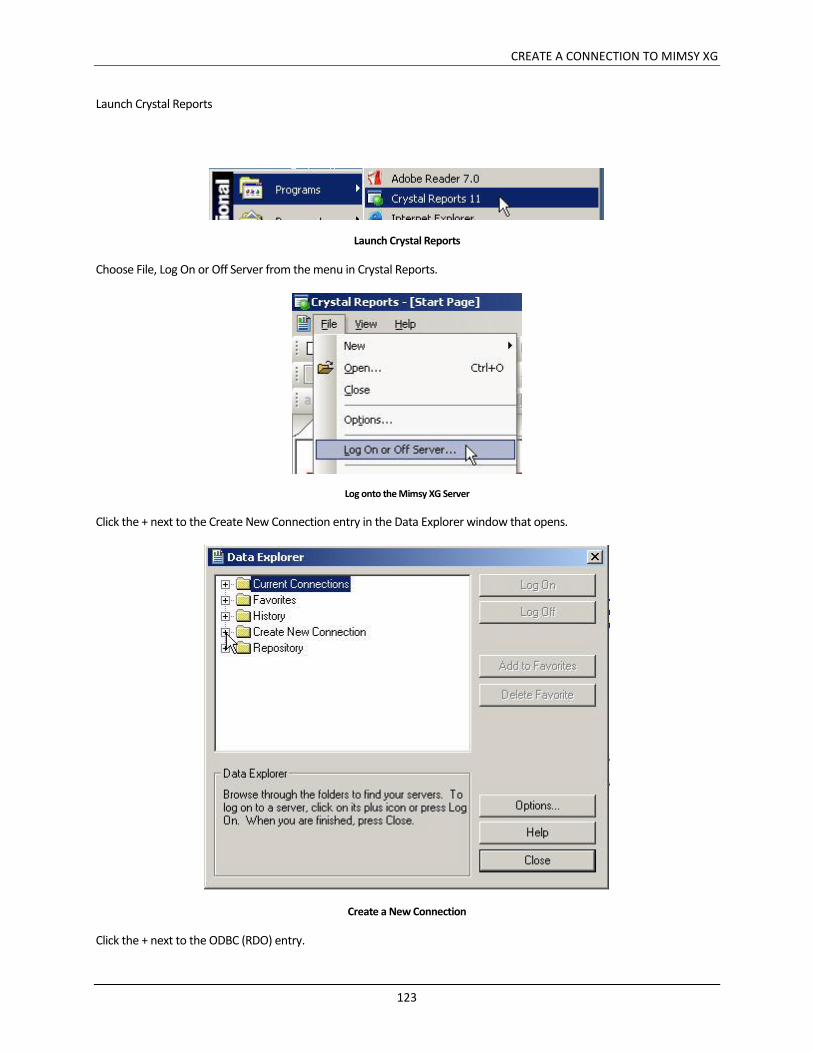
CREATE A CONNECTION TO MIMSY XG
123
Launch Crystal Reports
Launch Crystal Reports
Choose File, Log On or Off Server from the menu in Crystal Reports.
Log onto the Mimsy XG Server
Click the + next to the Create New Connection entry in the Data Explorer window that opens.
Create a New Connection
Click the + next to the ODBC (RDO) entry.
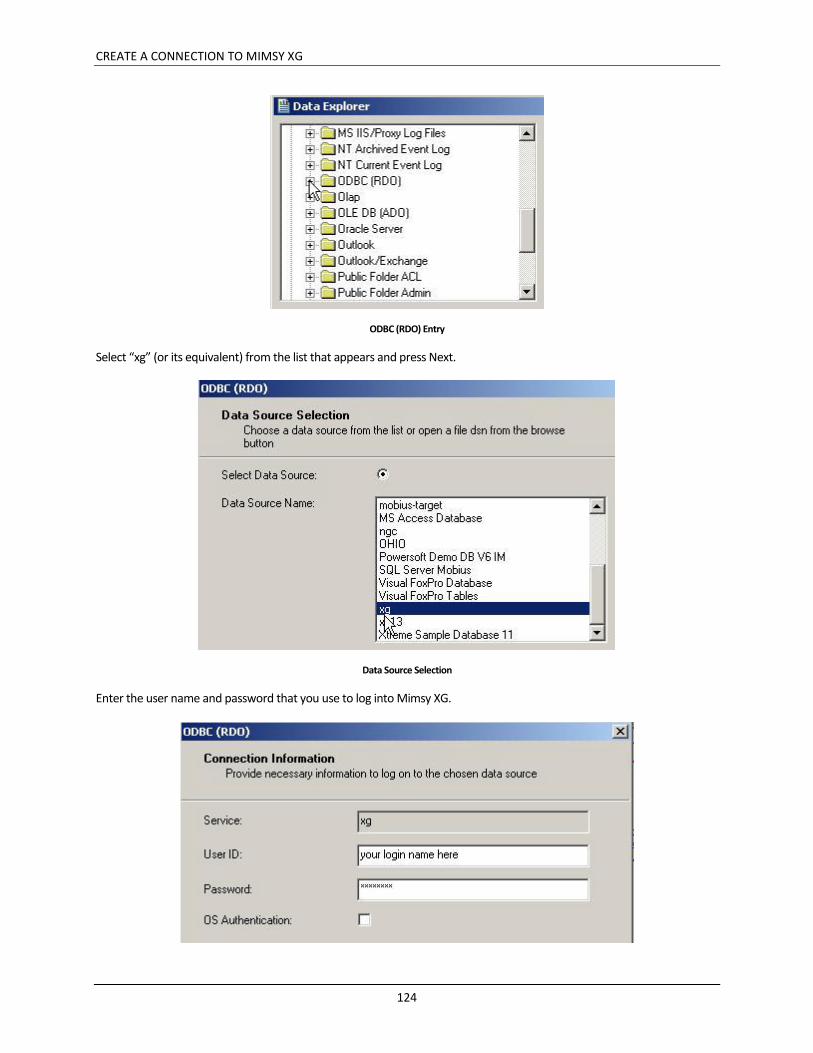
CREATE A CONNECTION TO MIMSY XG
124
ODBC (RDO) Entry
Select “xg” (or its equivalent) from the list that appears and press Next.
Data Source Selection
Enter the user name and password that you use to log into Mimsy XG.
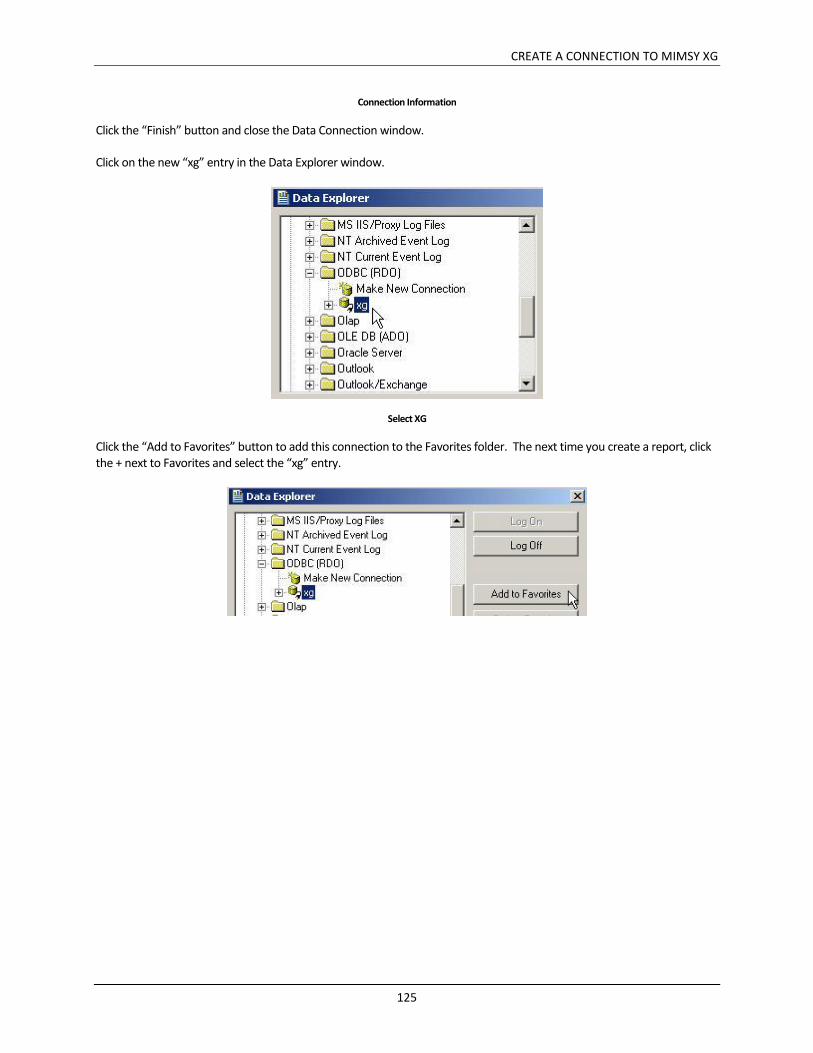
CREATE A CONNECTION TO MIMSY XG
125
Connection Information
Click the “Finish” button and close the Data Connection window.
Click on the new “xg” entry in the Data Explorer window.
Select XG
Click the “Add to Favorites” button to add this connection to the Favorites folder. The next time you create a report, click the + next to Favorites and select the “xg” entry.

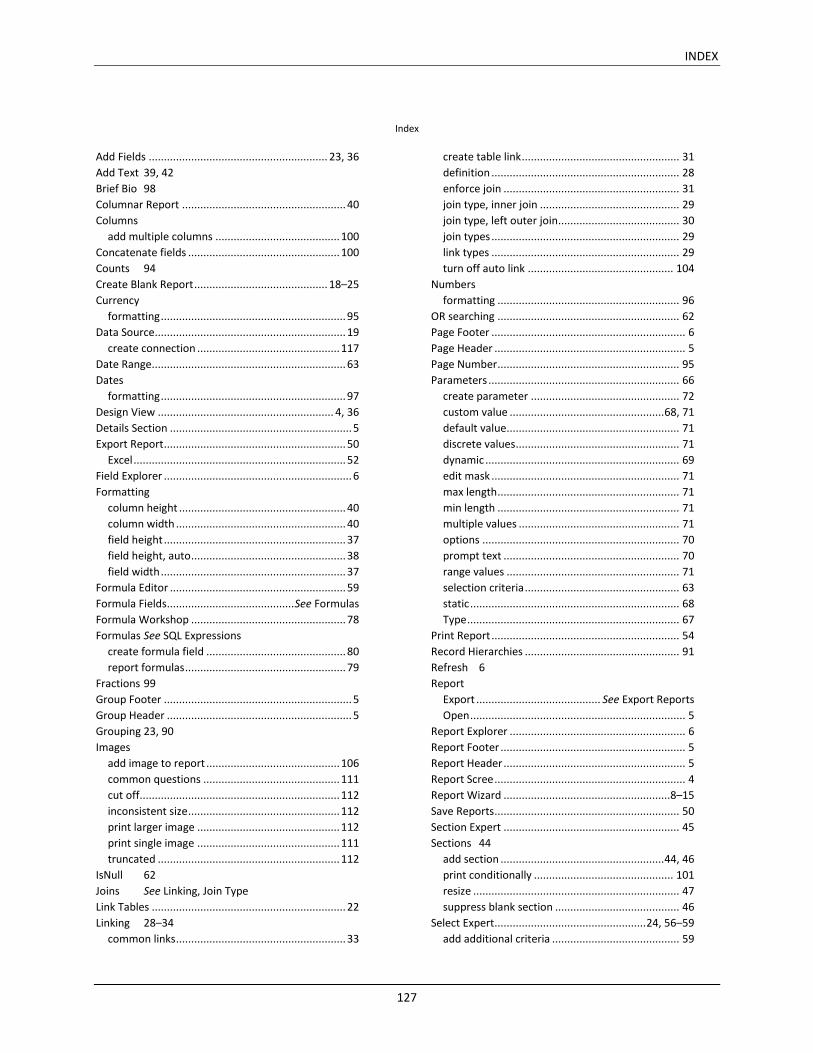
INDEX
127
Index
Add Fields ........................................................... 23, 36
Add Text 39, 42
Brief Bio 98
Columnar Report ...................................................... 40
Columns
add multiple columns ......................................... 100
Concatenate fields .................................................. 100
Counts 94
Create Blank Report ............................................ 18–25
Currency
formatting ............................................................. 95
Data Source............................................................... 19
create connection ............................................... 117
Date Range................................................................ 63
Dates
formatting ............................................................. 97
Design View .......................................................... 4, 36
Details Section ............................................................ 5
Export Report ............................................................ 50
Excel ...................................................................... 52
Field Explorer .............................................................. 6
Formatting
column height ....................................................... 40
column width ........................................................ 40
field height ............................................................ 37
field height, auto ................................................... 38
field width ............................................................. 37
Formula Editor .......................................................... 59
Formula Fields.......................................... See Formulas
Formula Workshop ................................................... 78
Formulas See SQL Expressions
create formula field .............................................. 80
report formulas ..................................................... 79
Fractions 99
Group Footer .............................................................. 5
Group Header ............................................................. 5
Grouping 23, 90
Images
add image to report ............................................ 106
common questions ............................................. 111
cut off.................................................................. 112
inconsistent size .................................................. 112
print larger image ............................................... 112
print single image ............................................... 111
truncated ............................................................ 112
IsNull 62
Joins See Linking, Join Type
Link Tables ................................................................ 22
Linking 28–34
common links ........................................................ 33
create table link .................................................... 31
definition .............................................................. 28
enforce join .......................................................... 31
join type, inner join .............................................. 29
join type, left outer join........................................ 30
join types .............................................................. 29
link types .............................................................. 29
turn off auto link ................................................ 104
Numbers
formatting ............................................................ 96
OR searching ............................................................ 62
Page Footer ................................................................ 6
Page Header ............................................................... 5
Page Number ............................................................ 95
Parameters ............................................................... 66
create parameter ................................................. 72
custom value ................................................... 68, 71
default value......................................................... 71
discrete values ...................................................... 71
dynamic ................................................................ 69
edit mask .............................................................. 71
max length ............................................................ 71
min length ............................................................ 71
multiple values ..................................................... 71
options ................................................................. 70
prompt text .......................................................... 70
range values ......................................................... 71
selection criteria ................................................... 63
static ..................................................................... 68
Type ...................................................................... 67
Print Report .............................................................. 54
Record Hierarchies ................................................... 91
Refresh 6
Report
Export ......................................... See Export Reports
Open ....................................................................... 5
Report Explorer .......................................................... 6
Report Footer ............................................................. 5
Report Header ............................................................ 5
Report Scree ............................................................... 4
Report Wizard .......................................................8–15
Save Reports ............................................................. 50
Section Expert .......................................................... 45
Sections 44
add section ...................................................... 44, 46
print conditionally .............................................. 101
resize .................................................................... 47
suppress blank section ......................................... 46
Select Expert.................................................. 24, 56–59
add additional criteria .......................................... 59
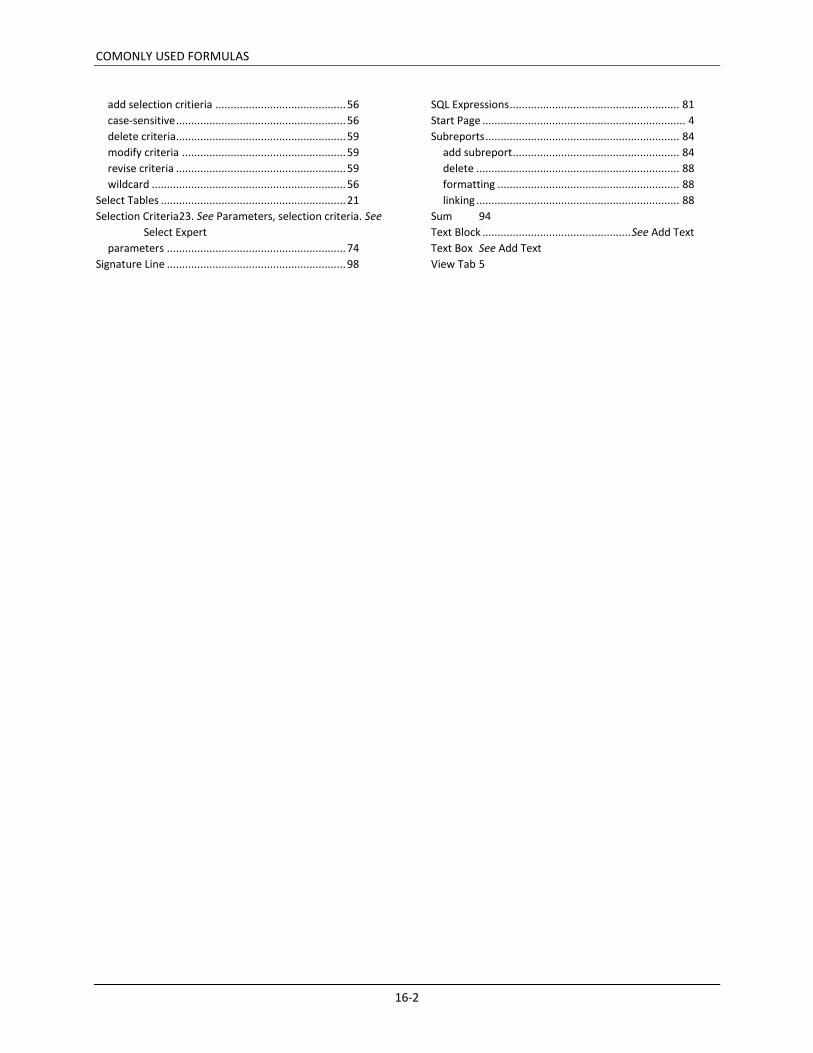
COMONLY USED FORMULAS
16-2
add selection critieria ........................................... 56
case-sensitive ........................................................ 56
delete criteria........................................................ 59
modify criteria ...................................................... 59
revise criteria ........................................................ 59
wildcard ................................................................ 56
Select Tables ............................................................. 21
Selection Criteria23. See Parameters, selection criteria. See
Select Expert
parameters ........................................................... 74
Signature Line ........................................................... 98
SQL Expressions ........................................................ 81
Start Page ................................................................... 4
Subreports ................................................................ 84
add subreport ....................................................... 84
delete ................................................................... 88
formatting ............................................................ 88
linking ................................................................... 88
Sum 94
Text Block ................................................. See Add Text
Text Box See Add Text
View Tab 5