Embed Size (px)
Citation preview
— A B B M E A SU R EM ENT & A N A LY TI C S | W H ITE PA PER
Crude distillation unit (CDU) optimization The use of multi-channel on-line FT-NIR analyzer technology for the optimization of an atmospheric distillation unit
CDU advanced process control is often implemented using a traditional chemical engineering approach through multiple control loops, heat / mass balances and pressure / temperature / flow measurements. This white paper demonstrates the use and advantages of FT-NIR as a multi-stream, multi-property analytical method for CDU optimization.Measurement made easy
Where side-draw quality estimates are needed it is common to use inferential models, based on empirical correlations between the process parameters and the reconciled True Boiling Point (TBP) curve of the nominal crude feed assay. Process FTIR using a fiber-optic based configuration with separate heated sample flow-cell cabinets for each process stream allows for rapid multi-property, multi-stream, accurate, real-time product quality data to be fed at an appropriate data-rate to the CDU on-line optimizer. This can enable more effective optimization of the Unit, control of side-draw stream cut-points and qualities and crucially avoid yield losses from high-value product into lower-value streams due to poor heat-balance and pump-around control.
Dr. Michael B. SimpsonIndustry Manager, Refining and PetrochemicalsABB Measurement and Analytics
—Refinery
2 CD U O P TI M I Z ATI O N | W hite P ap e r
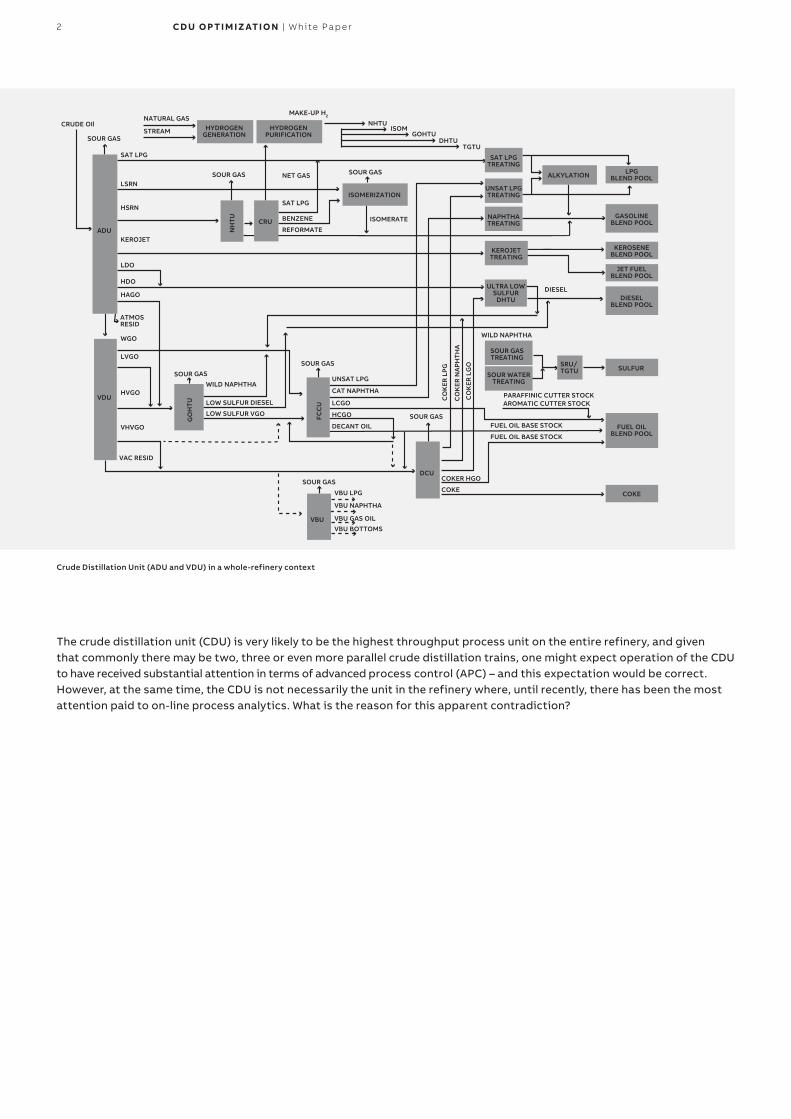
The crude distillation unit (CDU) is very likely to be the highest throughput process unit on the entire refinery, and given that commonly there may be two, three or even more parallel crude distillation trains, one might expect operation of the CDU to have received substantial attention in terms of advanced process control (APC) – and this expectation would be correct. However, at the same time, the CDU is not necessarily the unit in the refinery where, until recently, there has been the most attention paid to on-line process analytics. What is the reason for this apparent contradiction?
CRUDE OIlNATURAL GAS
HYDROGENGENERATION
HYDROGENPURIFICATION
MAKE-UP H2
NHTUISOM
GOHTUDHTU
TGTU
ALKYLATION
SAT LPGTREATING
UNSAT LPGTREATING
NAPHTHATREATING
KEROJETTREATING
ULTRA LOWSULFUR
DHTU
SOUR GASTREATING
SOUR WATERTREATING
DIESEL
WILD NAPHTHA
SRU/TGTU
PARAFFINIC CUTTER STOCKAROMATIC CUTTER STOCK
COKECOKE
FUEL OILBLEND POOL
SULFUR
DIESELBLEND POOL
JET FUELBLEND POOL
GASOLINEBLEND POOL
CO
KER
LPG
CO
KER
LG
O
CO
KER
NA
PHTH
A
LPGBLEND POOL
KEROSENEBLEND POOL
COKER HGODCU
FUEL OIL BASE STOCK
FUEL OIL BASE STOCK
STREAMSOUR GAS
SOUR GAS SOUR GAS
ISOMERATE
ISOMERIZATIONSAT LPG
BENZENE
REFORMATECRU
NH
TU
NET GAS
SOUR GASWILD NAPHTHA
LOW SULFUR DIESEL
LOW SULFUR VGO
GO
HTU
SAT LPG
LSRN
HSRN
KEROJET
HDO
HAGO
ATMOSRESID
WGO
LVGO
HVGO
VHVGO
VAC RESID
VDU
ADU
LDO
SOUR GAS
SOUR GAS
SOUR GAS
VBU
VBU LPG
VBU NAPHTHA
VBU GAS OILVBU BOTTOMS
UNSAT LPG
CAT NAPHTHA
LCGO
HCGO
DECANT OIL
FCC
U
Crude Distillation Unit (ADU and VDU) in a whole-refinery context
3CD U O P TI M I Z ATI O N | W hite P ap e r
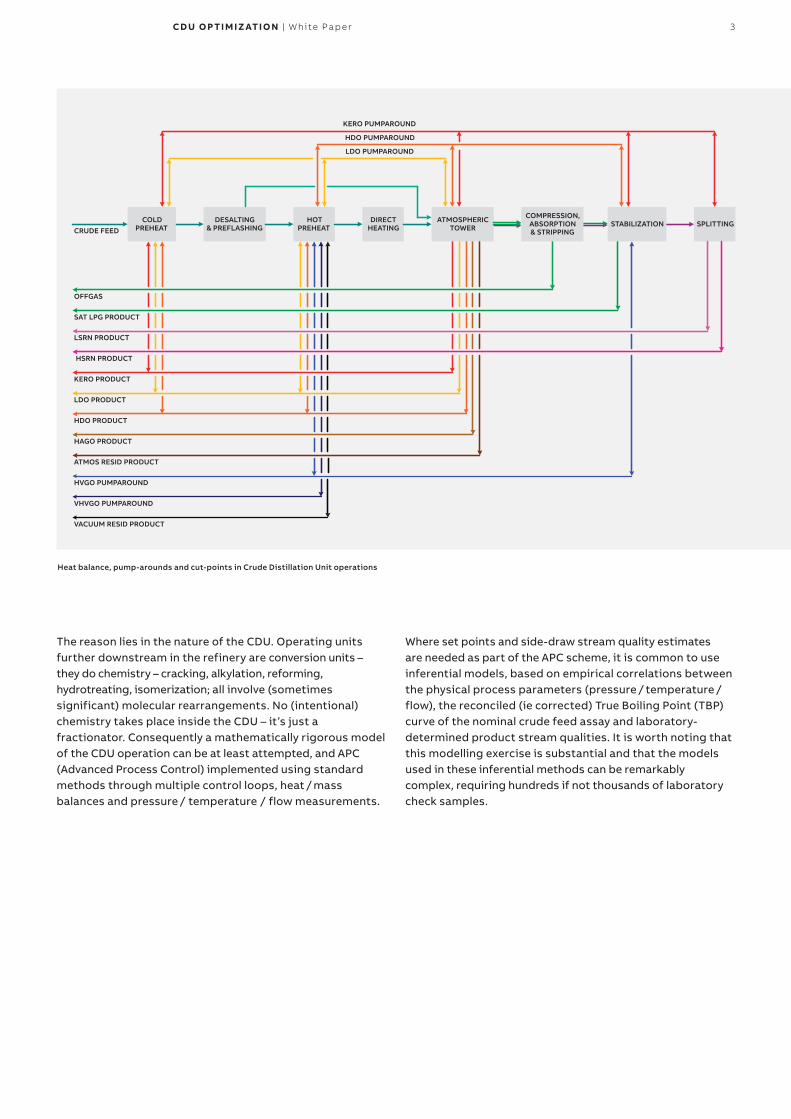
The reason lies in the nature of the CDU. Operating units further downstream in the refinery are conversion units – they do chemistry – cracking, alkylation, reforming, hydrotreating, isomerization; all involve (sometimes significant) molecular rearrangements. No (intentional) chemistry takes place inside the CDU – it’s just a fractionator. Consequently a mathematically rigorous model of the CDU operation can be at least attempted, and APC (Advanced Process Control) implemented using standard methods through multiple control loops, heat / mass balances and pressure / temperature / flow measurements.
COLDPREHEAT
DESALTING& PREFLASHING
HOTPREHEAT
DIRECTHEATING SPLITTING
HAGO PRODUCT
HDO PRODUCT
LDO PRODUCT
KERO PRODUCT
HSRN PRODUCT
LSRN PRODUCT
SAT LPG PRODUCT
OFFGAS
ATMOS RESID PRODUCT
HVGO PUMPAROUND
VHVGO PUMPAROUND
VACUUM RESID PRODUCT
STABILIZATION
KERO PUMPAROUND
HDO PUMPAROUND
LDO PUMPAROUND
CRUDE FEEDATMOSPHERIC
TOWER
COMPRESSION,ABSORPTION& STRIPPING
Heat balance, pump-arounds and cut-points in Crude Distillation Unit operations
Where set points and side-draw stream quality estimates are needed as part of the APC scheme, it is common to use inferential models, based on empirical correlations between the physical process parameters (pressure / temperature / flow), the reconciled (ie corrected) True Boiling Point (TBP) curve of the nominal crude feed assay and laboratory-determined product stream qualities. It is worth noting that this modelling exercise is substantial and that the models used in these inferential methods can be remarkably complex, requiring hundreds if not thousands of laboratory check samples.

4 CD U O P TI M I Z ATI O N | W hite P ap e r
The challenges for CDU operation – throughput and qualityThe starting point for optimized CDU operation is a correct understanding of the nature of the crude feed. Given the extremely high and variable value, in terms of dollar price, of crude it is more and more important to know this, in order to make economically optimized buying and blending choices.
Conventionally crude feeds are characterized by a generic assay (ie typical of the field, not specific to any shipment) with a TBP (True Boiling Point) curve. This is the key input to the standard APC model – without it the side-draw quality estimations, and therefore the accuracy with which correct cut-points can be set, are worthless. This input is frequently neither known nor estimated with sufficient certainty. It would normally have to be obtained, if an update was needed, by a costly and lengthy laboratory test procedure involving a complex physical distillation apparatus. In fact laboratory-based FT-NIR methods have a lot to offer here, and crude assay databases exist which allow for rapid lab assay using that method.
Typically the most important control parameters for the APC scheme will be the side-draw end boiling points, and the middle distillate cold properties (e.g. flash point, cloud point). True on-line direct measurement of the required large number of properties using discrete, slow physical property analyzers is prohibitive in terms of capital cost, installation cost and maintenance cost. Moreover these conventional analyzers give data over extended 20 – 80 minute cycle times, in strong contrast to the input to APC from inferential models delivering estimations every few minutes.
Real-time analysis of crude feed and side-streams using process FT-NIR spectroscopyProcess FT-NIR using typically a fiber-optic based configuration with separate heated sample flow-cells for each required process stream (side-draws and crude feed), complete with suitable sample conditioning for water removal, allows for rapid multi-property, multi-stream accurate real-time product quality data to be fed at an appropriate data rate to the CDU on-line optimizer.
ABB FTPA2000-HP260X multi-channel FT-NIR on-line analyzer for multi-stream CDU optimization
Fiber-optic flow cells to remote FT-NIR analyzer
SiO2/TE InGasAs@ 75 °C for heavier streams
ZrF4 / TE InAs @ 35 °C
Crude Feed
C5C6 fraction
Light Naphtha
Heavy Naphtha
Kerosene
Atmospheric GO
Heavy GO
Cru
de
dis
tilla
tio
n co
lum
n
5CD U O P TI M I Z ATI O N | W hite P ap e r
Given the dynamic and rapidly changing patterns of crude purchasing and blending, driven by harsh market economics, coupled with the uncertainties of TBP reconciliation and the difficulty for inferential model estimators of accurately predicting side-draw end-points, real-time on-line analysis with Process FT-NIR is becoming both increasingly attractive and increasingly implemented.
ExperimentalThis paper describes the installation and operation of an on-line process FT-NIR analyzer system in a European refinery with a crude and vacuum distillation capacity of approximately 160,000 barrels per calendar day (bpcd), approximately 6,1 million tonnes per annum (Mtpa). The refinery in question has a Nelson Complexity Index of 11.5 and extensive thermal and hydrocracking capability, but limited deep residue upgrading capacity. Correct and optimal CDU operation is therefore critical for successful middle distillate production.
The project was planned to provide real-time feed and product stream qualities for both the crude feed to the CDU and for six rundown side-streams, namely straight-run gasoline (C5-C6), light naphtha (LN), heavy naphtha (HN), kerosene (KERO), atmospheric gasoil (AGO) and heavy gasoil (HGO). Many different arrangements of on-line process FT-NIR analyzers are available, including extractive single-cell, extractive multi-cell using fiber-optics, and in-line using fiber-optics and probes. The different aspects of the CDU application for FT-NIR analyzers tend to converge on the extractive multi-cell approach. These are firstly the widely different temperatures, densities and viscosities of the sample streams, which make it impractical to physically stream-switch between streams in one or a few cells, and secondly the spectroscopic demands of the application. In general the FT-NIR spectra of heavier samples change less rapidly with varying sample qualities, thus an application on gasoline or naphtha is in general inherently simpler, from a modelling point of view, compared with a heavy gasoil or crude feed application. The potential for additional distortion in the spectra, and lack of sample control inherent for in-line sampling with fiber-optic probes makes the multi-cell extractive sampling approach the most reliable.
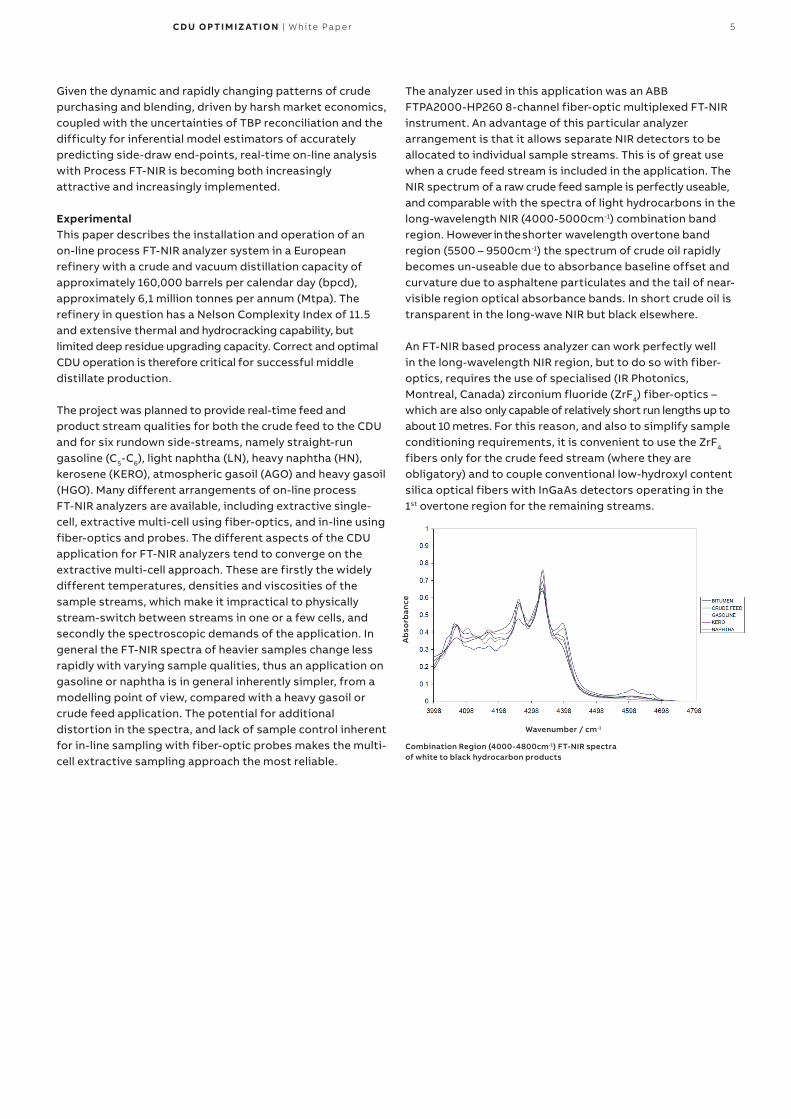
The analyzer used in this application was an ABB FTPA2000-HP260 8-channel fiber-optic multiplexed FT-NIR instrument. An advantage of this particular analyzer arrangement is that it allows separate NIR detectors to be allocated to individual sample streams. This is of great use when a crude feed stream is included in the application. The NIR spectrum of a raw crude feed sample is perfectly useable, and comparable with the spectra of light hydrocarbons in the long-wavelength NIR (4000-5000cm-1) combination band region. However in the shorter wavelength overtone band region (5500 – 9500cm-1) the spectrum of crude oil rapidly becomes un-useable due to absorbance baseline offset and curvature due to asphaltene particulates and the tail of near-visible region optical absorbance bands. In short crude oil is transparent in the long-wave NIR but black elsewhere.
An FT-NIR based process analyzer can work perfectly well in the long-wavelength NIR region, but to do so with fiber-optics, requires the use of specialised (IR Photonics, Montreal, Canada) zirconium fluoride (ZrF4) fiber-optics – which are also only capable of relatively short run lengths up to about 10 metres. For this reason, and also to simplify sample conditioning requirements, it is convenient to use the ZrF4 fibers only for the crude feed stream (where they are obligatory) and to couple conventional low-hydroxyl content silica optical fibers with InGaAs detectors operating in the 1st overtone region for the remaining streams.
Combination Region (4000-4800cm-1) FT-NIR spectra of white to black hydrocarbon products
Ab
sorb
ance
Wavenumber / cm-1
6 CD U O P TI M I Z ATI O N | W hite P ap e r
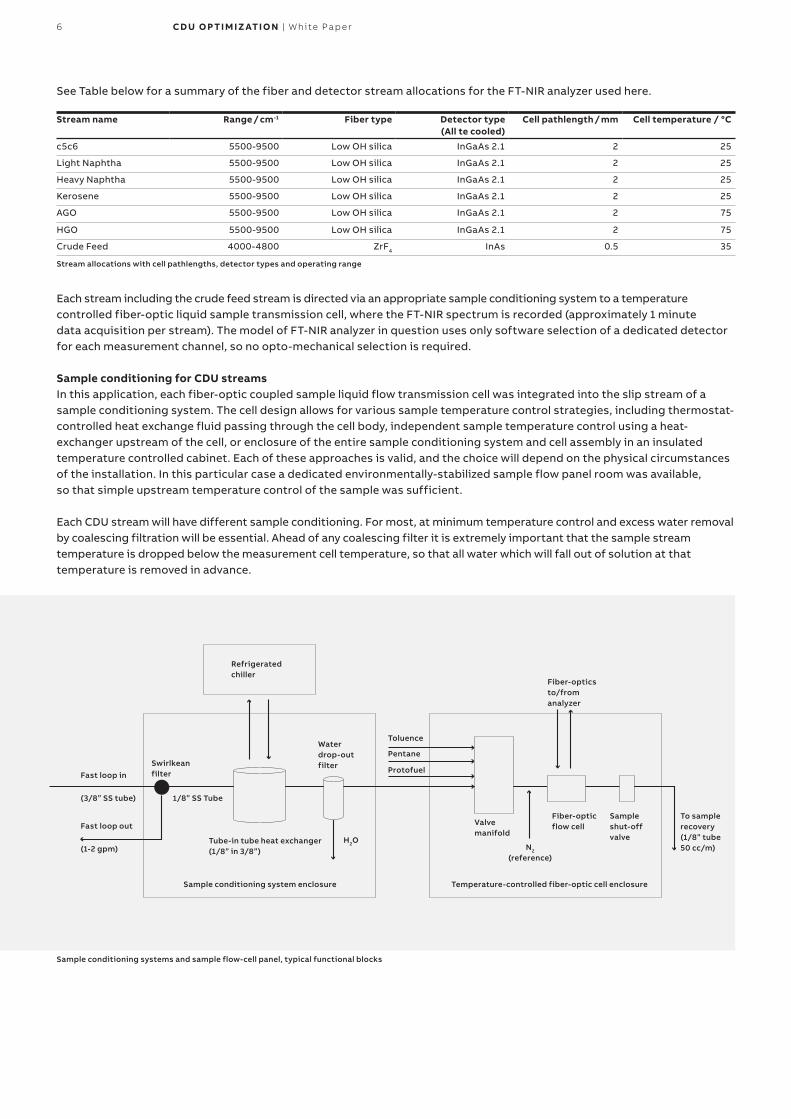
See Table below for a summary of the fiber and detector stream allocations for the FT-NIR analyzer used here.
Stream name Range / cm-1 Fiber type Detector type(All te cooled)
Cell pathlength / mm Cell temperature / °C
c5c6 5500-9500 Low OH silica InGaAs 2.1 2 25
Light Naphtha 5500-9500 Low OH silica InGaAs 2.1 2 25
Heavy Naphtha 5500-9500 Low OH silica InGaAs 2.1 2 25
Kerosene 5500-9500 Low OH silica InGaAs 2.1 2 25
AGO 5500-9500 Low OH silica InGaAs 2.1 2 75
HGO 5500-9500 Low OH silica InGaAs 2.1 2 75
Crude Feed 4000-4800 ZrF4 InAs 0.5 35
Stream allocations with cell pathlengths, detector types and operating range
Each stream including the crude feed stream is directed via an appropriate sample conditioning system to a temperature controlled fiber-optic liquid sample transmission cell, where the FT-NIR spectrum is recorded (approximately 1 minute data acquisition per stream). The model of FT-NIR analyzer in question uses only software selection of a dedicated detector for each measurement channel, so no opto-mechanical selection is required.
Sample conditioning for CDU streamsIn this application, each fiber-optic coupled sample liquid flow transmission cell was integrated into the slip stream of a sample conditioning system. The cell design allows for various sample temperature control strategies, including thermostat-controlled heat exchange fluid passing through the cell body, independent sample temperature control using a heat-exchanger upstream of the cell, or enclosure of the entire sample conditioning system and cell assembly in an insulated temperature controlled cabinet. Each of these approaches is valid, and the choice will depend on the physical circumstances of the installation. In this particular case a dedicated environmentally-stabilized sample flow panel room was available, so that simple upstream temperature control of the sample was sufficient.
Each CDU stream will have different sample conditioning. For most, at minimum temperature control and excess water removal by coalescing filtration will be essential. Ahead of any coalescing filter it is extremely important that the sample stream temperature is dropped below the measurement cell temperature, so that all water which will fall out of solution at that temperature is removed in advance.
Sample conditioning systems and sample flow-cell panel, typical functional blocks
Sample conditioning system enclosure Temperature-controlled fiber-optic cell enclosure
Tube-in tube heat exchanger(1/8” in 3/8”)
1/8” SS Tube
Swirlkean filter
Refrigeratedchiller
Fast loop in
Fast loop out
(3/8” SS tube)
(1-2 gpm)
Water drop-outfilter
Fiber-opticsto/fromanalyzer
Sampleshut-offvalve
Fiber-optic flow cell
N2
(reference)
Valve manifold
Toluence
Pentane
Protofuel
To sample recovery(1/8” tube 50 cc/m)
H2O
7CD U O P TI M I Z ATI O N | W hite P ap e r
All flow cells and flow cell circuits were provided with flow metering and low-flow alarms as well as RTD temperature probes inserted in the cell body and linked via internal ModBUS to the FT-NIR analyzer to provide positive assurance of system status. The sample phase integrity during measurement is assured by a sample-shutoff stop valve (SSOV) which operates on every measurement cycle to block the sample in the flow cell under the operating pressure of the sample system (pressure regulators, check valves and other system details are not shown in the Figure). The SSOV is operated by an air-actuator whose solenoid is under control of the analyzer via an internal ABB PLC module.
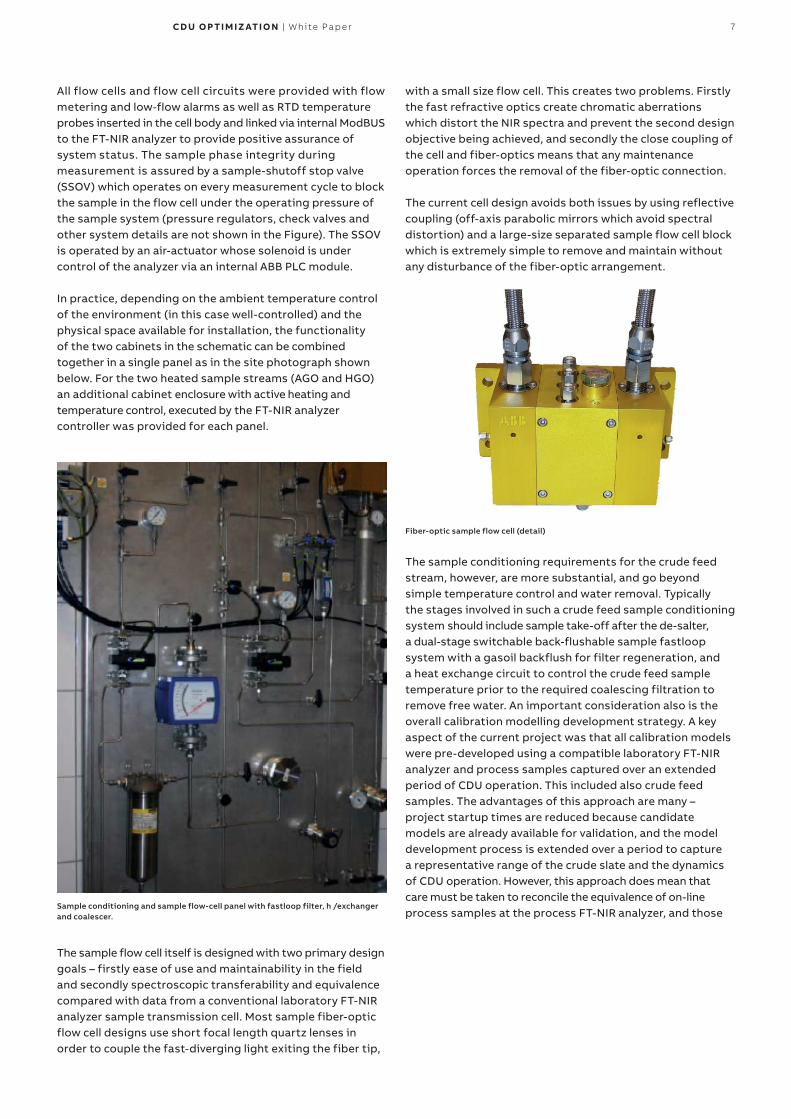
In practice, depending on the ambient temperature control of the environment (in this case well-controlled) and the physical space available for installation, the functionality of the two cabinets in the schematic can be combined together in a single panel as in the site photograph shown below. For the two heated sample streams (AGO and HGO) an additional cabinet enclosure with active heating and temperature control, executed by the FT-NIR analyzer controller was provided for each panel.
Sample conditioning and sample flow-cell panel with fastloop filter, h /exchanger and coalescer.
The sample flow cell itself is designed with two primary design goals – firstly ease of use and maintainability in the field and secondly spectroscopic transferability and equivalence compared with data from a conventional laboratory FT-NIR analyzer sample transmission cell. Most sample fiber-optic flow cell designs use short focal length quartz lenses in order to couple the fast-diverging light exiting the fiber tip,
with a small size flow cell. This creates two problems. Firstly the fast refractive optics create chromatic aberrations which distort the NIR spectra and prevent the second design objective being achieved, and secondly the close coupling of the cell and fiber-optics means that any maintenance operation forces the removal of the fiber-optic connection.
The current cell design avoids both issues by using reflective coupling (off-axis parabolic mirrors which avoid spectral distortion) and a large-size separated sample flow cell block which is extremely simple to remove and maintain without any disturbance of the fiber-optic arrangement.
Fiber-optic sample flow cell (detail)
The sample conditioning requirements for the crude feed stream, however, are more substantial, and go beyond simple temperature control and water removal. Typically the stages involved in such a crude feed sample conditioning system should include sample take-off after the de-salter, a dual-stage switchable back-flushable sample fastloop system with a gasoil backflush for filter regeneration, and a heat exchange circuit to control the crude feed sample temperature prior to the required coalescing filtration to remove free water. An important consideration also is the overall calibration modelling development strategy. A key aspect of the current project was that all calibration models were pre-developed using a compatible laboratory FT-NIR analyzer and process samples captured over an extended period of CDU operation. This included also crude feed samples. The advantages of this approach are many – project startup times are reduced because candidate models are already available for validation, and the model development process is extended over a period to capture a representative range of the crude slate and the dynamics of CDU operation. However, this approach does mean that care must be taken to reconcile the equivalence of on-line process samples at the process FT-NIR analyzer, and those

8 CD U O P TI M I Z ATI O N | W hite P ap e r
captured and presented to the equivalent laboratory FT-NIR analyzer.Results and discussionThe complete set of 467 calibrations samples for the six CDU rundown streams is shown below, where each Class (equivalent to stream type) is colour-coded.
Composite data set for all CDU rundown stream samples – recorded at 8 cm-1 resolution and 2 mm pathlength
Factor analysis (PCA) plot showing the separation of the different rundown streams in the modelling space
Wavenumbers
Ab
sorb
ance
5350 cm-1
0.8
0
6200 cm-1
c5c6
HGO
AGO
Kero
HN
LN
9CD U O P TI M I Z ATI O N | W hite P ap e r
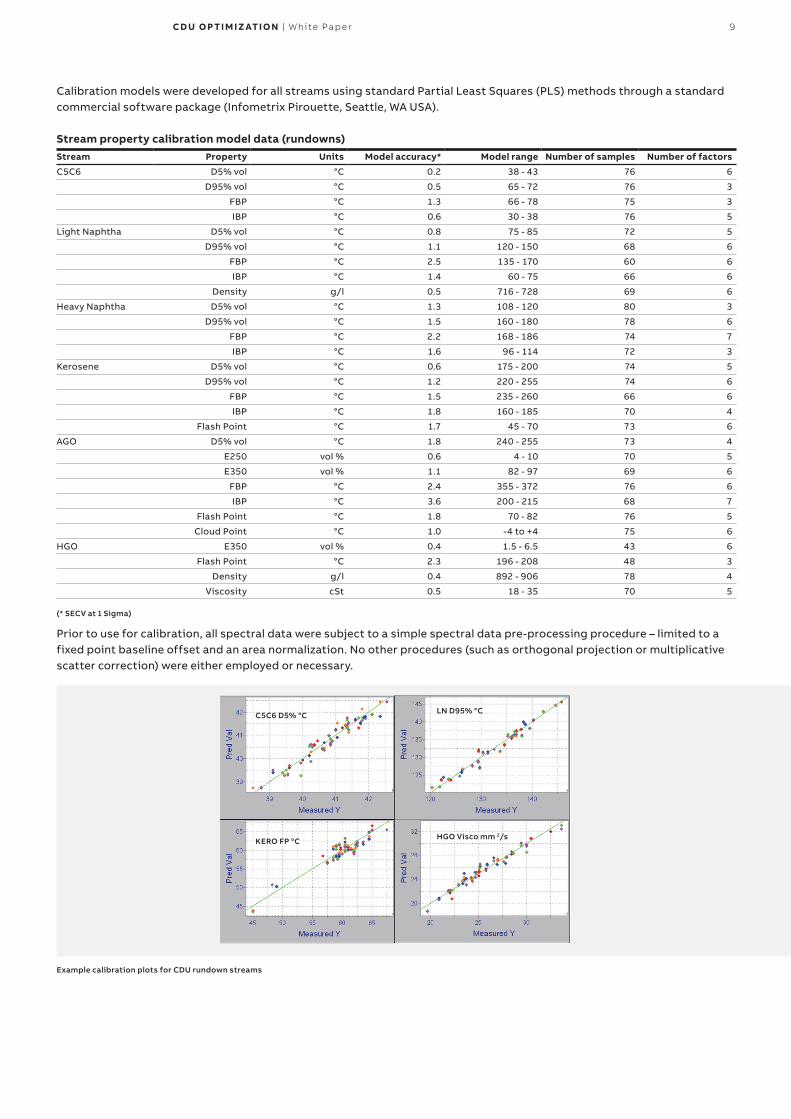
Calibration models were developed for all streams using standard Partial Least Squares (PLS) methods through a standard commercial software package (Infometrix Pirouette, Seattle, WA USA).
Stream property calibration model data (rundowns)Stream Property Units Model accuracy* Model range Number of samples Number of factors
C5C6 D5% vol °C 0.2 38 - 43 76 6
D95% vol °C 0.5 65 - 72 76 3
FBP °C 1.3 66 - 78 75 3
IBP °C 0.6 30 - 38 76 5
Light Naphtha D5% vol °C 0.8 75 - 85 72 5
D95% vol °C 1.1 120 - 150 68 6
FBP °C 2.5 135 - 170 60 6
IBP °C 1.4 60 - 75 66 6
Density g/l 0.5 716 - 728 69 6
Heavy Naphtha D5% vol °C 1.3 108 - 120 80 3
D95% vol °C 1.5 160 - 180 78 6
FBP °C 2.2 168 - 186 74 7
IBP °C 1.6 96 - 114 72 3
Kerosene D5% vol °C 0.6 175 - 200 74 5
D95% vol °C 1.2 220 - 255 74 6
FBP °C 1.5 235 - 260 66 6
IBP °C 1.8 160 - 185 70 4
Flash Point °C 1.7 45 - 70 73 6
AGO D5% vol °C 1.8 240 - 255 73 4
E250 vol % 0.6 4 - 10 70 5
E350 vol % 1.1 82 - 97 69 6
FBP °C 2.4 355 - 372 76 6
IBP °C 3.6 200 - 215 68 7
Flash Point °C 1.8 70 - 82 76 5
Cloud Point °C 1.0 -4 to +4 75 6
HGO E350 vol % 0.4 1.5 - 6.5 43 6
Flash Point °C 2.3 196 - 208 48 3
Density g/l 0.4 892 - 906 78 4
Viscosity cSt 0.5 18 - 35 70 5
(* SECV at 1 Sigma)
Prior to use for calibration, all spectral data were subject to a simple spectral data pre-processing procedure – limited to a fixed point baseline offset and an area normalization. No other procedures (such as orthogonal projection or multiplicative scatter correction) were either employed or necessary.
Example calibration plots for CDU rundown streams
C5C6 D5% °C
KERO FP °C
LN D95% °C
HGO Visco mm 2/s

10 CD U O P TI M I Z ATI O N | W hite P ap e r
A few remarks on these data are appropriate. Firstly it is worth noting that the spectral variation amongst the data for any one side-draw stream is rather low – even for the lighter streams, but increasingly the case for the heavier cuts. Near infrared spectral absorbances are leveraged less by higher molecular weight components. This places a very high premium on spectroscopic measurement stability and equivalence between analyzers, making FT-NIR one of the only NIR methods capable of achieving reliably stable calibrations for CDU applications.
An additional factor in the limited data variation is characteristic of CDU operation – the side-draw stream qualities do not vary very much, and again this places a premium on (low) measurement noise in order that successful calibration models can be achieved. The reported calibration model accuracies for these data sets all fall within or close to the ASTM reproducibility (R) of the standard laboratory method employed to generate the reference data. In general the expected performance of an on-line FT-NIR analyzer when compared with validation data generated by a standard method is given by:
ASTM (R) > RMSEP > ASTM (r)Where ASTM (R) = the reproducibility / accuracy of the ASTM laboratory reference method,ASTM (r) = the repeatability / precision of the method, andRMSEP = the Root Mean Square Standard Error of Prediction of the FT-NIR analyzer calibration model versus the standard laboratory method
This claim bears some explanation. Calibration datasets for correlation based methods (for example PLS methods using FT-NIR spectra and site laboratory reference property data) are, and should be, built up over a period of time in order to maximize sample quality variability, to span as far as possible unexpected process variations, and to cover seasonal or other periodic variation in feedstocks. This means that ASTM (r) – the short-term, single-operator repeatability of the laboratory method will under-estimate the laboratory-origin error in the dataset. In fact there may well be service or maintenance interventions in the
laboratory standard equipment over the period the calibration dataset is accumulated. However ASTM (R) – the full inter-laboratory, multi-analyzer reproducibility of the laboratory method would over-estimate the local laboratory-origin error injected into the calibration dataset by the sample property reference values. Hence the probable outcome of the PLS / FT-NIR calibration exercise, in terms of calibration model accuracy, lies between the two.
On-line FT-NIR analyzer results and data for process controlThe on-line process FT-NIR analyzer has an analysis time per stream of less than one minute per stream, when, as in the present case, operating with fast TE-cooled NIR detectors, software-based selection of detector channel (without any electromechanical selection which would require a settling time delay) and the rapid scan time possible when operating in the 1st overtone region (64 scans at 8cm-1 resolution). In fact data is reported to the DCS via Modbus RTU (or TCP/IP) protocol with a stream update across all six rundown streams every 3 minutes. This data-rate is really somewhat more rapid then required or expected by any APC optimizer, so for long-term data a moving average over a set of data points is more than adequate.
Some examples of real-time trends derived from the on-line FT-NIR analyzer data are shown here.
Time (Total run = 12 hours)
E35
0 v
ol%
LGO cut-point tracking to < 0.5 vol%
LGO E350 & E250 vol%
E25
0 v
ol%
Percent evaporated points at 250 and 350 °C plotted for light gasoil (LGO)

11CD U O P TI M I Z ATI O N | W hite P ap e r
HGO E350 wt%
Time (total = 18 hours)
wt%
Cell temperature °C
Time
°C
Heavy gasoil (HGO) percent evolved at 350°C over 18 hours vs cell temperature stability over same period
These measurements were critical in achieving a good return-on-investment for the system, since it allowed significantly improved LGO / HGO cut point control and prevented loss of high value product into residue.
The observed on-line FT-NIR analyzer precision (repeatability) per property per stream is given in the Table below.
On-line FT-NIR analyzer repeatability per stream per property
Stream Property
C5C6 IBP (°C) 5 vol% (°C) 95 vol% (°C) FBP (°C)
0.15 0.23 0.06 0.12
LN IBP (°C) 5 vol% (°C) 95 vol% (°C) FBP (°C)
0.11 0.15 0.42 0.48
HN IBP (°C) 5 vol% (°C) 95 vol% (°C) FBP (°C)
0.34 0.21 0.15 0.33
KERO Flash Point (°C) IBP (°C) 5 vol% (°C) 95 vol% (°C) FBP (°C)
0.77 0.46 0.42 0.89 0.74
AGO Flash Point (°C) Cloud Point (°C) IBP (°C) 5 vol% (°C) E250 (vol%) E350 (vol%) FBP (°C)
1.10 0.62 0.38 0.55 0.16 0.62 0.91
HGO Flash Point (°C) Specific Gravity (Kg/m3)
E350 (vol%) Viscosity (mm2/s)
1.16 0.22 0.01 0.53
ConclusionsThe data presented here indicate the measures taken during the practical implementation of a project to commission a multi-stream, multi-property on-line FT-NIR analyzer for process control of the operation of a CDU. The necessary spectral ranges of operation, detector types, fiber-optic types, requirements for sample conditioning and liquid sample flow cells have been discussed. In examining the performance of PLS calibration models developed off-line using a spectroscopically-equivalent laboratory FT-NIR analyzer, the limited spectral variance observed in typical CDU rundown streams has been noted, and the demands this places on FT-NIR analyzer precision and reproducibility considered. The results show that FT-NIR has the capability to provide real-time multi-property data on a suitable time-scale and with appropriate repeatability for convenient operation of CDU advanced process control optimization.
AcknowledgementsThe authors gratefully acknowledge the co-operation of SLOVNAFT a.s., Bratislava and in particular that of Dipl. Ing. Viliam Linka, Mr. Jozef Fabisik and Mr Ivan Rybar without whose support the preparation of this Paper would have been impossible. They are also indebted for the helpful assistance of Drs. Jean-Luc Flandin and Sacha Bonenfant, ABB Analytical, Quebec, whose advice in the analysis and reduction of the data and the preparation of chemometric models is happily acknowledged.
References1. Nakamura, David, “Global Refining Capacity”, Oil and Gas
Journal, Special Report, December, 2006, p562. Hou, K., Li, Y., Shen, J., Hu, S., “Crude Distillation Unit On-Line
Optimization”, Hydrocarbon Processing, June, 20013. Friedman, Y. Z., “More About Inferential Models (editorial)”,
Hydrocarbon Processing, February, 20054. Chung, H., “Applications of NIR in Refineries – Important Issues
to Address”, App. Spectrosc. Rev., Vol 42, 2007, p251-2855. Nelson, Wilbur, L. “Nelson Complexity Index”, Oil
and Gas Journal, September, 19766. Simpson, Michael, B., “Near-infrared Spectroscopy for Process
Analytical Technology”, Process Analytical Technology, (Ed. Bakeev, K.), Blackwell Publishing, 2005

—ABB Inc. Measurement & Analytics 3400, rue Pierre-Ardouin Québec (Québec) G1P 0B2 CANADA Tel: + 1 418-877-2944
1 800 858-3847 (North America)E-mail: [email protected]
abb.com/analytical
WP
/C
DU
UN
IT-E
N
11.2
017—
We reserve the right to make technical changes or modify the contents of this document without prior notice. With regard to purchase orders, the agreed particulars shall prevail. ABB does not accept any responsibility whatsoever for potential errors or possible lack of information in this document.
We reserve all rights in this document and in the subject matter and illustrations contained therein. Any reproduction, disclosure to third parties or utilization of its contents – in whole or in parts – is forbidden without prior written consent of ABB.
© Copyright 2017 ABB.All rights reserved.


![AEA Hysys Crude Distillation[1]](https://img.dokumen.tips/doc/110x75/5571fccb497959916997f2cc/aea-hysys-crude-distillation1.jpg)