Embed Size (px)
Citation preview
Critical Design Review
FeatherCraft Integrated Structural Housing & Computer, Hardware Interface Processing Suite
Team: Larry Burkey, Jorge Cervantes, Lewis Gillis, Evan Graser, Andrei Iskra, Megan Howard, Taylor Maurer, Davis Peterson, Maggie Williams
Customer: Michael Brown Advisor: Joe Tanner

PROJECT PURPOSE & OBJECTIVES 2
Project Motivation:
Commercialization of International Space Station (ISS) provides a launch opportunity not only to cubesats but larger 100 kg spacecraft
Spacecraft are launched on ISS cargo resupply missions, allowing for soft-stowed configuration and less stress on structure in launch environment
Surrey Satellite Technology US plans to offer the FeatherCraft system as a cost-effective platform for payloads of 45 kg or less.
Project Overview
Design Overview
CPEs & Requirements
RisksVerification &
ValidationProject
Planning 3
Project Statement:
The 5 kg FeatherCraft structure shall provide support for a 100 kg total mass commercial spacecraft with
reduced structural manufacturing time and materials cost, and enable the spacecraft to survive launch to
and deployment from the ISS for a nadir facing mission.
4Project
OverviewDesign
OverviewCPEs &
Requirements Risks
Verification & Validation
Project Planning
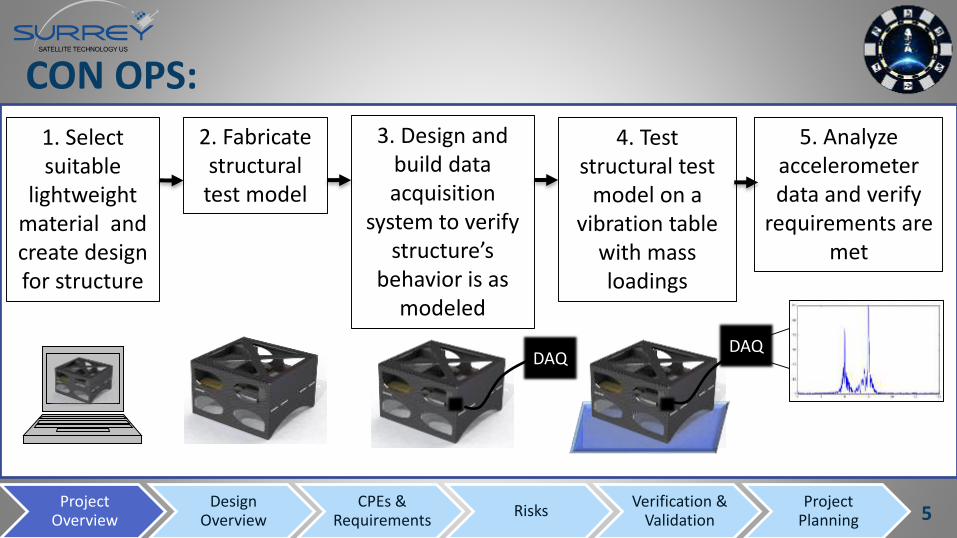
CON OPS:
1. Select suitable
lightweight material and create design for structure
2. Fabricate structural test model
4. Test structural test
model on a vibration table
with mass loadings
5. Analyze accelerometer data and verify
requirements are met
3. Design and build data acquisition
system to verify structure’s
behavior is as modeled
DAQDAQ
5Project
OverviewDesign
OverviewCPEs &
Requirements Risks
Verification & Validation
Project Planning
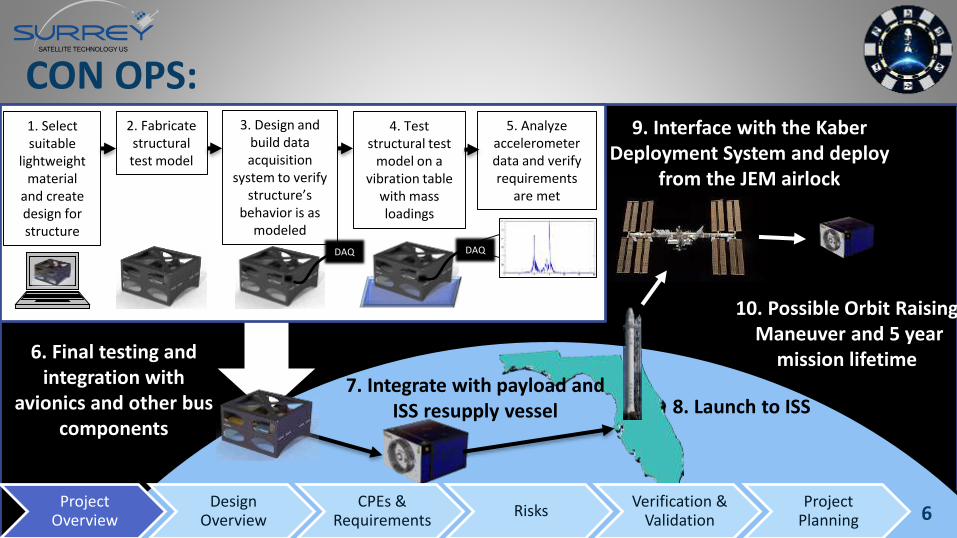
6. Final testing and integration with
avionics and other bus components
7. Integrate with payload and ISS resupply vessel 8. Launch to ISS
9. Interface with the KaberDeployment System and deploy
from the JEM airlock
10. Possible Orbit RaisingManeuver and 5 year
mission lifetime
CON OPS:1. Select suitable
lightweight material
and create design for structure
2. Fabricate structural test model
4. Test structural test
model on a vibration table
with mass loadings
5. Analyze accelerometer data and verify requirements
are met
3. Design and build data acquisition
system to verify structure’s
behavior is as modeled
DAQ DAQ
6Project
OverviewDesign
OverviewCPEs &
Requirements Risks
Verification & Validation
Project Planning

DESIGN SOLUTION7
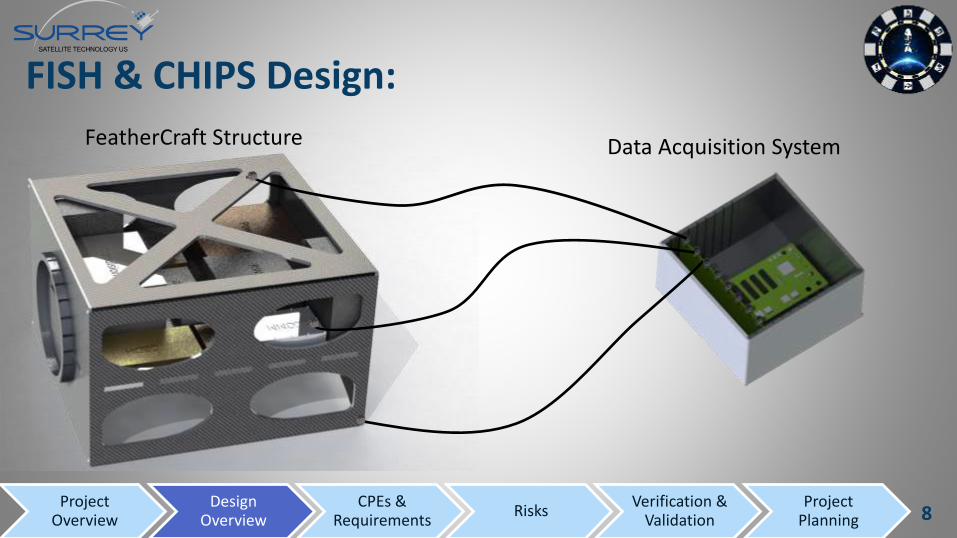
FISH & CHIPS Design:
FeatherCraft Structure
8Project
OverviewDesign
OverviewCPEs &
Requirements Risks
Verification & Validation
Project Planning
Data Acquisition System
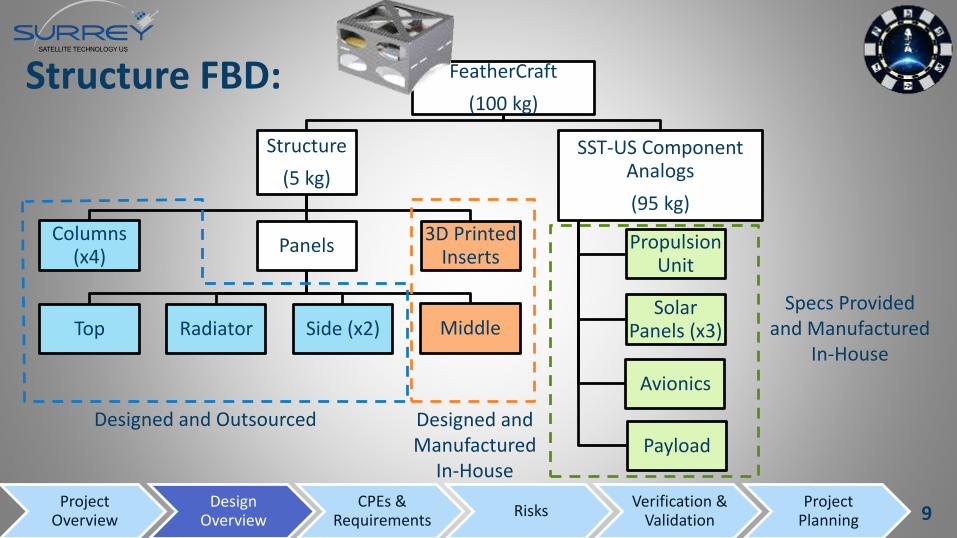
Structure FBD: FeatherCraft
(100 kg)
Structure
(5 kg)
Columns (x4)
3D Printed Inserts
Panels
MiddleSide (x2)Top Radiator
SST-US Component Analogs
(95 kg)
Propulsion Unit
Solar Panels (x3)
Avionics
Payload Designed and Outsourced Designed and
Manufactured In-House
Specs Provided and Manufactured
In-House
9Project
OverviewDesign
OverviewCPEs &
Requirements Risks
Verification & Validation
Project Planning

FISH & CHIPS Design:
FeatherCraft Structure
10Project
OverviewDesign
OverviewCPEs &
Requirements Risks
Verification & Validation
Project Planning
Data Acquisition System
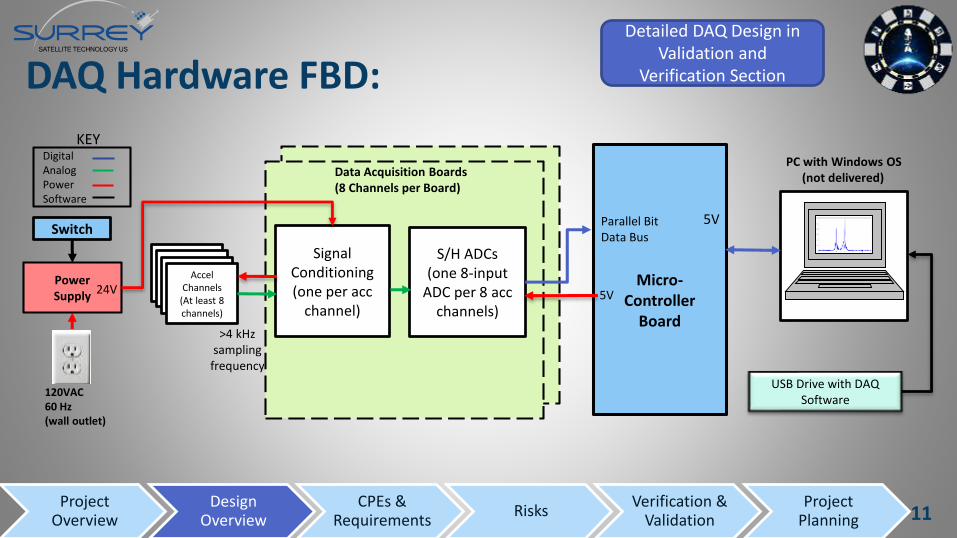
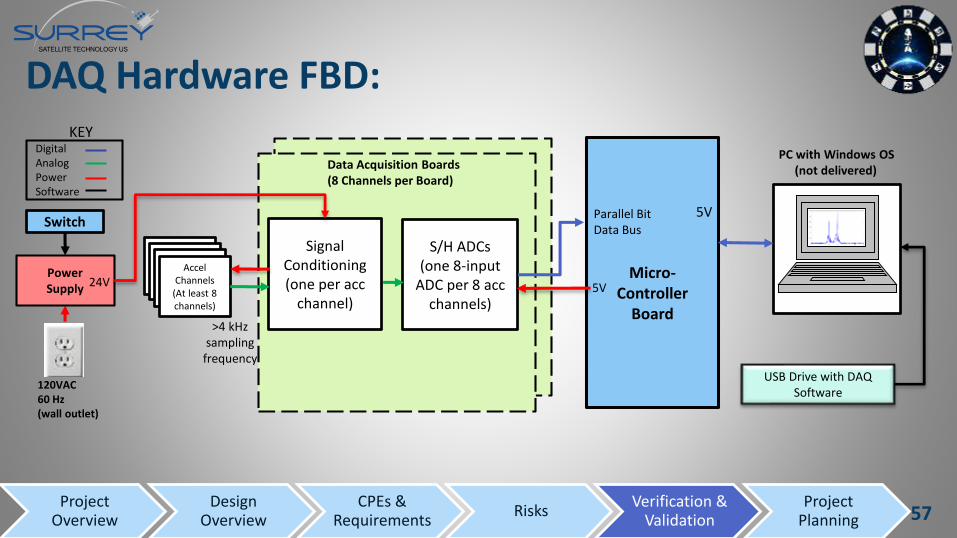
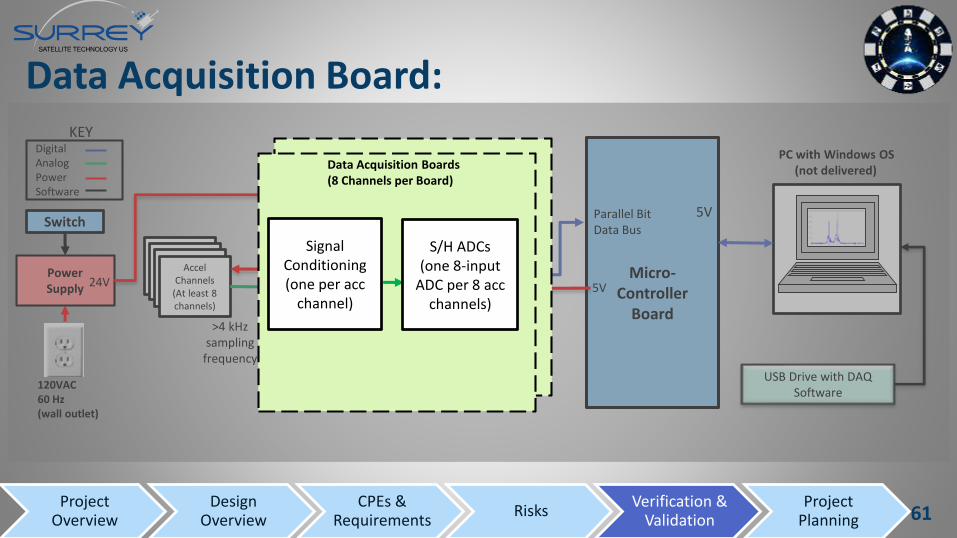
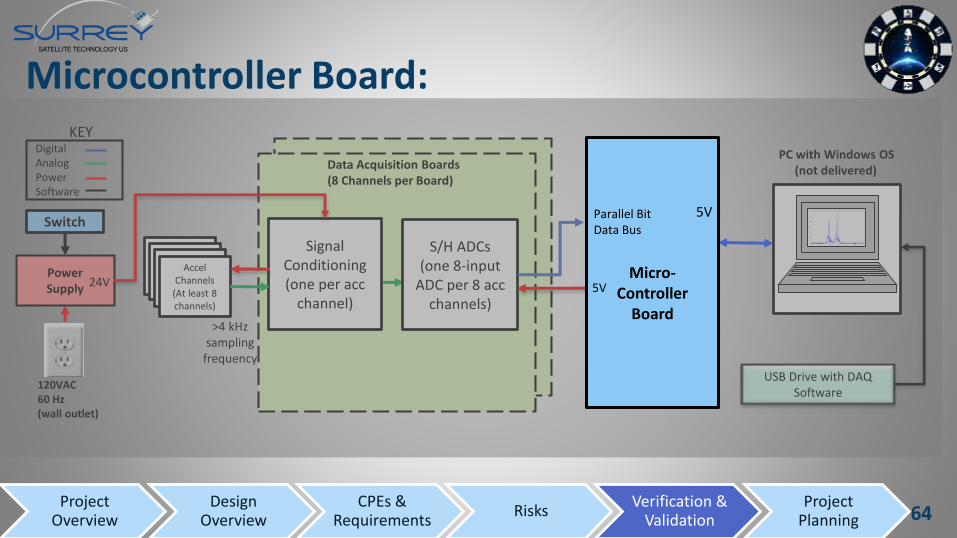
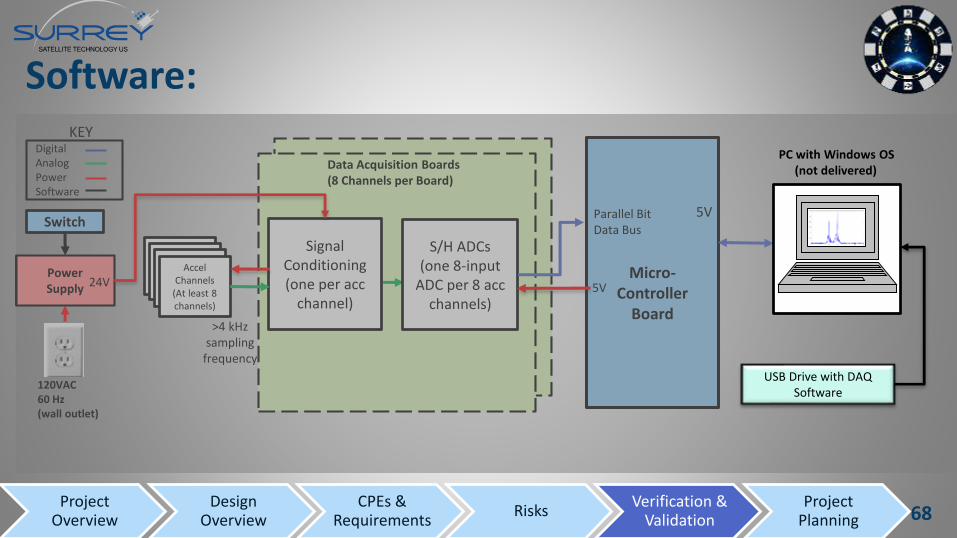
DAQ Hardware FBD:
PC with Windows OS(not delivered)
DigitalAnalogPowerSoftware
KEY
5V
Micro-Controller
Board
Parallel Bit Data Bus
5V
5V
USB Drive with DAQ Software
AccelChannels
(At least 8 channels)
Data Acquisition Boards(8 Channels per Board)
Signal Conditioning (one per acc
channel)
S/H ADCs (one 8-input
ADC per 8 accchannels)
120VAC60 Hz(wall outlet)
Switch
Power Supply
24V
>4 kHz sampling
frequency
11Project
OverviewDesign
OverviewCPEs &
Requirements Risks
Verification & Validation
Project Planning
Detailed DAQ Design in Validation and
Verification Section

STRUCTURE DESIGN
12
Design Overview:
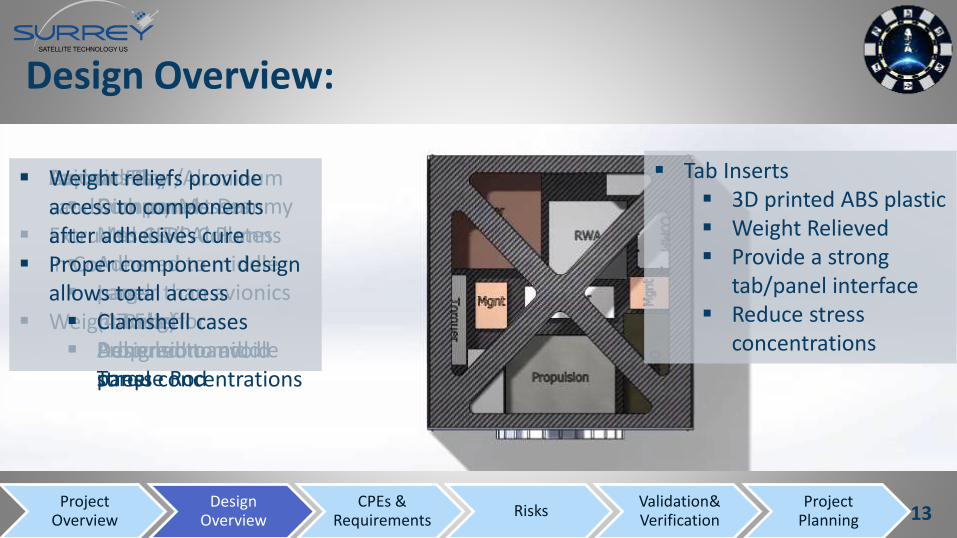
Carbon Fiber/Aluminum sandwich panels
Extruded CFRP Columns in Corners
Weight Relief Designed to avoid
stress concentrations
Avionics Bay Component Dummy
Masses Adhered to middle
panel Cutouts for
Propulsion and Torque Rod
Payload Bay Dummy Masses
1.5” Al Plates
Larger than avionics (47.5kg)
Adhered to middle panel
Tab Inserts 3D printed ABS plastic Weight Relieved Provide a strong
tab/panel interface Reduce stress
concentrations
Weight reliefs provide access to components after adhesives cure
Proper component design allows total access Clamshell cases
13Project
OverviewDesign
OverviewCPEs &
Requirements Risks
Validation& Verification
Project Planning
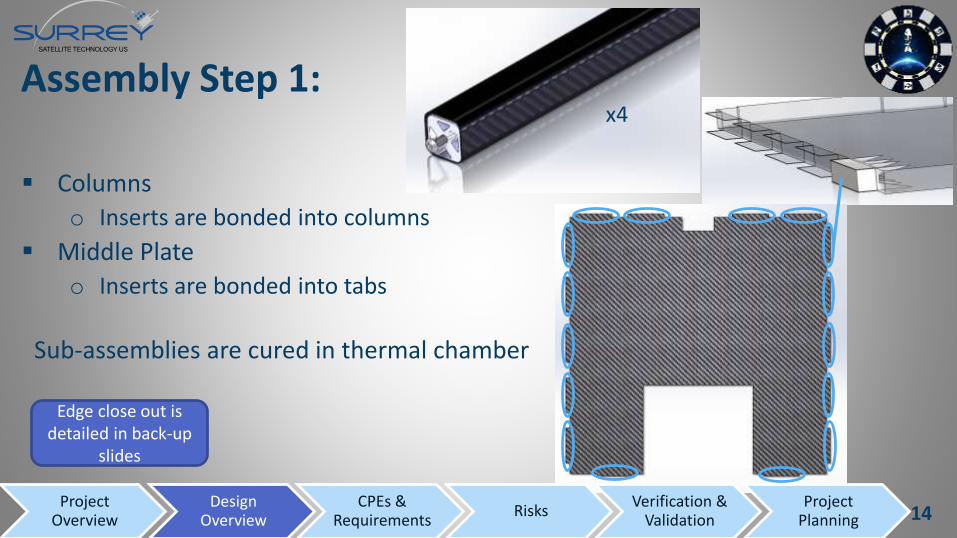
Assembly Step 1:
Columns
o Inserts are bonded into columns
Middle Plate
o Inserts are bonded into tabs
Sub-assemblies are cured in thermal chamber
x4
Edge close out is detailed in back-up
slides
14Project
OverviewDesign
OverviewCPEs &
Requirements Risks
Verification & Validation
Project Planning
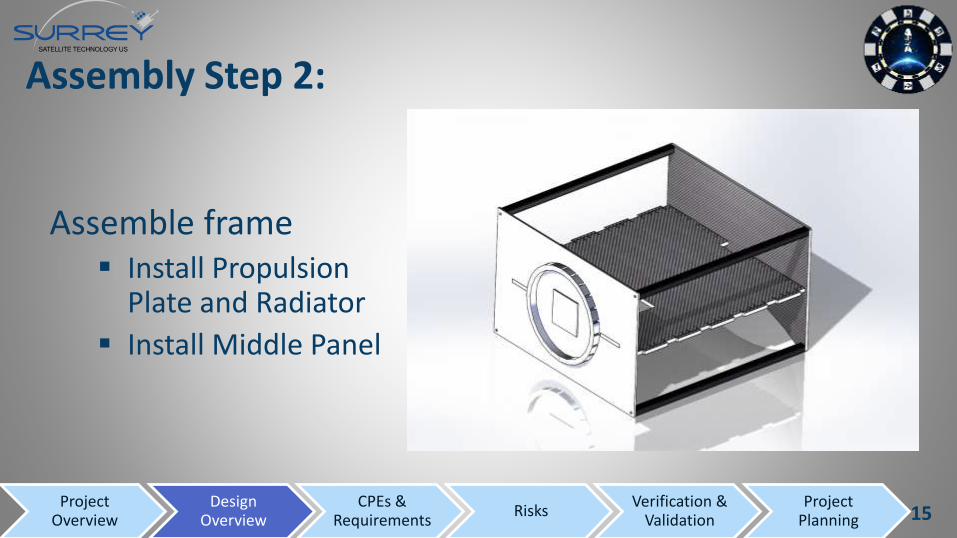
Assembly Step 2:
Assemble frame Install Propulsion
Plate and Radiator
Install Middle Panel
15Project
OverviewDesign
OverviewCPEs &
Requirements Risks
Verification & Validation
Project Planning
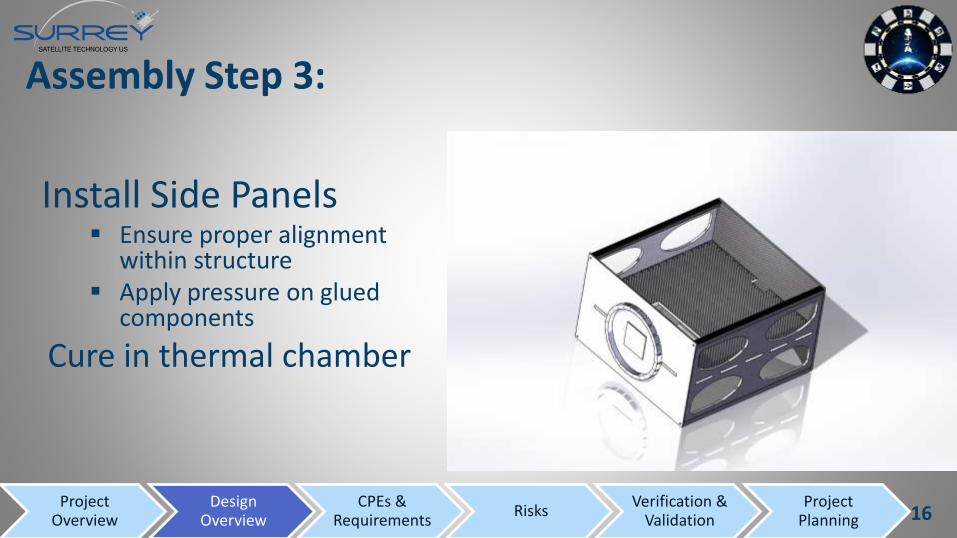
Assembly Step 3:
Install Side Panels Ensure proper alignment
within structure Apply pressure on glued
components
Cure in thermal chamber
16Project
OverviewDesign
OverviewCPEs &
Requirements Risks
Verification & Validation
Project Planning
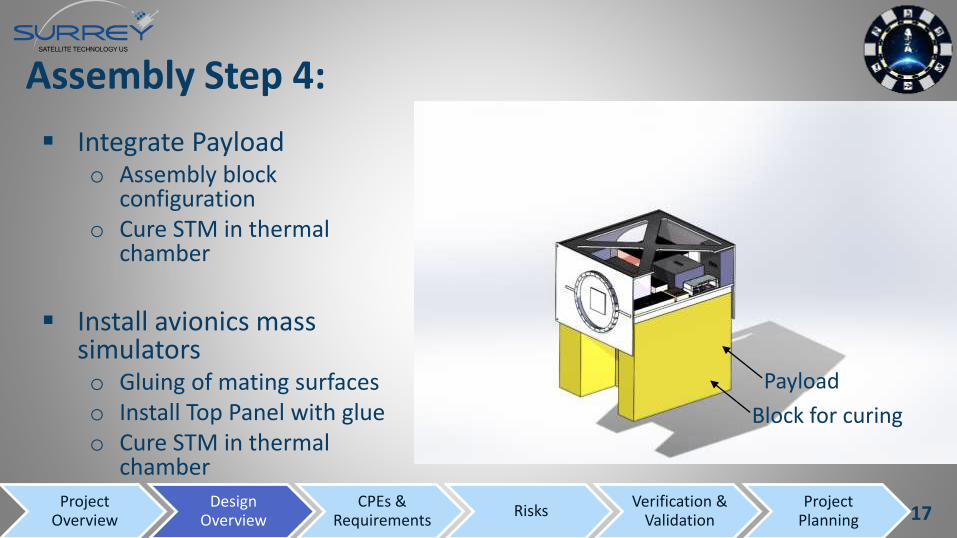
Assembly Step 4:
Integrate Payloado Assembly block
configurationo Cure STM in thermal
chamber
Install avionics mass simulatorso Gluing of mating surfaceso Install Top Panel with glueo Cure STM in thermal
chamber
Block for curing
Payload
17Project
OverviewDesign
OverviewCPEs &
Requirements Risks
Verification & Validation
Project Planning
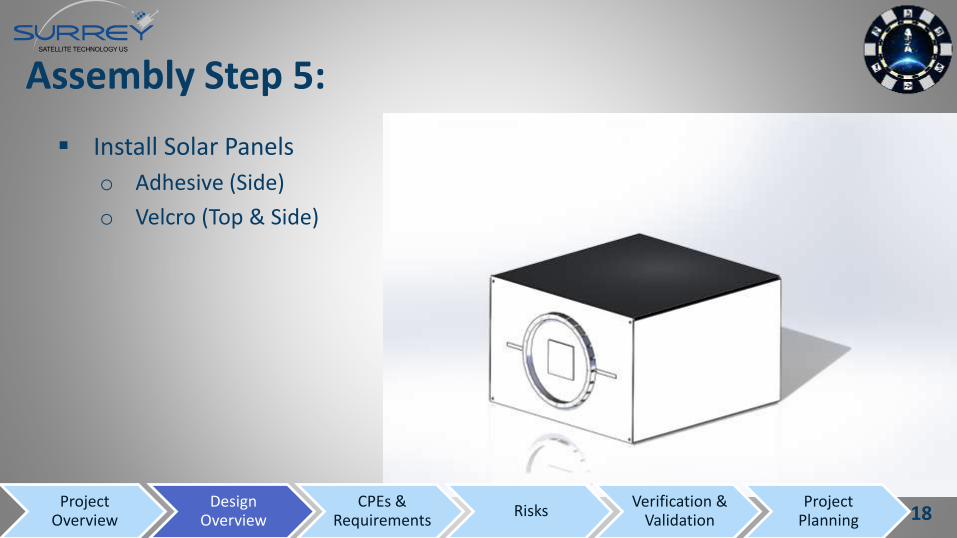
Assembly Step 5:
Install Solar Panels
o Adhesive (Side)
o Velcro (Top & Side)
18Project
OverviewDesign
OverviewCPEs &
Requirements Risks
Verification & Validation
Project Planning

CRITICAL PROJECT ELEMENTS 19
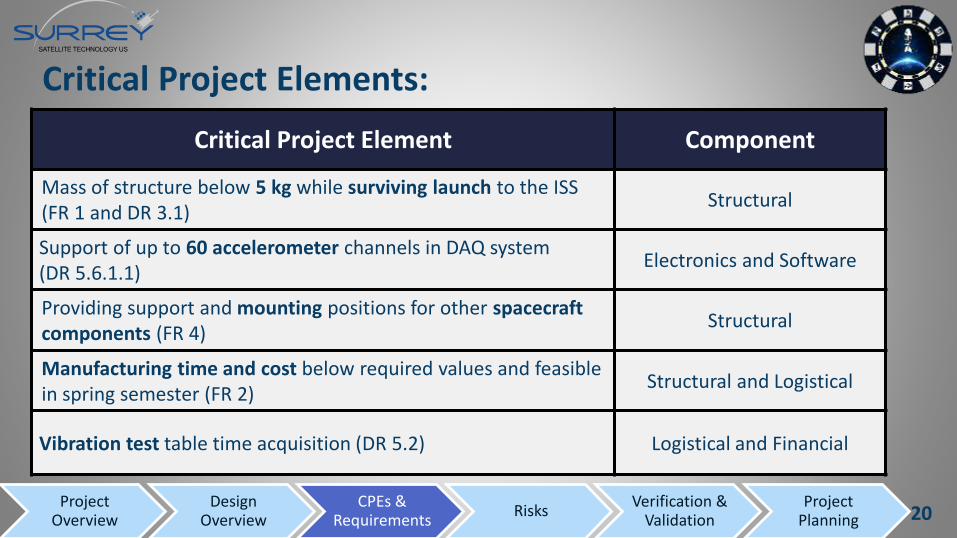
Critical Project Elements:
Critical Project Element Component
Mass of structure below 5 kg while surviving launch to the ISS (FR 1 and DR 3.1)
Structural
Support of up to 60 accelerometer channels in DAQ system (DR 5.6.1.1)
Electronics and Software
Providing support and mounting positions for other spacecraft components (FR 4)
Structural
Manufacturing time and cost below required values and feasible in spring semester (FR 2)
Structural and Logistical
Vibration test table time acquisition (DR 5.2) Logistical and Financial
20Project
OverviewDesign
OverviewCPEs &
Requirements Risks
Verification & Validation
Project Planning

DESIGN REQUIREMENTS 21
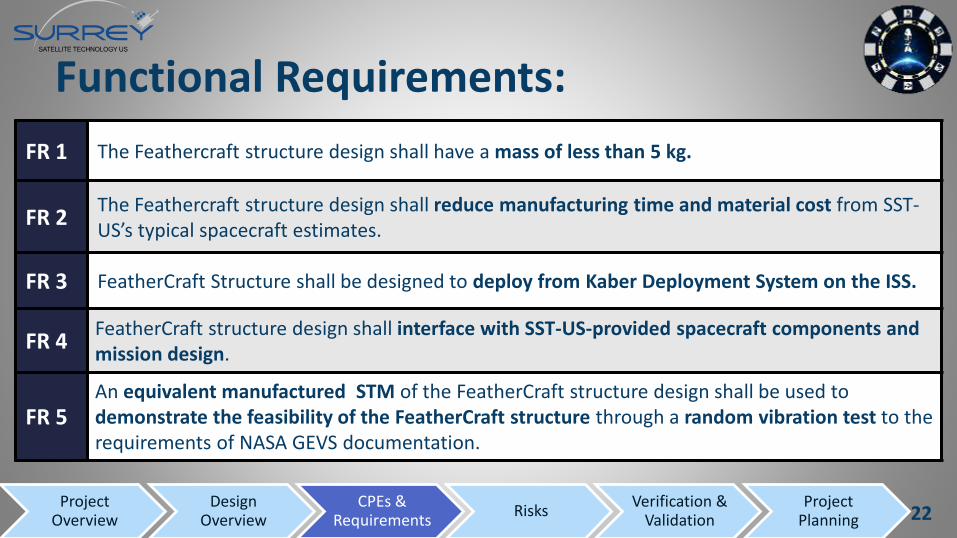
FR 1 The Feathercraft structure design shall have a mass of less than 5 kg.
FR 2The Feathercraft structure design shall reduce manufacturing time and material cost from SST-US’s typical spacecraft estimates.
FR 3 FeatherCraft Structure shall be designed to deploy from Kaber Deployment System on the ISS.
FR 4FeatherCraft structure design shall interface with SST-US-provided spacecraft components and mission design.
FR 5An equivalent manufactured STM of the FeatherCraft structure design shall be used to demonstrate the feasibility of the FeatherCraft structure through a random vibration test to the requirements of NASA GEVS documentation.
Functional Requirements:
22Project
OverviewDesign
OverviewCPEs &
Requirements Risks
Verification & Validation
Project Planning

FR 1: Mass of less than 5 kg
23
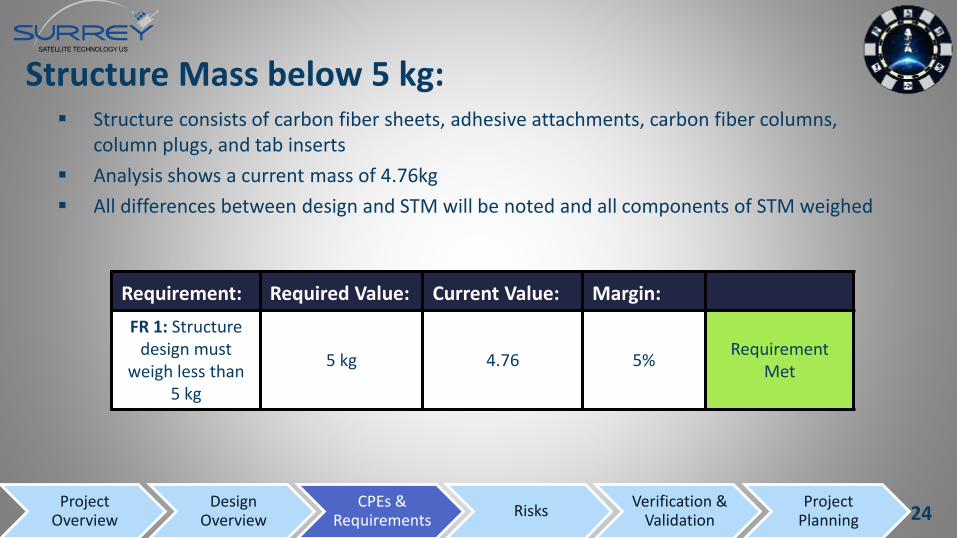
Structure Mass below 5 kg: Structure consists of carbon fiber sheets, adhesive attachments, carbon fiber columns,
column plugs, and tab inserts
Analysis shows a current mass of 4.76kg
All differences between design and STM will be noted and all components of STM weighed
Requirement: Required Value: Current Value: Margin:
FR 1: Structuredesign must
weigh less than 5 kg
5 kg 4.76 5%Requirement
Met
24Project
OverviewDesign
OverviewCPEs &
Requirements Risks
Verification & Validation
Project Planning
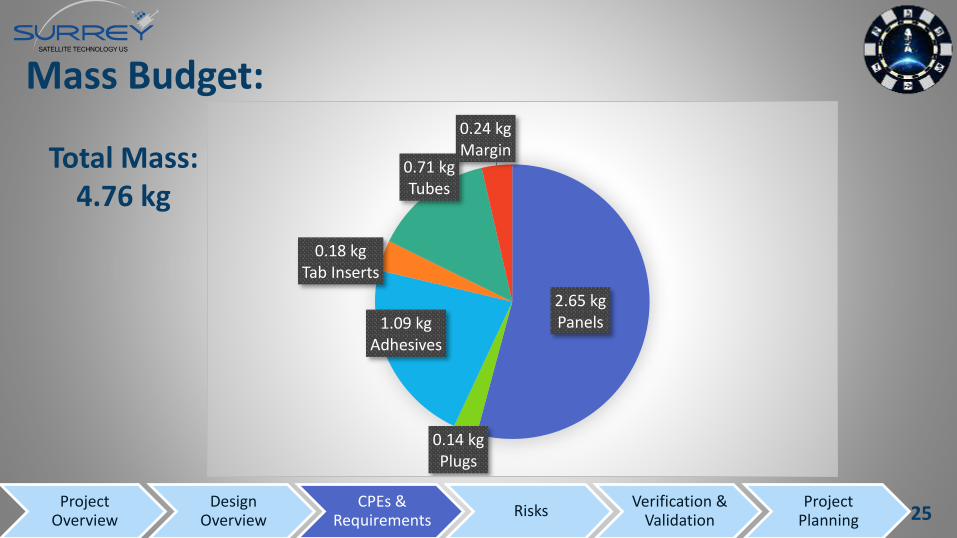
2.65 kgPanels1.09 kg
Adhesives
0.71 kgTubes
0.14 kgPlugs
0.18 kgTab Inserts
0.24 kgMargin
Mass Budget:
Total Mass: 4.76 kg
25Project
OverviewDesign
OverviewCPEs &
Requirements Risks
Verification & Validation
Project Planning
FR 2: Reduce manufacturing time and material cost
26
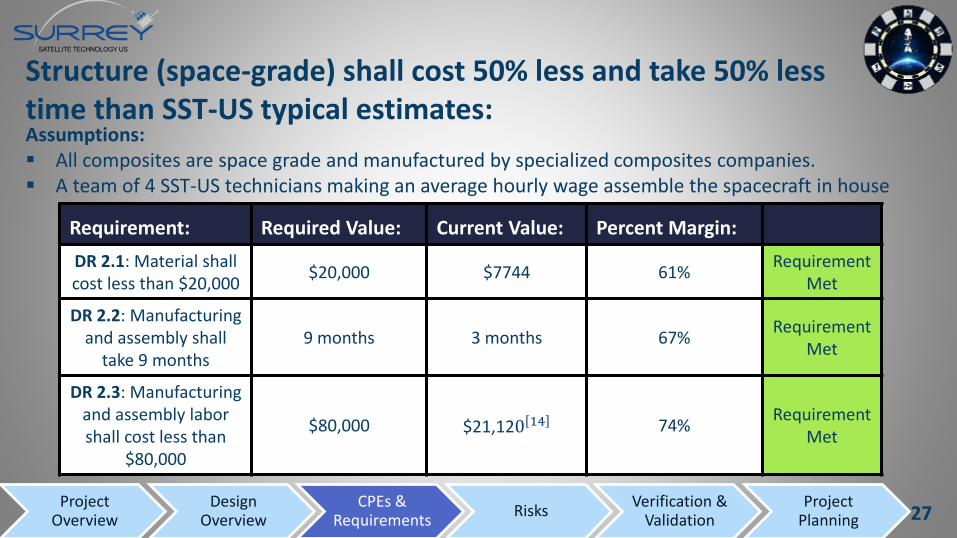
Structure (space-grade) shall cost 50% less and take 50% less time than SST-US typical estimates:
Requirement: Required Value: Current Value: Percent Margin:
DR 2.1: Material shall cost less than $20,000
$20,000 $7744 61%Requirement
Met
DR 2.2: Manufacturingand assembly shall
take 9 months9 months 3 months 67%
Requirement Met
DR 2.3: Manufacturing and assembly labor shall cost less than
$80,000
$80,000 $21,120 14 74%Requirement
Met
Assumptions: All composites are space grade and manufactured by specialized composites companies. A team of 4 SST-US technicians making an average hourly wage assemble the spacecraft in house
27Project
OverviewDesign
OverviewCPEs &
Requirements Risks
Verification & Validation
Project Planning
FR 3: Launch to the ISS and deploy from the Kaber
system on the ISS
28
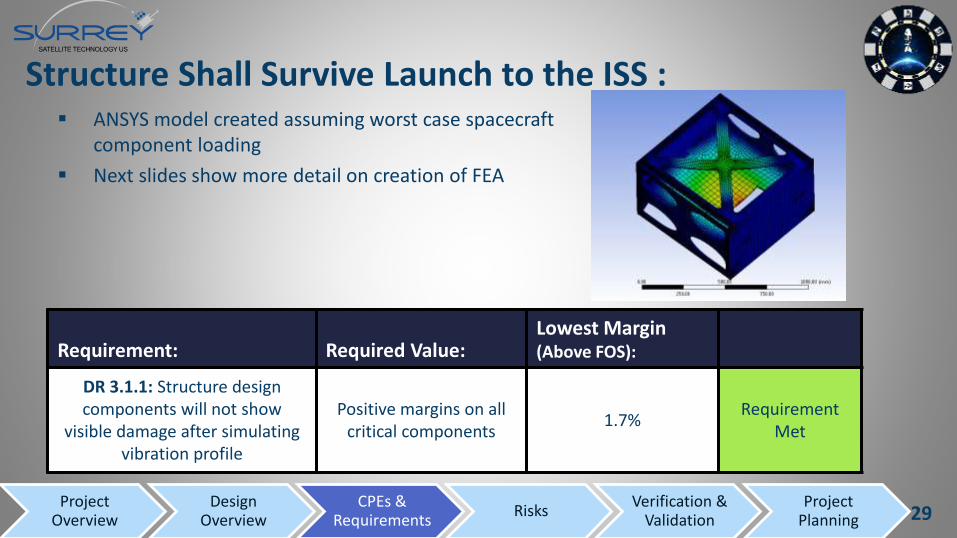
Structure Shall Survive Launch to the ISS : ANSYS model created assuming worst case spacecraft
component loading
Next slides show more detail on creation of FEA
Requirement: Required Value:Lowest Margin (Above FOS):
DR 3.1.1: Structure design components will not show
visible damage after simulating vibration profile
Positive margins on all critical components
1.7%Requirement
Met
29Project
OverviewDesign
OverviewCPEs &
Requirements Risks
Verification & Validation
Project Planning
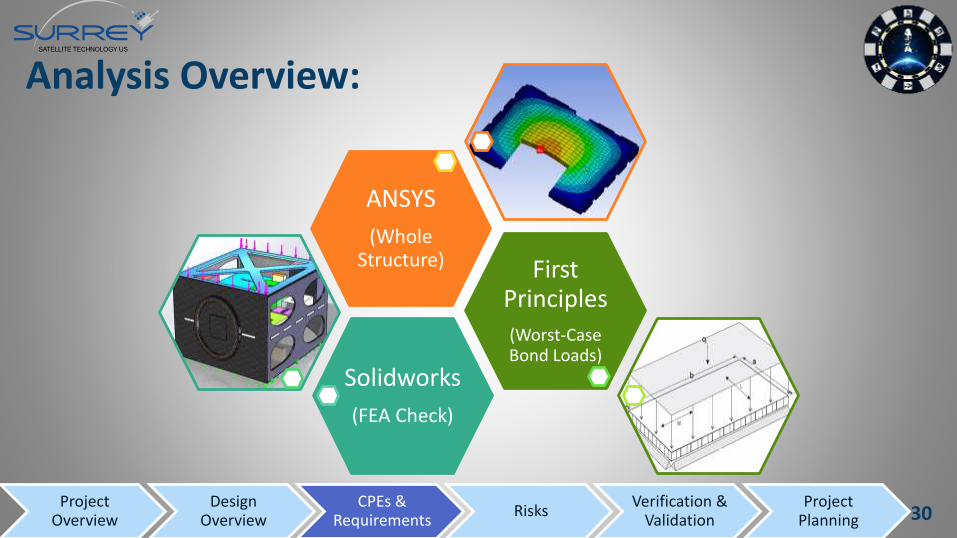
Analysis Overview:
Solidworks
(FEA Check)
First Principles
(Worst-Case Bond Loads)
ANSYS
(Whole Structure)
30Project
OverviewDesign
OverviewCPEs &
Requirements Risks
Verification & Validation
Project Planning
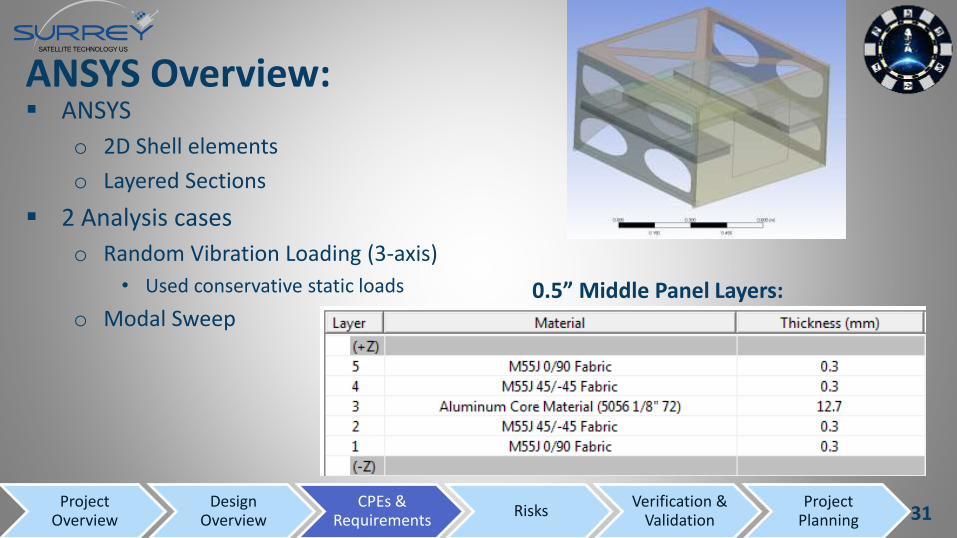
ANSYS Overview: ANSYS
o 2D Shell elements
o Layered Sections
2 Analysis cases
o Random Vibration Loading (3-axis)
• Used conservative static loads
o Modal Sweep0.5” Middle Panel Layers:
31Project
OverviewDesign
OverviewCPEs &
Requirements Risks
Verification & Validation
Project Planning
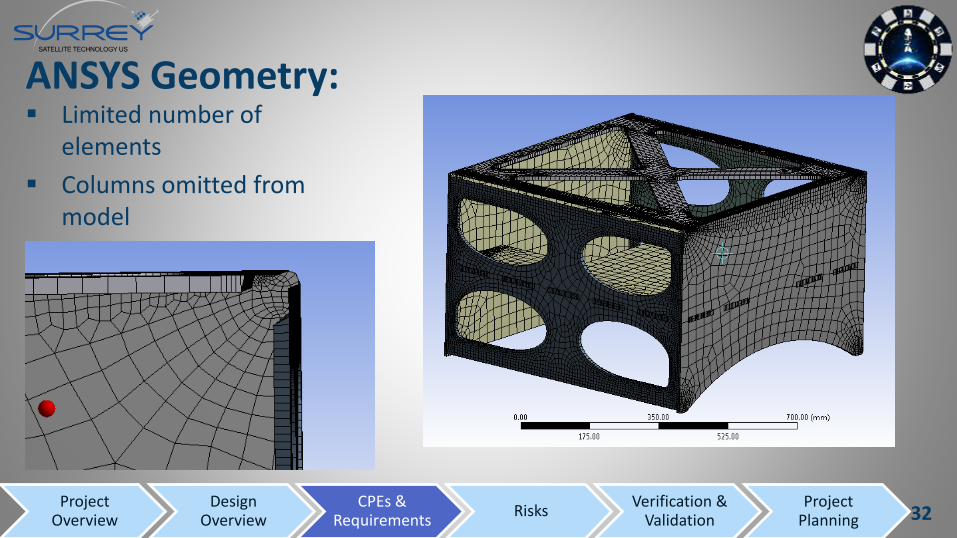
ANSYS Geometry: Limited number of
elements
Columns omitted from model
32Project
OverviewDesign
OverviewCPEs &
Requirements Risks
Verification & Validation
Project Planning
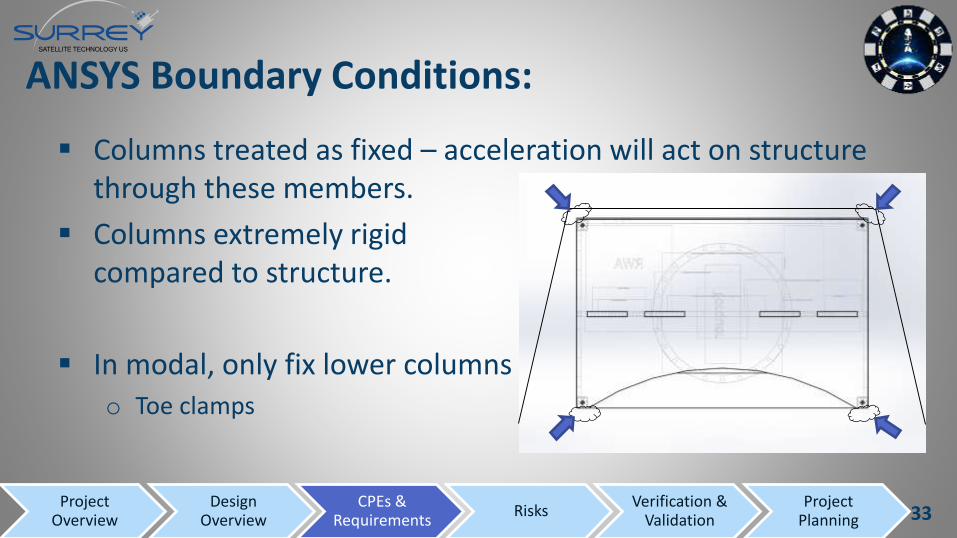
ANSYS Boundary Conditions:
Columns treated as fixed – acceleration will act on structure through these members.
Columns extremely rigid compared to structure.
In modal, only fix lower columnso Toe clamps
33Project
OverviewDesign
OverviewCPEs &
Requirements Risks
Verification & Validation
Project Planning
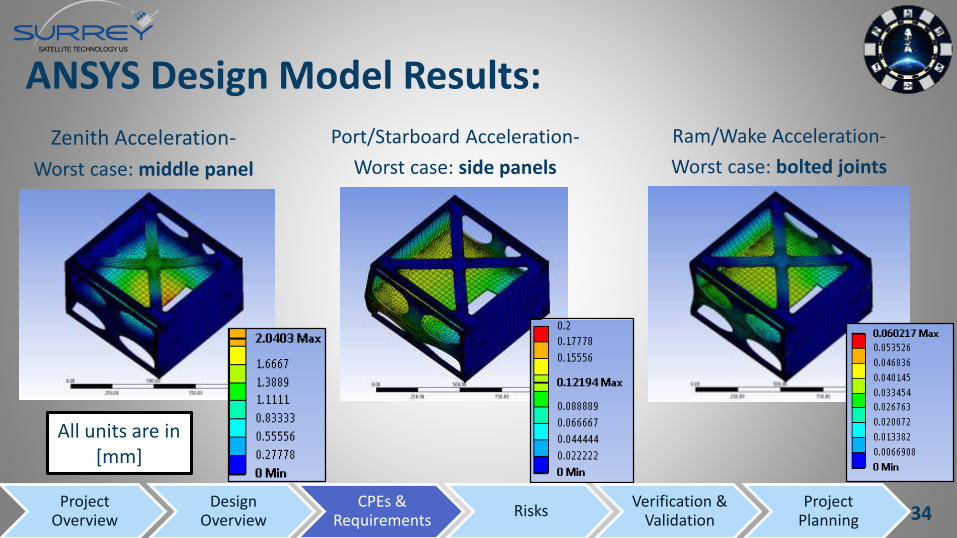
ANSYS Design Model Results:
Zenith Acceleration-
Worst case: middle panel
Port/Starboard Acceleration-
Worst case: side panels
Ram/Wake Acceleration-
Worst case: bolted joints
All units are in [mm]
34Project
OverviewDesign
OverviewCPEs &
Requirements Risks
Verification & Validation
Project Planning
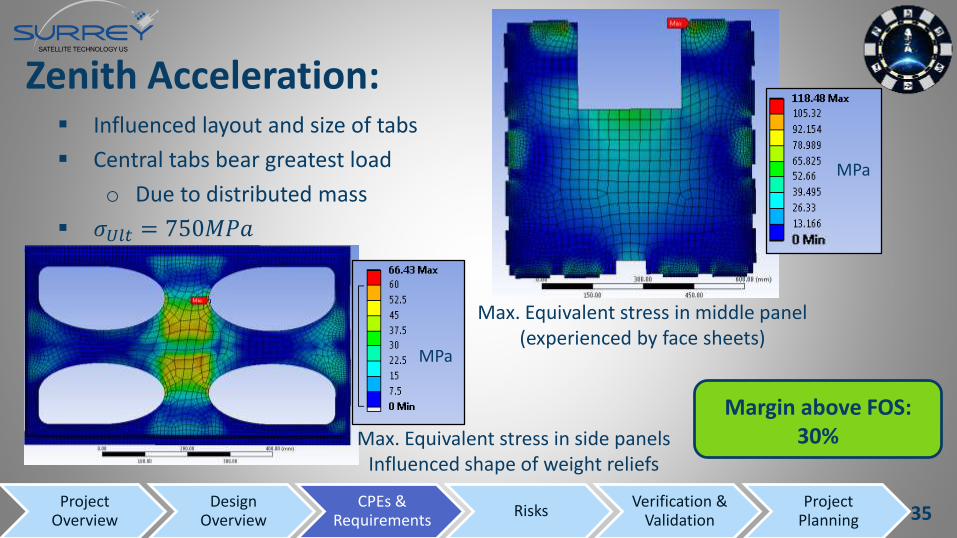
Zenith Acceleration: Influenced layout and size of tabs
Central tabs bear greatest load
o Due to distributed mass
𝜎𝑈𝑙𝑡 = 750𝑀𝑃𝑎
MPa
Max. Equivalent stress in middle panel (experienced by face sheets)
Max. Equivalent stress in side panelsInfluenced shape of weight reliefs
MPa
Margin above FOS: 30%
MPa
35Project
OverviewDesign
OverviewCPEs &
Requirements Risks
Verification & Validation
Project Planning
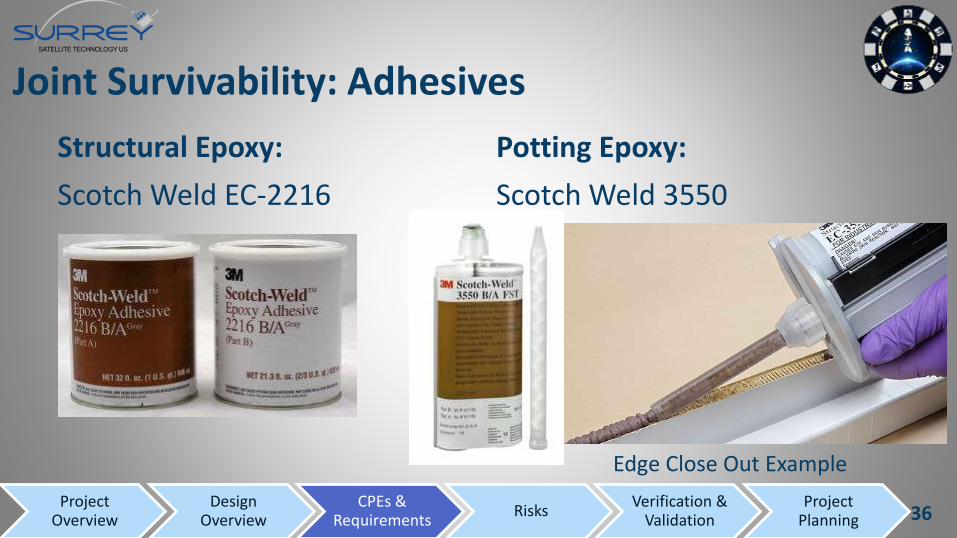
Structural Epoxy:
Scotch Weld EC-2216
Potting Epoxy:
Scotch Weld 3550
Joint Survivability: Adhesives
Edge Close Out Example
36Project
OverviewDesign
OverviewCPEs &
Requirements Risks
Verification & Validation
Project Planning
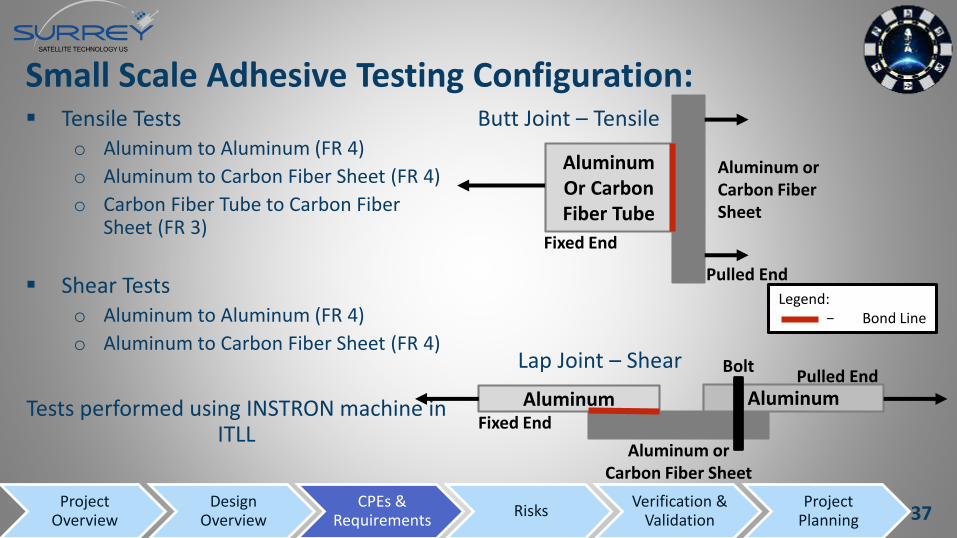
Small Scale Adhesive Testing Configuration: Tensile Tests
o Aluminum to Aluminum (FR 4)
o Aluminum to Carbon Fiber Sheet (FR 4)
o Carbon Fiber Tube to Carbon Fiber Sheet (FR 3)
Shear Tests o Aluminum to Aluminum (FR 4)
o Aluminum to Carbon Fiber Sheet (FR 4)
Tests performed using INSTRON machine in ITLL
Aluminum or Carbon Fiber Sheet
AluminumOr Carbon Fiber Tube
Fixed End
Pulled End
Aluminum Aluminum
Bolt
Fixed End
Pulled End
Aluminum or Carbon Fiber Sheet
Legend: − Bond Line
Butt Joint – Tensile
Lap Joint – Shear
37Project
OverviewDesign
OverviewCPEs &
Requirements Risks
Verification & Validation
Project Planning
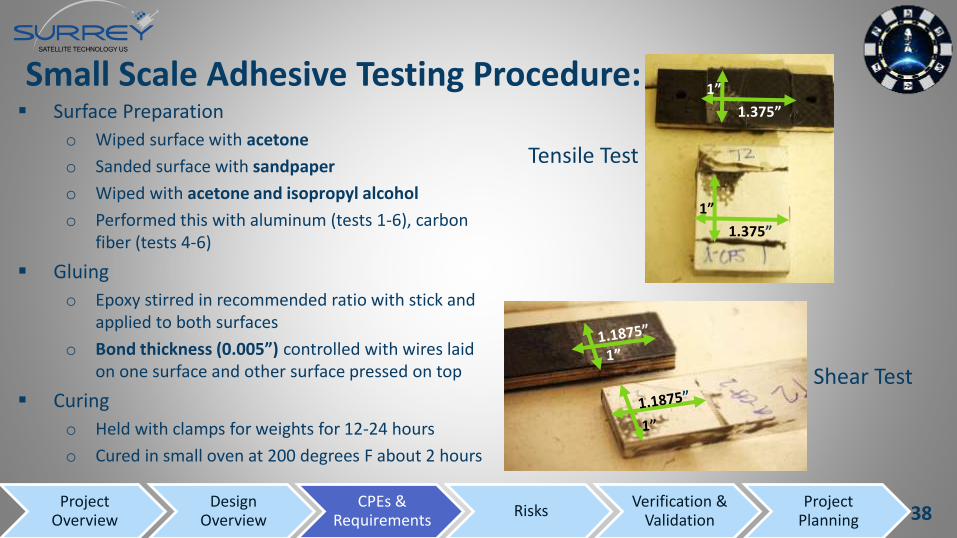
Surface Preparation
o Wiped surface with acetone
o Sanded surface with sandpaper
o Wiped with acetone and isopropyl alcohol
o Performed this with aluminum (tests 1-6), carbon fiber (tests 4-6)
Gluing
o Epoxy stirred in recommended ratio with stick and applied to both surfaces
o Bond thickness (0.005”) controlled with wires laid on one surface and other surface pressed on top
Curing
o Held with clamps for weights for 12-24 hours
o Cured in small oven at 200 degrees F about 2 hours
Small Scale Adhesive Testing Procedure:
Tensile Test
Shear Test
1.375”
1”
1.375”
1”
38Project
OverviewDesign
OverviewCPEs &
Requirements Risks
Verification & Validation
Project Planning
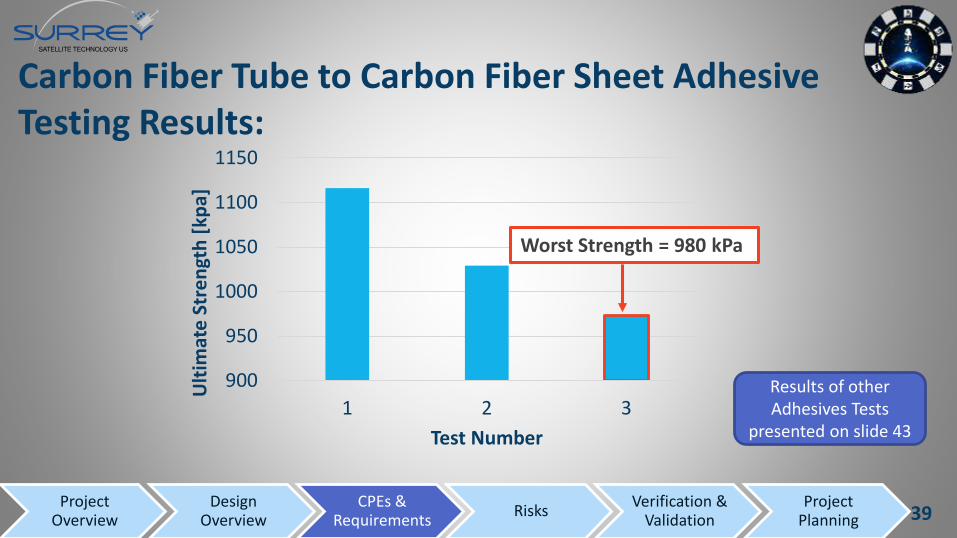
Carbon Fiber Tube to Carbon Fiber Sheet Adhesive Testing Results:
39Project
OverviewDesign
OverviewCPEs &
Requirements Risks
Verification & Validation
Project Planning
900
950
1000
1050
1100
1150
1 2 3
Ult
imat
e S
tre
ngt
h [
kpa]
Test Number
Worst Strength = 980 kPa
Results of other Adhesives Tests
presented on slide 43
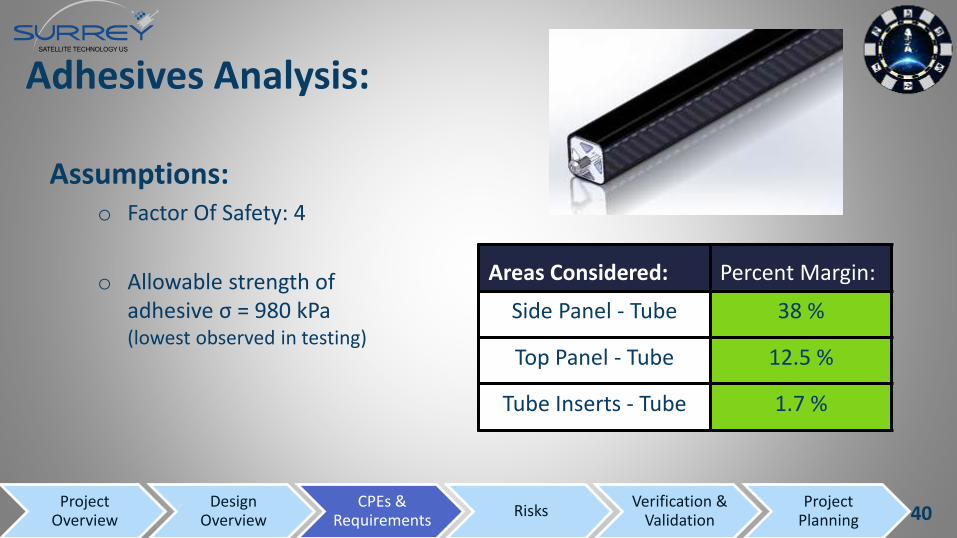
Adhesives Analysis:
Areas Considered: Percent Margin:
Side Panel - Tube 38 %
Top Panel - Tube 12.5 %
Tube Inserts - Tube 1.7 %
Assumptions:o Factor Of Safety: 4
o Allowable strength of adhesive σ = 980 kPa(lowest observed in testing)
40Project
OverviewDesign
OverviewCPEs &
Requirements Risks
Verification & Validation
Project Planning
FR 4: Interface SST-US spacecraft components.
41
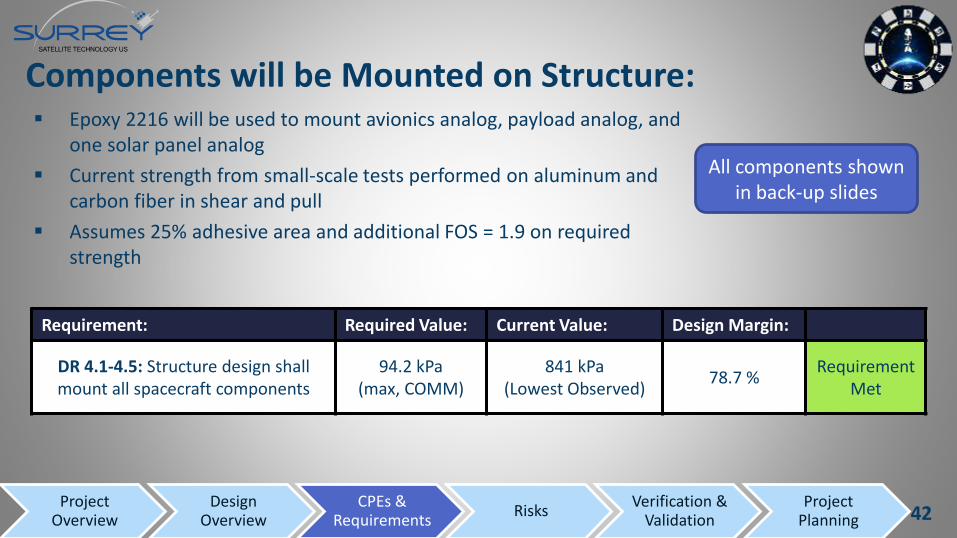
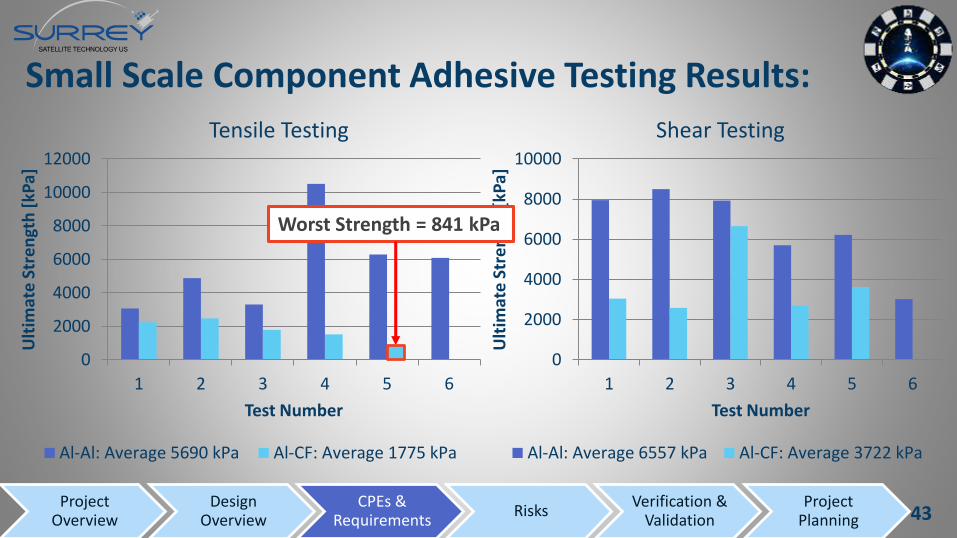
Components will be Mounted on Structure: Epoxy 2216 will be used to mount avionics analog, payload analog, and
one solar panel analog
Current strength from small-scale tests performed on aluminum and carbon fiber in shear and pull
Assumes 25% adhesive area and additional FOS = 1.9 on required strength
Requirement: Required Value: Current Value: Design Margin:
DR 4.1-4.5: Structure design shall mount all spacecraft components
94.2 kPa(max, COMM)
841 kPa(Lowest Observed)
78.7 %Requirement
Met
All components shown in back-up slides
42Project
OverviewDesign
OverviewCPEs &
Requirements Risks
Verification & Validation
Project Planning
0
2000
4000
6000
8000
10000
1 2 3 4 5 6
Ult
imat
e S
tre
ngt
h [
kPa]
Test Number
Al-Al: Average 6557 kPa Al-CF: Average 3722 kPa
0
2000
4000
6000
8000
10000
12000
1 2 3 4 5 6
Ult
imat
e S
tre
ngt
h [
kPa]
Test Number
Al-Al: Average 5690 kPa Al-CF: Average 1775 kPa
Small Scale Component Adhesive Testing Results:
Shear TestingTensile Testing
Worst Strength = 841 kPa
43Project
OverviewDesign
OverviewCPEs &
Requirements Risks
Verification & Validation
Project Planning

FR 5: Demonstrate structural integrity through a random
vibration test.
44
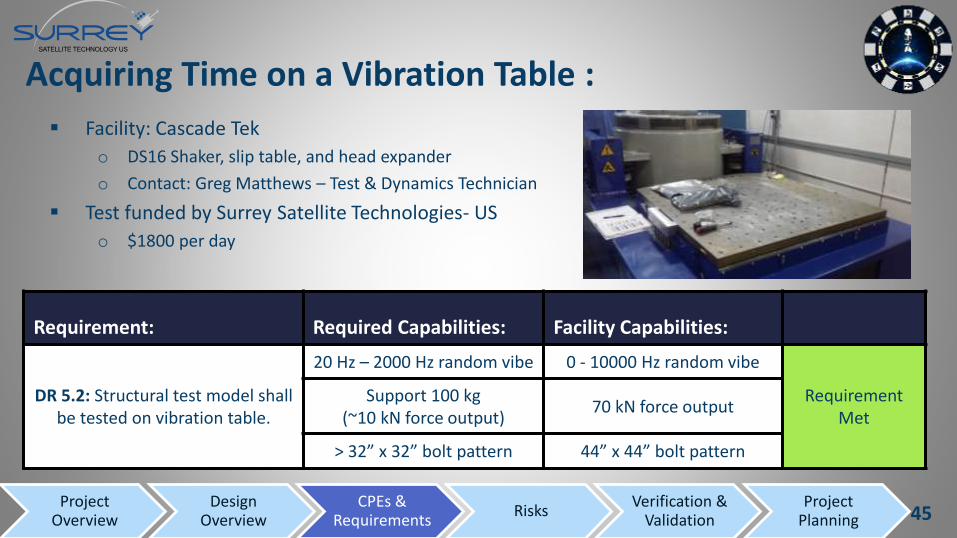
Acquiring Time on a Vibration Table :
Facility: Cascade Tek
o DS16 Shaker, slip table, and head expander
o Contact: Greg Matthews – Test & Dynamics Technician
Test funded by Surrey Satellite Technologies- US
o $1800 per day
Requirement: Required Capabilities: Facility Capabilities:
DR 5.2: Structural test model shallbe tested on vibration table.
20 Hz – 2000 Hz random vibe 0 - 10000 Hz random vibe
RequirementMet
Support 100 kg (~10 kN force output)
70 kN force output
> 32” x 32” bolt pattern 44” x 44” bolt pattern
45Project
OverviewDesign
OverviewCPEs &
Requirements Risks
Verification & Validation
Project Planning
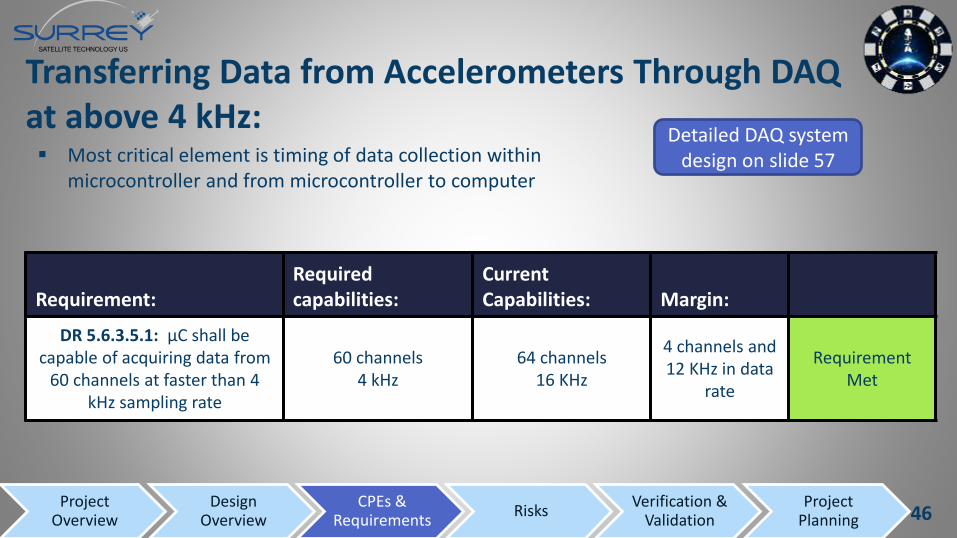
Transferring Data from Accelerometers Through DAQ at above 4 kHz:
Detailed DAQ system design on slide 57 Most critical element is timing of data collection within
microcontroller and from microcontroller to computer
Requirement:Requiredcapabilities:
CurrentCapabilities: Margin:
DR 5.6.3.5.1: µC shall be capable of acquiring data from
60 channels at faster than 4 kHz sampling rate
60 channels 4 kHz
64 channels16 KHz
4 channels and 12 KHz in data
rate
RequirementMet
46Project
OverviewDesign
OverviewCPEs &
Requirements Risks
Verification & Validation
Project Planning
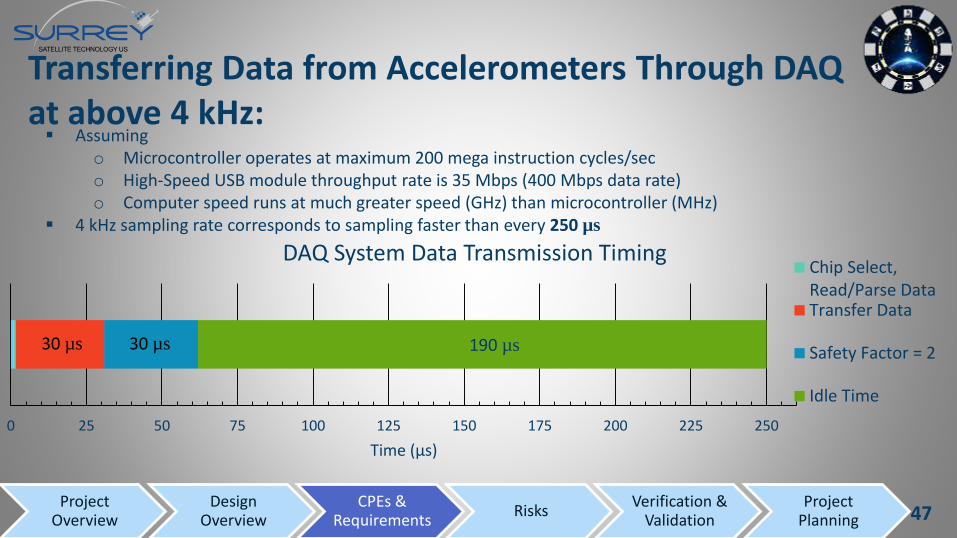
190 µs
0 25 50 75 100 125 150 175 200 225 250
Time (µs)
DAQ System Data Transmission TimingChip Select,Read/Parse DataTransfer Data
Safety Factor = 2
Idle Time
Assumingo Microcontroller operates at maximum 200 mega instruction cycles/seco High-Speed USB module throughput rate is 35 Mbps (400 Mbps data rate)o Computer speed runs at much greater speed (GHz) than microcontroller (MHz)
4 kHz sampling rate corresponds to sampling faster than every 250 µs
Transferring Data from Accelerometers Through DAQ at above 4 kHz:
30 µs30 µs
47Project
OverviewDesign
OverviewCPEs &
Requirements Risks
Verification & Validation
Project Planning

PROJECT RISK: 48
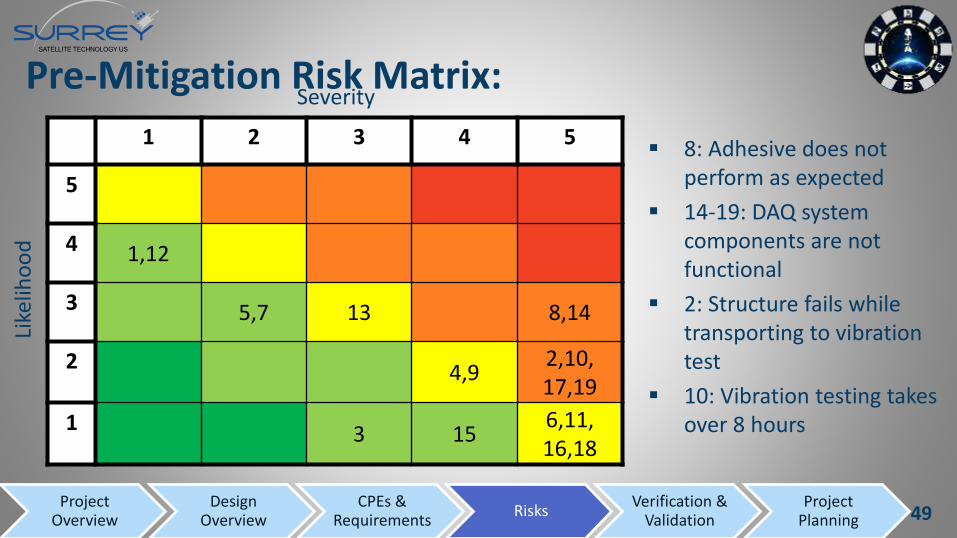
Pre-Mitigation Risk Matrix:
1 2 3 4 5
5
4 1,12
3 5,7 13 8,14
2 4,92,10,17,19
1 3 156,11,16,18
Severity
Like
liho
od
8: Adhesive does not perform as expected
14-19: DAQ system components are not functional
2: Structure fails while transporting to vibration test
10: Vibration testing takes over 8 hours
49Project
OverviewDesign
OverviewCPEs &
Requirements Risks
Verification & Validation
Project Planning
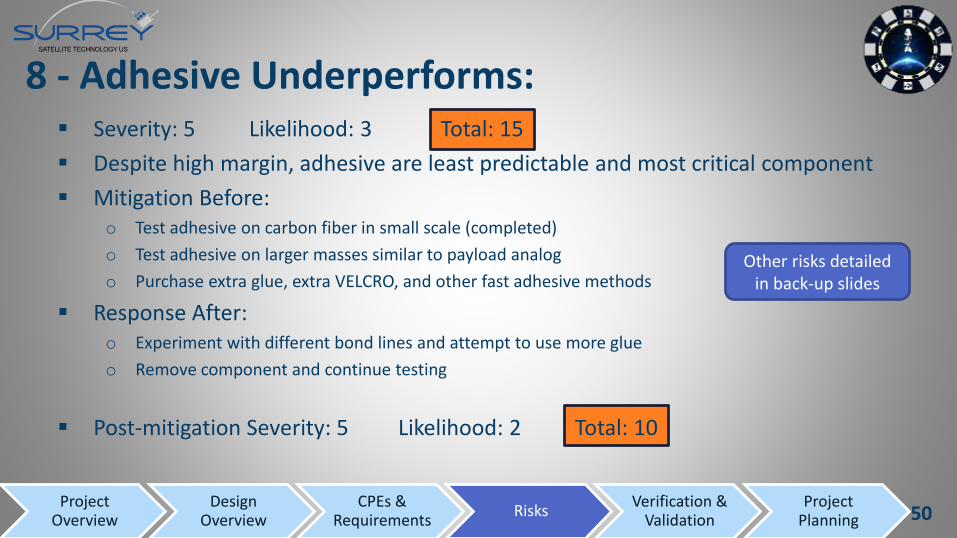
8 - Adhesive Underperforms: Severity: 5 Likelihood: 3 Total: 15
Despite high margin, adhesive are least predictable and most critical component
Mitigation Before:o Test adhesive on carbon fiber in small scale (completed)
o Test adhesive on larger masses similar to payload analog
o Purchase extra glue, extra VELCRO, and other fast adhesive methods
Response After:o Experiment with different bond lines and attempt to use more glue
o Remove component and continue testing
Post-mitigation Severity: 5 Likelihood: 2 Total: 10
50Project
OverviewDesign
OverviewCPEs &
Requirements Risks
Verification & Validation
Project Planning
Other risks detailed in back-up slides

Post-Mitigation Risk Matrix:Severity
Like
liho
od
8: Adhesive does not perform as expected
14-19: DAQ system components are not functional
2: Structure fails while transporting to vibration test
10: Vibration testing takes over 8 hours
1 2 3 4 5
5
4 1,12
3 5,7 8,14
2 4,9,16 2,10,17,19
1 3,13 15 6,11,18
1,7,12
16 4,17 8
9 5,6,13,1510,11,18,
192,14
51Project
OverviewDesign
OverviewCPEs &
Requirements Risks
Verification & Validation
Project Planning
Other risks detailed in back-up slides

VERIFICATION AND VALIDATION 52
Verification and Validation Overview:
ANSYS model will be verified by performing a vibration test on fabricated STM and collecting
accelerometer data Vibration Test Plan
Expected modes and frequencies in model generated by ANSYS
Designed DAQ system to collect acceleration data and create PSD plots
53Project
OverviewDesign
OverviewCPEs &
Requirements Risks
Verification & Validation
Project Planning
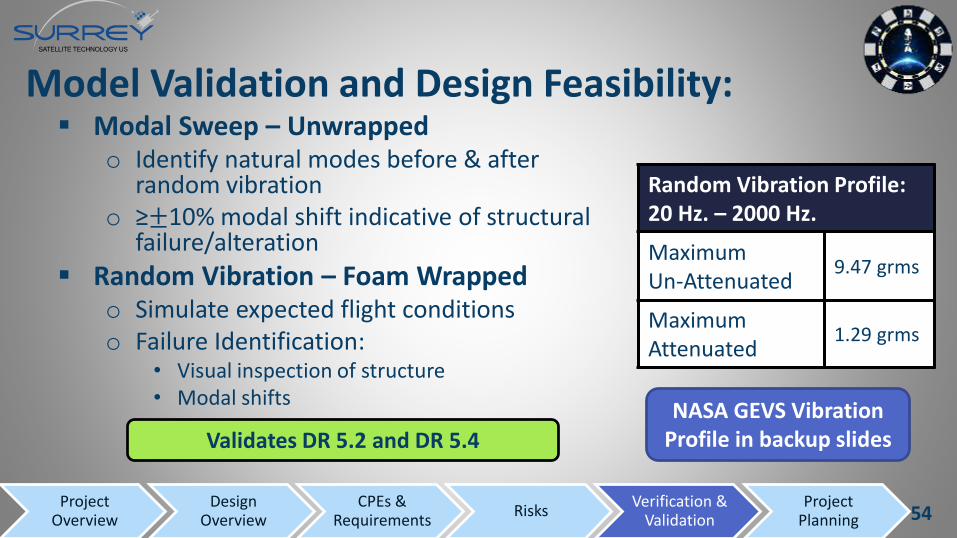
Model Validation and Design Feasibility: Modal Sweep – Unwrapped
o Identify natural modes before & after random vibration
o ≥±10% modal shift indicative of structural failure/alteration
Random Vibration – Foam Wrapped o Simulate expected flight conditions o Failure Identification:
• Visual inspection of structure• Modal shifts
Random Vibration Profile:20 Hz. – 2000 Hz.
Maximum Un-Attenuated
9.47 grms
Maximum Attenuated
1.29 grms
NASA GEVS Vibration Profile in backup slidesValidates DR 5.2 and DR 5.4
54Project
OverviewDesign
OverviewCPEs &
Requirements Risks
Verification & Validation
Project Planning
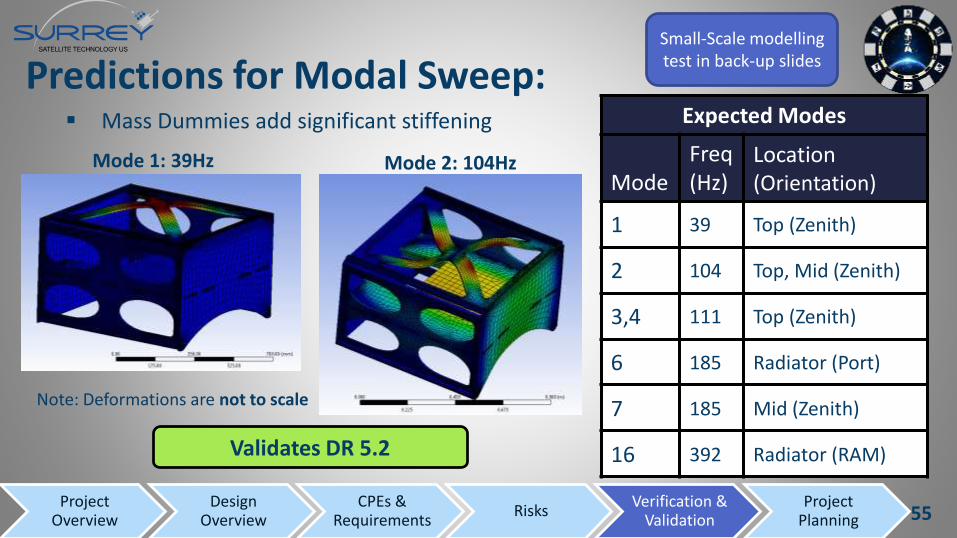
Predictions for Modal Sweep: Mass Dummies add significant stiffening
Mode 1: 39Hz Mode 2: 104Hz
Note: Deformations are not to scale
Expected Modes
ModeFreq(Hz)
Location (Orientation)
1 39 Top (Zenith)
2 104 Top, Mid (Zenith)
3,4 111 Top (Zenith)
6 185 Radiator (Port)
7 185 Mid (Zenith)
16 392 Radiator (RAM)
Small-Scale modelling test in back-up slides
Validates DR 5.2
55Project
OverviewDesign
OverviewCPEs &
Requirements Risks
Verification & Validation
Project Planning

DATA ACQUISITION OVERVIEW 56
DAQ Hardware FBD:
PC with Windows OS(not delivered)
DigitalAnalogPowerSoftware
KEY
5V
Micro-Controller
Board
Parallel Bit Data Bus
5V
5V
USB Drive with DAQ Software
AccelChannels
(At least 8 channels)
Data Acquisition Boards(8 Channels per Board)
Signal Conditioning (one per acc
channel)
S/H ADCs (one 8-input
ADC per 8 accchannels)
120VAC60 Hz(wall outlet)
Switch
Power Supply
24V
>4 kHz sampling
frequency
57Project
OverviewDesign
OverviewCPEs &
Requirements Risks
Verification & Validation
Project Planning
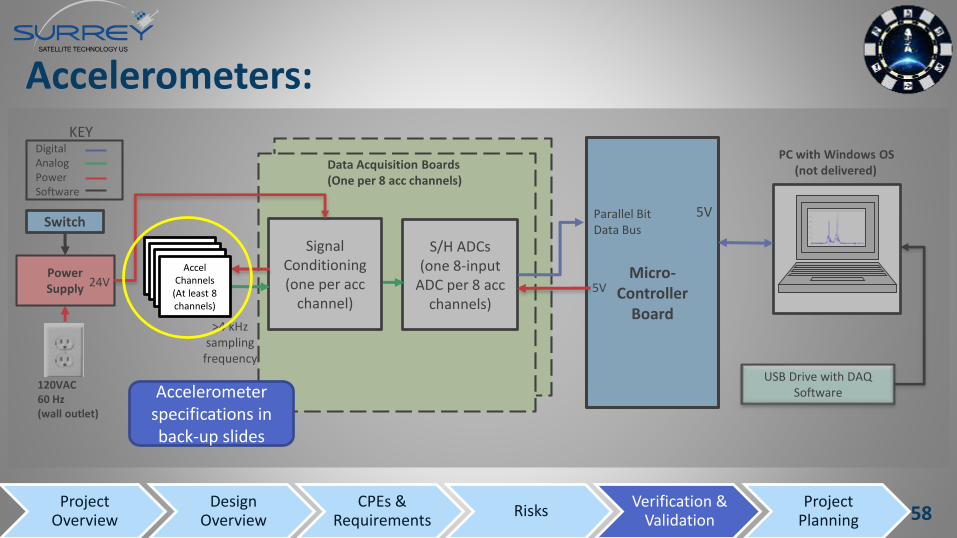
Accelerometers:
PC with Windows OS(not delivered)
DigitalAnalogPowerSoftware
KEY
5V
Micro-Controller
Board
Parallel Bit Data Bus
5V
5V
USB Drive with DAQ Software
Data Acquisition Boards(One per 8 acc channels)
Signal Conditioning (one per acc
channel)
S/H ADCs (one 8-input
ADC per 8 accchannels)
120VAC60 Hz(wall outlet)
Switch
Power Supply
24V
>4 kHz sampling
frequency
AccelChannels
(At least 8 channels)
58Project
OverviewDesign
OverviewCPEs &
Requirements Risks
Verification & Validation
Project Planning
Accelerometer specifications in back-up slides
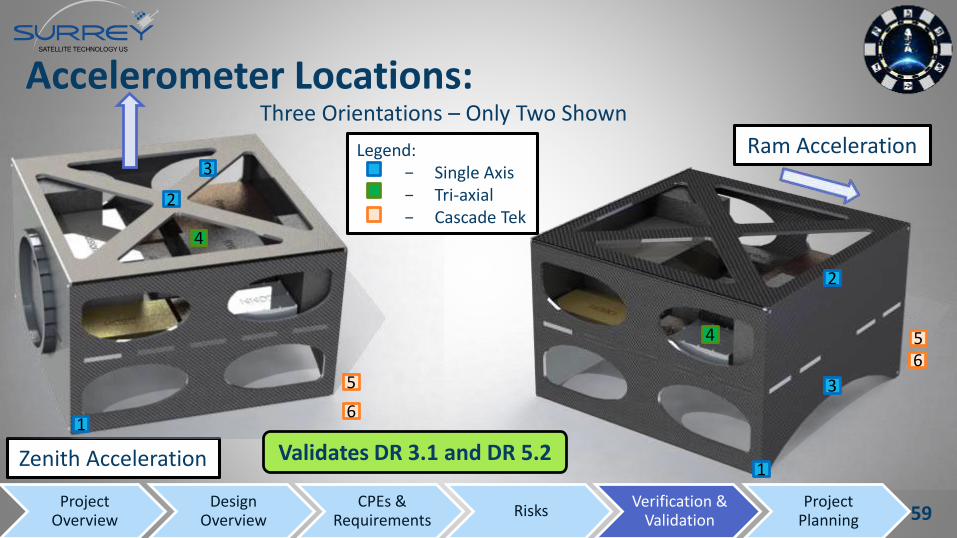
Accelerometer Locations:Three Orientations – Only Two Shown
Zenith Acceleration
1
3
2
4
5
6
2
3
1
4 56
Legend: − Single Axis− Tri-axial − Cascade Tek
Ram Acceleration
59Project
OverviewDesign
OverviewCPEs &
Requirements Risks
Verification & Validation
Project Planning
Validates DR 3.1 and DR 5.2
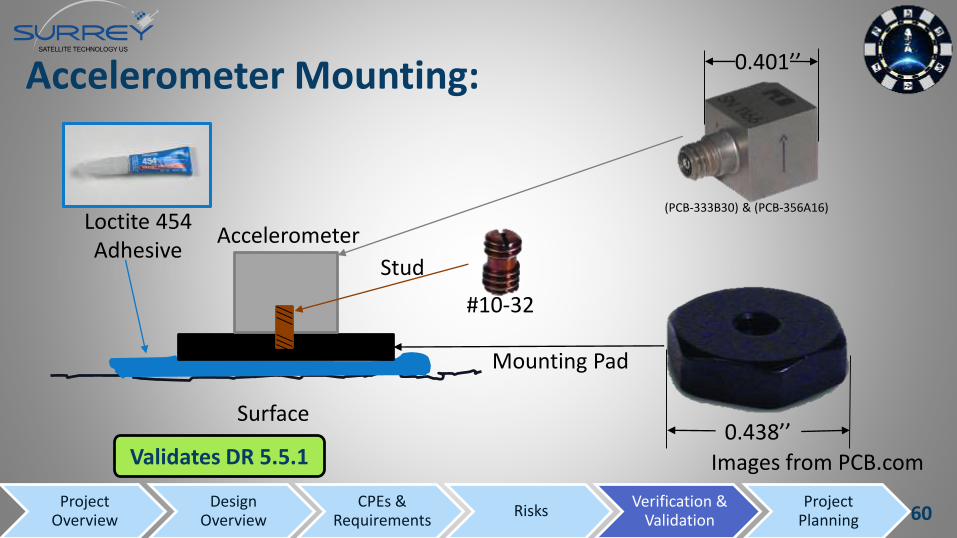
Stud
Accelerometer
Mounting Pad
Loctite 454 Adhesive
Surface0.438’’
(PCB-333B30) & (PCB-356A16)
#10-32
Accelerometer Mounting:
Images from PCB.comValidates DR 5.5.1
60Project
OverviewDesign
OverviewCPEs &
Requirements Risks
Verification & Validation
Project Planning
0.401’’
AccelChannels
(At least 8 channels)
Data Acquisition Board:
PC with Windows OS(not delivered)
DigitalAnalogPowerSoftware
KEY
5V
Micro-Controller
Board
Parallel Bit Data Bus
5V
5V
USB Drive with DAQ Software
120VAC60 Hz(wall outlet)
Switch
Power Supply
24V
>4 kHz sampling
frequency
Signal Conditioning (one per acc
channel)
S/H ADCs (one 8-input
ADC per 8 accchannels)
Data Acquisition Boards(8 Channels per Board)
61Project
OverviewDesign
OverviewCPEs &
Requirements Risks
Verification & Validation
Project Planning
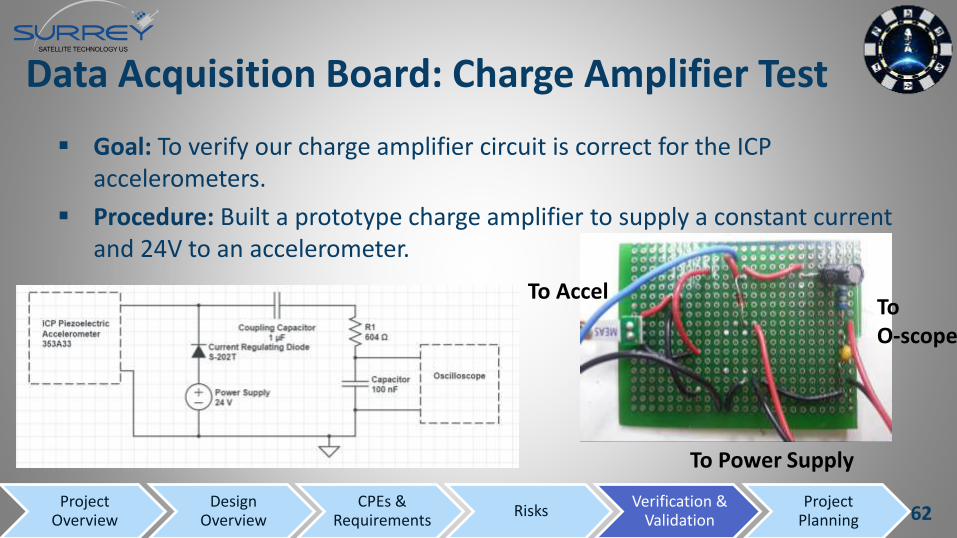
Data Acquisition Board: Charge Amplifier Test
Goal: To verify our charge amplifier circuit is correct for the ICP accelerometers.
Procedure: Built a prototype charge amplifier to supply a constant current and 24V to an accelerometer.
62
To Accel
To Power Supply
ToO-scope
Project Overview
Design Overview
CPEs & Requirements
RisksVerification &
ValidationProject
Planning
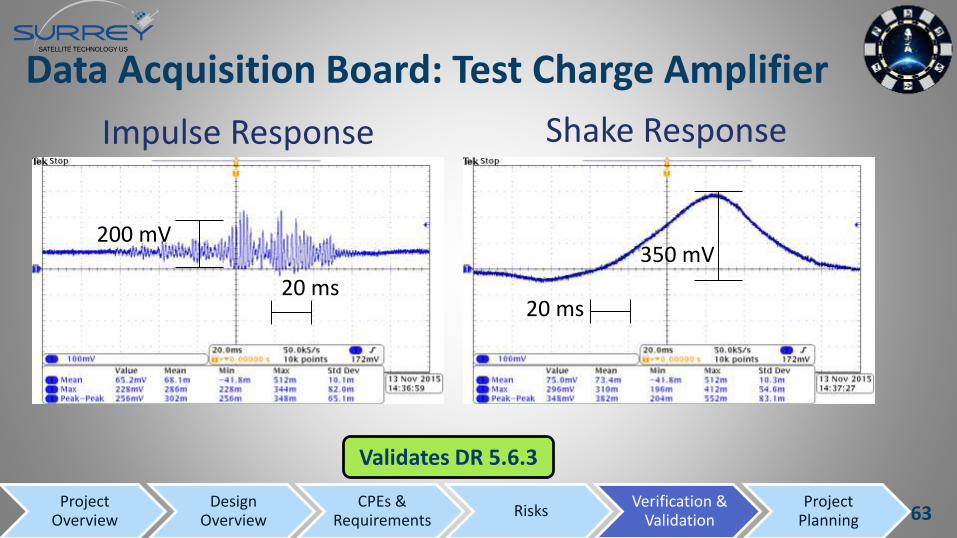
Data Acquisition Board: Test Charge Amplifier
Impulse Response Shake Response
200 mV350 mV
20 ms20 ms
Validates DR 5.6.3
63Project
OverviewDesign
OverviewCPEs &
Requirements Risks
Verification & Validation
Project Planning
Signal Conditioning (one per acc
channel)
S/H ADCs (one 8-input
ADC per 8 accchannels)
Data Acquisition Boards(8 Channels per Board)
AccelChannels
(At least 8 channels)
Microcontroller Board:
PC with Windows OS(not delivered)
DigitalAnalogPowerSoftware
KEY
USB Drive with DAQ Software
120VAC60 Hz(wall outlet)
Switch
Power Supply
24V
>4 kHz sampling
frequency
5V
Micro-Controller
Board
Parallel Bit Data Bus
5V
5V
64Project
OverviewDesign
OverviewCPEs &
Requirements Risks
Verification & Validation
Project Planning
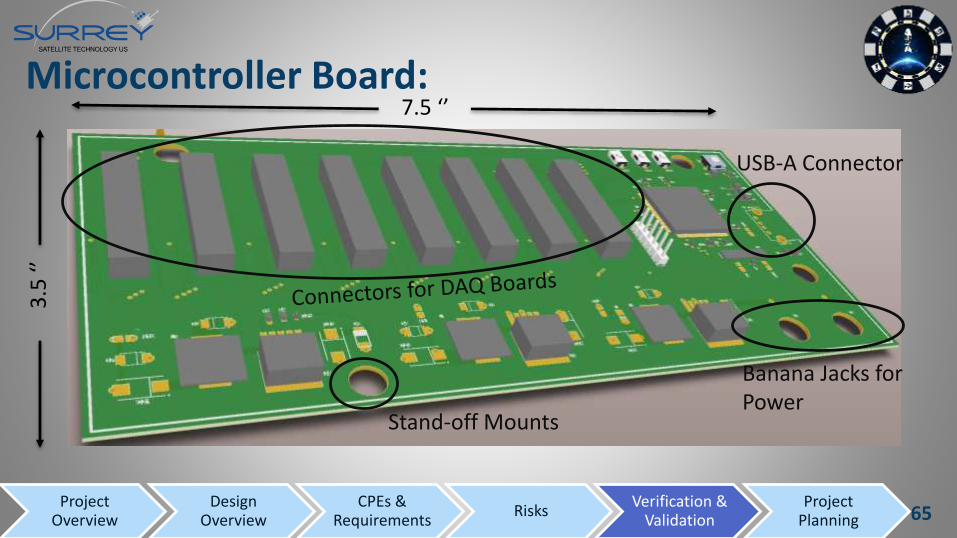
Microcontroller Board:
Stand-off Mounts
Banana Jacks for Power
USB-A Connector
3.5
‘’
7.5 ‘’
65Project
OverviewDesign
OverviewCPEs &
Requirements Risks
Verification & Validation
Project Planning
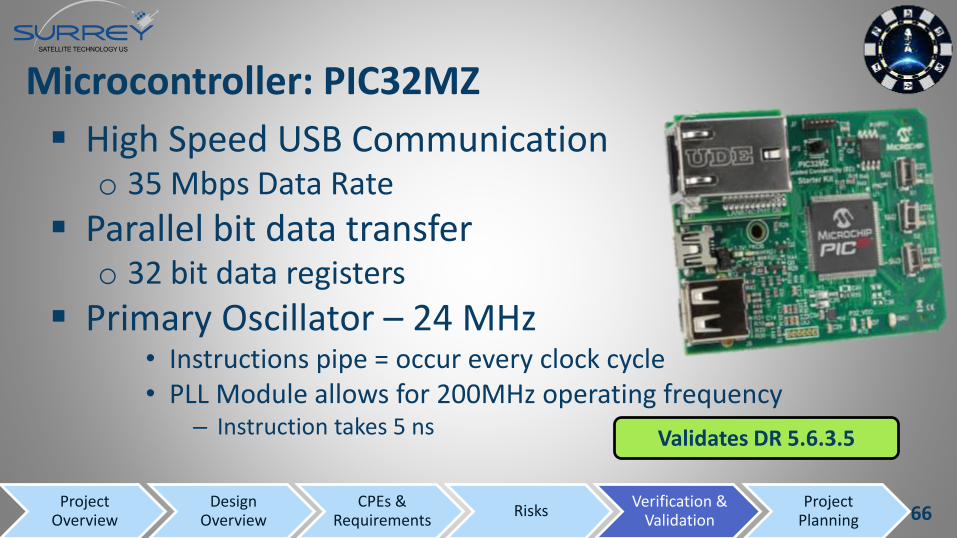
Microcontroller: PIC32MZ
High Speed USB Communicationo 35 Mbps Data Rate
Parallel bit data transfero 32 bit data registers
Primary Oscillator – 24 MHz• Instructions pipe = occur every clock cycle• PLL Module allows for 200MHz operating frequency
– Instruction takes 5 ns Validates DR 5.6.3.5
66Project
OverviewDesign
OverviewCPEs &
Requirements Risks
Verification & Validation
Project Planning
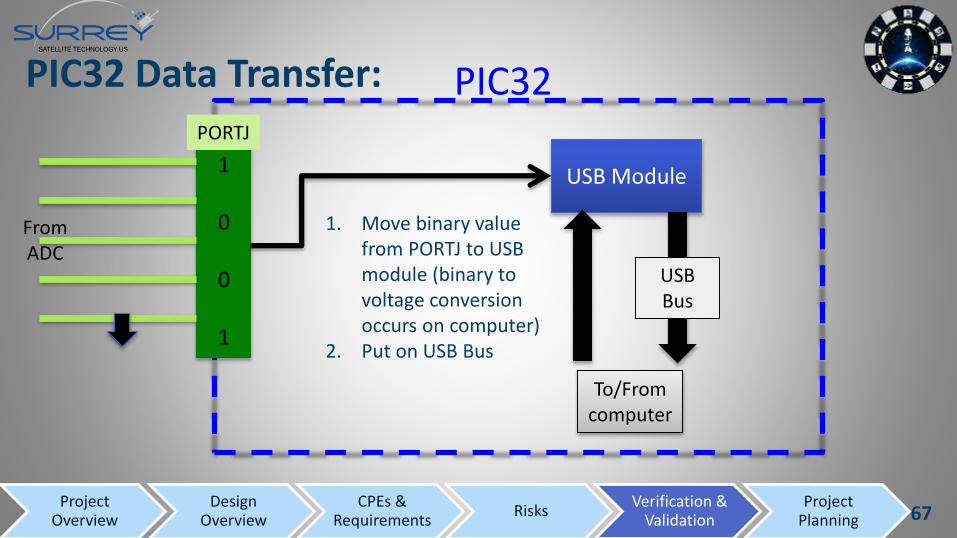
PIC32 Data Transfer:
1
0
0
1
PORTJ
USB Module
PIC32
USB Bus
To/From computer
From ADC
1. Move binary value from PORTJ to USB module (binary to voltage conversion occurs on computer)
2. Put on USB Bus
67Project
OverviewDesign
OverviewCPEs &
Requirements Risks
Verification & Validation
Project Planning
Signal Conditioning (one per acc
channel)
S/H ADCs (one 8-input
ADC per 8 accchannels)
Data Acquisition Boards(8 Channels per Board)
AccelChannels
(At least 8 channels)
Software:
DigitalAnalogPowerSoftware
KEY
5V
Micro-Controller
Board
Parallel Bit Data Bus
5V
5V
120VAC60 Hz(wall outlet)
Switch
Power Supply
24V
>4 kHz sampling
frequency
PC with Windows OS(not delivered)
USB Drive with DAQ Software
68Project
OverviewDesign
OverviewCPEs &
Requirements Risks
Verification & Validation
Project Planning
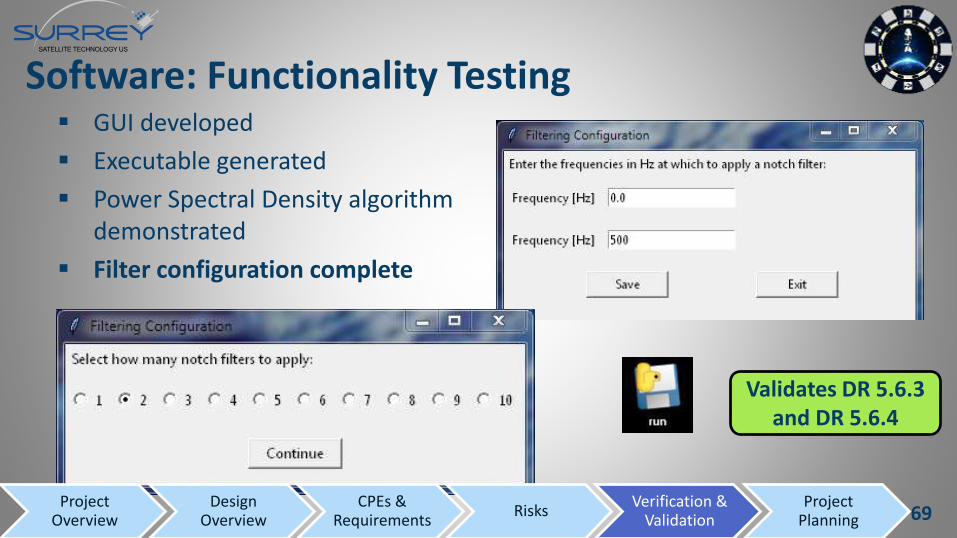
Software: Functionality Testing GUI developed
Executable generated
Power Spectral Density algorithm demonstrated
Filter configuration complete
Validates DR 5.6.3 and DR 5.6.4
69Project
OverviewDesign
OverviewCPEs &
Requirements Risks
Verification & Validation
Project Planning

PROJECT PLANNING 70
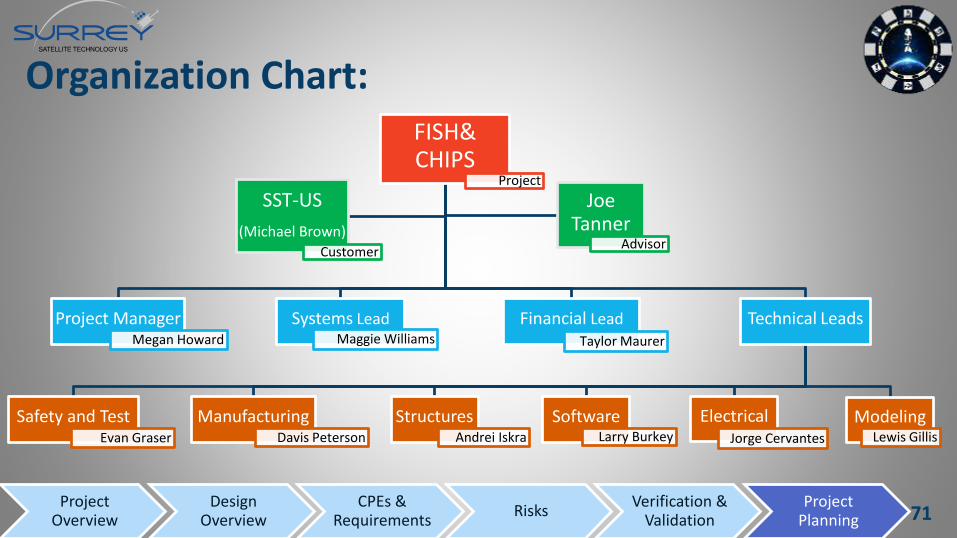
Organization Chart: FISH& CHIPS
Project
Project ManagerMegan Howard
Systems LeadMaggie Williams
Financial Lead Taylor Maurer
Technical Leads
Safety and TestEvan Graser
ManufacturingDavis Peterson
StructuresAndrei Iskra
SoftwareLarry Burkey
Electrical Jorge Cervantes
ModelingLewis Gillis
SST-US
(Michael Brown)Customer
Joe Tanner
Advisor
71Project
OverviewDesign
OverviewCPEs &
Requirements Risks
Verification & Validation
Project Planning
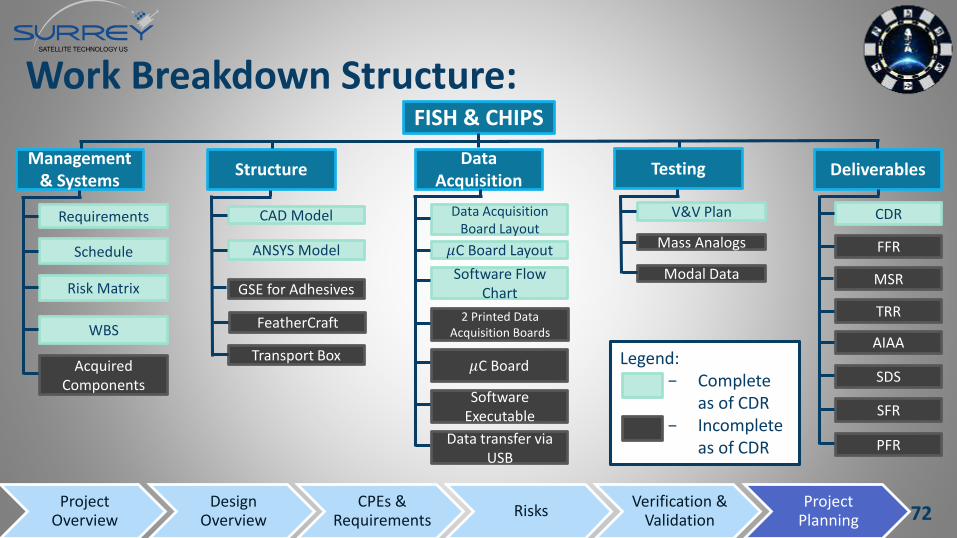
Work Breakdown Structure:FISH & CHIPS
Management& Systems
DeliverablesTestingData
AcquisitionStructure
Requirements
Schedule
Risk Matrix
WBS
Acquired Components
FeatherCraft
ANSYS Model
CAD Model
GSE for Adhesives
Transport Box
Software Flow Chart
𝜇C Board Layout
Data Acquisition Board Layout
𝜇C Board
2 Printed Data Acquisition Boards
Software Executable
CDR
FFR
V&V Plan
Mass Analogs
Modal Data MSR
TRR
AIAA
SDS
SFR
PFR
Legend: − Complete
as of CDR− Incomplete
as of CDRData transfer via
USB
72Project
OverviewDesign
OverviewCPEs &
Requirements Risks
Verification & Validation
Project Planning
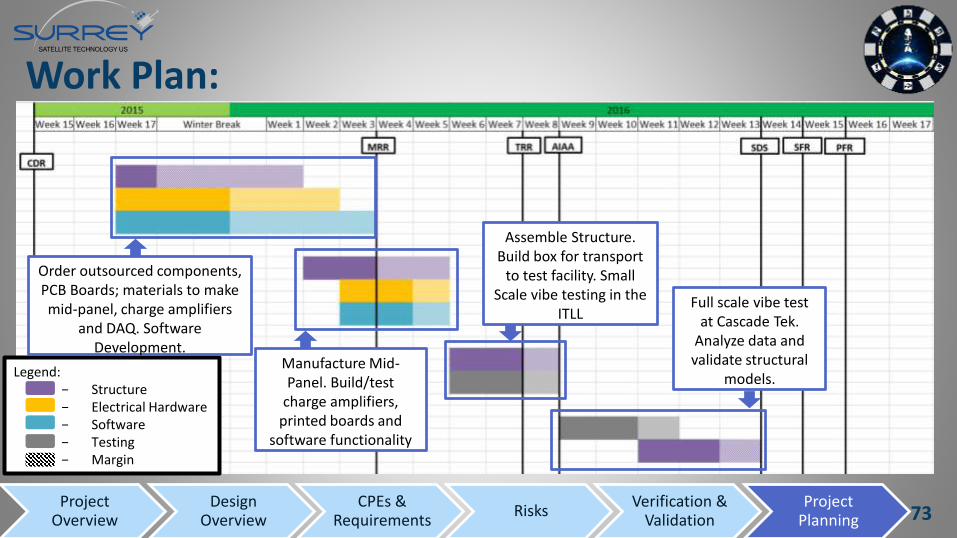
Work Plan:
Legend: − Structure− Electrical Hardware− Software− Testing − Margin
Order outsourced components, PCB Boards; materials to make mid-panel, charge amplifiers
and DAQ. Software Development.
Manufacture Mid-Panel. Build/test
charge amplifiers, printed boards and
software functionality
Assemble Structure. Build box for transport
to test facility. Small Scale vibe testing in the
ITLL Full scale vibe test
at Cascade Tek. Analyze data and validate structural
models.
73Project
OverviewDesign
OverviewCPEs &
Requirements Risks
Verification & Validation
Project Planning
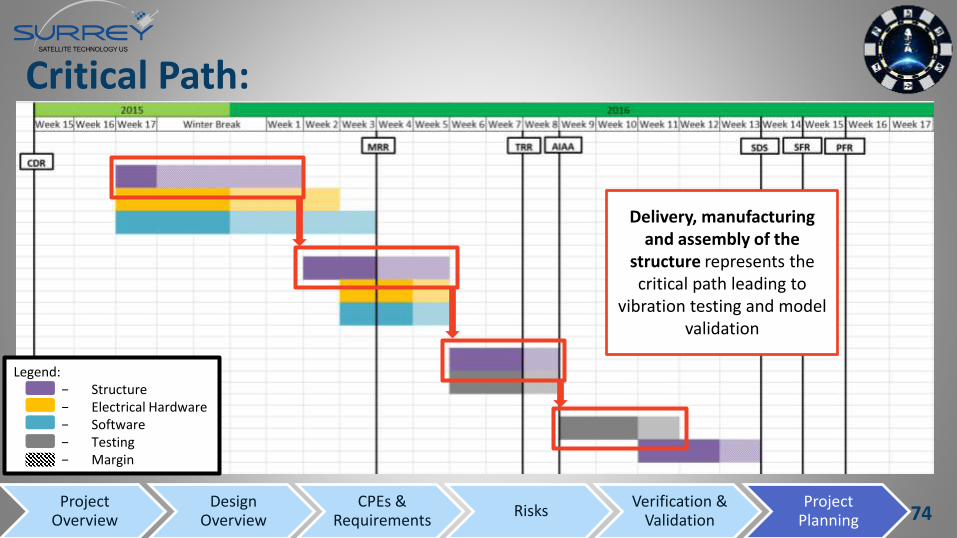
Critical Path:
Legend: − Structure− Electrical Hardware− Software− Testing − Margin
Delivery, manufacturing and assembly of the
structure represents the critical path leading to
vibration testing and model validation
74Project
OverviewDesign
OverviewCPEs &
Requirements Risks
Verification & Validation
Project Planning
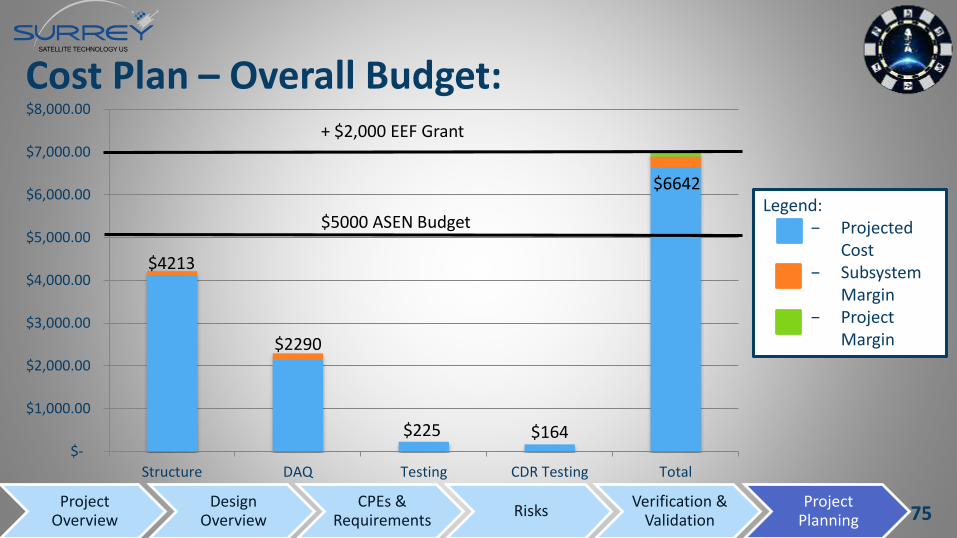
Cost Plan – Overall Budget:
$-
$1,000.00
$2,000.00
$3,000.00
$4,000.00
$5,000.00
$6,000.00
$7,000.00
$8,000.00
Structure DAQ Testing CDR Testing Total
+ $2,000 EEF Grant
$5000 ASEN BudgetLegend:
− Projected Cost
− Subsystem Margin
− Project Margin
$4213
$6642
$164$225
$2290
75Project
OverviewDesign
OverviewCPEs &
Requirements Risks
Verification & Validation
Project Planning
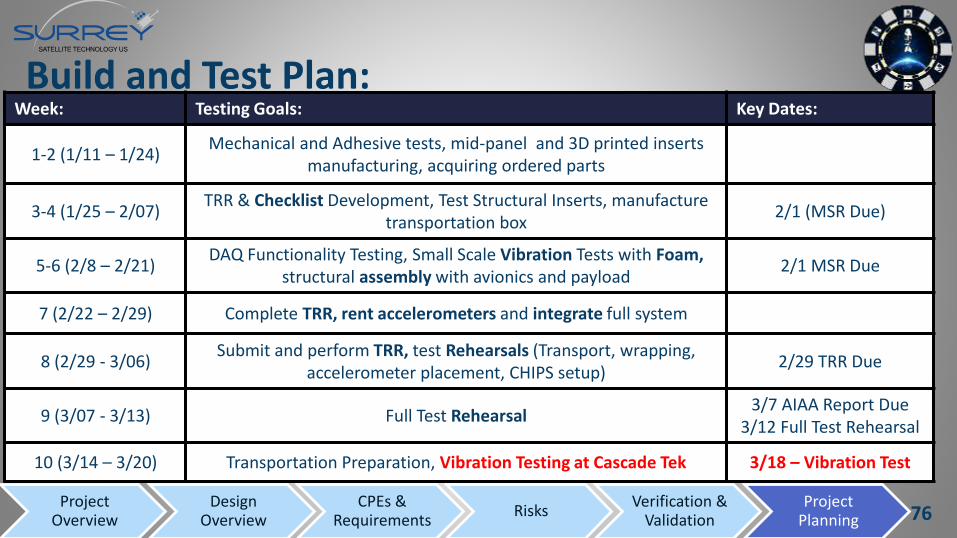
Build and Test Plan:Week: Testing Goals: Key Dates:
1-2 (1/11 – 1/24)Mechanical and Adhesive tests, mid-panel and 3D printed inserts
manufacturing, acquiring ordered parts
3-4 (1/25 – 2/07)TRR & Checklist Development, Test Structural Inserts, manufacture
transportation box2/1 (MSR Due)
5-6 (2/8 – 2/21)DAQ Functionality Testing, Small Scale Vibration Tests with Foam,
structural assembly with avionics and payload2/1 MSR Due
7 (2/22 – 2/29) Complete TRR, rent accelerometers and integrate full system
8 (2/29 - 3/06)Submit and perform TRR, test Rehearsals (Transport, wrapping,
accelerometer placement, CHIPS setup) 2/29 TRR Due
9 (3/07 - 3/13) Full Test Rehearsal3/7 AIAA Report Due
3/12 Full Test Rehearsal
10 (3/14 – 3/20) Transportation Preparation, Vibration Testing at Cascade Tek 3/18 – Vibration Test
76Project
OverviewDesign
OverviewCPEs &
Requirements Risks
Verification & Validation
Project Planning

Acknowledgements:
77
References:[1] Materion Coroporation. AlBeMet Property Datasheet. Elmore, OH: Beryllium & Composites, n.d. Print.[2] Sandwich Panel Fabrication Technology. N.p.: Hexcel Composites, 2001. Print.[3] Honeycomb Sandwich Design Technology. N.p.: Hexcel Composites, 2000. Print.[4] Roark, Raymond J., and Warren C. Young. Formulas for Stress and Strain. New York: McGraw-Hill, 1975. Print.[5] Microchip. PIC32MZ Embedded Connectivity with Floating Point Unit (EF) Family. Phoenix AZ: Microchip, n.d. PDF.[6] PCB Piezotronics. Aerospace Ground Test. Depew, NY: PCB Piezotronics, n.d. PDF.[7] ST Microelectronics. MEMS digital output motion sensor ultra low-power high performance 3-axes “nano” accelerometer. n.p.: ST Microelectronics, 2010. PDF.[8] PCB Piezotronics. Quote: SGL11887. Depew, NY: PCB Piezotronics, 2015. PDF.[9] “ Alloy A286” Delta Fastner Corp. Web. 27 Sept. 2015.. <http://www.deltafastener.com/a286.html>[10]“The Use of Silicone Adhesives in Space Applications” Adhesives and Sealant Industry. Web. 27 Sept 2015. <http://www.adhesivesag.com/articles/85082-the-use-of-silicone-adhesives-in-space-applications>[11] “Kaber Small Satellite Deployment System” NanoRacks. Web. 26 Sept 2015. http://nanoracks.com/wp-content/uploads/Kaber-Small-Satellite-Deployment-System-Presentation.pdf[12] “Sandwich Panels”. ACP Composites. Web. 22 Sept 2015. < http://www.acpsales.com/Carbon-Fiber-Sandwich-Panels.html>[13] “Spacecraft Thermal Control – Chapter 6” 2011. Print.[14] “Salary of Aerospace Technicians”. Glass Door. Wed. 15 Nov 2015 https://www.glassdoor.com/Salaries/aerospace-technician-salary-SRCH_KO0,20.htm
78

QUESTIONS? 79
Presentation Appendix:
80
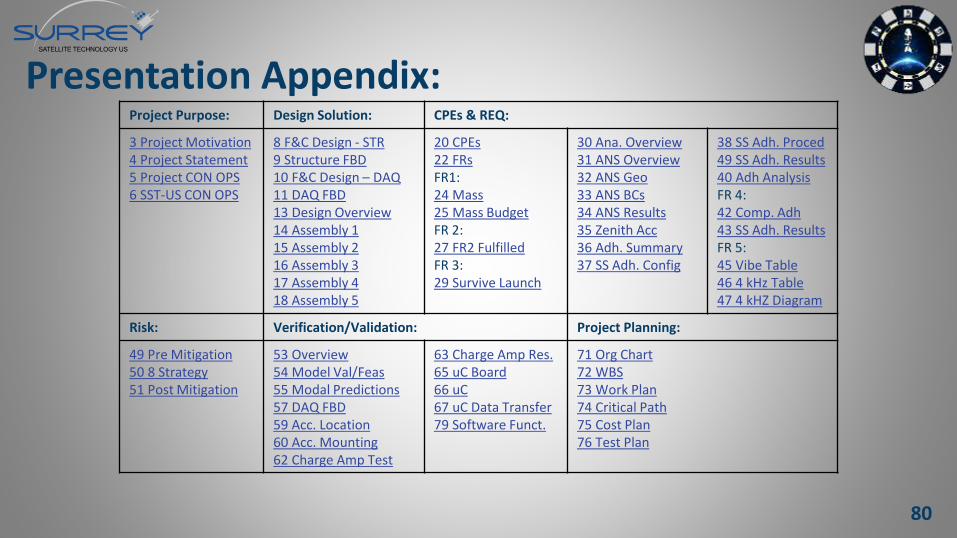
Project Purpose: Design Solution: CPEs & REQ:
3 Project Motivation4 Project Statement5 Project CON OPS6 SST-US CON OPS
8 F&C Design - STR9 Structure FBD10 F&C Design – DAQ11 DAQ FBD13 Design Overview14 Assembly 115 Assembly 216 Assembly 317 Assembly 4 18 Assembly 5
20 CPEs22 FRsFR1:24 Mass25 Mass BudgetFR 2: 27 FR2 FulfilledFR 3: 29 Survive Launch
30 Ana. Overview31 ANS Overview32 ANS Geo33 ANS BCs34 ANS Results 35 Zenith Acc36 Adh. Summary37 SS Adh. Config
38 SS Adh. Proced49 SS Adh. Results 40 Adh Analysis FR 4: 42 Comp. Adh43 SS Adh. ResultsFR 5: 45 Vibe Table 46 4 kHz Table47 4 kHZ Diagram
Risk: Verification/Validation: Project Planning:
49 Pre Mitigation50 8 Strategy51 Post Mitigation
53 Overview54 Model Val/Feas55 Modal Predictions57 DAQ FBD59 Acc. Location 60 Acc. Mounting 62 Charge Amp Test
63 Charge Amp Res.65 uC Board66 uC67 uC Data Transfer79 Software Funct.
71 Org Chart72 WBS73 Work Plan74 Critical Path75 Cost Plan 76 Test Plan
Back-Up Slides Appendix:
81
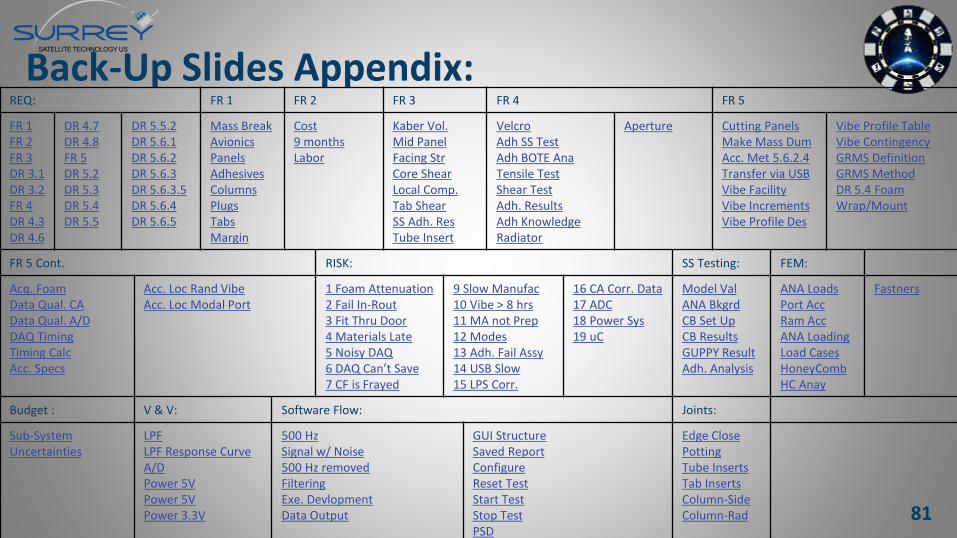
REQ: FR 1 FR 2 FR 3 FR 4 FR 5
FR 1FR 2FR 3DR 3.1DR 3.2 FR 4DR 4.3DR 4.6
DR 4.7DR 4.8 FR 5DR 5.2DR 5.3 DR 5.4 DR 5.5
DR 5.5.2DR 5.6.1DR 5.6.2DR 5.6.3DR 5.6.3.5DR 5.6.4DR 5.6.5
Mass BreakAvionicsPanelsAdhesivesColumnsPlugsTabsMargin
Cost9 monthsLabor
Kaber Vol. Mid Panel Facing StrCore ShearLocal Comp.Tab ShearSS Adh. ResTube Insert
VelcroAdh SS TestAdh BOTE AnaTensile TestShear TestAdh. Results Adh KnowledgeRadiator
Aperture Cutting PanelsMake Mass DumAcc. Met 5.6.2.4Transfer via USBVibe Facility Vibe IncrementsVibe Profile Des
Vibe Profile TableVibe ContingencyGRMS DefinitionGRMS MethodDR 5.4 Foam Wrap/Mount
FR 5 Cont. RISK: SS Testing: FEM:
Acq. Foam Data Qual. CAData Qual. A/DDAQ Timing Timing CalcAcc. Specs
Acc. Loc Rand VibeAcc. Loc Modal Port
1 Foam Attenuation2 Fail In-Rout 3 Fit Thru Door 4 Materials Late5 Noisy DAQ6 DAQ Can’t Save7 CF is Frayed
9 Slow Manufac10 Vibe > 8 hrs11 MA not Prep12 Modes 13 Adh. Fail Assy14 USB Slow15 LPS Corr.
16 CA Corr. Data17 ADC 18 Power Sys19 uC
Model ValANA BkgrdCB Set UpCB Results GUPPY ResultAdh. Analysis
ANA LoadsPort AccRam AccANA LoadingLoad CasesHoneyCombHC Anay
Fastners
Budget : V & V: Software Flow: Joints:
Sub-SystemUncertainties
LPFLPF Response CurveA/D Power 5VPower 5VPower 3.3V
500 HzSignal w/ Noise500 Hz removed FilteringExe. DevlopmentData Output
GUI StructureSaved ReportConfigureReset TestStart Test Stop TestPSD
Edge ClosePottingTube InsertsTab InsertsColumn-SideColumn-Rad

BACK-UP SLIDES82
FR 1 Breakdown
FR 1: The FeatherCraft structure design shall be less than 5 kg.Source: Customer requirement. Increasing the structural mass beyond 5 kg would prevent SST-US from integrating with a profitable weight class of payloads.Verification: Analysis, modeling, and comparison with demonstration of STM.
83
FR 2 Breakdown
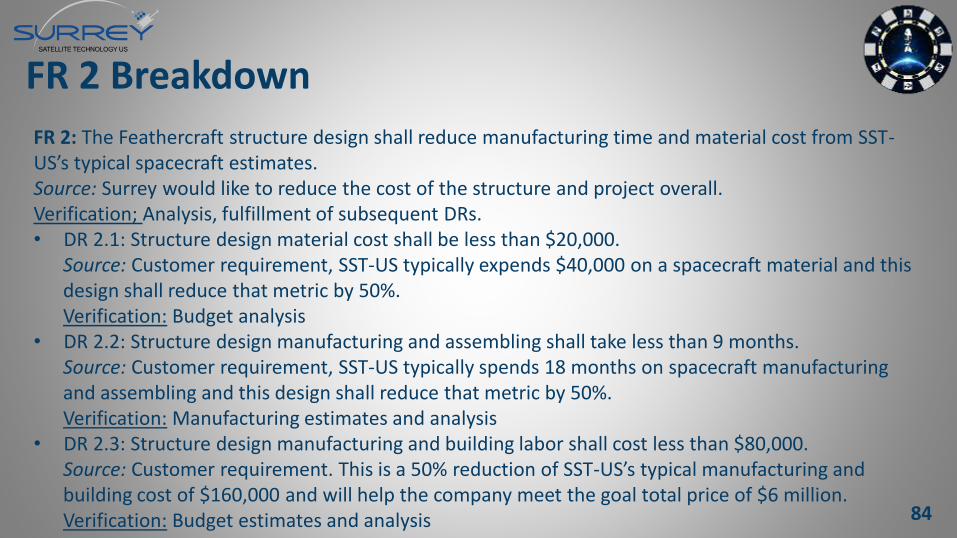
FR 2: The Feathercraft structure design shall reduce manufacturing time and material cost from SST-US’s typical spacecraft estimates.Source: Surrey would like to reduce the cost of the structure and project overall.Verification; Analysis, fulfillment of subsequent DRs.• DR 2.1: Structure design material cost shall be less than $20,000.
Source: Customer requirement, SST-US typically expends $40,000 on a spacecraft material and this design shall reduce that metric by 50%.Verification: Budget analysis
• DR 2.2: Structure design manufacturing and assembling shall take less than 9 months.Source: Customer requirement, SST-US typically spends 18 months on spacecraft manufacturing and assembling and this design shall reduce that metric by 50%.Verification: Manufacturing estimates and analysis
• DR 2.3: Structure design manufacturing and building labor shall cost less than $80,000.Source: Customer requirement. This is a 50% reduction of SST-US’s typical manufacturing and building cost of $160,000 and will help the company meet the goal total price of $6 million.Verification: Budget estimates and analysis 84
FR 3 Breakdown
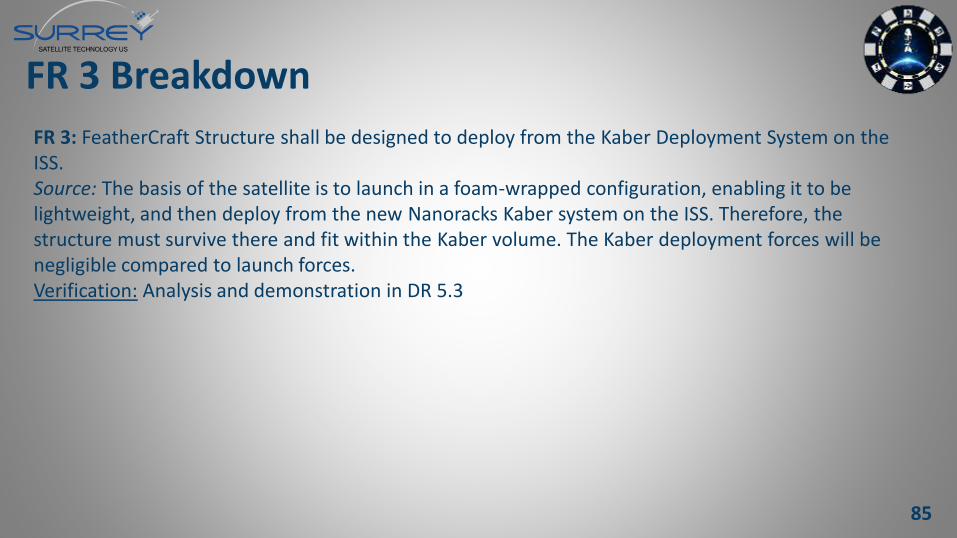
FR 3: FeatherCraft Structure shall be designed to deploy from the Kaber Deployment System on the ISS.Source: The basis of the satellite is to launch in a foam-wrapped configuration, enabling it to be lightweight, and then deploy from the new Nanoracks Kaber system on the ISS. Therefore, the structure must survive there and fit within the Kaber volume. The Kaber deployment forces will be negligible compared to launch forces.Verification: Analysis and demonstration in DR 5.3
85
FR 3 Breakdown
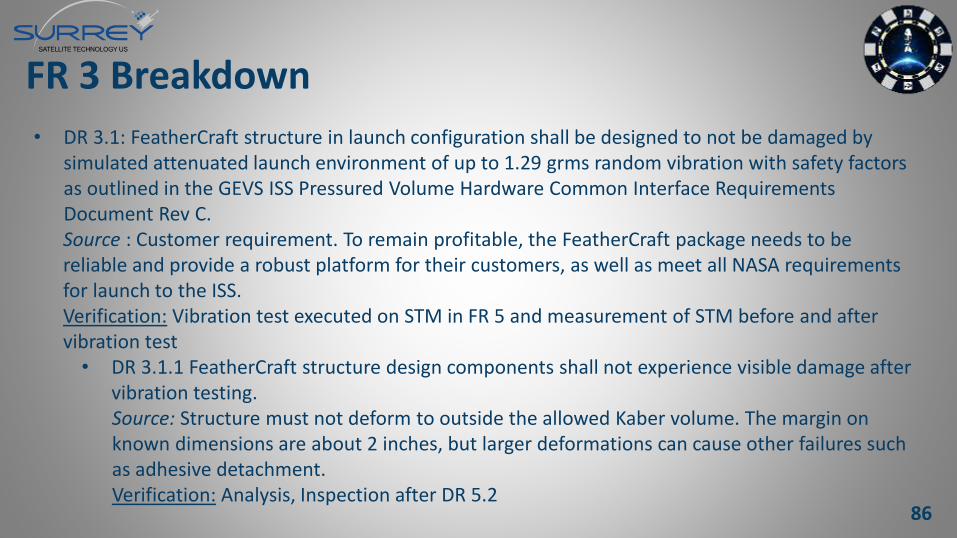
• DR 3.1: FeatherCraft structure in launch configuration shall be designed to not be damaged by simulated attenuated launch environment of up to 1.29 grms random vibration with safety factors as outlined in the GEVS ISS Pressured Volume Hardware Common Interface Requirements Document Rev C.Source : Customer requirement. To remain profitable, the FeatherCraft package needs to be reliable and provide a robust platform for their customers, as well as meet all NASA requirements for launch to the ISS.Verification: Vibration test executed on STM in FR 5 and measurement of STM before and after vibration test• DR 3.1.1 FeatherCraft structure design components shall not experience visible damage after
vibration testing.Source: Structure must not deform to outside the allowed Kaber volume. The margin on known dimensions are about 2 inches, but larger deformations can cause other failures such as adhesive detachment.Verification: Analysis, Inspection after DR 5.2
86
FR 3 Breakdown
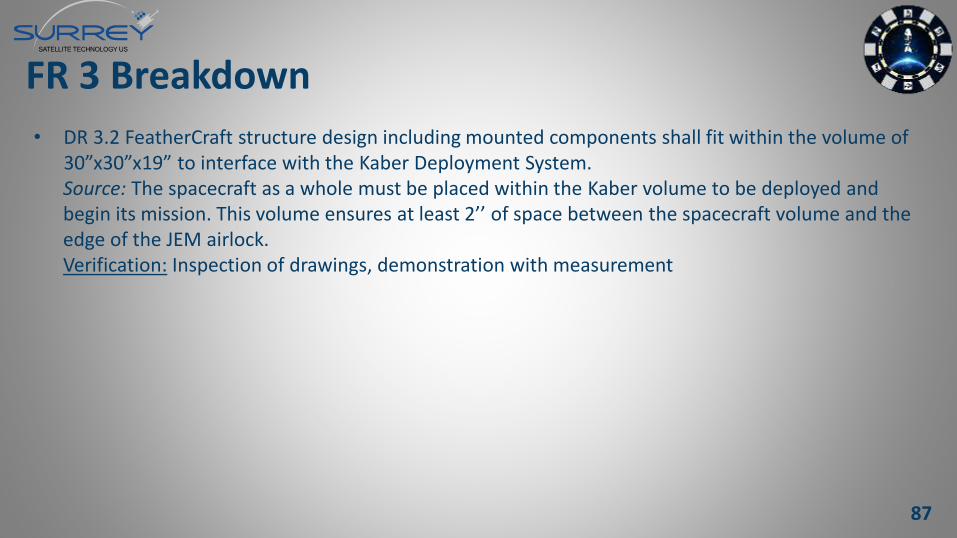
• DR 3.2 FeatherCraft structure design including mounted components shall fit within the volume of 30”x30”x19” to interface with the Kaber Deployment System.Source: The spacecraft as a whole must be placed within the Kaber volume to be deployed and begin its mission. This volume ensures at least 2’’ of space between the spacecraft volume and the edge of the JEM airlock. Verification: Inspection of drawings, demonstration with measurement
87
FR 4 Breakdown
FR 4: FeatherCraft structure design shall interface with SST-US-provided spacecraft components and mission design.Source: Because the structure is the base of the satellite, it must be able to support already-existing SST-US components.Verification: Demonstration of DR 4.1-4.7 and DR 5.3.• DR 4.1: FeatherCraft structure design shall provide mounting position on Side 3 for one
30’’x30’’x0.125’’ solar panel of mass 2 kg.Source: Customer requirement, this side is the largest covered side and as such needs to mount a solar array panel.Verification: STM demonstration in FR 5, modelling and analysis
• DR 4.2: FeatherCraft structure design shall provide mounting positions on Side 2 and Side 4 for two 30’’x18.976’’x0.125’’ solar panels of mass 2 kg each. Source: Customer requirement, this side is the largest covered side and as such needs to mount a solar array panel.Verification: STM demonstration in FR 5, modelling and analysis
88
FR 4 Breakdown• DR 4.3: FeatherCraft structure design shall provide a mounting position for a
29.094’’x18.976’’x0.125’’ propulsion plate of mass 2 kg on Side 1.Source: Customer requirement. The propulsion plate design has been finalized, and its dimensions necessitate its mounting location.Verification: modeling and inspection of drawings, STM demonstration in FR 5
• DR 4.4: FeatherCraft structure design shall provide a space for a 12x12x10 in propulsion subsystem of mass 10 kg on the internal side of Side 1.Source: Customer requirement. The propulsion subsystem must be attached to the propulsion plate and the space it takes in the bisecting plate must be accounted for.Verification: modeling and inspection of drawings, STM demonstration in FR 5
• DR 4.5 FeatherCraft structure design shall have an internal structural component equally bisecting the 19’’ height dimension to provide mounting capabilities to the avionics components and payload components.Source: Customer requirement. The mounting capabilities are necessary for the customer to assemble the spacecraft easily and safely. This bisecting structural component defines a payload bay and avionics bay so that a payload volume is defined for potential customers.Verification: Inspection of drawings, Test (measure STM) 89
FR 4 Breakdown• DR 4.6 FeatherCraft structure design shall provide mounting capabilities on bisecting sheet for the
avionics components and payload components.Source: Customer requirement. The mounting capabilities are necessary for the customer to assemble the spacecraft easily and safely. This bisecting structural component defines a payload bay and avionics bay so that a payload volume is defined for potential customers.Verification: Inspection of drawings, Test with STM• DR 4.6.1: FeatherCraft structure design shall provide mounting capabilities for a mass of 32
kg of aluminum.Source: Customer component as part of DR 4.5, simulating avionicsVerification: Inspection of drawings, test with STM
• DR 4.6.2: FeatherCraft structure design shall provide mounting capabilities for a mass of 45 kg of aluminum.Source: Customer component as part of DR 4.5, simulating payloadVerification: Inspection of drawings, test with STM
90
FR 4 Breakdown• DR 4.7 FeatherCraft structure design shall dissipate up to 100 W of heat generated equally by
avionics and payload bays at an internal operating temperature of -20 to 50 degrees C.Source: Customer requirement. The maximum power output is estimated by the customer to remain below 100W. The specifics of this analysis are presented in Section 4.1.4.Verification: Analysis• DR 4.7.1: FeatherCraft structure design shall have a radiative material on Side 6.
Source: Customer requirement, derived from DR 4.6. This solution is used to satisfy DR 4.6 for simplicity. Verification: Inspection of model
91
FR 4 Breakdown• DR 4.8 FeatherCraft structure design shall have an open aperture of at least 12’’x12’’ on Side 5.
Source: Customer requirement, payload use and space for antenna(s) facing nadir.Verification: modeling, inspection in STM
• DR 4.9 FeatherCraft structure design shall remain operational for five years in a space environment.Source: Customer requirement, the spacecraft bus will be advertised as a five-year mission.Verification: Analysis of structure material and assembly method for similarity to previous missions’ material heritage.
92
FR 5 BreakdownFR 5: A manufactured STM of the FeatherCraft structure design shall be used to validate the design through a modal vibration sweep and a random vibration test to the requirements of SSP 50835.Source: SSP 50835 dictates the stress that a structure should expect to experience during launch. Performing a test under these expected vibration conditions validates FR 3.Verification: Demonstration of subsequent DRs.• DR 5.1: STM shall be manufactured with sufficient similarity to the structural design such that it can
be used for validation of the designed structure. Source: Customer requirement. A physical test must be performed to provide a baseline of feasibility; this can only be proved if the STM is similar to the design. However, the materials of the STM are constrained to the FeatherCraft team budget.Verification: Analysis of materials• DR 5.1.1: STM shall be manufactured to all specifications in FR 4 and FR 2.
Source: STM must mount mass analogs of all spacecraft components specified in FR4, and the STM may not exceed the parameters specified in FR 2 due to course budget and time restraints.Verification: Testing, inspection of mounting positions, cost, and time
93
FR 5 Breakdown• DR 5.2: STM shall be tested on a vibration table for a vibration profile of 20-2000 Hz and up to an
experienced vibration of 1.29 grms with each test lasting 60 seconds.Source: GEVS table 3.1.1.2.1.2.3.2-1 (Page 3-17 of ISS Pressured Volume Hardware Common Interface Requirements Document Rev C.) It is estimated by this document that with a vibration table setting of 9.47 grms, the foam-wrapped structure should experience 1.29 grms. This will simulate launch load conditions and prove feasibility of FR 3.Verification: Inspection of test plan, test• DR 5.2.1: STM shall undergo a modal sweep preceding and after every random vibration test to
identify loads.Source: A change in mode of over 10% after random vibration is an indication of structure change and subsequent instability.Verification: Demonstration
94
FR 5 Breakdown• DR 5.3 STM shall support loads through vibration testing that are equivalent to the required loading of the designed structure.
Source: Validation of FR 3 and FR 4Verification: Demonstration• DR 5.3.1 STM shall support the mass analog aluminum propulsion plate of mass and size specified in DR 4.3 mounted to Side 1.Source: Validation of DR 4.3 and FR 5.Verification: Inspection, mass measurement• DR 5.3.2 STM shall support the solar panel mass analog aluminum plates mounted on sides as specified in DR 4.1 -4.2.
Source: Validation of DR 4.1, DR 4.2 and FR 5.Verification: Inspection, mass measurement
• DR 5.3.3 STM shall have an internal load simulating the avionics subsystem mass as described in DR 4.5.1.Source: Validation of DR 4.5 and FR 5. The shape of these components can be split between components of created as one large mass; the only requirement is that it must incorporate all the required masses.Verification: Inspection, mass measurement
• DR 5.3.4 STM shall have an internal load simulating the payload as specified in DR 4.5.2.Source: Validation of DR 4.5 and FR 5. This is the SST-US provided estimate it will allow for payload mass.Verification: Inspection, mass measurement
• DR 5.3.5 STM shall have a mass analog of the propulsion box as specified in DR 4.4 bolted to the propulsion plate.Source: Validation of DR 4.4 and FR 5. While this component is not adhered by the team, for testing purposes the mass analogs must be created and bolted to the mass analog of the propulsion plate.Verification: Inspection, mass measurement
95
FR 5 Breakdown• DR 5.4: STM shall be wrapped in 0.5-2’’ thick Pyrell foam prior to vibration testing.
Source: Customer Requirement stemming from ISS Pressured Volume Hardware Common Interface Requirements Document Rev C. The test shall be performed with the STM in the flight configuration.Verification: Demonstration, inspection
96
FR 5 Breakdown• DR 5.5 FEM model shall be verified with structural accelerometer information.
Source: Provides evidence for completion of FR 5 and allows data collection for later correlation to designed structure. The number of accelerometers necessary and their positions is determined by the modes exhibited in the FEM model.Verification: Analysis of FEM model, inspection of drawings of vibration test configuration, creation of DR 5.6.• DR 5.5.1: STM shall have at least 4 accelerometers mounted on it during a vibration test, with accelerometers moved and data
collected at each FEM position specified in the Vibration Test Plan.Source: The FEM model shows possible fluctuations at certain points in the structure specified in the Vibration test plan, and fouraccelerometers will allow verification of DR5.6.1 as well as speed up the process of verifying the FEM model.Verification: Inspection• DR 5.5.1.1: Accelerometers shall be able to attach and reattach to STM.
Source: Because the budget may not allow for the number of accelerometers necessary to validate the model, available accelerometers must be moved.Verification: Demonstration
• DR 5.5.1.2: One tri-axial accelerometer shall be attached to the mid-panel.Source: Customer requirement, the acceleration that the components experience during launch is critical to the spacecraft design.Verification: Inspection
• DR 5.5.1.3: One accelerometer shall be attached to a solar panel adhered with VELCRO.Source: Customer requirement, the VELCRO adhesion is difficult to model and the acceleration measurement of this panel is desired.Verification: Inspection
97
FR 5 Breakdown• DR 5.5.2: Accelerometer data shall be saved in the form of power spectral density plots.
Source: Customer requirement, DR 5.5Verification: Demonstration of DR 5.6.4• DR 5.5.2.1: Software must create final power spectral density plots at the end of each test.
Source: FEM comparison will not take place in realtime, but will occur after each test and after all tests are complete. This method will be used to compare ANSYS plots and test data.Verification: Inspection
• DR 5.6 A data acquisition and analysis system shall be designed and created for testing of STM to validate structural properties.Source: Customer requirement, it will save the project money to own a data acquisition system, and this can be used for custom data collection and future tests.Verification: Demonstration
98
FR 5 Breakdown• DR 5.6.1 DAQ system design shall be capable of transferring data from 20 tri-axial accelerometers into the DAQ
system during one test.Source: Customer estimate, it will be desired to obtain acceleration data at about 20 points on the structure in all three directions depending on the developed FEM model.Verification: Analysis of DAQ system• DR 5.6.1.1 DAQ system design shall provide capabilities for 60 channels of accelerometer data.
Source: DR 5.6.1, each tri-axial accelerometer will create 3 channels of accelerometer data which must be transferred simultaneously.Verification: Analysis of DAQ system• DR 5.6.1.1.1 DAQ system shall contain a microcontroller capable of receiving 60 channels of
accelerometer data.Source: DR 5.6.1, each tri-axial accelerometer will create 3 channels of accelerometer data which must be transferred simultaneously.Verification: Inspection of microcontroller
• DR 5.6.1.1.2 DAQ system design shall include 8 boards capable of transferring 8 channels of accelerometer data each.Source: DR 5.6.1, 8 boards with 8 channels each yields the possibility 64 channels, exceeding the 60 channel requirement in DR 5.6.1.1.Verification: Inspection of system design 99
FR 5 Breakdown• DR 5.6.2 DAQ system shall contain at least 1 tri-axial and 1 single-axis accelerometers.
Source: To keep costs low but validate two boards in the DAQ system, one tri-axial and one single axis accelerometer will be used on each board.Verification: Inspection of system• DR 5.6.2.1 Manufactured DAQ shall contain 16 accelerometer channels.
Source: To validate a multiple-board system, two full boards will be manufactured with eight channels on each for redundancy and the possibility of 16 accelerometer channels.Verification: Inspection of system
100
FR 5 Breakdown• DR 5.6.3 DAQ system hardware shall collect accurate accelerometer data to complete DR 5.5.
Source: DR 5.5, in order to collect useful accelerometer data, the subsequent components are necessary.Verification: Inspection of system and subsequent DRs.• DR 5.6.3.1 Each accelerometer channel shall include a charge amplifier.
Source: DR 5.5, to provide amplified data to the softwareVerification: Inspection
• DR 5.6.3.2 Each accelerometer channel shall include a low pass filter.Source: DR 5.5, accelerometer data needs to be filtered and the simplest way to do this is with a low pass filter before entering the software system. More filtering can be executed in the software as well.Verification: Inspection
• DR 5.6.3.3 Each accelerometer channel shall pass through an analog to digital converter.Source: DR 5.5, to provide the software system with digital data transferrable via USB.Verification: Inspection
• DR 5.6.3.4 Accelerometers shall be rated to 2 kHz or above.Source: DR 5.6.3, the highest vibration frequency tested at is 2 kHz. This accelerometer rating drives the accelerometer selection.Verification: Inspection
101
FR 5 Breakdown• DR 5.6.3.5 Accelerometer data shall be sampled by the DAQ system faster than 4 kHz.
Source: DR 5.6.3, the highest vibration rate will be 2 kHz thus the Nyquist frequency minimum sampling rate is 4 kHz.Verification: Demonstration• DR 5.6.3.5.1 Data from 60 accelerometer channels shall be sampled, packetized, and transmitted faster
than 4 kHz.Source: DR 5.6.3.5, the microcontroller will not be saving data so it must sample data and transfer it back out above the Nyquist frequency.Verification: Demonstration
• DR 5.6.3.5.2 The DAQ computer shall receive data above the microcontroller’s output rate with accelerometer data sampled at 4 kHz.Source: DR 5.6.3.5, the microcontroller will not be saving data so it must sample data and transfer it back out above the Nyquist frequency. Verification: Demonstration
102
FR 5 Breakdown• DR 5.6.4: Accelerometer data shall display in the form of power spectral density plots during
each test.Source: Customer requirement, safety for structure during test, real-time performance analysisVerification: Demonstration• DR 5.6.4.1: DAQ software executable file shall be downloaded and run on any Windows
computer.Source: To display power spectral density plots in real-time, a computer software is necessary to interface with data. This operation is necessary because all operations are assumed on any Windows computer (also see DR 5.6.6).Verification: Demonstration
• DR 5.6.4.2: Accelerometer data shall be transferred during each vibration test.Source: Power spectral density plots require accelerometer data, and will perform a calculation to display this accelerometer data in quasi-realtime.Verification: Demonstration
103
FR 5 Breakdown• DR 5.6.5 Accelerometer raw data and PSD data shall be saved during each test in an Excel-
compatible format.Source: Customer requirement for fast post-test analysis on any Windows computer.Verification: Demonstration
• DR 5.6.6 Accelerometer data shall be transferable via USB from the data collection computer to any Windows computer.Source: Customer Requirement. To prevent errors and wasted time, data should be easy to transfer to any of SST-US’ computers.Verification: Demonstration
104
Mass Breakdown
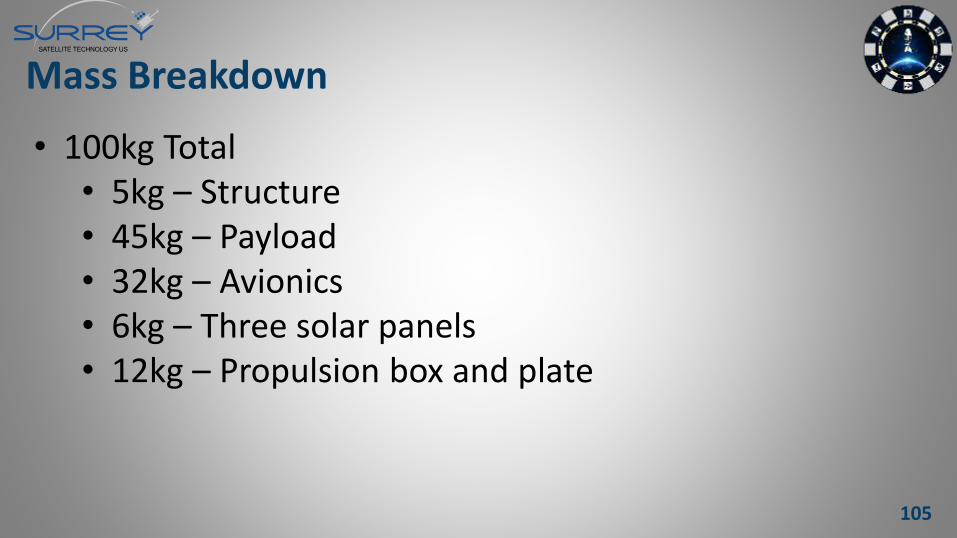
• 100kg Total• 5kg – Structure• 45kg – Payload• 32kg – Avionics• 6kg – Three solar panels• 12kg – Propulsion box and plate
105
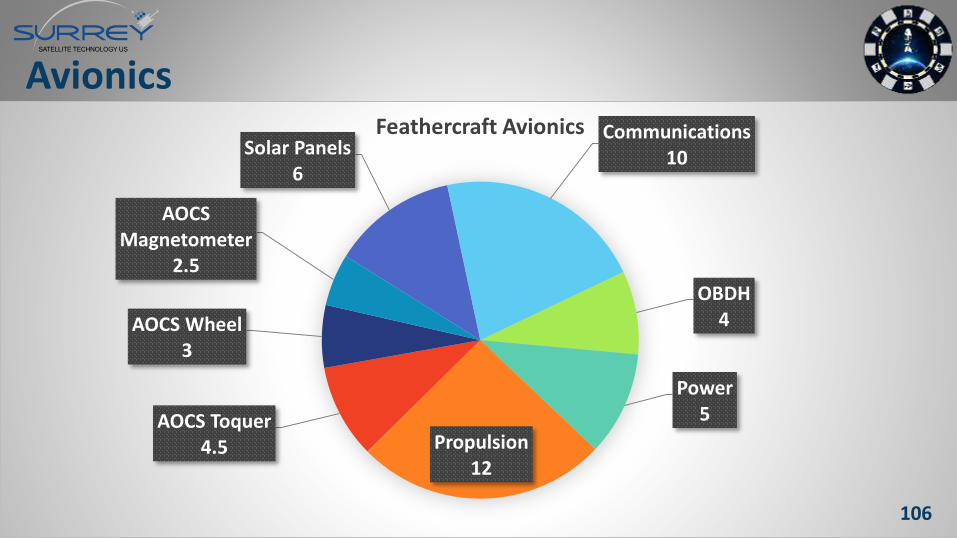
Solar Panels6
Communications10
OBDH4
Power5
Propulsion12
AOCS Toquer4.5
AOCS Wheel3
AOCS Magnetometer
2.5
Feathercraft Avionics
Avionics
106
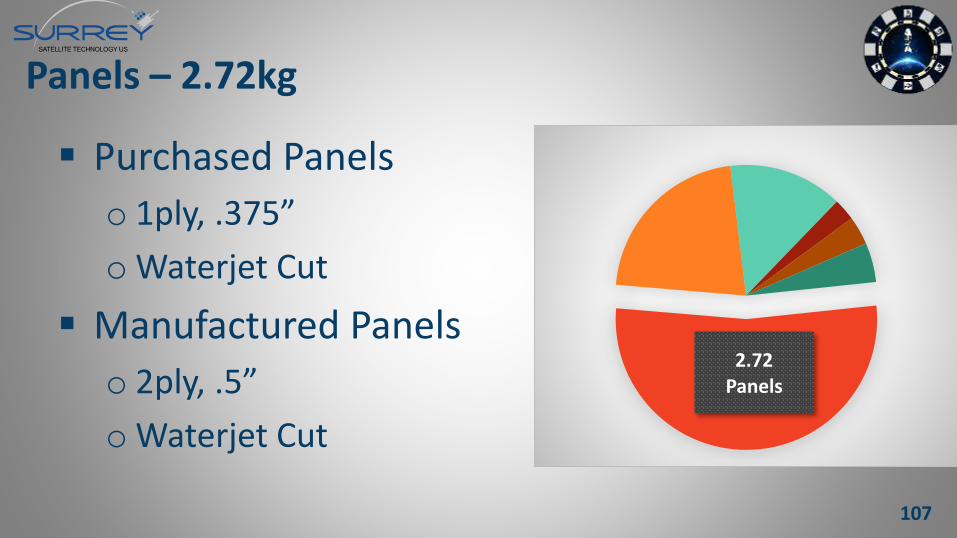
Panels – 2.72kg
Purchased Panels
o 1ply, .375”
o Waterjet Cut
Manufactured Panels
o 2ply, .5”
oWaterjet Cut
2.72Panels
107
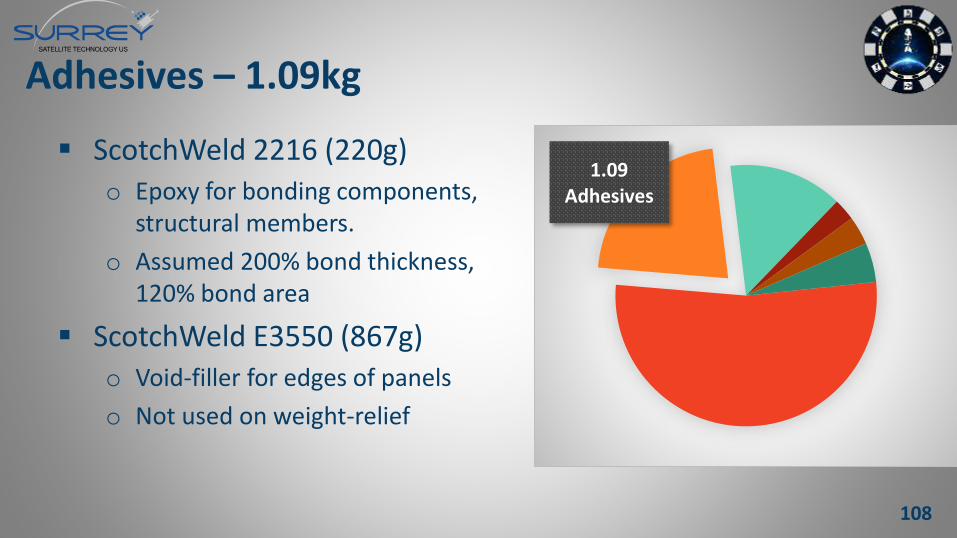
Adhesives – 1.09kg
ScotchWeld 2216 (220g)o Epoxy for bonding components,
structural members.
o Assumed 200% bond thickness, 120% bond area
ScotchWeld E3550 (867g)o Void-filler for edges of panels
o Not used on weight-relief
1.09Adhesives
108
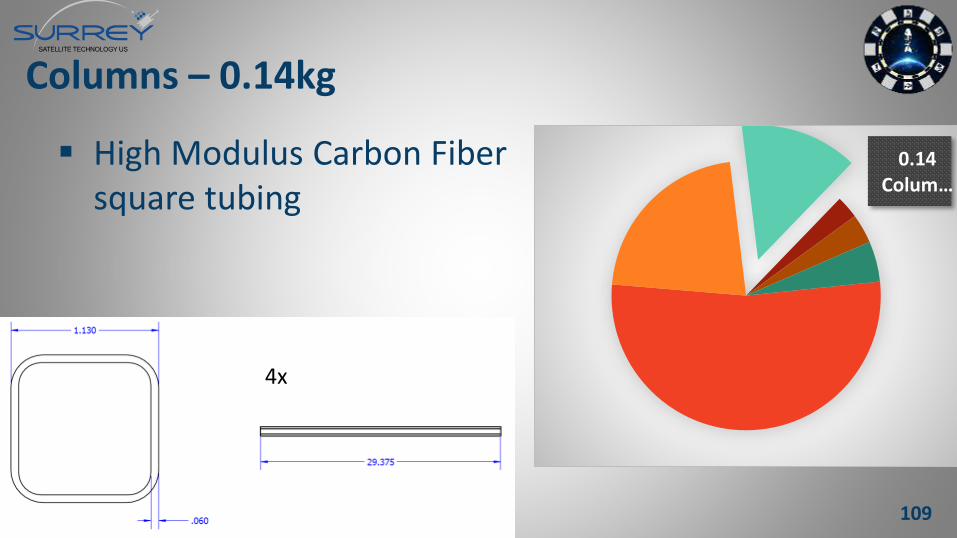
Columns – 0.14kg
High Modulus Carbon Fiber square tubing
0.14Colum…
4x
109
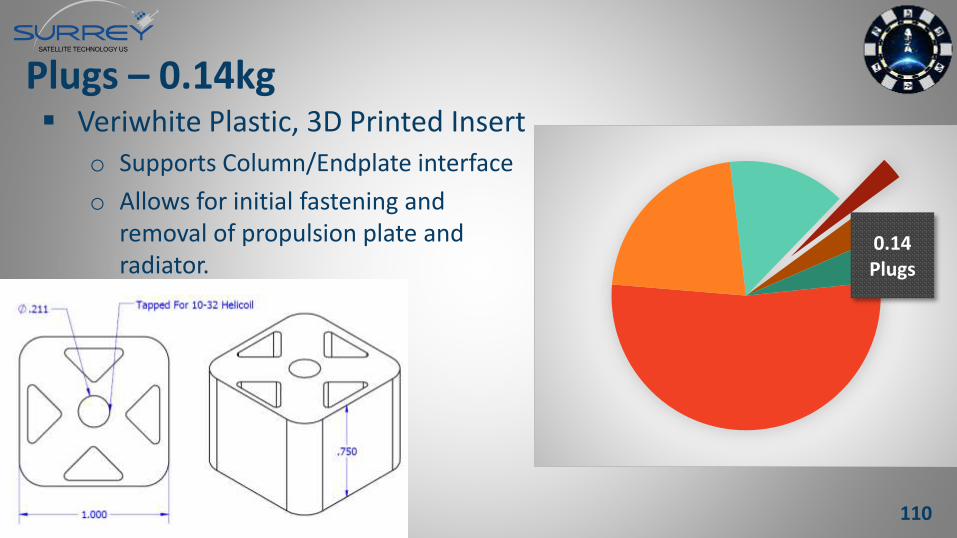
Plugs – 0.14kg Veriwhite Plastic, 3D Printed Insert
o Supports Column/Endplate interface
o Allows for initial fastening and removal of propulsion plate and radiator.
0.14Plugs
110
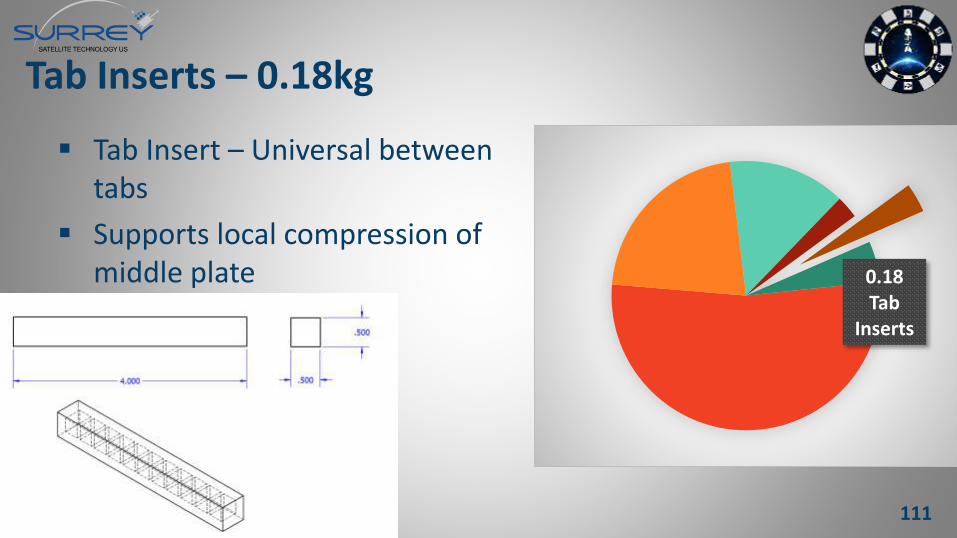
Tab Inserts – 0.18kg
Tab Insert – Universal between tabs
Supports local compression of middle plate 0.18
Tab Inserts
111
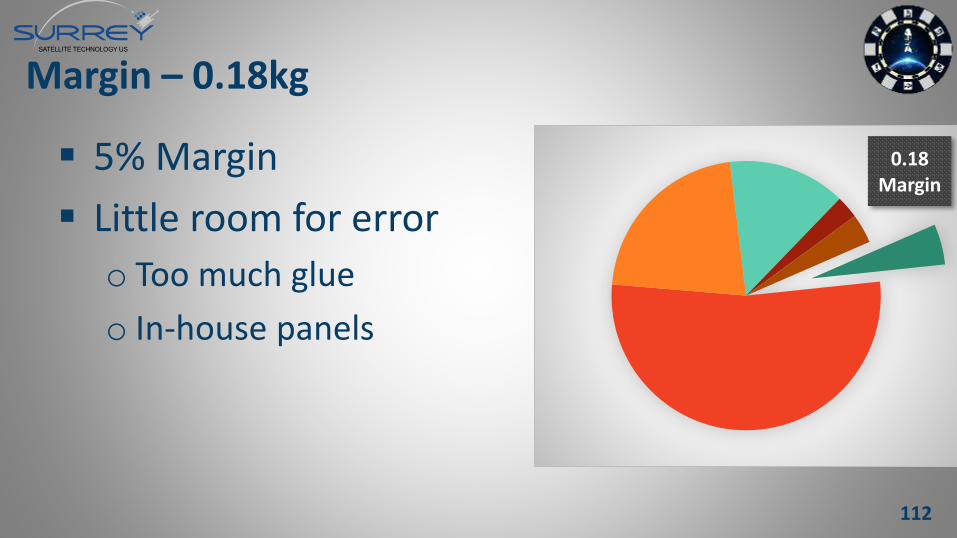
Margin – 0.18kg
5% Margin
Little room for error
o Too much glue
o In-house panels
0.18Margin
112
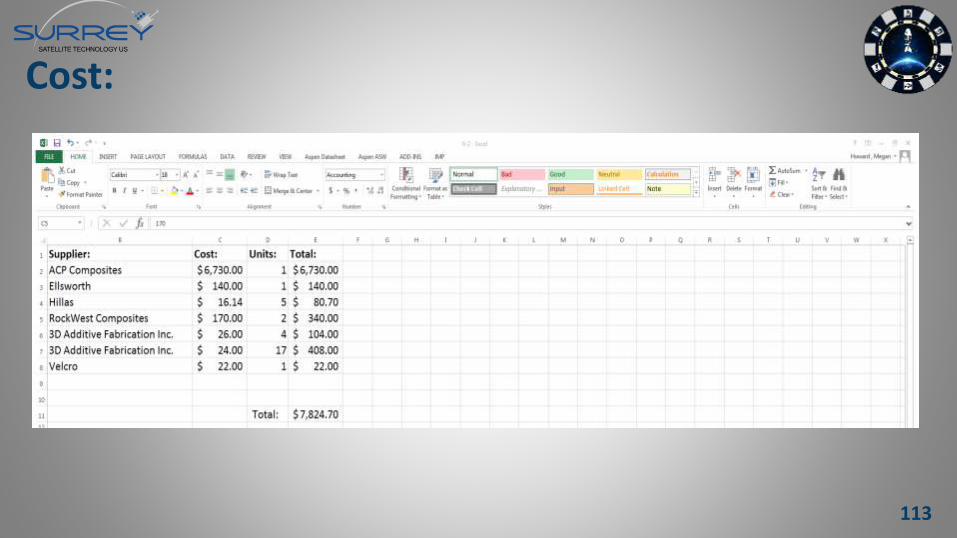
Cost:
113
DR 2.2: Manufacturing and Assembly shall take less than 9 months
Lead time for custom panels from ACP Composites is 4 weeks
Lead time for 3D printed inserts in 3-5 days (negligible)
Full adhesive cure takes 7 days, assume 4 glue cycles = 1 month
114

DR 2.3: Manufacturing and assembly labor shall cost less than $80,000
By deferring composites manufacturing to dedicated companies SST-US avoids all manufacturing labor cost
Assembly labor cost was estimated using an Aerospace Technicians average salary as $30.66/hour. One month for assembly of the spacecraft. Four person team.
115
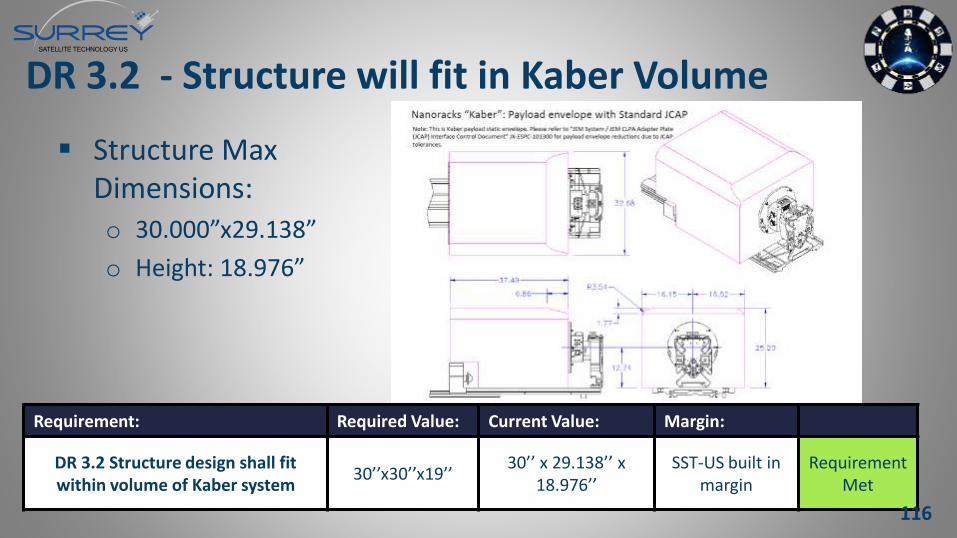
DR 3.2 - Structure will fit in Kaber Volume
Structure Max Dimensions:o 30.000”x29.138”
o Height: 18.976”
Requirement: Required Value: Current Value: Margin:
DR 3.2 Structure design shall fit within volume of Kaber system
30’’x30’’x19’’30’’ x 29.138’’ x
18.976’’SST-US built in
marginRequirement
Met
116
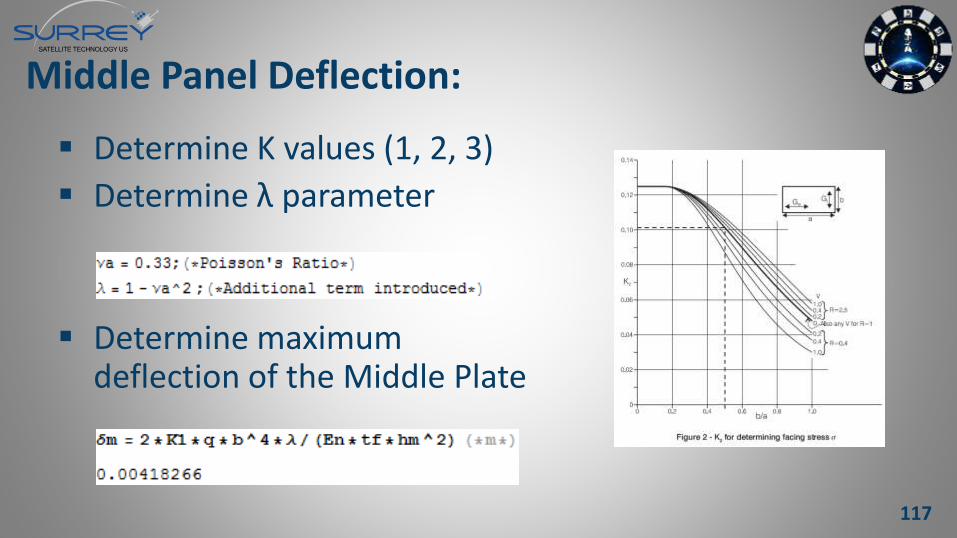
Middle Panel Deflection:
Determine K values (1, 2, 3)
Determine λ parameter
Determine maximum deflection of the Middle Plate
117
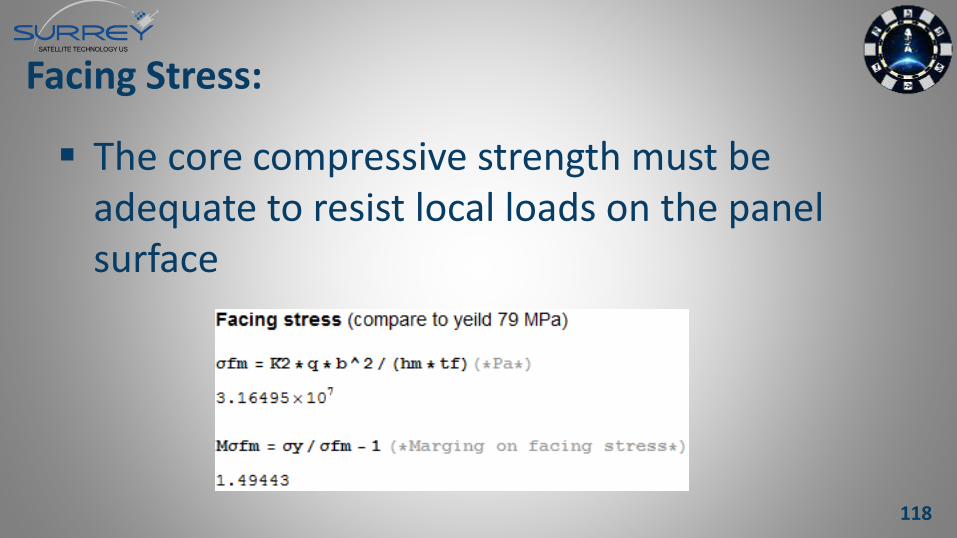
Facing Stress:
The core compressive strength must be adequate to resist local loads on the panel surface
118
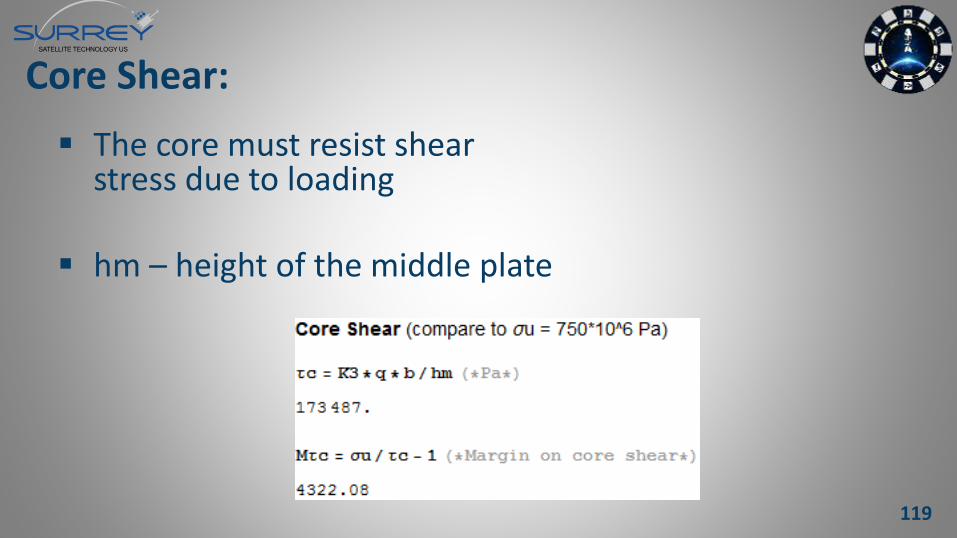
Core Shear:
The core must resist shear stress due to loading
hm – height of the middle plate
119
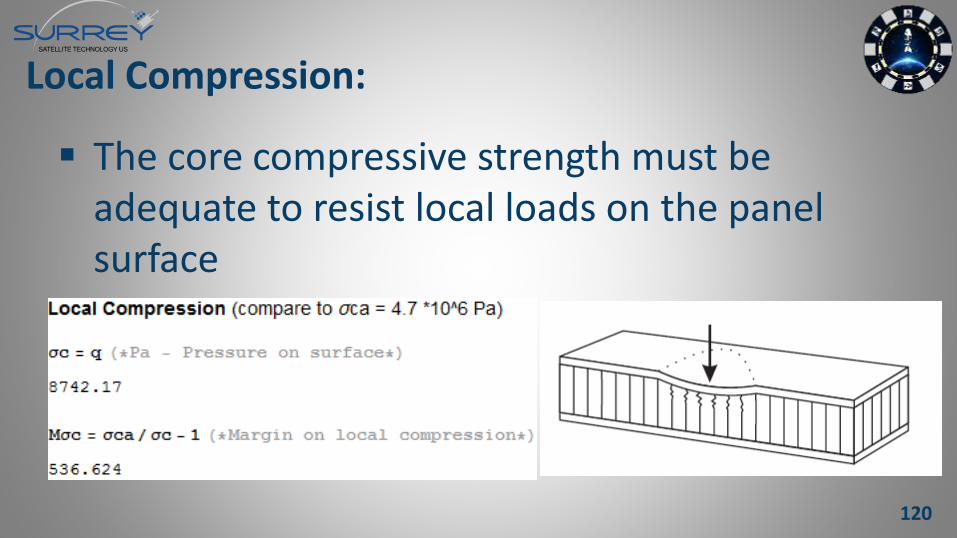
Local Compression:
The core compressive strength must be adequate to resist local loads on the panel surface
120
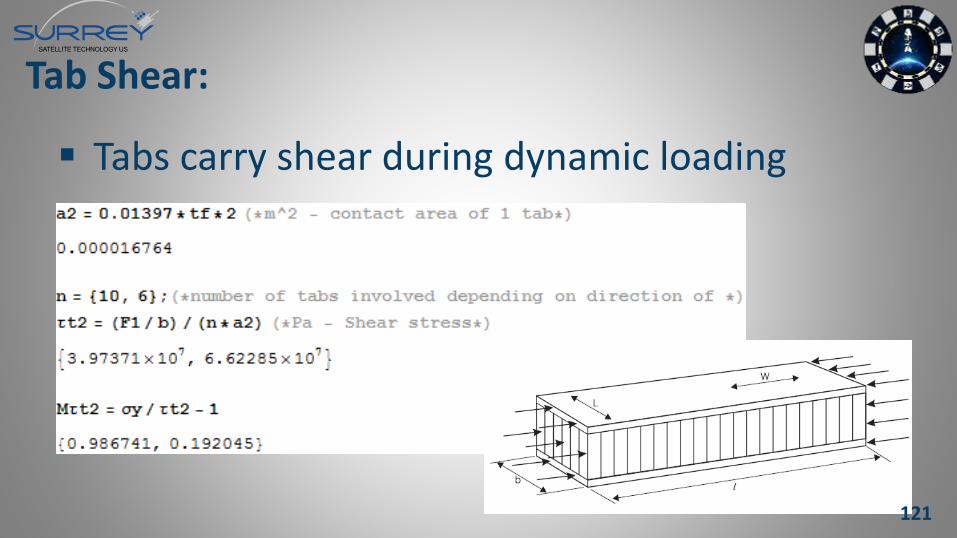
Tab Shear:
Tabs carry shear during dynamic loading
121
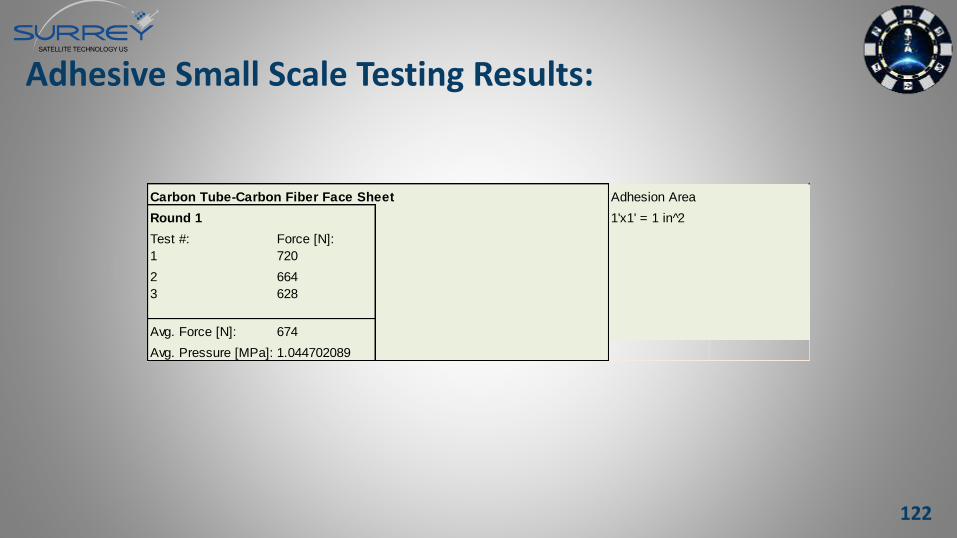
Adhesive Small Scale Testing Results:
Carbon Tube-Carbon Fiber Face Sheet Adhesion Area
Round 1 1'x1' = 1 in 2̂
Test #: Force [N]:
1 720
2 664
3 628
Avg. Force [N]: 674
Avg. Pressure [MPa]: 1.044702089
122
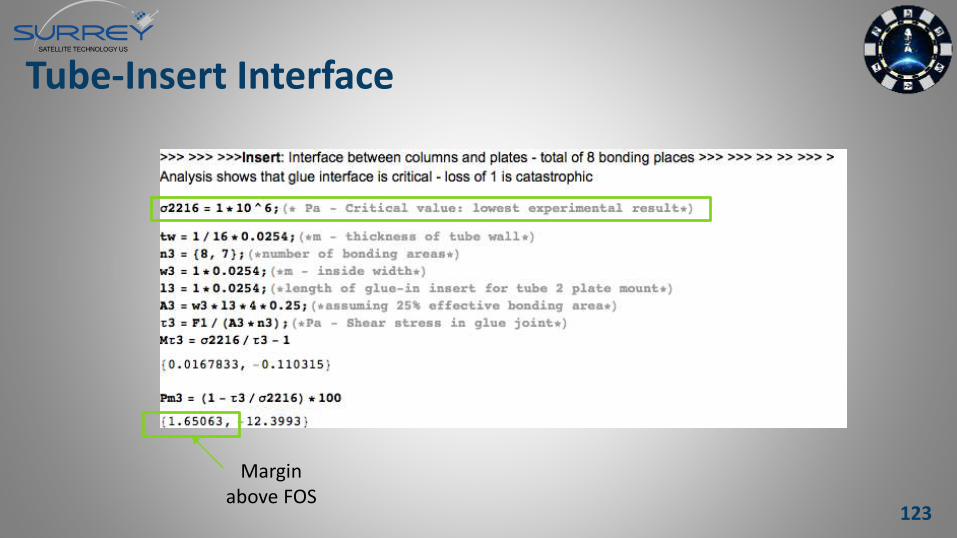
Tube-Insert Interface
123
Margin above FOS
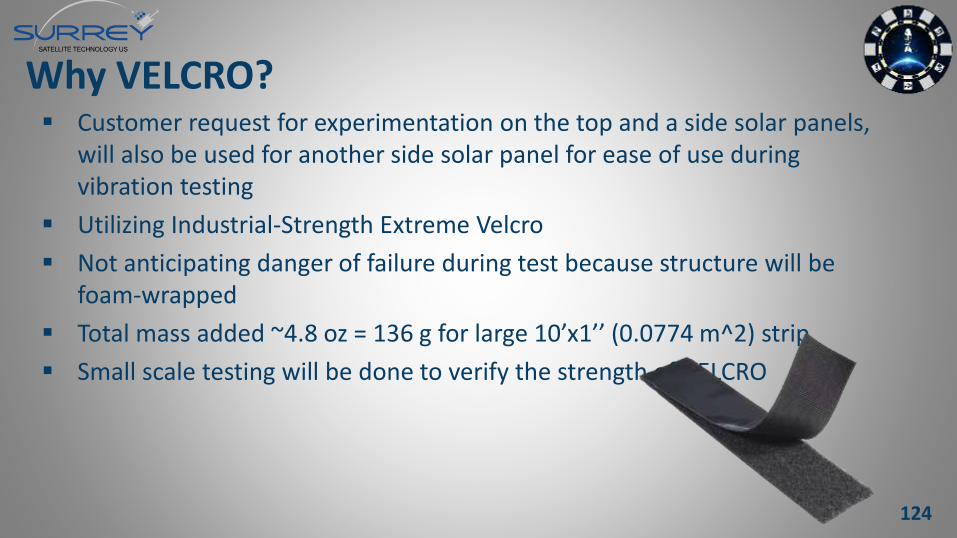
Why VELCRO? Customer request for experimentation on the top and a side solar panels,
will also be used for another side solar panel for ease of use during vibration testing
Utilizing Industrial-Strength Extreme Velcro
Not anticipating danger of failure during test because structure will be foam-wrapped
Total mass added ~4.8 oz = 136 g for large 10’x1’’ (0.0774 m^2) strip
Small scale testing will be done to verify the strength of VELCRO
124
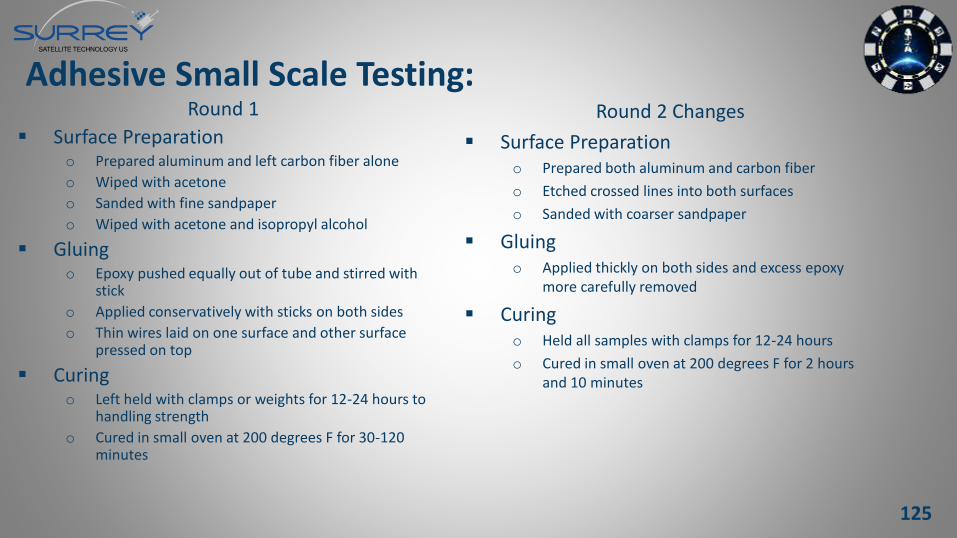
Round 1
Surface Preparationo Prepared aluminum and left carbon fiber alone
o Wiped with acetone
o Sanded with fine sandpaper
o Wiped with acetone and isopropyl alcohol
Gluingo Epoxy pushed equally out of tube and stirred with
stick
o Applied conservatively with sticks on both sides
o Thin wires laid on one surface and other surface pressed on top
Curingo Left held with clamps or weights for 12-24 hours to
handling strength
o Cured in small oven at 200 degrees F for 30-120 minutes
Adhesive Small Scale Testing:Round 2 Changes
Surface Preparationo Prepared both aluminum and carbon fiber
o Etched crossed lines into both surfaces
o Sanded with coarser sandpaper
Gluingo Applied thickly on both sides and excess epoxy
more carefully removed
Curingo Held all samples with clamps for 12-24 hours
o Cured in small oven at 200 degrees F for 2 hours and 10 minutes
125
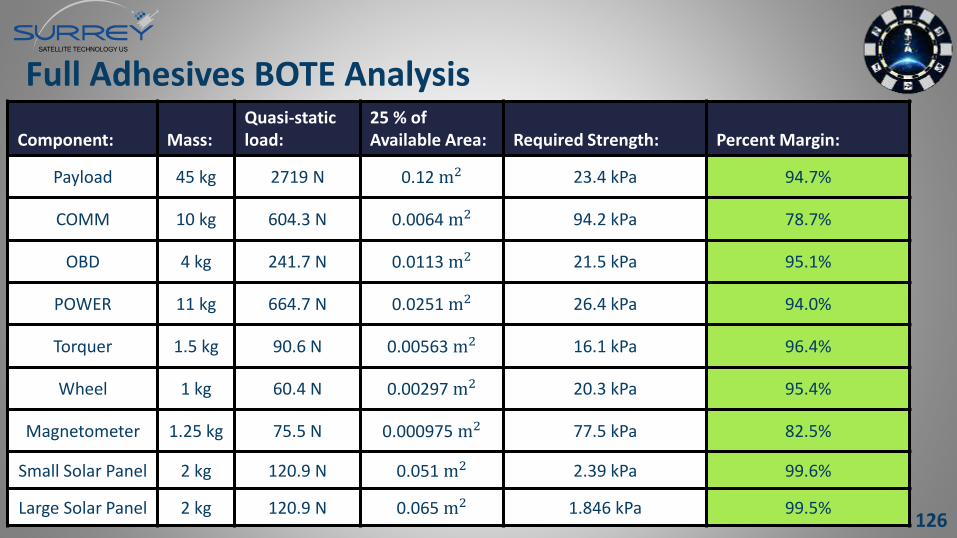
Full Adhesives BOTE Analysis
Component: Mass:Quasi-staticload:
25 % of Available Area: Required Strength: Percent Margin:
Payload 45 kg 2719 N 0.12 m2 23.4 kPa 94.7%
COMM 10 kg 604.3 N 0.0064 m2 94.2 kPa 78.7%
OBD 4 kg 241.7 N 0.0113 m2 21.5 kPa 95.1%
POWER 11 kg 664.7 N 0.0251 m2 26.4 kPa 94.0%
Torquer 1.5 kg 90.6 N 0.00563 m2 16.1 kPa 96.4%
Wheel 1 kg 60.4 N 0.00297 m2 20.3 kPa 95.4%
Magnetometer 1.25 kg 75.5 N 0.000975 m2 77.5 kPa 82.5%
Small Solar Panel 2 kg 120.9 N 0.051 m2 2.39 kPa 99.6%
Large Solar Panel 2 kg 120.9 N 0.065 m2 1.846 kPa 99.5%126
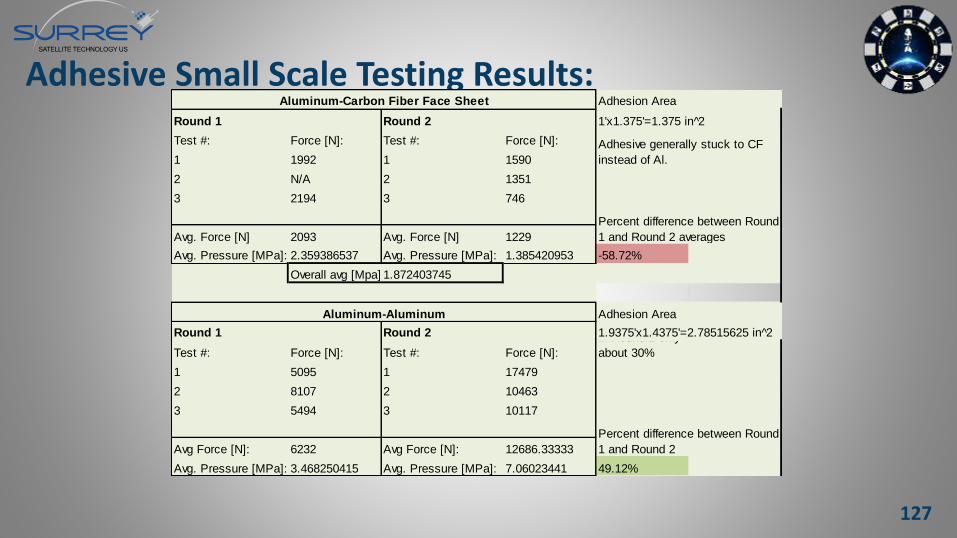
Adhesive Small Scale Testing Results:Adhesion Area
Round 1 Round 2 1'x1.375'=1.375 in 2̂
Test #: Force [N]: Test #: Force [N]:
1 1992 1 1590
2 N/A 2 1351
3 2194 3 746
Avg. Force [N] 2093 Avg. Force [N] 1229
Avg. Pressure [MPa]: 2.359386537 Avg. Pressure [MPa]: 1.385420953 -58.72%
Overall avg [Mpa] 1.872403745
Adhesion Area
Round 1 Round 2 1.9375'x1.4375'=2.78515625 in 2̂
Test #: Force [N]: Test #: Force [N]:
In Round 1 only
about 30%
1 5095 1 17479
2 8107 2 10463
3 5494 3 10117
Avg Force [N]: 6232 Avg Force [N]: 12686.33333
Avg. Pressure [MPa]: 3.468250415 Avg. Pressure [MPa]: 7.06023441 49.12%
Aluminum-Aluminum
Adhesive generally stuck to CF
instead of Al.
Aluminum-Carbon Fiber Face Sheet
Percent difference between Round
1 and Round 2 averages
Percent difference between Round
1 and Round 2
127
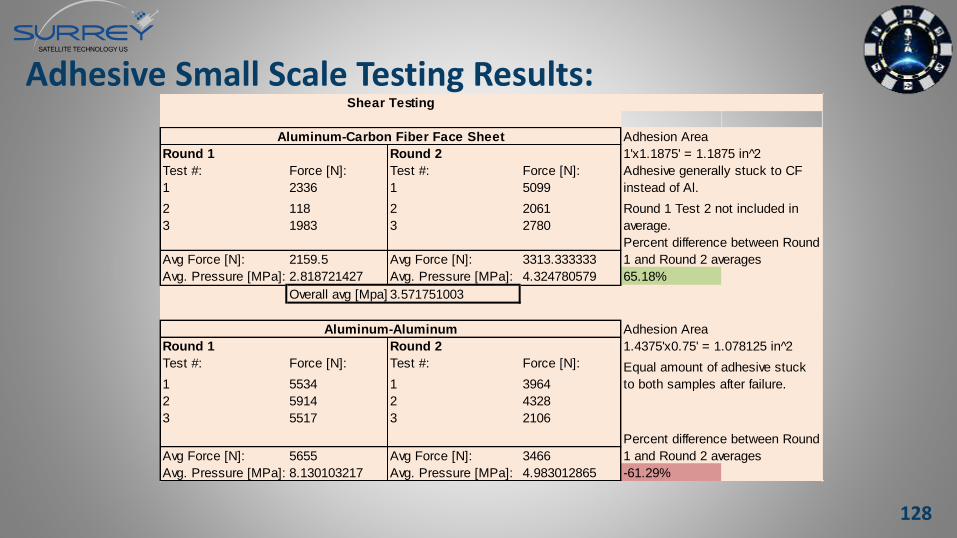
Adhesive Small Scale Testing Results:
Adhesion Area
Round 1 Round 2 1'x1.1875' = 1.1875 in 2̂
Test #: Force [N]: Test #: Force [N]:
1 2336 1 5099
2 118 2 2061
3 1983 3 2780
Avg Force [N]: 2159.5 Avg Force [N]: 3313.333333
Avg. Pressure [MPa]: 2.818721427 Avg. Pressure [MPa]: 4.324780579 65.18%
Overall avg [Mpa] 3.571751003
Adhesion Area
Round 1 Round 2 1.4375'x0.75' = 1.078125 in 2̂
Test #: Force [N]: Test #: Force [N]:
1 5534 1 3964
2 5914 2 4328
3 5517 3 2106
Avg Force [N]: 5655 Avg Force [N]: 3466
Avg. Pressure [MPa]: 8.130103217 Avg. Pressure [MPa]: 4.983012865 -61.29%
Equal amount of adhesive stuck
to both samples after failure.
Percent difference between Round
1 and Round 2 averages
Round 1 Test 2 not included in
average.
Percent difference between Round
1 and Round 2 averages
Adhesive generally stuck to CF
instead of Al.
Aluminum-Aluminum
Aluminum-Carbon Fiber Face Sheet
Shear Testing
128
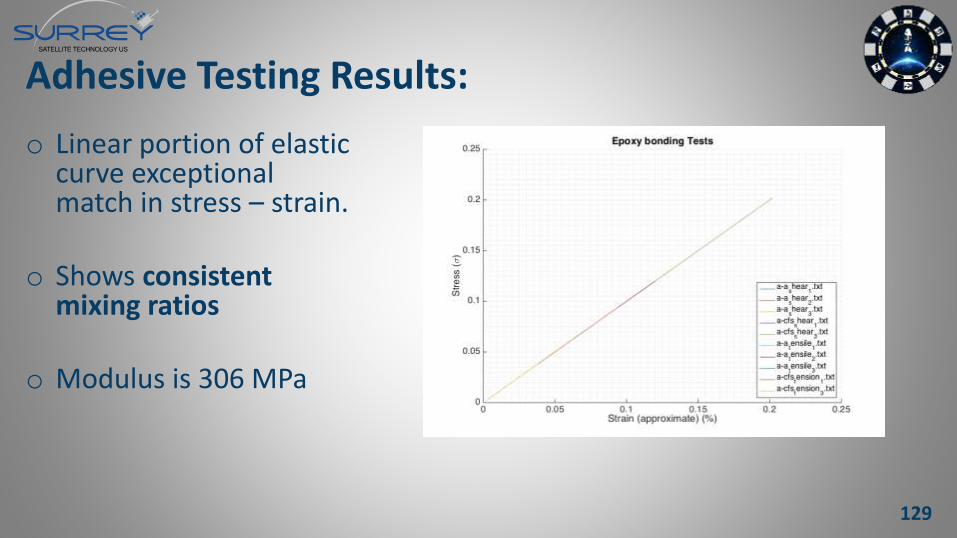
Adhesive Testing Results:
o Linear portion of elastic curve exceptional match in stress – strain.
o Shows consistent mixing ratios
o Modulus is 306 MPa
129
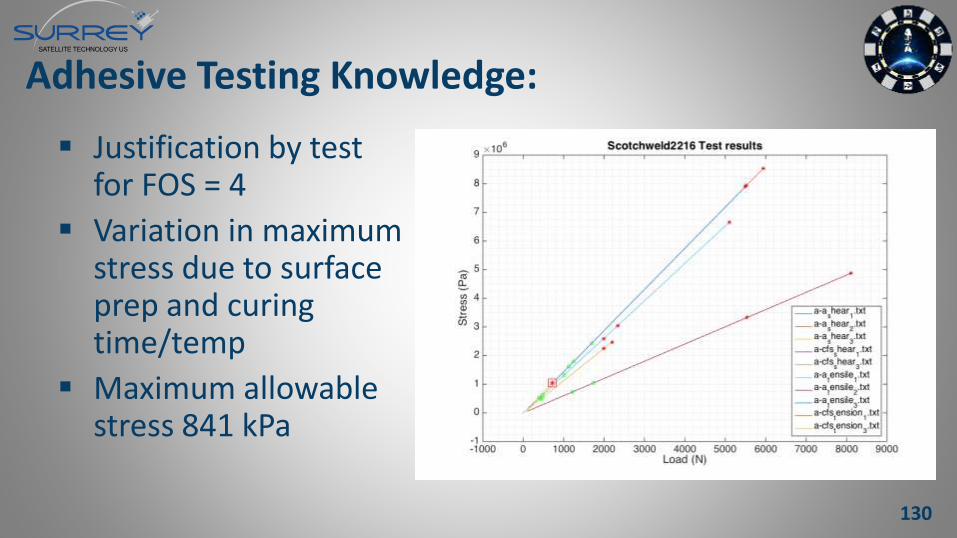
Adhesive Testing Knowledge:
Justification by test for FOS = 4
Variation in maximum stress due to surface prep and curing time/temp
Maximum allowable stress 841 kPa
130
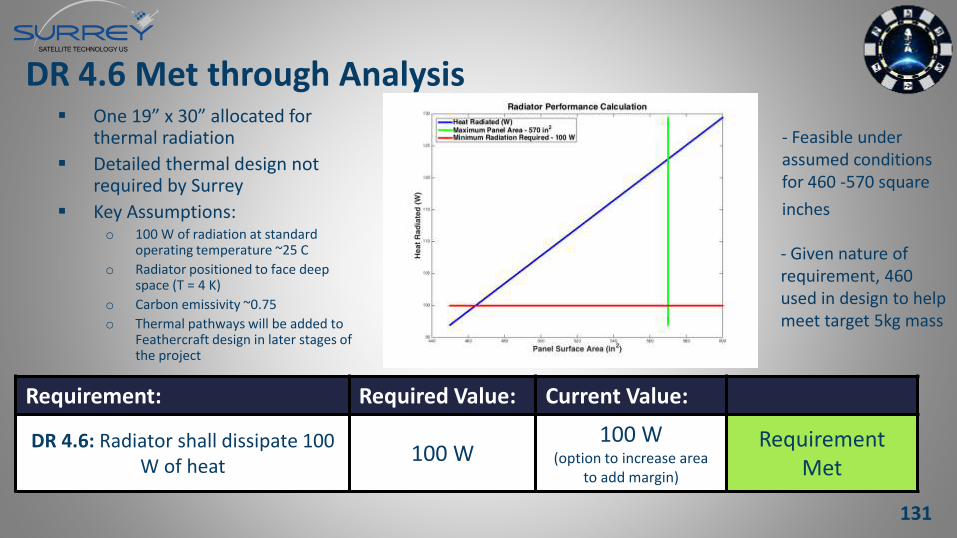
DR 4.6 Met through Analysis One 19” x 30” allocated for
thermal radiation
Detailed thermal design not required by Surrey
Key Assumptions:o 100 W of radiation at standard
operating temperature ~25 C
o Radiator positioned to face deep space (T = 4 K)
o Carbon emissivity ~0.75
o Thermal pathways will be added to Feathercraft design in later stages of the project
Requirement: Required Value: Current Value:
DR 4.6: Radiator shall dissipate 100 W of heat
100 W100 W
(option to increase area to add margin)
RequirementMet
- Feasible under assumed conditions for 460 -570 square
inches
- Given nature of requirement, 460 used in design to help meet target 5kg mass
131
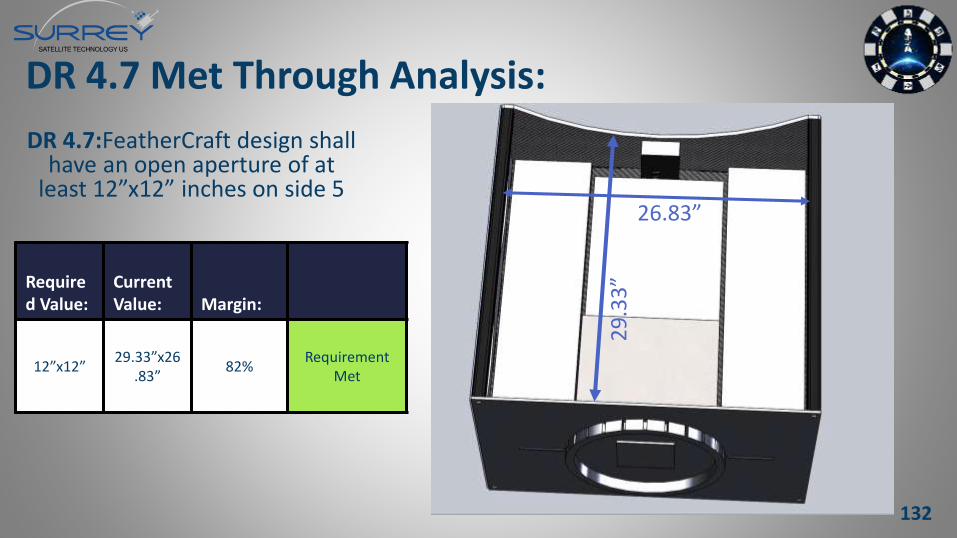
DR 4.7 Met Through Analysis:
DR 4.7:FeatherCraft design shall have an open aperture of at
least 12”x12” inches on side 5
29
.33
”
26.83”
Required Value:
CurrentValue: Margin:
12”x12”29.33”x26
.83”82%
RequirementMet
132
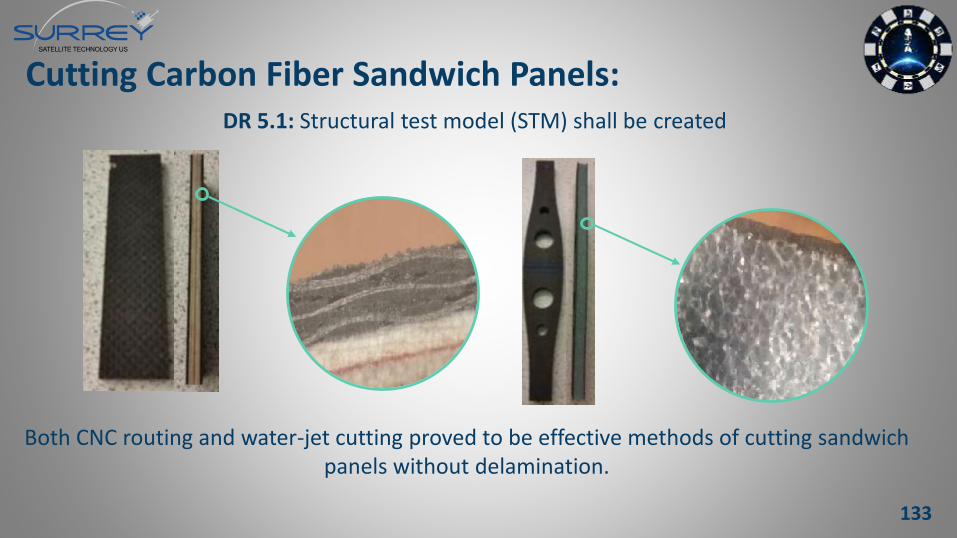
Cutting Carbon Fiber Sandwich Panels: DR 5.1: Structural test model (STM) shall be created
Both CNC routing and water-jet cutting proved to be effective methods of cutting sandwich panels without delamination.
133
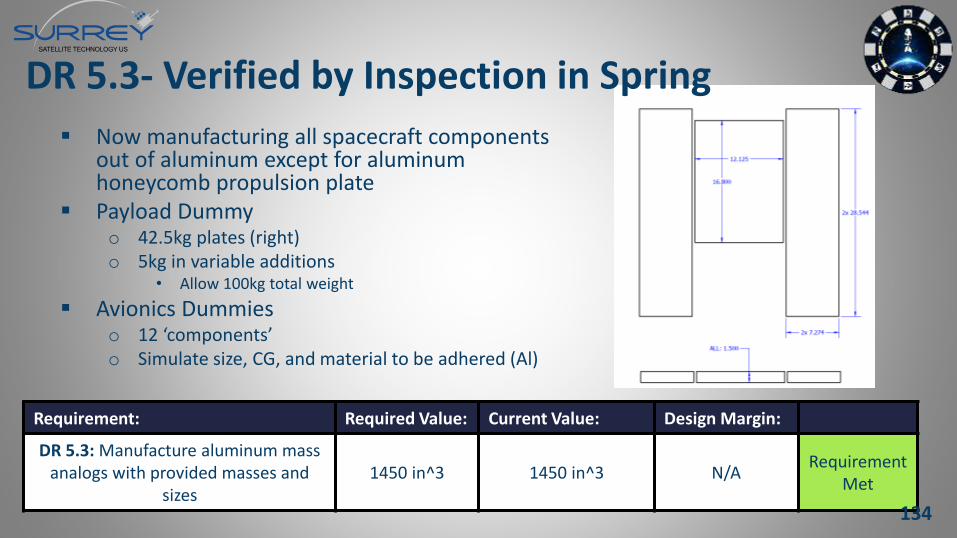
DR 5.3- Verified by Inspection in Spring
Now manufacturing all spacecraft components out of aluminum except for aluminum honeycomb propulsion plate
Payload Dummyo 42.5kg plates (right)o 5kg in variable additions
• Allow 100kg total weight
Avionics Dummieso 12 ‘components’o Simulate size, CG, and material to be adhered (Al)
Requirement: Required Value: Current Value: Design Margin:
DR 5.3: Manufacture aluminum mass analogs with provided masses and
sizes1450 in^3 1450 in^3 N/A
RequirementMet
134
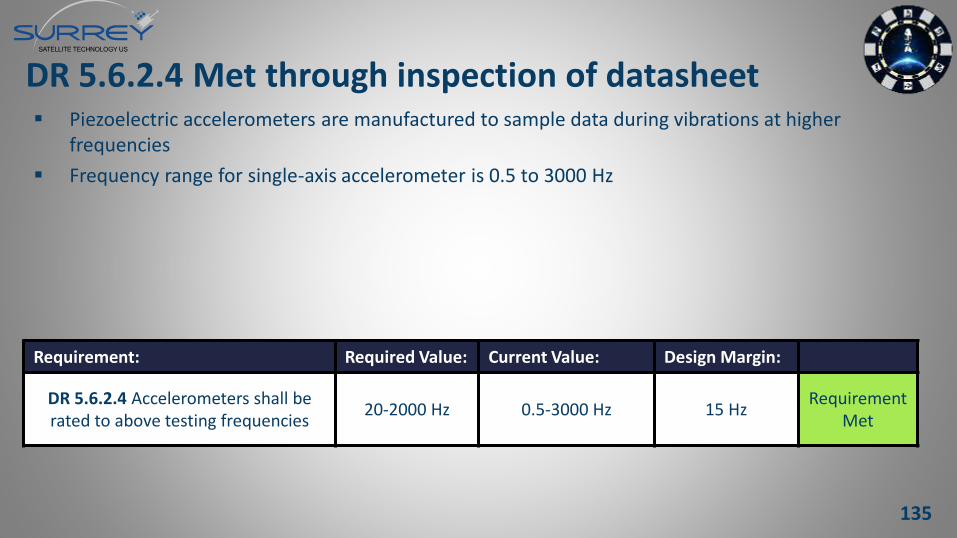
DR 5.6.2.4 Met through inspection of datasheet Piezoelectric accelerometers are manufactured to sample data during vibrations at higher
frequencies
Frequency range for single-axis accelerometer is 0.5 to 3000 Hz
Requirement: Required Value: Current Value: Design Margin:
DR 5.6.2.4 Accelerometers shall be rated to above testing frequencies
20-2000 Hz 0.5-3000 Hz 15 HzRequirement
Met
135
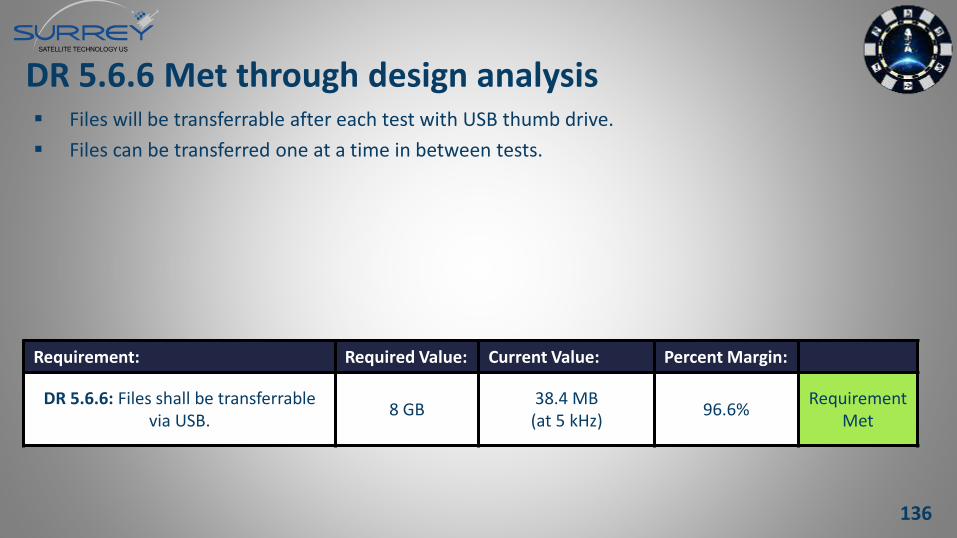
DR 5.6.6 Met through design analysis Files will be transferrable after each test with USB thumb drive.
Files can be transferred one at a time in between tests.
Requirement: Required Value: Current Value: Percent Margin:
DR 5.6.6: Files shall be transferrable via USB.
8 GB38.4 MB (at 5 kHz)
96.6%Requirement
Met
136
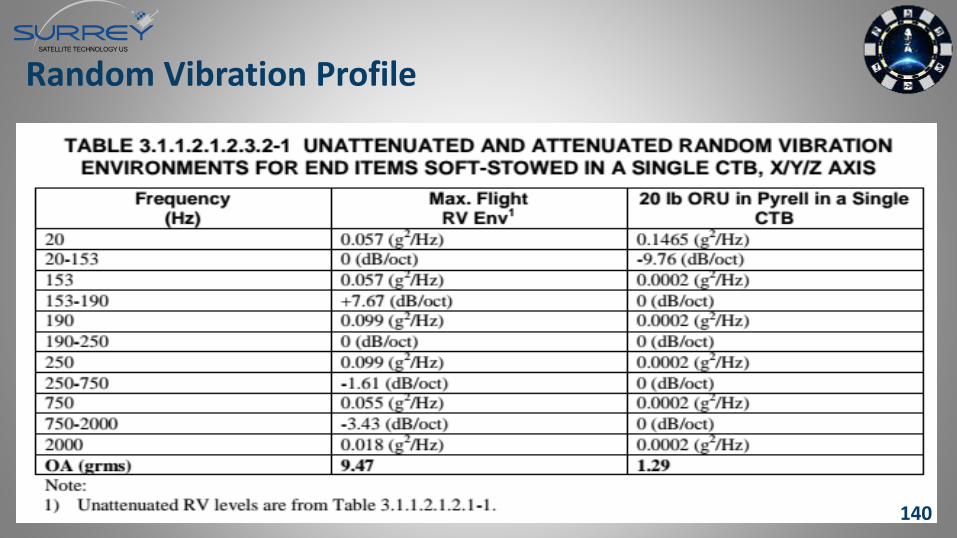
Random Vibration Profile
Gives Random Vibration (RV) max envelopes for different frequencies and ranges of frequencies in g2/Hz.
Specifies RV max envelopes for unattenuated and attenuated environments Unattenuated (9.47 grms): RV experienced by unwrapped cargo
i.e. the input to the vibration table Attenuated: RV experienced by cargo wrapped in this specific
configuration – ½” to 2” Pyrell Foam. This is what FISH will experience in flight and what it is being designed to survive.
137
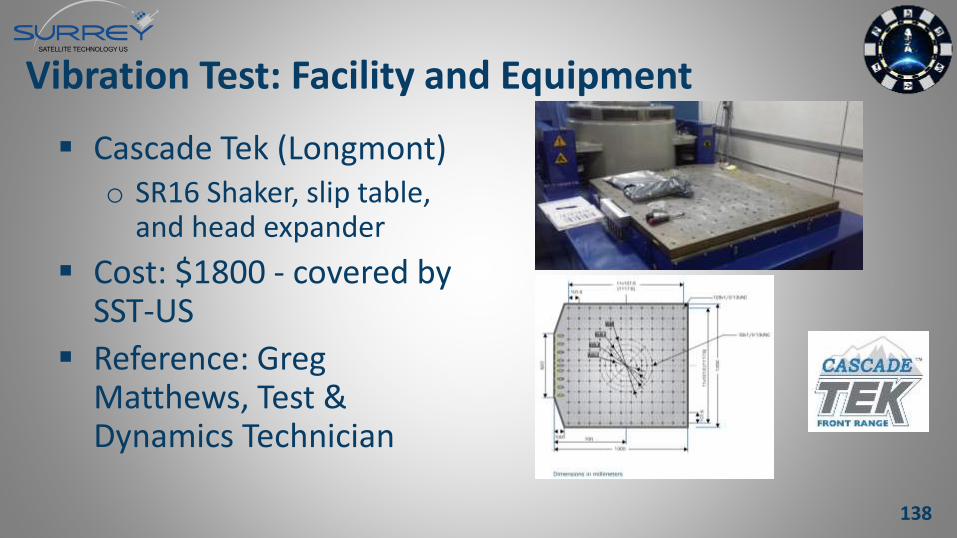
Vibration Test: Facility and Equipment
Cascade Tek (Longmont)o SR16 Shaker, slip table,
and head expander
Cost: $1800 - covered by SST-US
Reference: Greg Matthews, Test & Dynamics Technician
138
Vibration Testing – Incremental Test Concept
Limited ability to model testing conditions & predict foam attenuation
Risk: Attenuation will be insufficient to reduce full 9.47grms output to 1.29grms
Mitigation: Multiple random vibration tests, gradually increasing intensityo Cascade Tek has software to adjust profile (reference Greg
Matthews) o Start at Profile – 12 dB, increase intensity until the structure is
seeing the required 1.29 grms
139
Random Vibration Profile
140
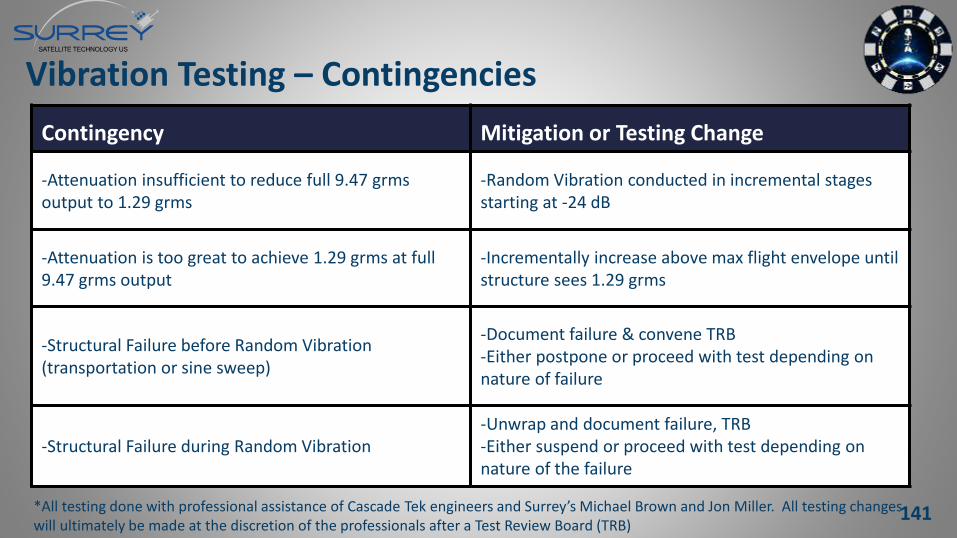
Vibration Testing – Contingencies
Contingency Mitigation or Testing Change
-Attenuation insufficient to reduce full 9.47 grmsoutput to 1.29 grms
-Random Vibration conducted in incremental stages starting at -24 dB
-Attenuation is too great to achieve 1.29 grms at full 9.47 grms output
-Incrementally increase above max flight envelope until structure sees 1.29 grms
-Structural Failure before Random Vibration (transportation or sine sweep)
-Document failure & convene TRB-Either postpone or proceed with test depending on nature of failure
-Structural Failure during Random Vibration-Unwrap and document failure, TRB-Either suspend or proceed with test depending on nature of the failure
*All testing done with professional assistance of Cascade Tek engineers and Surrey’s Michael Brown and Jon Miller. All testing changes will ultimately be made at the discretion of the professionals after a Test Review Board (TRB)
141
GRMS
grms is the “Root Mean Square” of acceleration, and is the preferred method to characterize Random Vibration Loading
Random Vibration response curves are plotted as Frequency (Hz.) vs. Acceleration Spectral Density (ASD, g2/Hz.) To calculate grms: Average the squared acceleration
over frequency, and take the square root
142
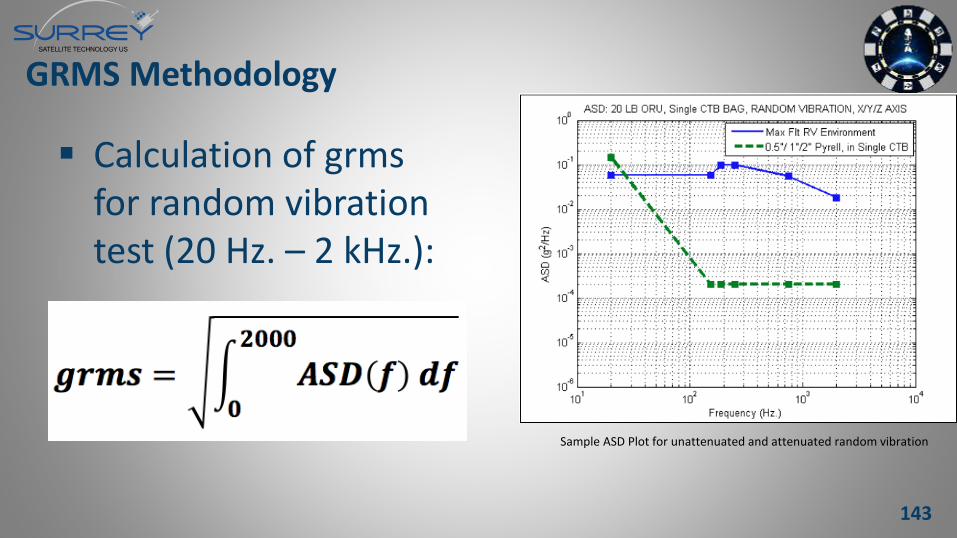
GRMS Methodology
Calculation of grmsfor random vibration test (20 Hz. – 2 kHz.):
Sample ASD Plot for unattenuated and attenuated random vibration
143
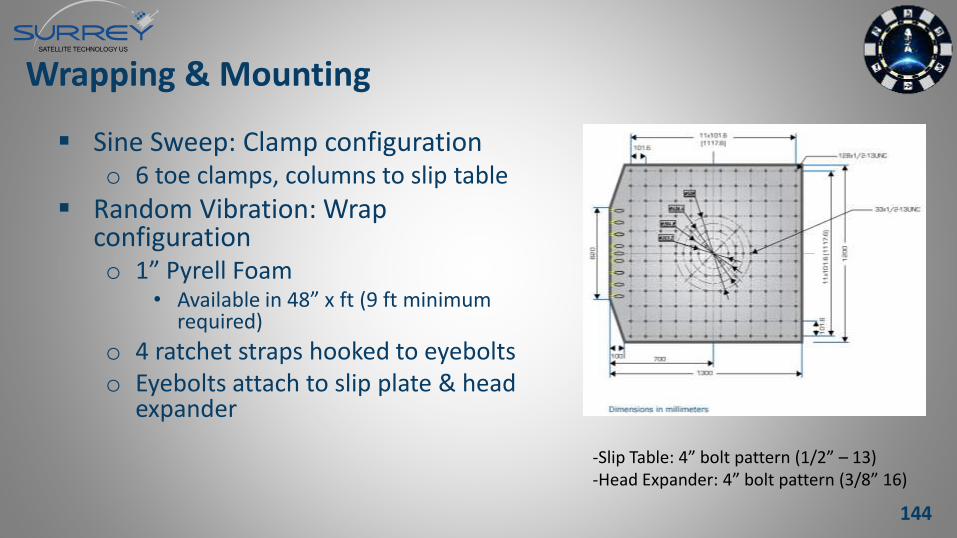
Wrapping & Mounting
Sine Sweep: Clamp configurationo 6 toe clamps, columns to slip table
Random Vibration: Wrap configurationo 1” Pyrell Foam
• Available in 48” x ft (9 ft minimum required)
o 4 ratchet straps hooked to eyebolts o Eyebolts attach to slip plate & head
expander
-Slip Table: 4” bolt pattern (1/2” – 13)-Head Expander: 4” bolt pattern (3/8” 16)
144
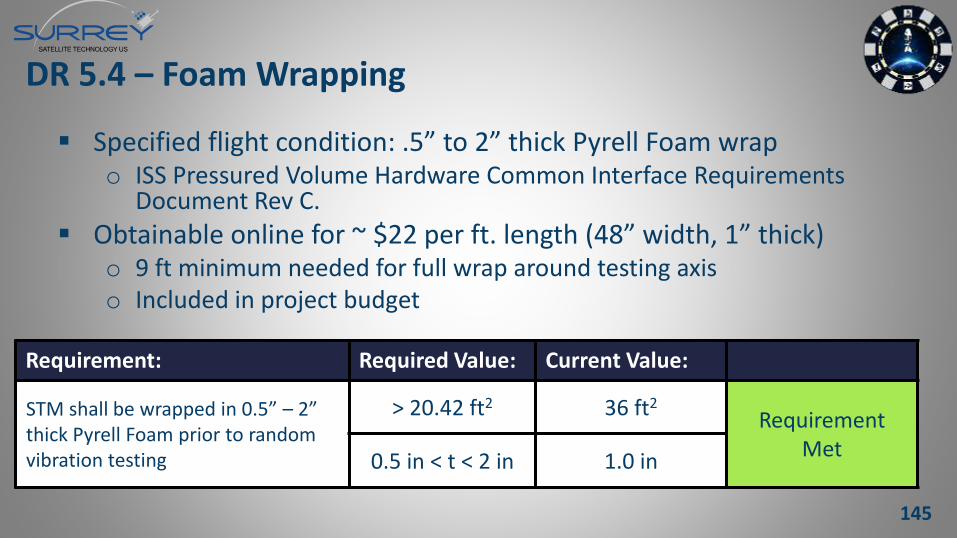
DR 5.4 – Foam Wrapping
Specified flight condition: .5” to 2” thick Pyrell Foam wrapo ISS Pressured Volume Hardware Common Interface Requirements
Document Rev C.
Obtainable online for ~ $22 per ft. length (48” width, 1” thick)o 9 ft minimum needed for full wrap around testing axis o Included in project budget
Requirement: Required Value: Current Value:
STM shall be wrapped in 0.5” – 2” thick Pyrell Foam prior to random vibration testing
> 20.42 ft2 36 ft2Requirement
Met0.5 in < t < 2 in 1.0 in
145
DR 5.4 – Acquiring Foam MSC is a trusted and fast resource which stocks the Pyrell foam
146
5.6.3: DAQ System – Providing Quality Data
The charge amplifiers will add a constant 2mA current to the charge output of the accelerometer.
Frequencies above 2.5kHz will be filtered out by the Active Low Pass filter. This will remove higher harmonics to protect the ADC.
147
5.6.3: DAQ System – Providing Quality Data
Analog to Digital Converter converts the analog voltage output to a binary number.
The microcontroller pulls the binary number and relays it to the computer.
The software removes any DC bias seen through the charge amplifier and plots the final result.
148
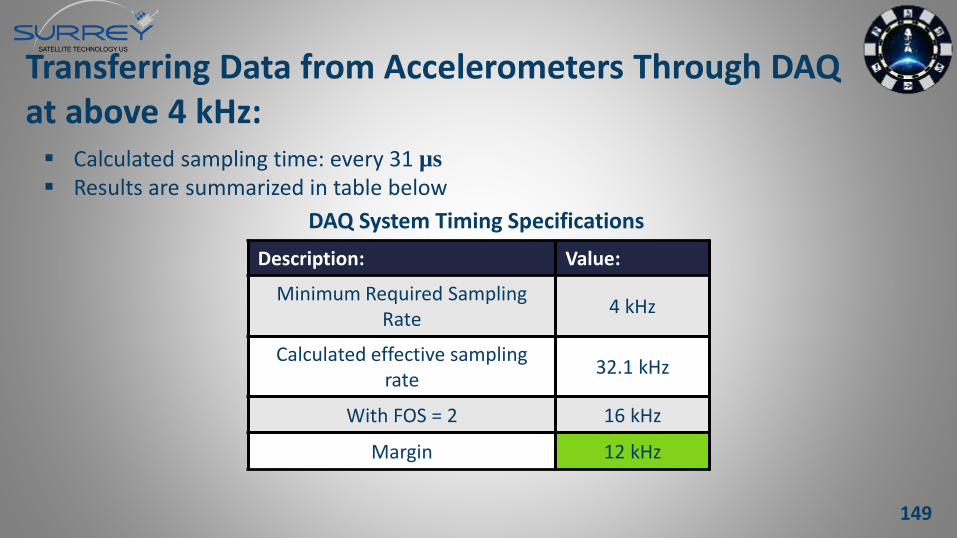
Description: Value:
Minimum Required Sampling Rate
4 kHz
Calculated effective sampling rate
32.1 kHz
With FOS = 2 16 kHz
Margin 12 kHz
Calculated sampling time: every 31 µs
Results are summarized in table below
DAQ System Timing Specifications
Transferring Data from Accelerometers Through DAQ at above 4 kHz:
149
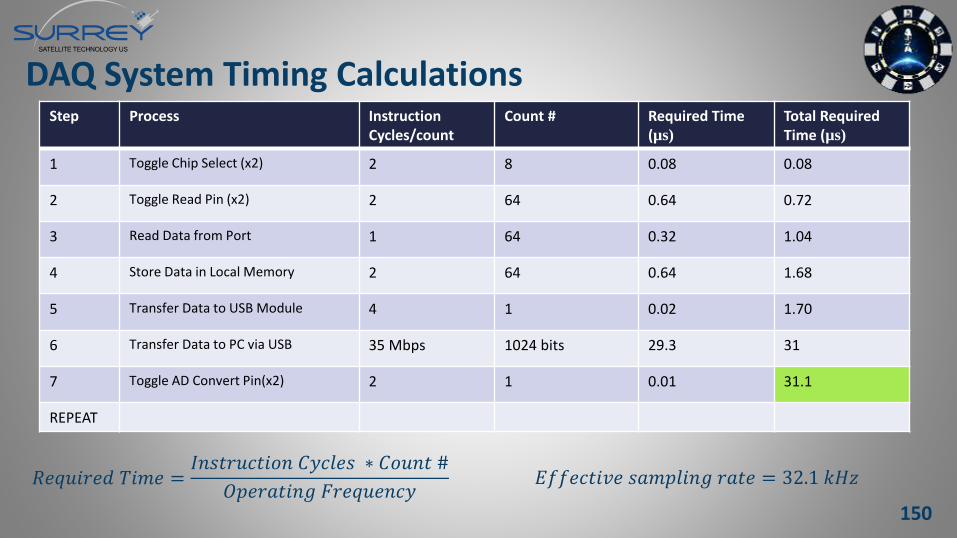
DAQ System Timing CalculationsStep Process Instruction
Cycles/countCount # Required Time
(µs)
Total RequiredTime (µs)
1 Toggle Chip Select (x2) 2 8 0.08 0.08
2 Toggle Read Pin (x2) 2 64 0.64 0.72
3 Read Data from Port 1 64 0.32 1.04
4 Store Data in Local Memory 2 64 0.64 1.68
5 Transfer Data to USB Module 4 1 0.02 1.70
6 Transfer Data to PC via USB 35 Mbps 1024 bits 29.3 31
7 Toggle AD Convert Pin(x2) 2 1 0.01 31.1
REPEAT
𝑅𝑒𝑞𝑢𝑖𝑟𝑒𝑑 𝑇𝑖𝑚𝑒 =𝐼𝑛𝑠𝑡𝑟𝑢𝑐𝑡𝑖𝑜𝑛 𝐶𝑦𝑐𝑙𝑒𝑠 ∗ 𝐶𝑜𝑢𝑛𝑡 #
𝑂𝑝𝑒𝑟𝑎𝑡𝑖𝑛𝑔 𝐹𝑟𝑒𝑞𝑢𝑒𝑛𝑐𝑦𝐸𝑓𝑓𝑒𝑐𝑡𝑖𝑣𝑒 𝑠𝑎𝑚𝑝𝑙𝑖𝑛𝑔 𝑟𝑎𝑡𝑒 = 32.1 𝑘𝐻𝑧
150
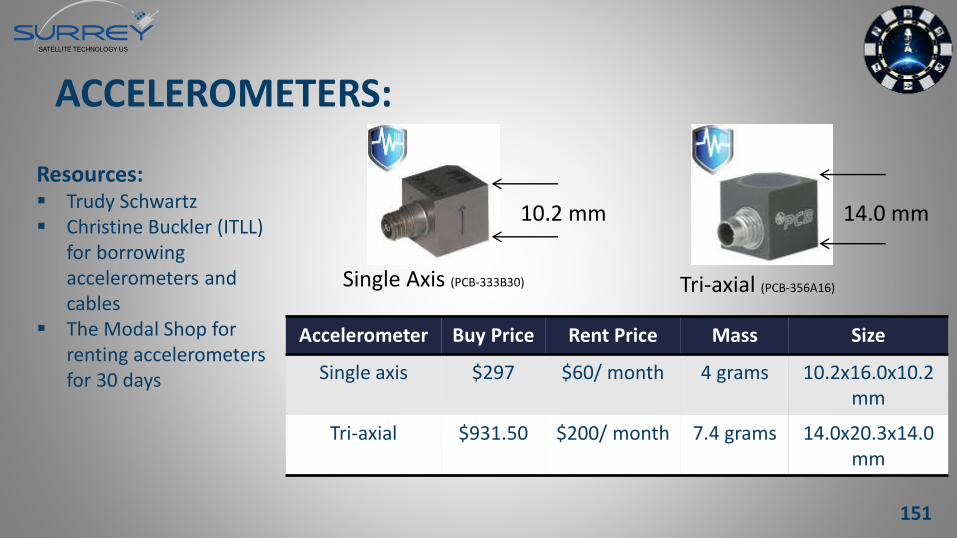
ACCELEROMETERS:
Single Axis (PCB-333B30) Tri-axial (PCB-356A16)
Accelerometer Buy Price Rent Price Mass Size
Single axis $297 $60/ month 4 grams 10.2x16.0x10.2mm
Tri-axial $931.50 $200/ month 7.4 grams 14.0x20.3x14.0 mm
Resources: Trudy Schwartz Christine Buckler (ITLL)
for borrowing accelerometers and cables
The Modal Shop for renting accelerometers for 30 days
10.2 mm 14.0 mm
151
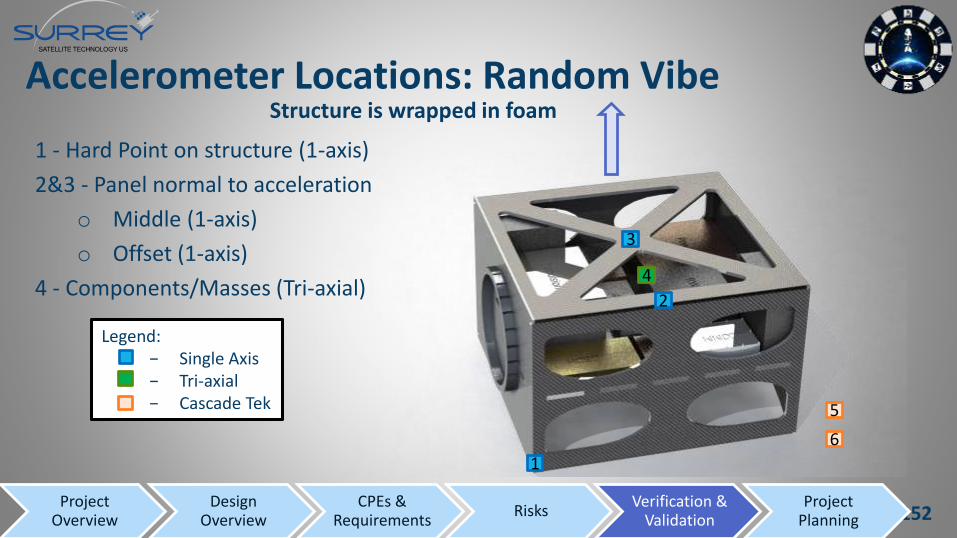
Accelerometer Locations: Random Vibe
1 - Hard Point on structure (1-axis)
2&3 - Panel normal to acceleration
o Middle (1-axis)
o Offset (1-axis)
4 - Components/Masses (Tri-axial)
1
2
4
3
5
6
Legend: − Single Axis− Tri-axial − Cascade Tek
Structure is wrapped in foam
152Project
OverviewDesign
OverviewCPEs &
Requirements Risks
Verification & Validation
Project Planning
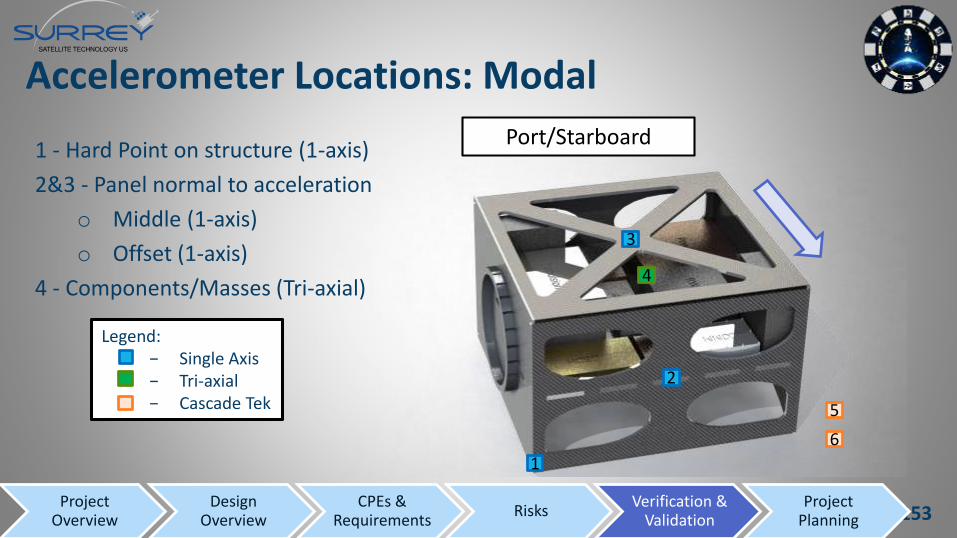
Accelerometer Locations: Modal
1 - Hard Point on structure (1-axis)
2&3 - Panel normal to acceleration
o Middle (1-axis)
o Offset (1-axis)
4 - Components/Masses (Tri-axial)
1
2
4
3
5
6
Legend: − Single Axis− Tri-axial − Cascade Tek
153Project
OverviewDesign
OverviewCPEs &
Requirements Risks
Verification & Validation
Project Planning
Port/Starboard
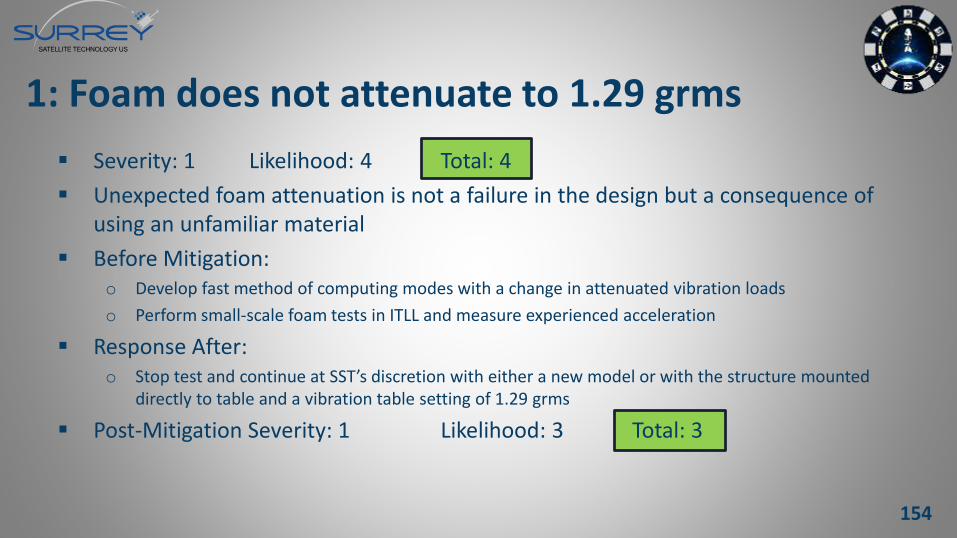
1: Foam does not attenuate to 1.29 grms
Severity: 1 Likelihood: 4 Total: 4
Unexpected foam attenuation is not a failure in the design but a consequence of using an unfamiliar material
Before Mitigation:o Develop fast method of computing modes with a change in attenuated vibration loads
o Perform small-scale foam tests in ITLL and measure experienced acceleration
Response After:o Stop test and continue at SST’s discretion with either a new model or with the structure mounted
directly to table and a vibration table setting of 1.29 grms
Post-Mitigation Severity: 1 Likelihood: 3 Total: 3
154
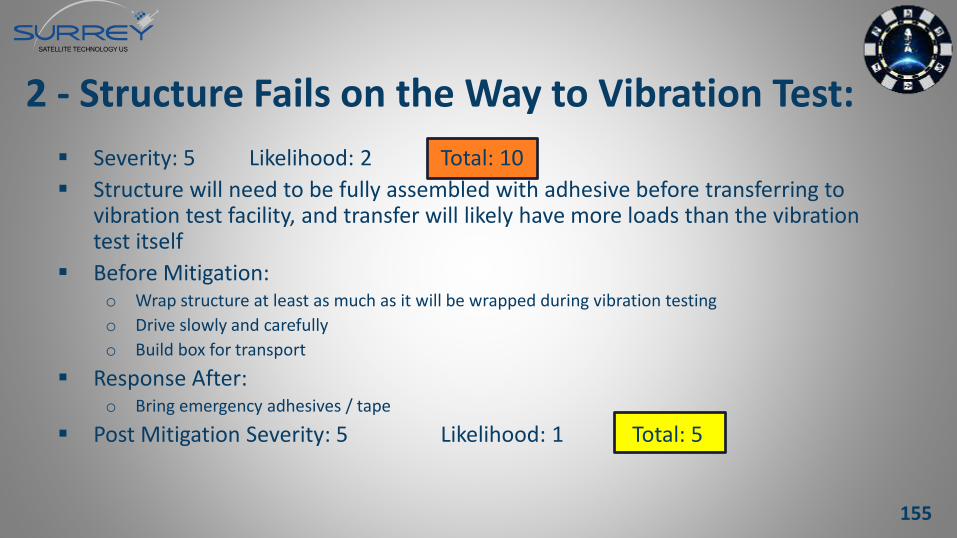
Severity: 5 Likelihood: 2 Total: 10
Structure will need to be fully assembled with adhesive before transferring to vibration test facility, and transfer will likely have more loads than the vibration test itself
Before Mitigation:o Wrap structure at least as much as it will be wrapped during vibration testing
o Drive slowly and carefully
o Build box for transport
Response After:o Bring emergency adhesives / tape
Post Mitigation Severity: 5 Likelihood: 1 Total: 5
2 - Structure Fails on the Way to Vibration Test:
155
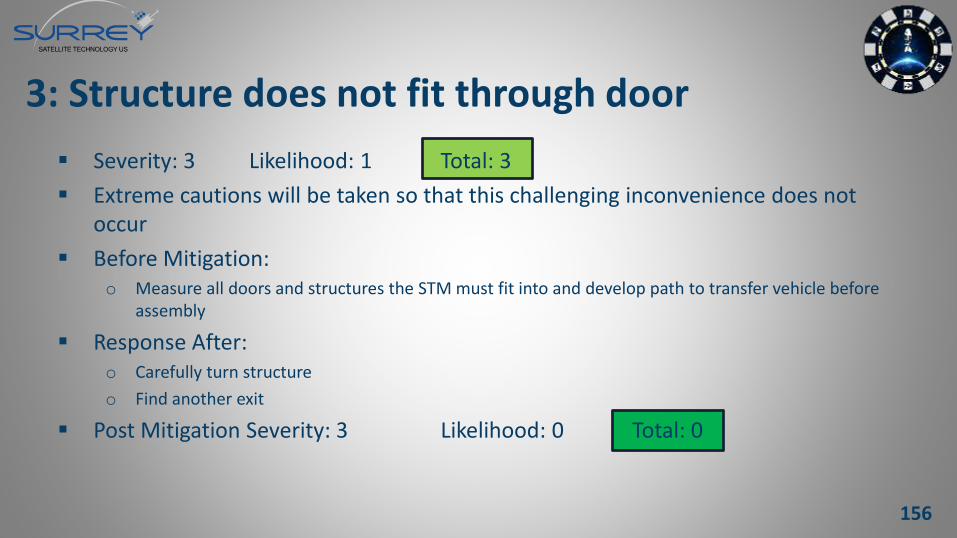
Severity: 3 Likelihood: 1 Total: 3
Extreme cautions will be taken so that this challenging inconvenience does not occur
Before Mitigation:o Measure all doors and structures the STM must fit into and develop path to transfer vehicle before
assembly
Response After:o Carefully turn structure
o Find another exit
Post Mitigation Severity: 3 Likelihood: 0 Total: 0
3: Structure does not fit through door
156
Severity: 4 Likelihood: 2 Total: 8
Timeline depends on having the panels early in the assembly process
Before Mitigation:o Order materials as soon as possible after CDR
o Contact manufacturing company frequently to verify delivery
Response After:o Shorten timeline for the rest of manufacturing
o Attempt to use similar material that is readily available for worst-case
Post Mitigation Severity: 3 Likelihood: 2 Total: 6
4: Materials are not received on time
157
5: DAQ System data is noisy
Severity: 2 Likelihood: 3 Total: 6
DAQ system has many complex systems that need to be integrated together and test for noise before going to vibration test where more unexpected noise can be incorporated
Before Mitigation:o Test completed DAQ system on ITLL vibration table and analyze results
o Communicate with CascadeTek about what signal effects to expect
Response After:o Apply software filter to data after test day
Post Mitigation Severity: 2 Likelihood: 1 Total: 2
158
6: DAQ system cannot save data
Severity: 5 Likelihood: 1 Total: 5
File sizes for test are large and also need to ensure permissions are correct for software to be used on any computer
Before Mitigation:o Test software with fast data transfer on as many Windows computers as possible
Response After:o Attempt to retest or use CascadeTek’s data to complete requirements
Post Mitigation Severity: 2 Likelihood: 1 Total: 2
159
7: Manufactured Carbon Fiber panels are frayed
Severity: 2 Likelihood: 3 Total: 6
If edge-cutting is performed by team, many imperfections could be created
Before Mitigation:o Manufacture test pieces
o Develop metric to evaluate what imperfections are acceptable
Response After:o Use spare pieces to manufacture again
o Re-model the structure with these imperfections and test if the imperfections do not cause unexpected failure
Post Mitigation Severity: 1 Likelihood: 3 Total: 3
160
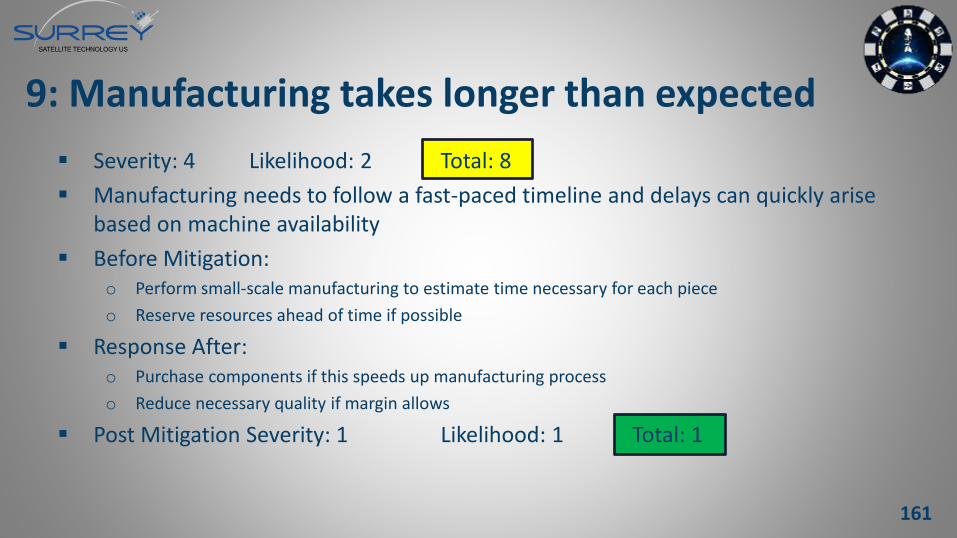
9: Manufacturing takes longer than expected
Severity: 4 Likelihood: 2 Total: 8
Manufacturing needs to follow a fast-paced timeline and delays can quickly arise based on machine availability
Before Mitigation:o Perform small-scale manufacturing to estimate time necessary for each piece
o Reserve resources ahead of time if possible
Response After:o Purchase components if this speeds up manufacturing process
o Reduce necessary quality if margin allows
Post Mitigation Severity: 1 Likelihood: 1 Total: 1
161
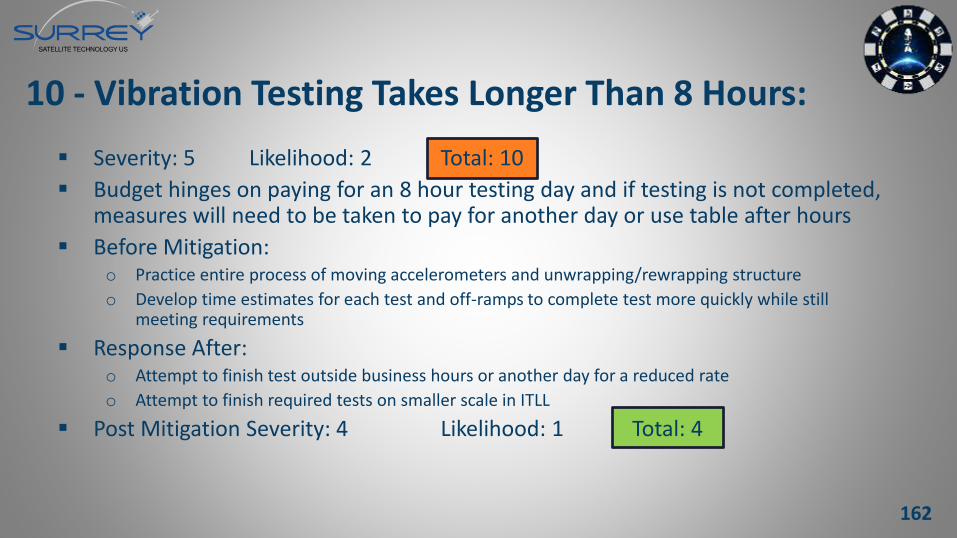
10 - Vibration Testing Takes Longer Than 8 Hours:
Severity: 5 Likelihood: 2 Total: 10
Budget hinges on paying for an 8 hour testing day and if testing is not completed, measures will need to be taken to pay for another day or use table after hours
Before Mitigation:o Practice entire process of moving accelerometers and unwrapping/rewrapping structure
o Develop time estimates for each test and off-ramps to complete test more quickly while still meeting requirements
Response After:o Attempt to finish test outside business hours or another day for a reduced rate
o Attempt to finish required tests on smaller scale in ITLL
Post Mitigation Severity: 4 Likelihood: 1 Total: 4
162
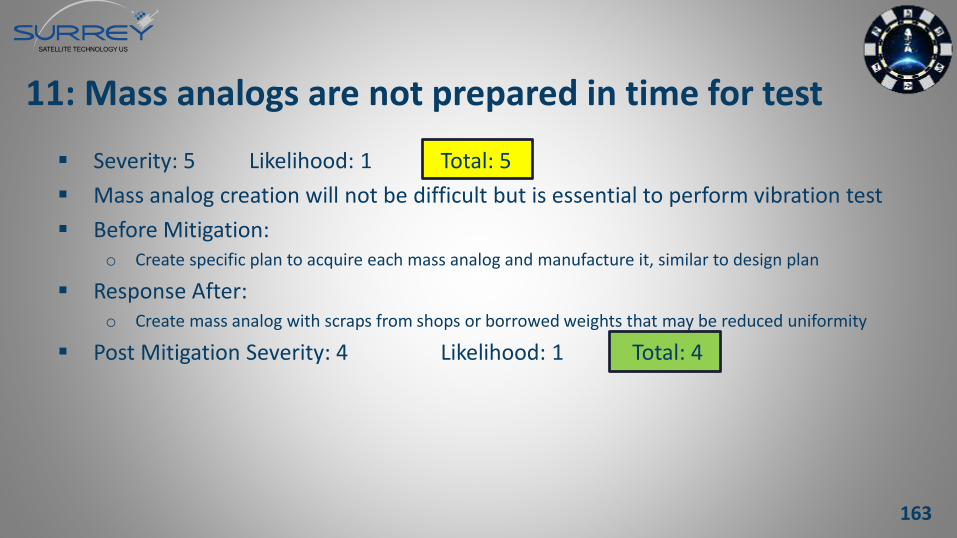
11: Mass analogs are not prepared in time for test
Severity: 5 Likelihood: 1 Total: 5
Mass analog creation will not be difficult but is essential to perform vibration test
Before Mitigation:o Create specific plan to acquire each mass analog and manufacture it, similar to design plan
Response After:o Create mass analog with scraps from shops or borrowed weights that may be reduced uniformity
Post Mitigation Severity: 4 Likelihood: 1 Total: 4
163
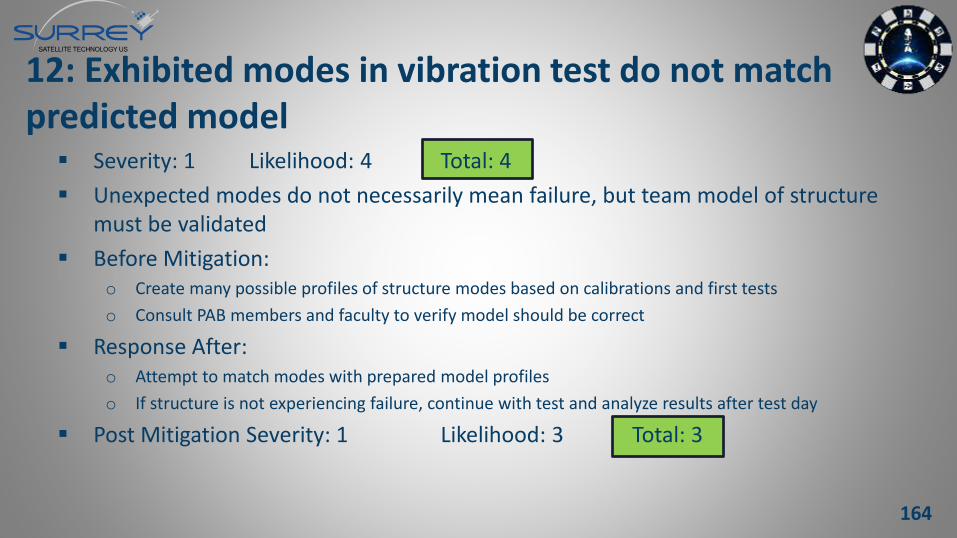
12: Exhibited modes in vibration test do not match predicted model
Severity: 1 Likelihood: 4 Total: 4
Unexpected modes do not necessarily mean failure, but team model of structure must be validated
Before Mitigation:o Create many possible profiles of structure modes based on calibrations and first tests
o Consult PAB members and faculty to verify model should be correct
Response After:o Attempt to match modes with prepared model profiles
o If structure is not experiencing failure, continue with test and analyze results after test day
Post Mitigation Severity: 1 Likelihood: 3 Total: 3
164
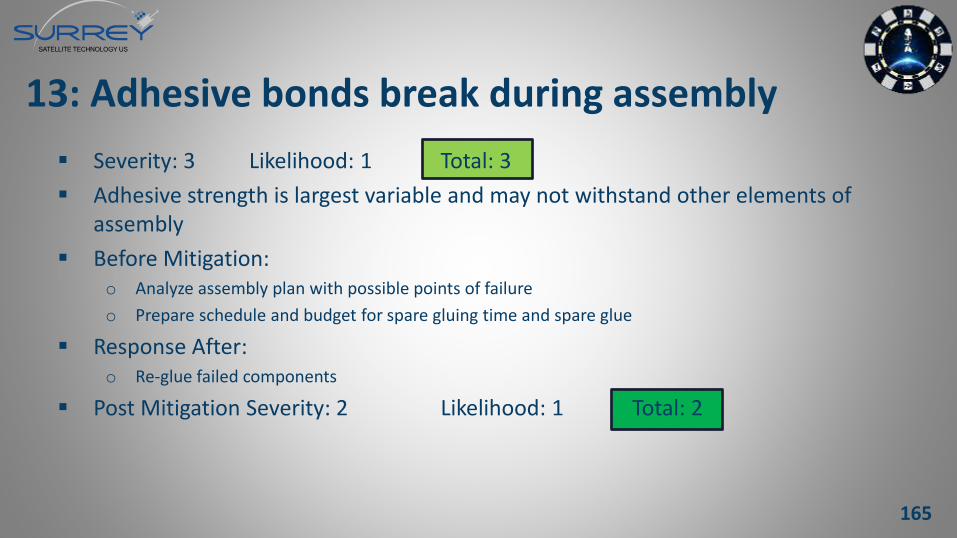
13: Adhesive bonds break during assembly
Severity: 3 Likelihood: 1 Total: 3
Adhesive strength is largest variable and may not withstand other elements of assembly
Before Mitigation:o Analyze assembly plan with possible points of failure
o Prepare schedule and budget for spare gluing time and spare glue
Response After:o Re-glue failed components
Post Mitigation Severity: 2 Likelihood: 1 Total: 2
165
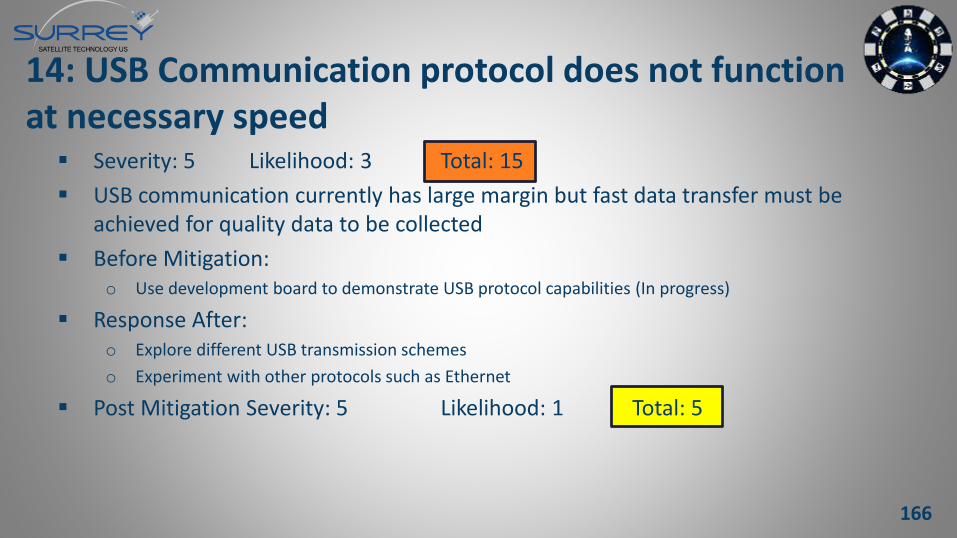
14: USB Communication protocol does not function at necessary speed
Severity: 5 Likelihood: 3 Total: 15
USB communication currently has large margin but fast data transfer must be achieved for quality data to be collected
Before Mitigation:o Use development board to demonstrate USB protocol capabilities (In progress)
Response After:o Explore different USB transmission schemes
o Experiment with other protocols such as Ethernet
Post Mitigation Severity: 5 Likelihood: 1 Total: 5
166
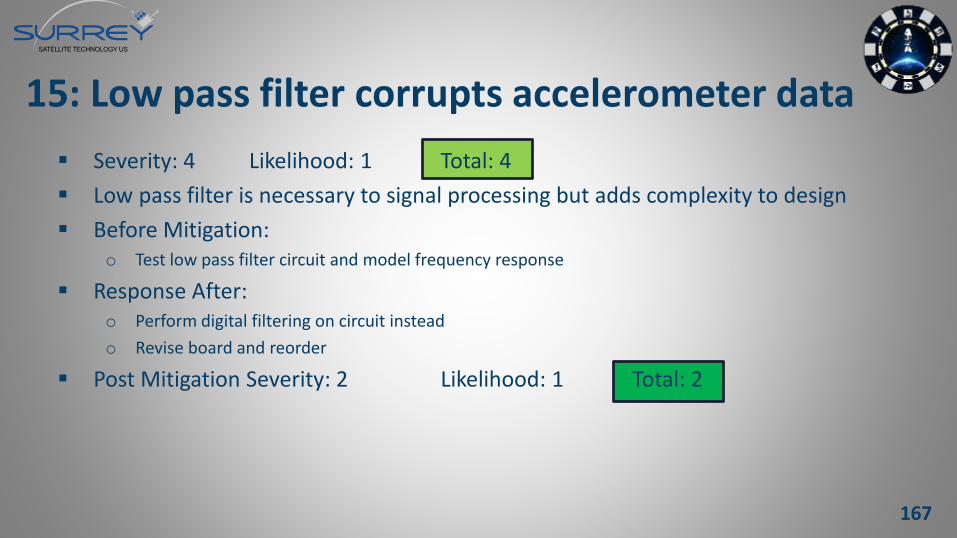
15: Low pass filter corrupts accelerometer data
Severity: 4 Likelihood: 1 Total: 4
Low pass filter is necessary to signal processing but adds complexity to design
Before Mitigation:o Test low pass filter circuit and model frequency response
Response After:o Perform digital filtering on circuit instead
o Revise board and reorder
Post Mitigation Severity: 2 Likelihood: 1 Total: 2
167
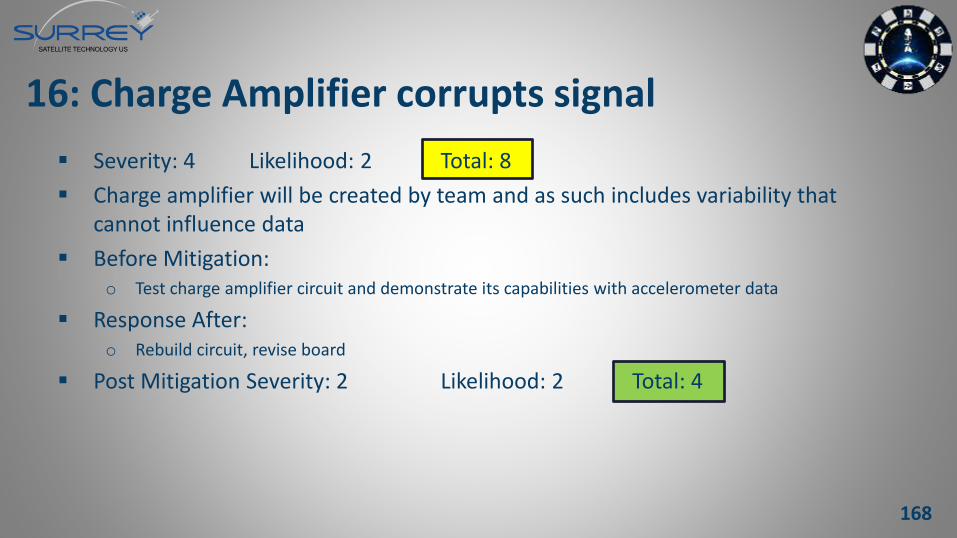
16: Charge Amplifier corrupts signal
Severity: 4 Likelihood: 2 Total: 8
Charge amplifier will be created by team and as such includes variability that cannot influence data
Before Mitigation:o Test charge amplifier circuit and demonstrate its capabilities with accelerometer data
Response After:o Rebuild circuit, revise board
Post Mitigation Severity: 2 Likelihood: 2 Total: 4
168
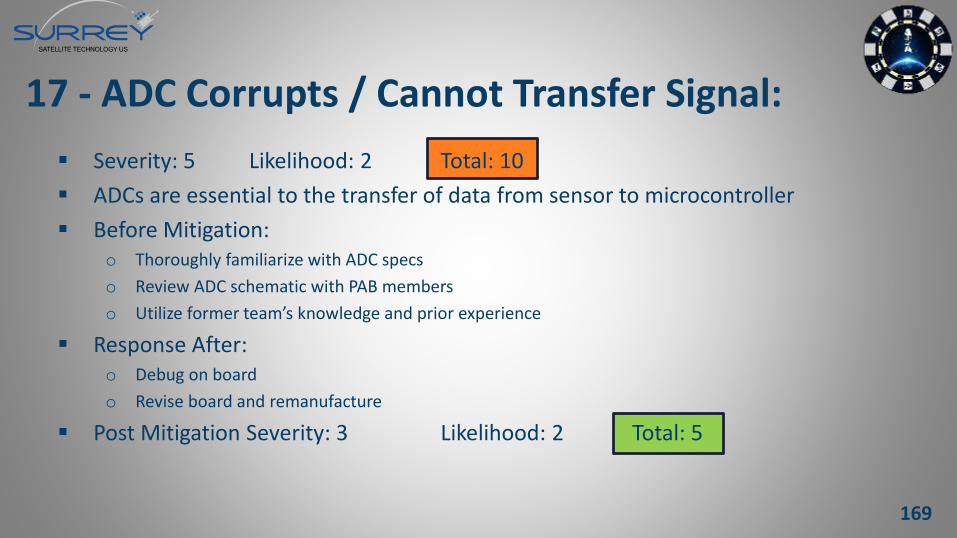
17 - ADC Corrupts / Cannot Transfer Signal:
Severity: 5 Likelihood: 2 Total: 10
ADCs are essential to the transfer of data from sensor to microcontroller
Before Mitigation:o Thoroughly familiarize with ADC specs
o Review ADC schematic with PAB members
o Utilize former team’s knowledge and prior experience
Response After:o Debug on board
o Revise board and remanufacture
Post Mitigation Severity: 3 Likelihood: 2 Total: 5
169
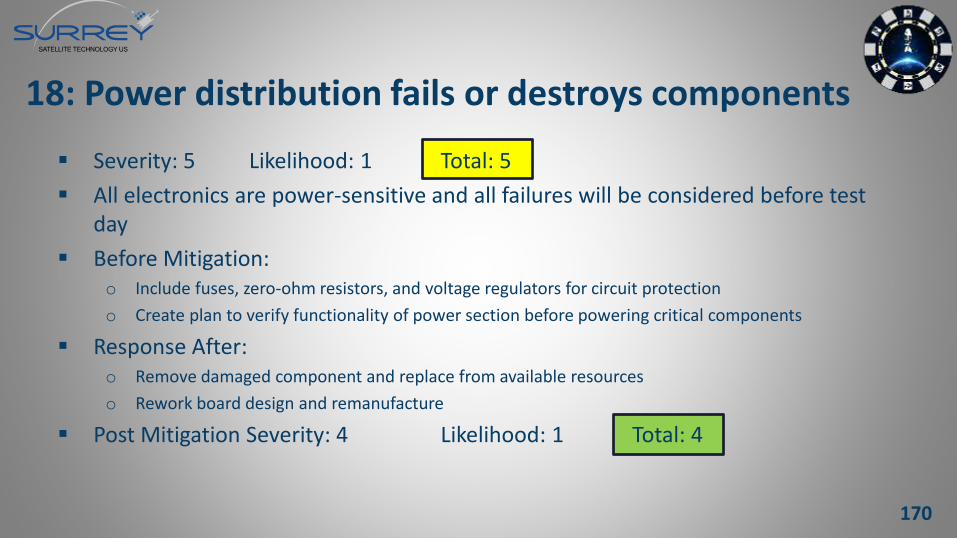
18: Power distribution fails or destroys components
Severity: 5 Likelihood: 1 Total: 5
All electronics are power-sensitive and all failures will be considered before test day
Before Mitigation:o Include fuses, zero-ohm resistors, and voltage regulators for circuit protection
o Create plan to verify functionality of power section before powering critical components
Response After:o Remove damaged component and replace from available resources
o Rework board design and remanufacture
Post Mitigation Severity: 4 Likelihood: 1 Total: 4
170
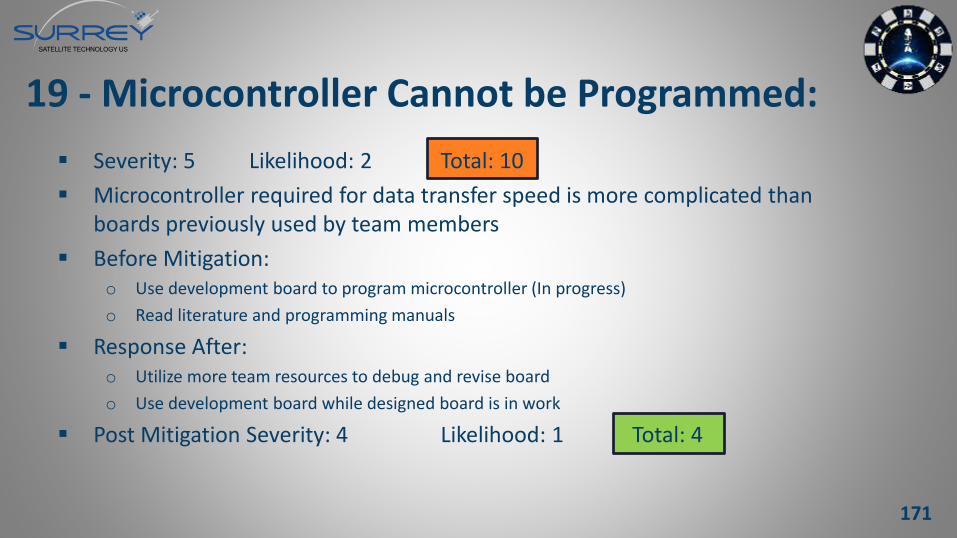
19 - Microcontroller Cannot be Programmed:
Severity: 5 Likelihood: 2 Total: 10
Microcontroller required for data transfer speed is more complicated than boards previously used by team members
Before Mitigation:o Use development board to program microcontroller (In progress)
o Read literature and programming manuals
Response After:o Utilize more team resources to debug and revise board
o Use development board while designed board is in work
Post Mitigation Severity: 4 Likelihood: 1 Total: 4
171
Background for ANSYS Model
Composite beams
o Bending Tests (refine material properties)
o Modal Sweep (confirm modelling capability)
Validation of complex-geometry predictions
172
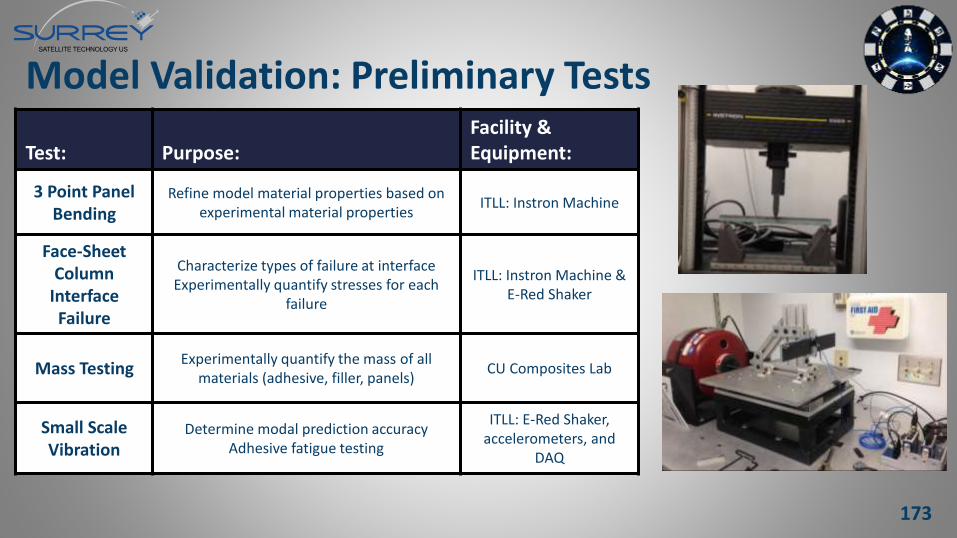
Model Validation: Preliminary Tests
Test: Purpose:Facility & Equipment:
3 Point Panel Bending
Refine model material properties based on experimental material properties
ITLL: Instron Machine
Face-Sheet Column
Interface Failure
Characterize types of failure at interfaceExperimentally quantify stresses for each
failure
ITLL: Instron Machine & E-Red Shaker
Mass TestingExperimentally quantify the mass of all
materials (adhesive, filler, panels)CU Composites Lab
Small Scale Vibration
Determine modal prediction accuracyAdhesive fatigue testing
ITLL: E-Red Shaker, accelerometers, and
DAQ
173
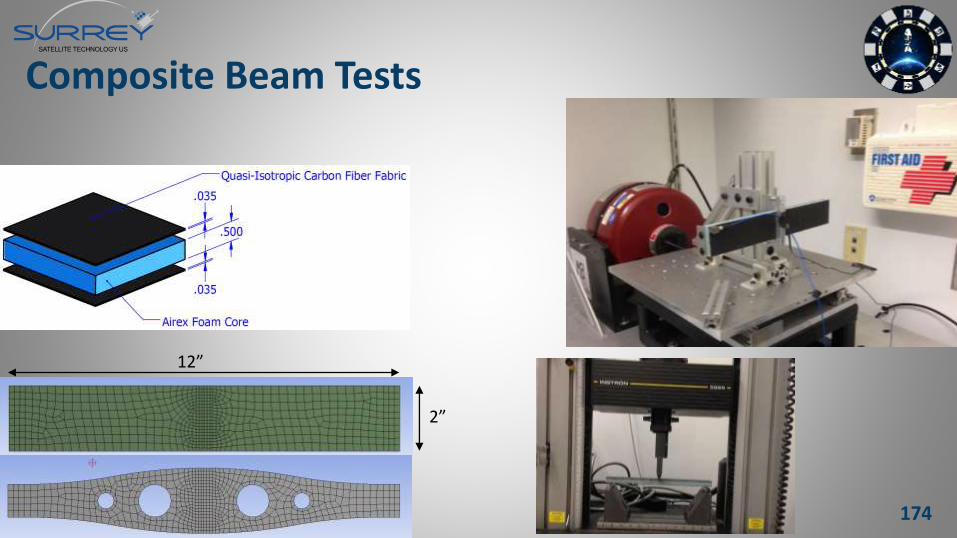
Composite Beam Tests
12”
2”
174
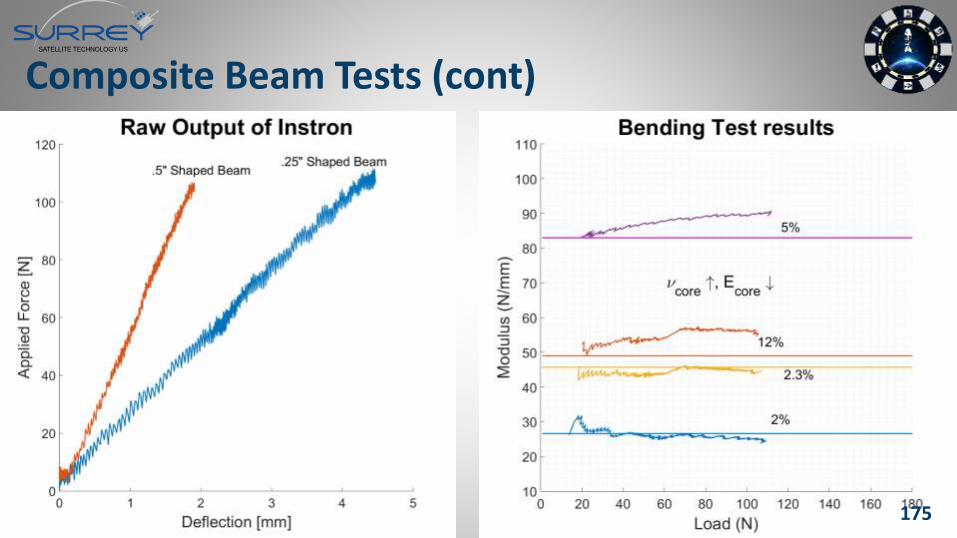
Composite Beam Tests (cont)
175
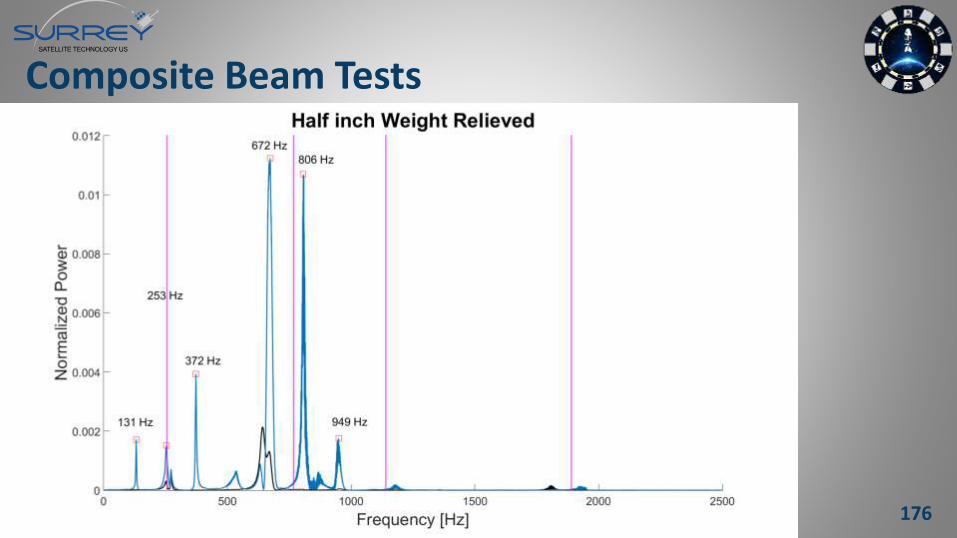
Composite Beam Tests
Add Frequency Information Here
176
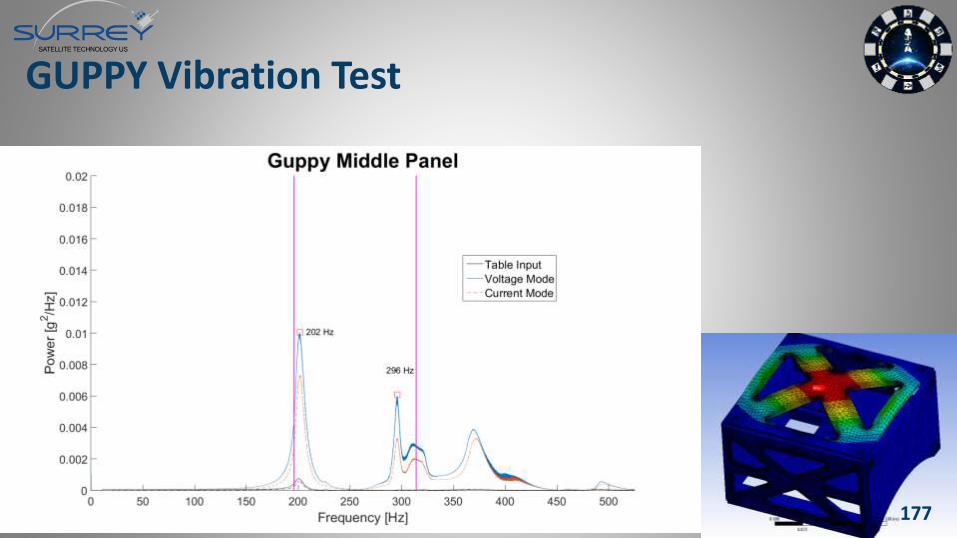
GUPPY Vibration Test
177
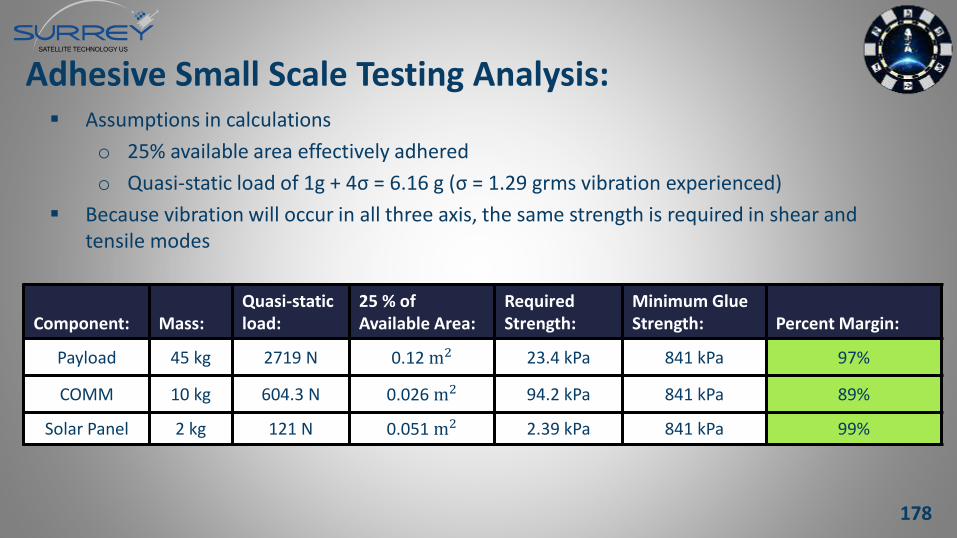
Assumptions in calculations
o 25% available area effectively adhered
o Quasi-static load of 1g + 4σ = 6.16 g (σ = 1.29 grms vibration experienced)
Because vibration will occur in all three axis, the same strength is required in shear and tensile modes
Adhesive Small Scale Testing Analysis:
Component: Mass:Quasi-staticload:
25 % of Available Area:
Required Strength:
Minimum Glue Strength: Percent Margin:
Payload 45 kg 2719 N 0.12 m2 23.4 kPa 841 kPa 97%
COMM 10 kg 604.3 N 0.026 m2 94.2 kPa 841 kPa 89%
Solar Panel 2 kg 121 N 0.051 m2 2.39 kPa 841 kPa 99%
178
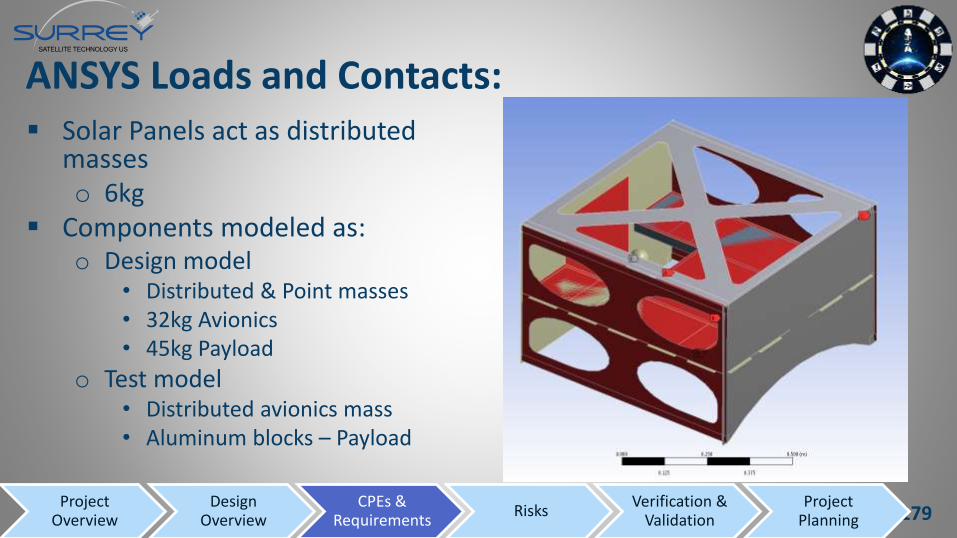
ANSYS Loads and Contacts: Solar Panels act as distributed
masseso 6kg
Components modeled as:o Design model
• Distributed & Point masses• 32kg Avionics• 45kg Payload
o Test model• Distributed avionics mass • Aluminum blocks – Payload
179Project
OverviewDesign
OverviewCPEs &
Requirements Risks
Verification & Validation
Project Planning
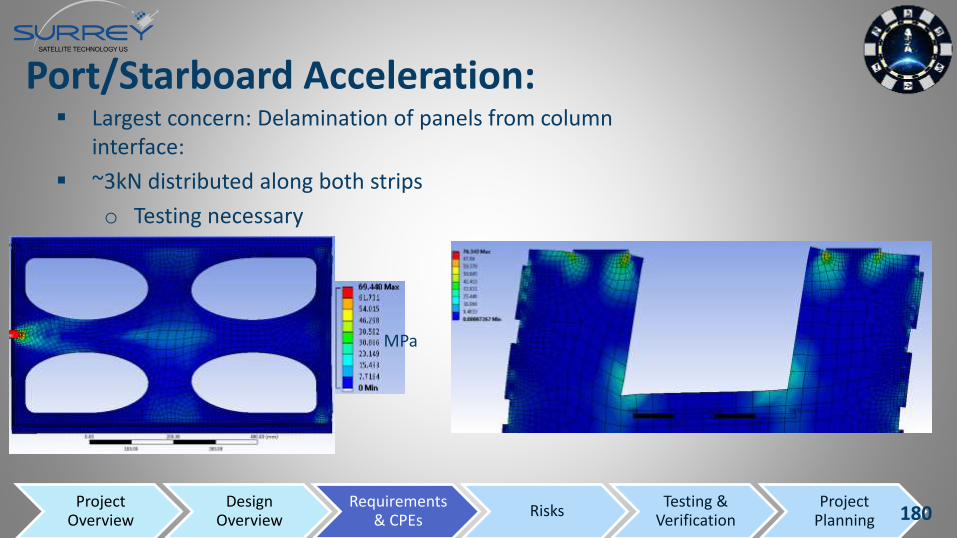
Port/Starboard Acceleration: Largest concern: Delamination of panels from column
interface:
~3kN distributed along both strips
o Testing necessary
MPa
Project Overview
Design Overview
Requirements & CPEs
RisksTesting &
VerificationProject
Planning 180
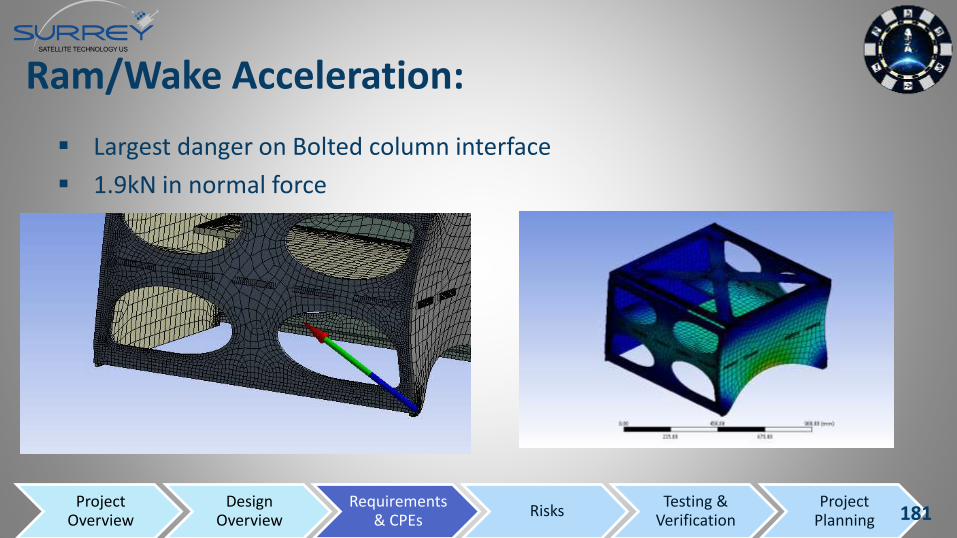
Ram/Wake Acceleration:
Largest danger on Bolted column interface
1.9kN in normal force
Project Overview
Design Overview
Requirements & CPEs
RisksTesting &
VerificationProject
Planning 181
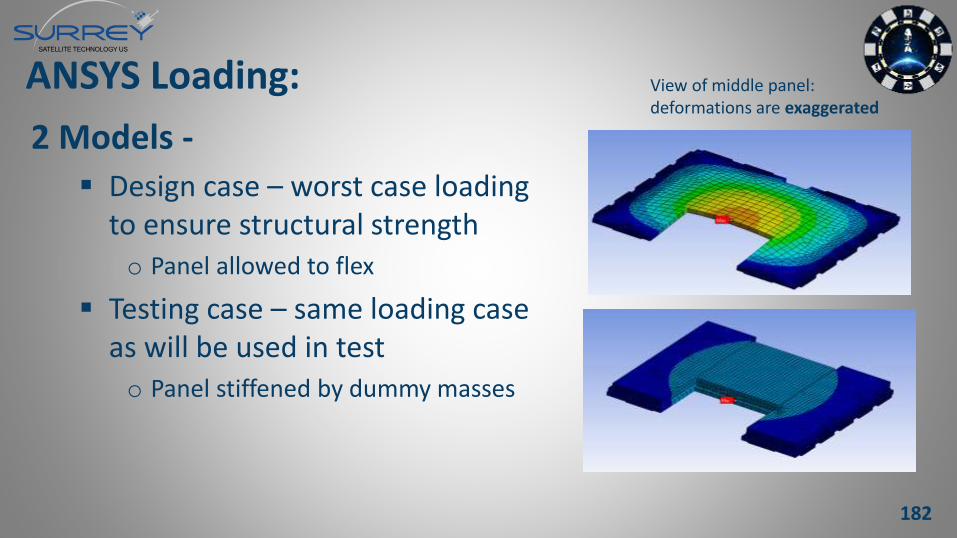
ANSYS Loading:
2 Models -
Design case – worst case loading to ensure structural strengtho Panel allowed to flex
Testing case – same loading case as will be used in testo Panel stiffened by dummy masses
View of middle panel:deformations are exaggerated
182
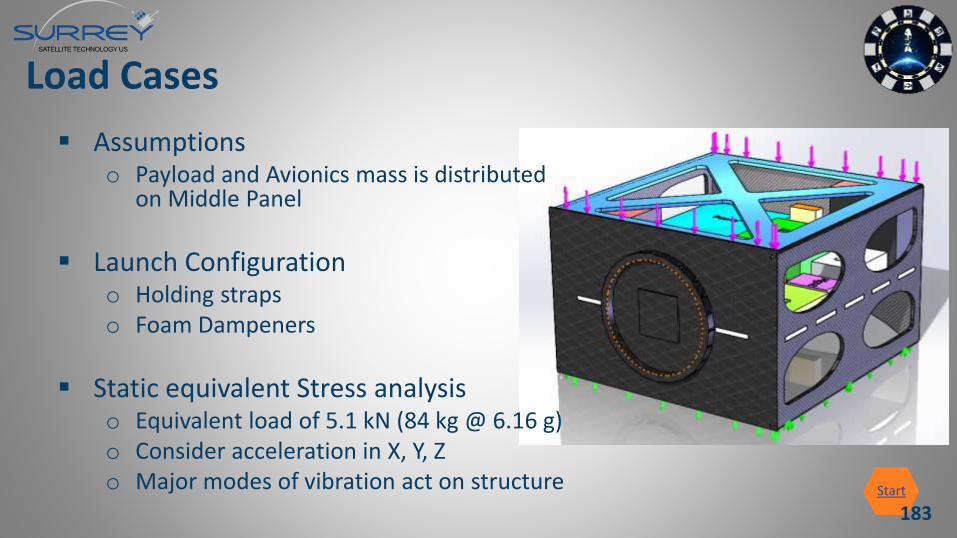
Load Cases
Assumptionso Payload and Avionics mass is distributed
on Middle Panel
Launch Configurationo Holding strapso Foam Dampeners
Static equivalent Stress analysiso Equivalent load of 5.1 kN (84 kg @ 6.16 g)o Consider acceleration in X, Y, Zo Major modes of vibration act on structure Start
183
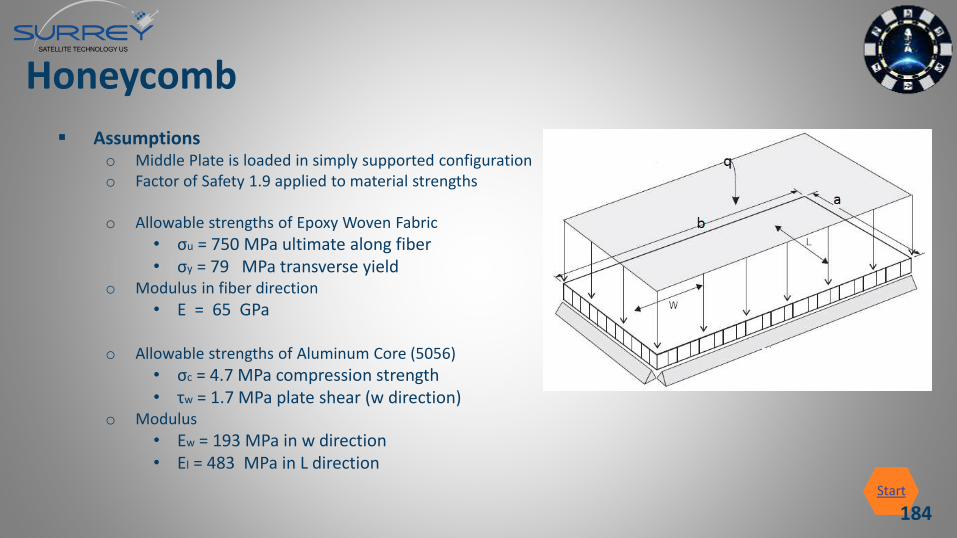
Honeycomb
Assumptionso Middle Plate is loaded in simply supported configurationo Factor of Safety 1.9 applied to material strengths
o Allowable strengths of Epoxy Woven Fabric
• σu = 750 MPa ultimate along fiber• σy = 79 MPa transverse yield
o Modulus in fiber direction
• E = 65 GPa
o Allowable strengths of Aluminum Core (5056)
• σc = 4.7 MPa compression strength• τw = 1.7 MPa plate shear (w direction)
o Modulus
• Ew = 193 MPa in w direction• El = 483 MPa in L direction
Start
184
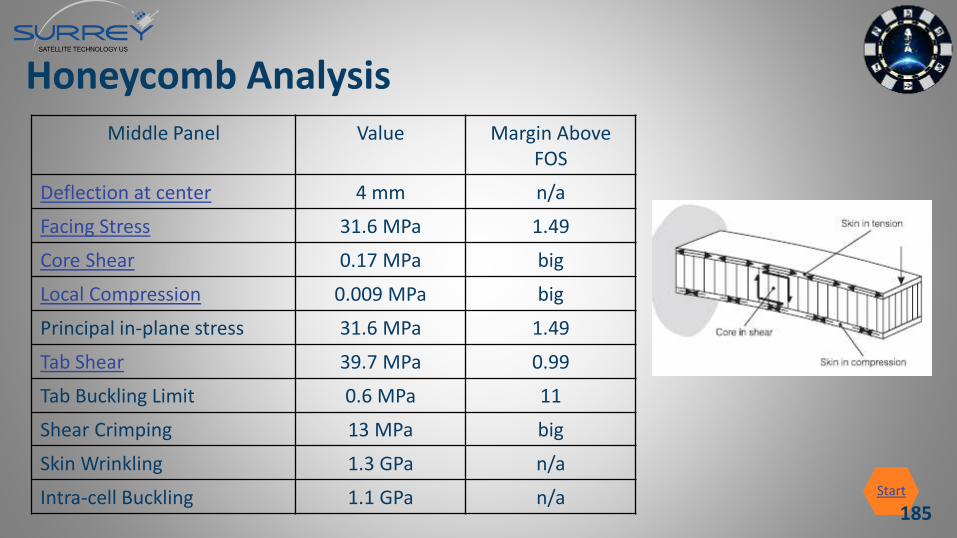
Honeycomb Analysis
Start
Middle Panel Value Margin Above FOS
Deflection at center 4 mm n/a
Facing Stress 31.6 MPa 1.49
Core Shear 0.17 MPa big
Local Compression 0.009 MPa big
Principal in-plane stress 31.6 MPa 1.49
Tab Shear 39.7 MPa 0.99
Tab Buckling Limit 0.6 MPa 11
Shear Crimping 13 MPa big
Skin Wrinkling 1.3 GPa n/a
Intra-cell Buckling 1.1 GPa n/a185
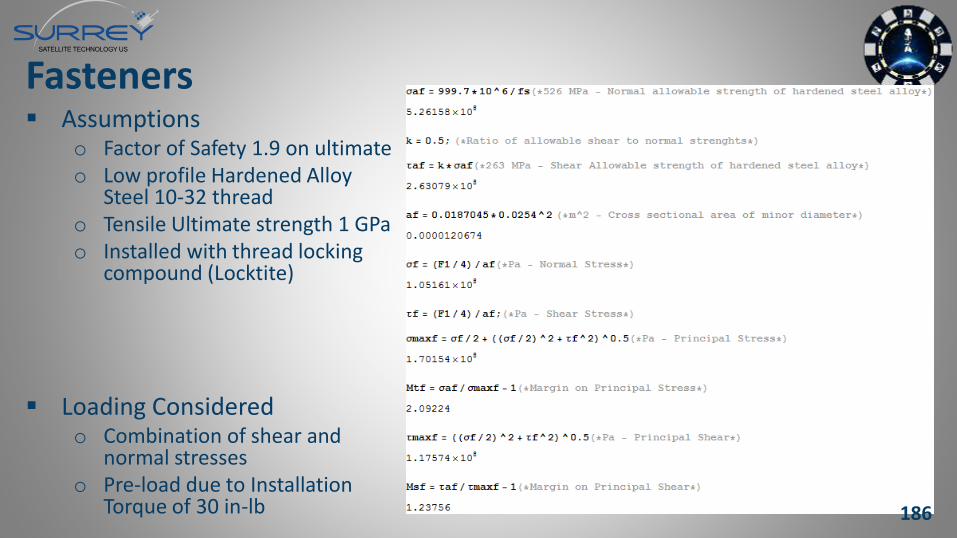
Fasteners Assumptions
o Factor of Safety 1.9 on ultimateo Low profile Hardened Alloy
Steel 10-32 threado Tensile Ultimate strength 1 GPao Installed with thread locking
compound (Locktite)
Loading Consideredo Combination of shear and
normal stresseso Pre-load due to Installation
Torque of 30 in-lb 186
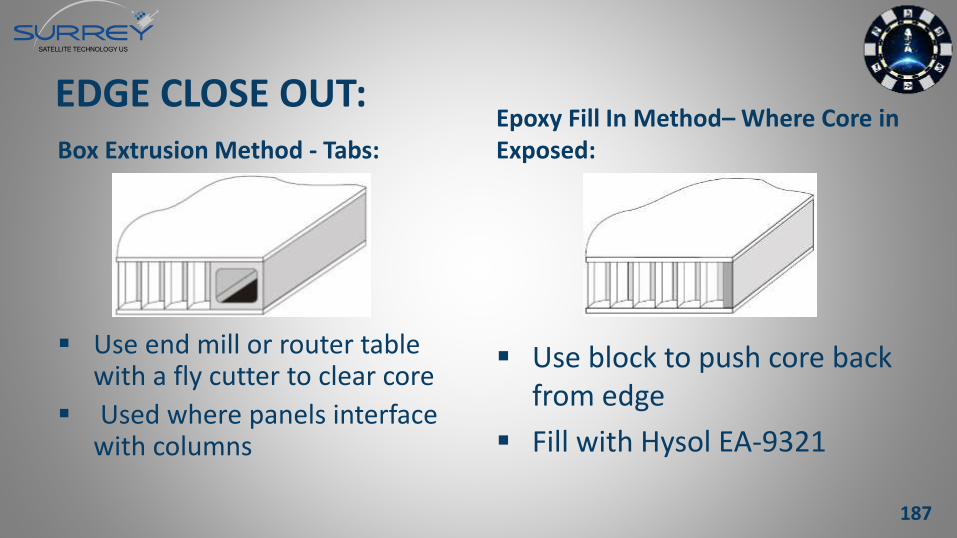
Box Extrusion Method - Tabs:
Use end mill or router table with a fly cutter to clear core
Used where panels interface with columns
Epoxy Fill In Method– Where Core in Exposed:
Use block to push core back from edge
Fill with Hysol EA-9321
EDGE CLOSE OUT:
187

Scotch Weld 3350:
Epoxy Paste Adhesive
Potting Heritage
Testing will be done to determine effectiveness of Scotch Weld 3350 ScotchWeldEC-2216 bond
188
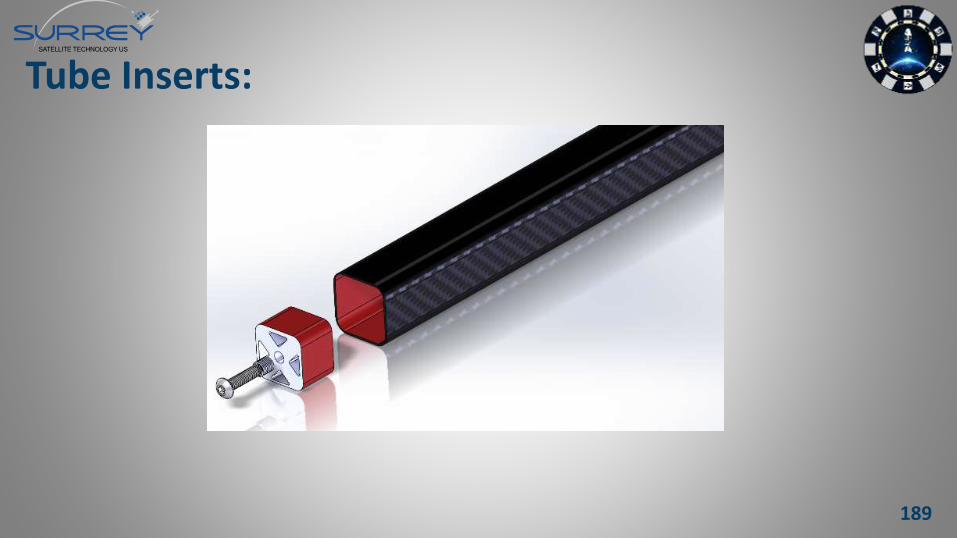
Tube Inserts:
189
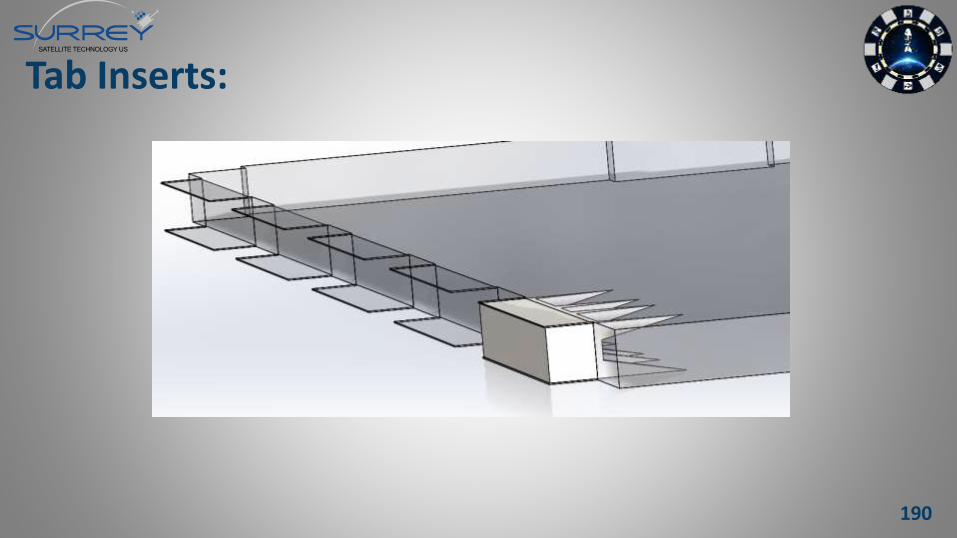
Tab Inserts:
190
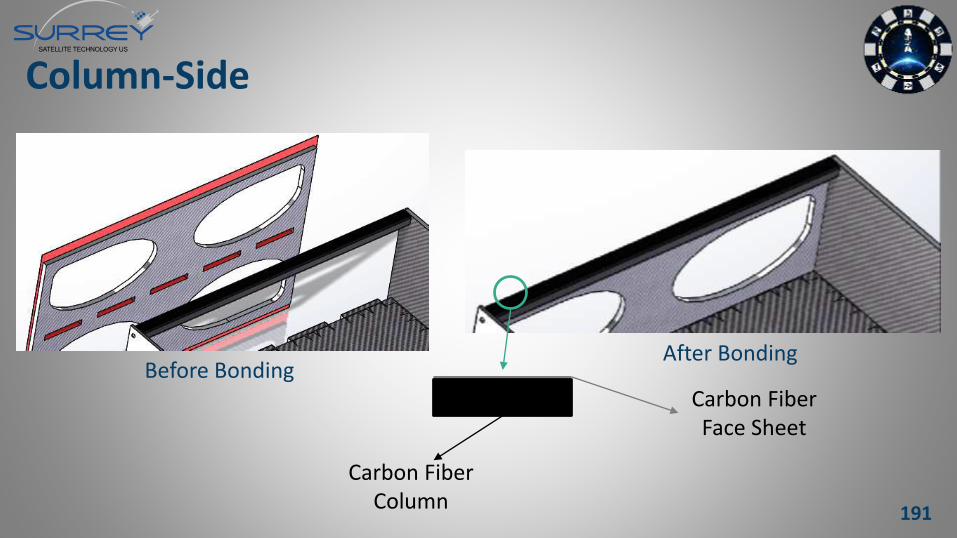
Column-Side
191
Before BondingAfter Bonding
Carbon Fiber Face Sheet
Carbon Fiber Column
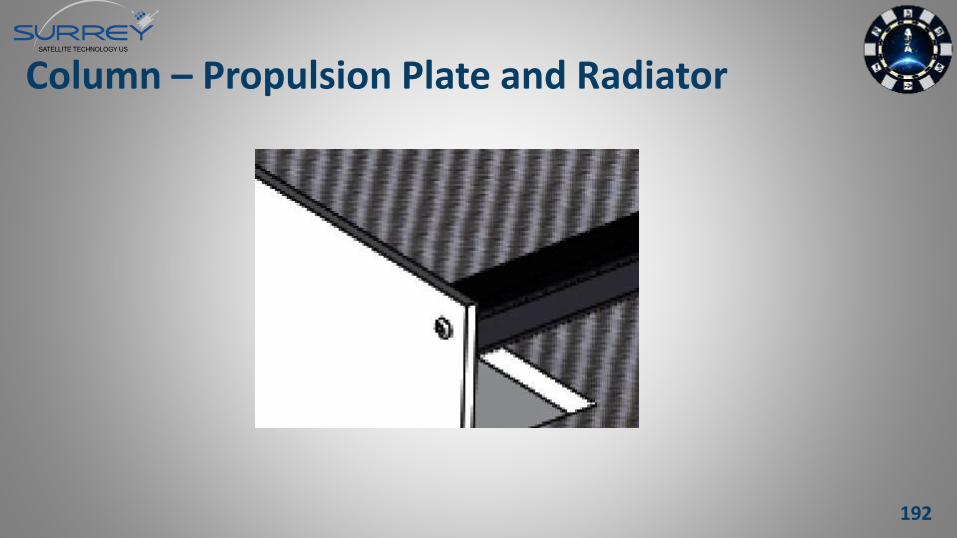
Column – Propulsion Plate and Radiator
192
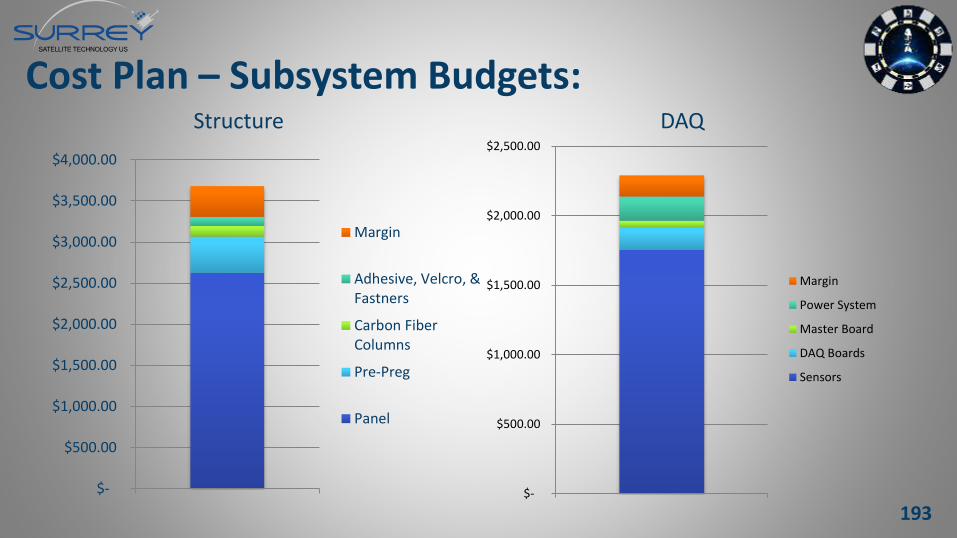
Cost Plan – Subsystem Budgets: Structure DAQ
193
$-
$500.00
$1,000.00
$1,500.00
$2,000.00
$2,500.00
$3,000.00
$3,500.00
$4,000.00
Margin
Adhesive, Velcro, &Fastners
Carbon FiberColumns
Pre-Preg
Panel
$-
$500.00
$1,000.00
$1,500.00
$2,000.00
$2,500.00
Margin
Power System
Master Board
DAQ Boards
Sensors
Uncertainties and Margin Breakdown
DAQ:o PCB – need multiple attempts at printing ($33.00)o Extra parts – redundancy
• Coax Connectors – design cycle:– Choosing -> validating design -> re-choosing
Structure:o Free Aluminum Coreo Adhesive Reliabilityo Free and available mass analogs
194
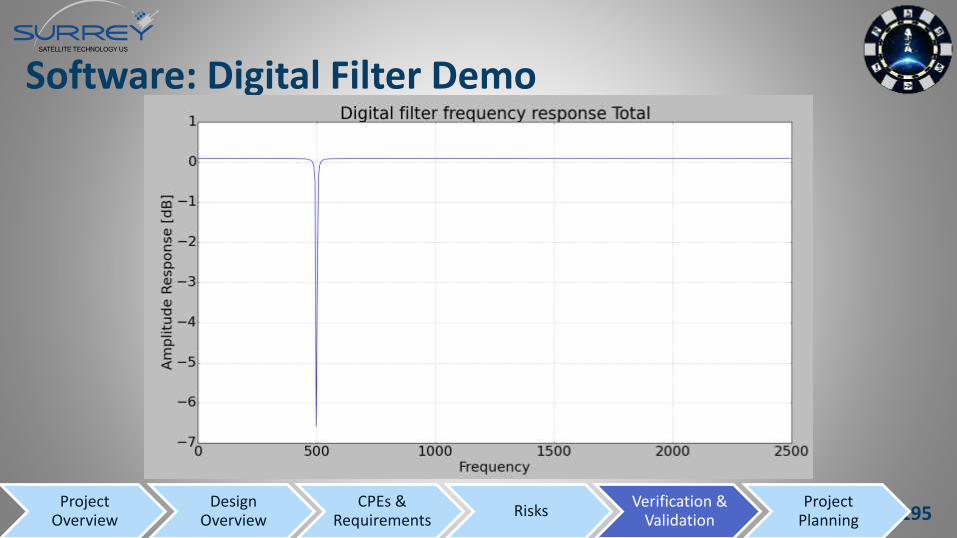
Software: Digital Filter Demo
195Project
OverviewDesign
OverviewCPEs &
Requirements Risks
Verification & Validation
Project Planning
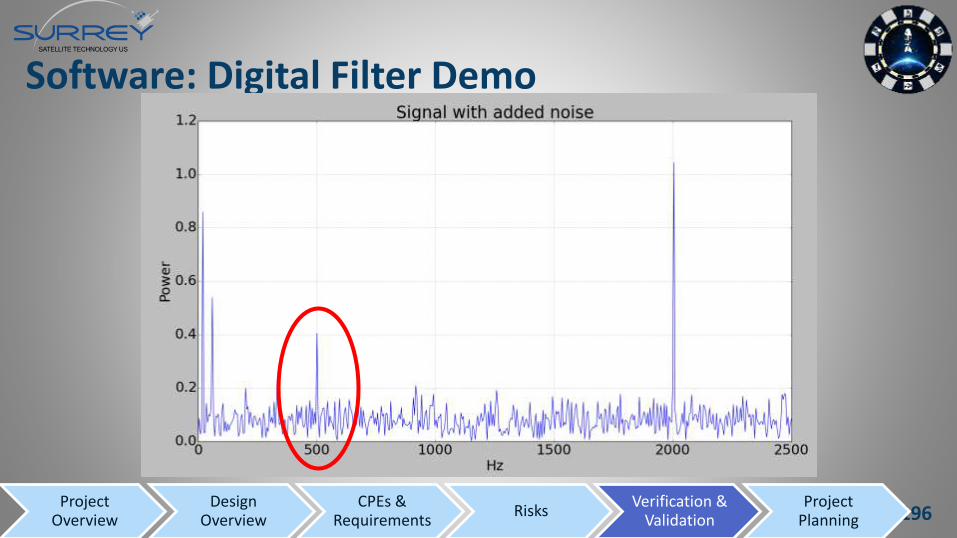
Software: Digital Filter Demo
196Project
OverviewDesign
OverviewCPEs &
Requirements Risks
Verification & Validation
Project Planning

Software: Digital Filter Demo
197Project
OverviewDesign
OverviewCPEs &
Requirements Risks
Verification & Validation
Project Planning
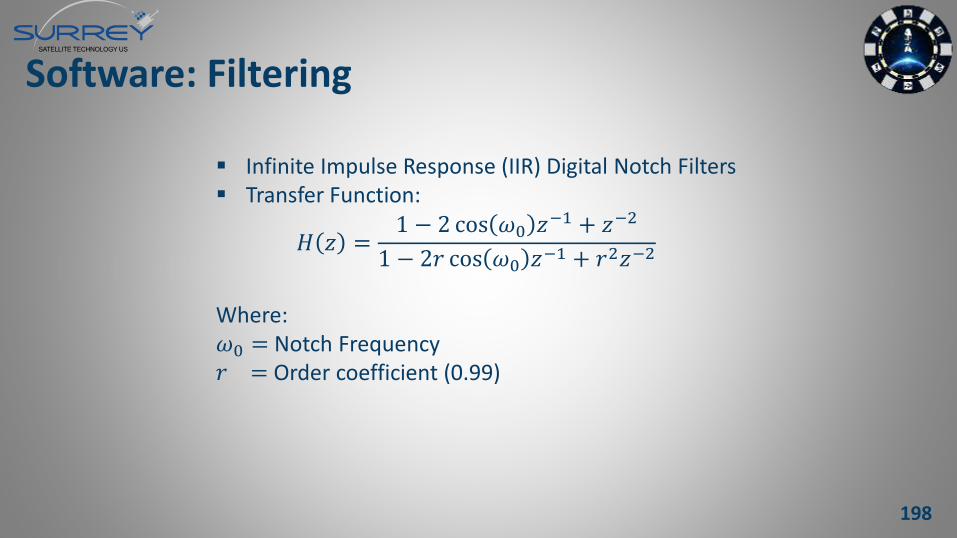
Software: Filtering
Infinite Impulse Response (IIR) Digital Notch Filters Transfer Function:
𝐻 𝑧 =1 − 2 cos 𝜔0 𝑧−1 + 𝑧−2
1 − 2𝑟 cos 𝜔0 𝑧−1 + 𝑟2𝑧−2
Where:𝜔0 = Notch Frequency𝑟 = Order coefficient (0.99)
198
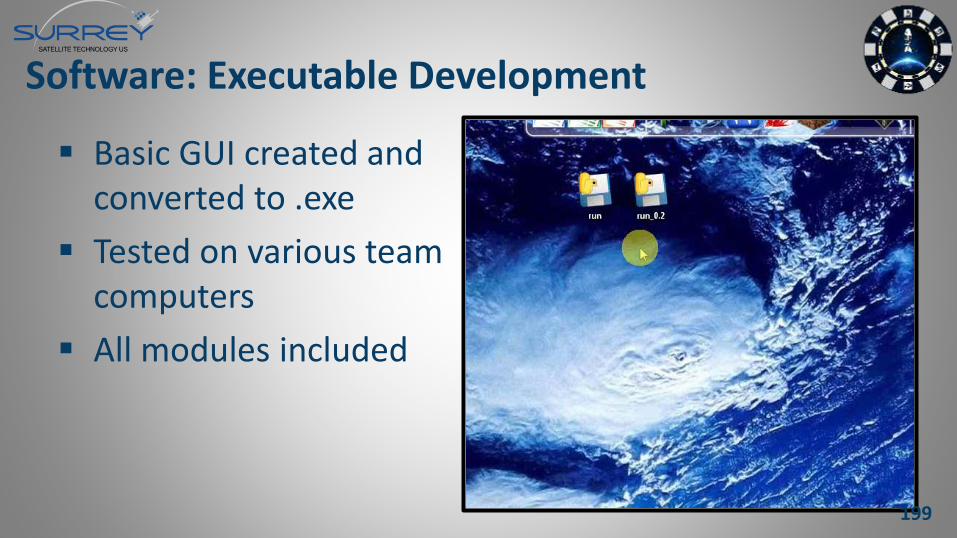
Software: Executable Development
Basic GUI created and converted to .exe
Tested on various team computers
All modules included
199
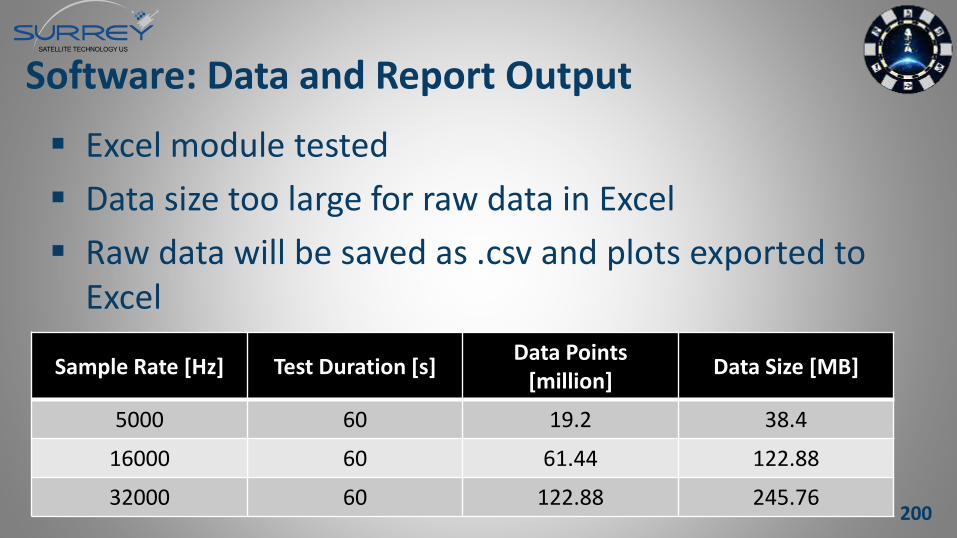
Software: Data and Report Output
Sample Rate [Hz] Test Duration [s]Data Points
[million]Data Size [MB]
5000 60 19.2 38.4
16000 60 61.44 122.88
32000 60 122.88 245.76
Excel module tested
Data size too large for raw data in Excel
Raw data will be saved as .csv and plots exported to Excel
200
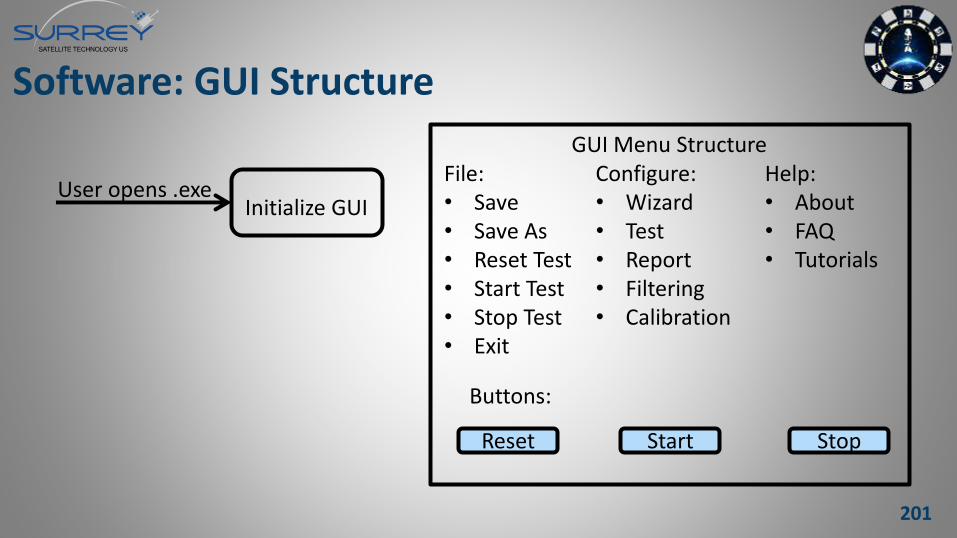
Software: GUI Structure
Initialize GUIUser opens .exe
GUI Menu StructureFile:• Save• Save As• Reset Test• Start Test• Stop Test• Exit
Configure:• Wizard• Test• Report• Filtering• Calibration
Help:• About• FAQ• Tutorials
Buttons:
Reset Start Stop
201
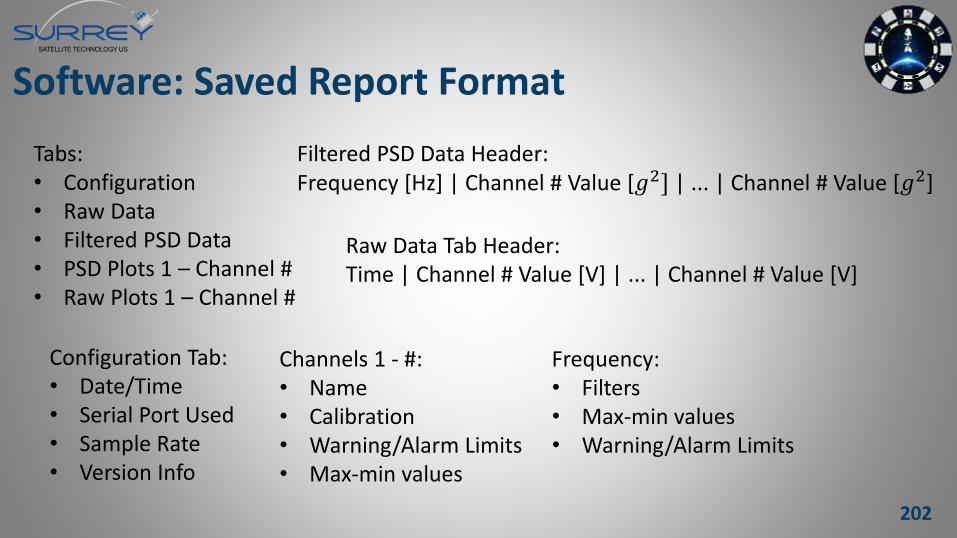
Software: Saved Report Format
Tabs:• Configuration• Raw Data• Filtered PSD Data• PSD Plots 1 – Channel #• Raw Plots 1 – Channel #
Raw Data Tab Header:Time | Channel # Value [V] | ... | Channel # Value [V]
Filtered PSD Data Header:Frequency [Hz] | Channel # Value [𝑔2] | ... | Channel # Value [𝑔2]
Configuration Tab:• Date/Time• Serial Port Used• Sample Rate• Version Info
Channels 1 - #:• Name• Calibration• Warning/Alarm Limits• Max-min values
Frequency:• Filters• Max-min values• Warning/Alarm Limits
202
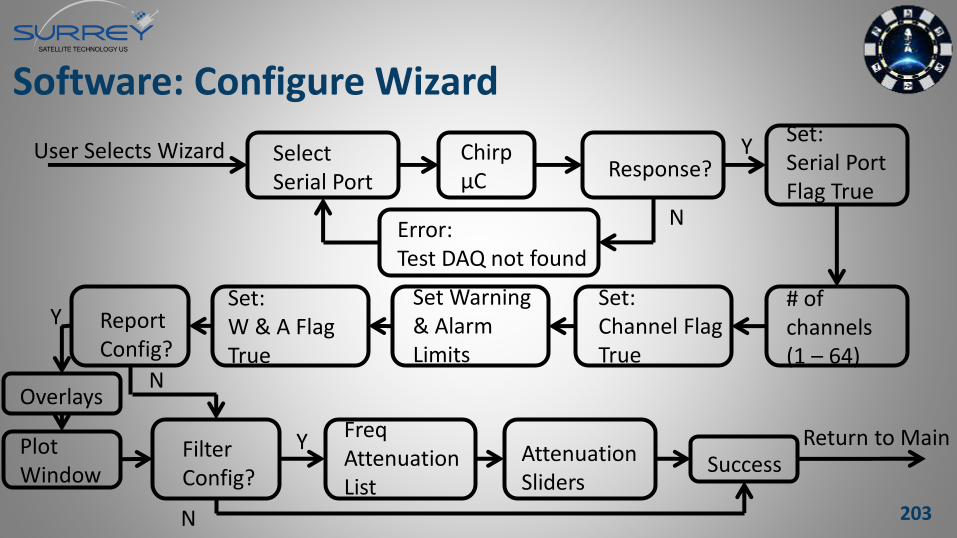
Software: Configure Wizard
User Selects Wizard Select Serial Port
ChirpμC Response?
Error:Test DAQ not found
N
YSet:Serial PortFlag True
# of channels(1 – 64)
Set:Channel FlagTrue
Set Warning& Alarm Limits
Set:W & A Flag True
Report Config?
Overlays
Y
N
Plot Window
Filter Config?
FreqAttenuation List
Y
N
Attenuation Sliders
SuccessReturn to Main
203
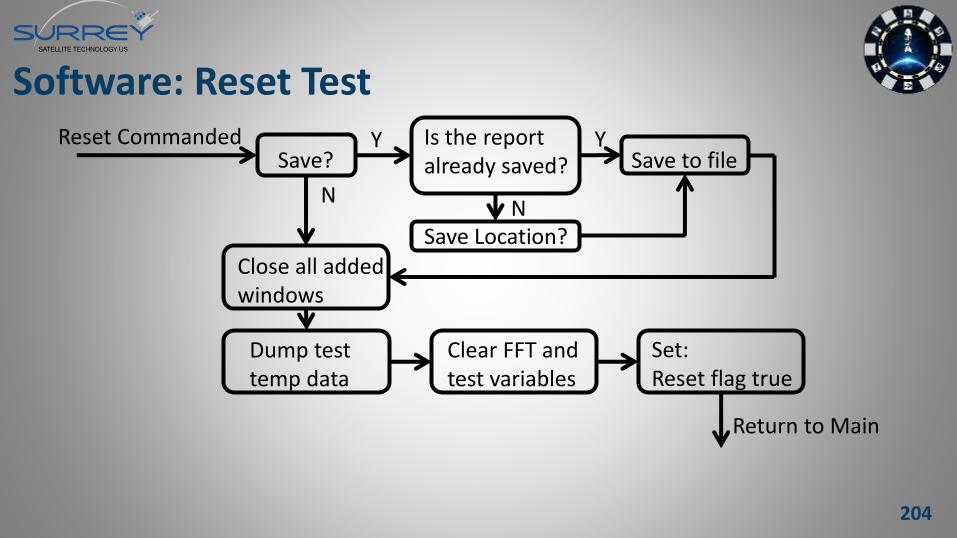
Software: Reset TestReset Commanded
Save?Is the report already saved?
Y Y
NN
Save to file
Save Location?Close all added windows
Dump test temp data
Clear FFT and test variables
Set:Reset flag true
Return to Main
204
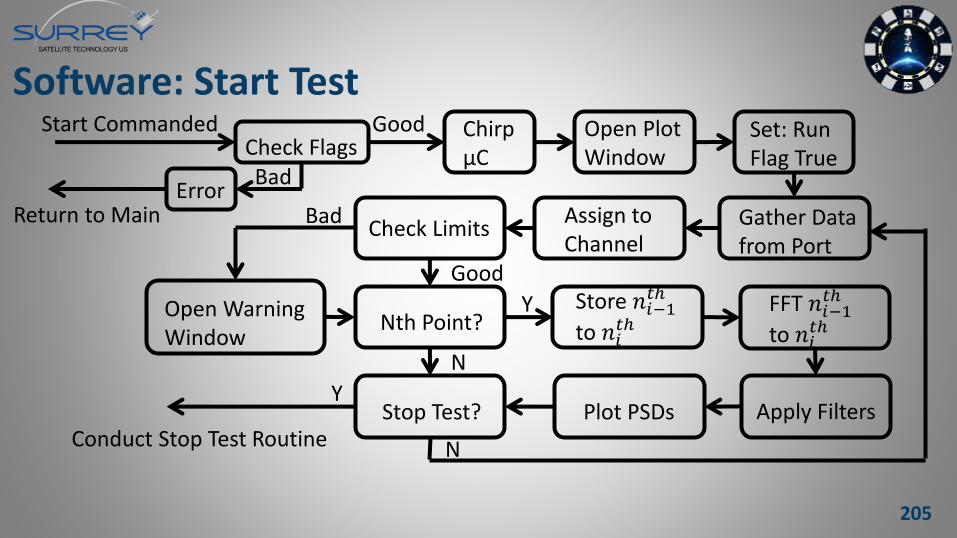
Software: Start TestStart Commanded
Check FlagsGood
BadError
Return to Main
ChirpμC
Open Plot Window
Set: Run Flag True
Gather Data from Port
Assign to Channel
Check Limits
Good
Bad
Open Warning Window
Nth Point?Y Store 𝑛𝑖−1
𝑡ℎ
to 𝑛𝑖𝑡ℎ
FFT 𝑛𝑖−1𝑡ℎ
to 𝑛𝑖𝑡ℎ
Apply FiltersPlot PSDs
N
Stop Test?Y
NConduct Stop Test Routine
205
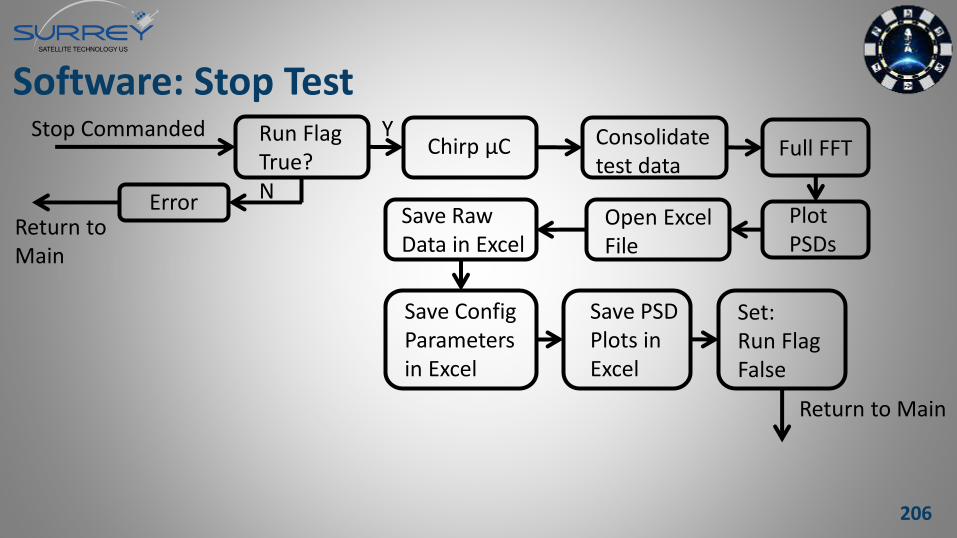
Software: Stop TestStop Commanded Run Flag
True?
Y
NErrorReturn to Main
Chirp μC Consolidate test data
Full FFT
Plot PSDs
Open Excel File
Save Raw Data in Excel
Save ConfigParameters in Excel
Save PSD Plots in Excel
Set:Run FlagFalse
Return to Main
206
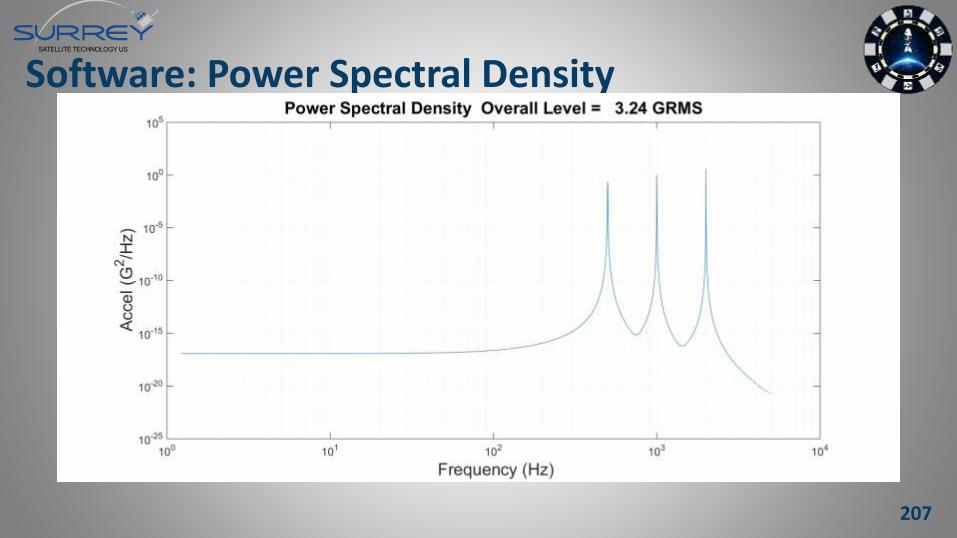
Software: Power Spectral Density
207
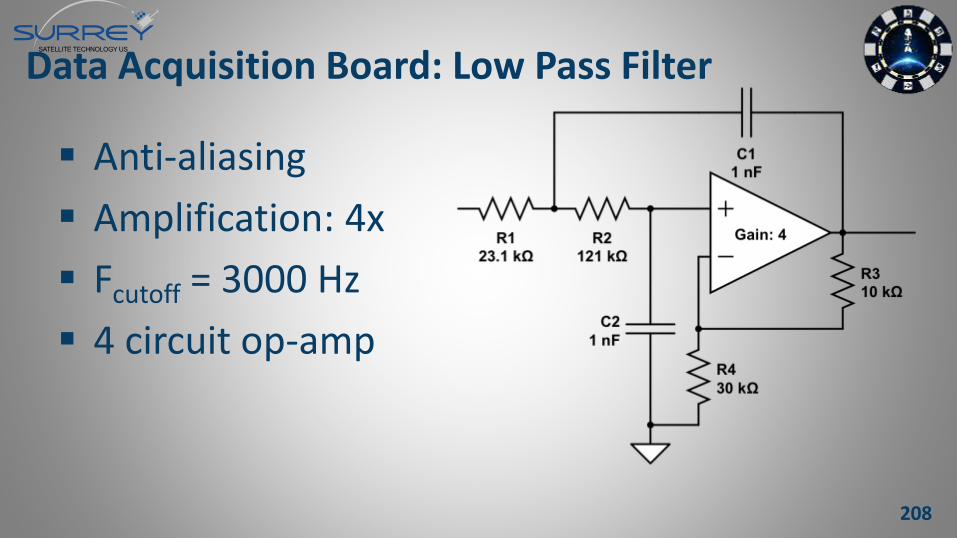
Data Acquisition Board: Low Pass Filter
Anti-aliasing
Amplification: 4x
Fcutoff = 3000 Hz
4 circuit op-amp
208
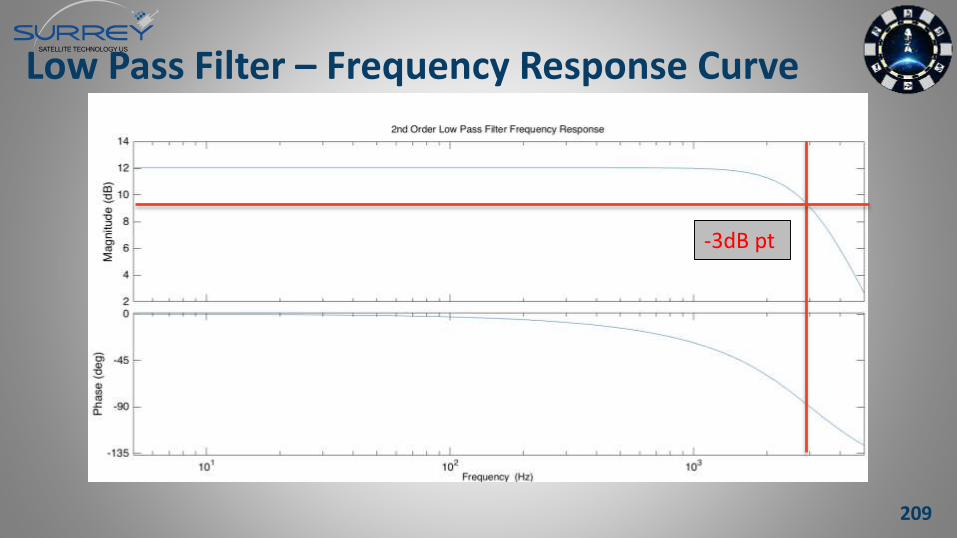
Low Pass Filter – Frequency Response Curve
-3dB pt
209
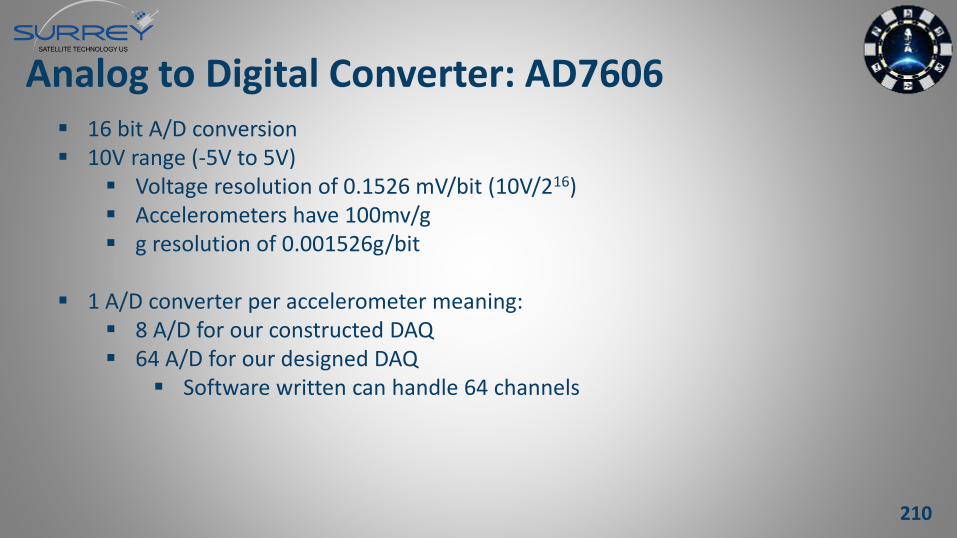
Analog to Digital Converter: AD7606 16 bit A/D conversion 10V range (-5V to 5V)
Voltage resolution of 0.1526 mV/bit (10V/216) Accelerometers have 100mv/g g resolution of 0.001526g/bit
1 A/D converter per accelerometer meaning: 8 A/D for our constructed DAQ 64 A/D for our designed DAQ
Software written can handle 64 channels
210
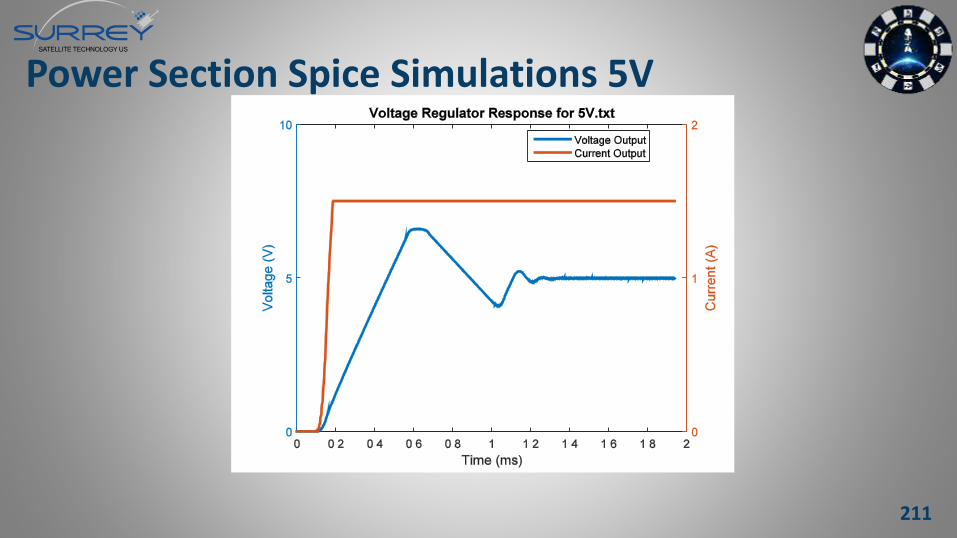
Power Section Spice Simulations 5V
211
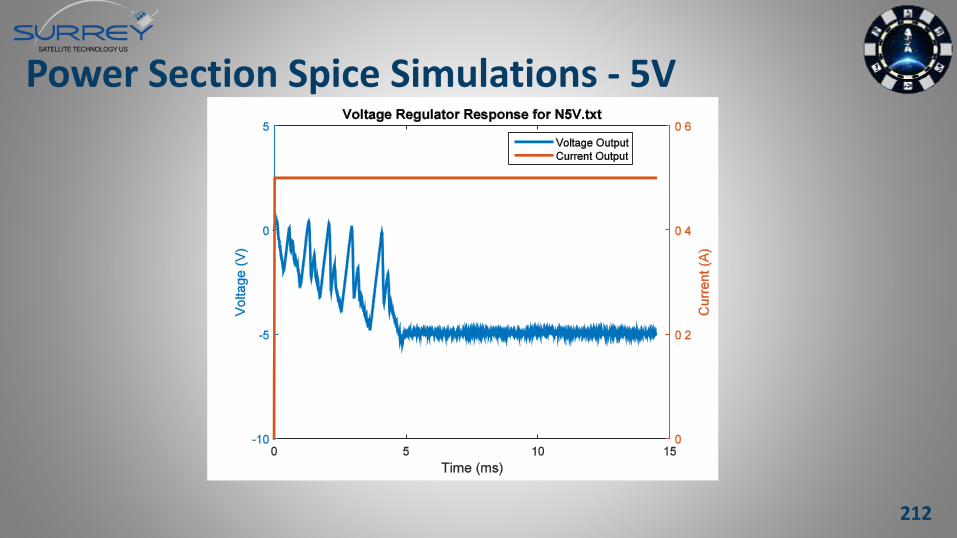
Power Section Spice Simulations - 5V
212
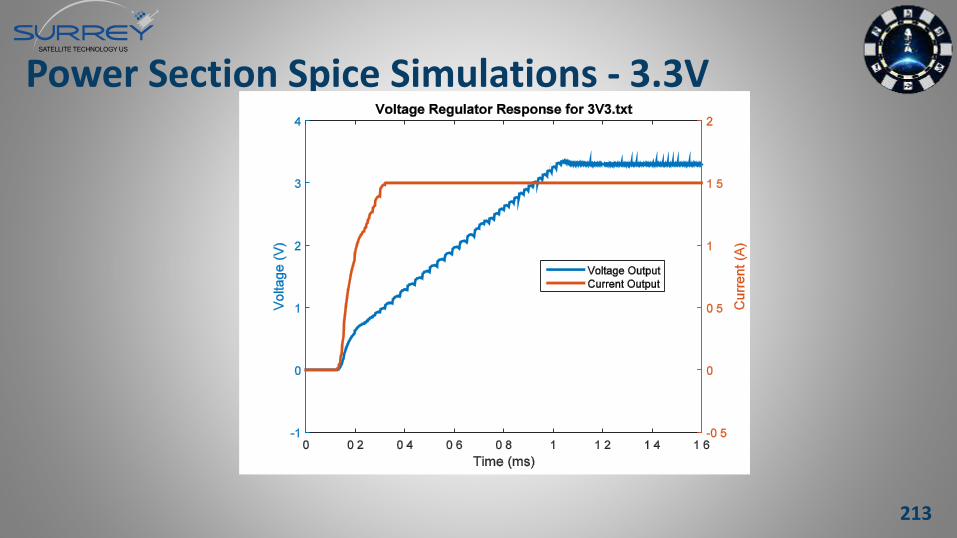
Power Section Spice Simulations - 3.3V
213


![Design Review Guide draft - Western Australian … · Design Review Guide. ... for Design and Architecture SA (ODASA); credit: Sam Noonan Photographer] Design Review . ... 4PP 7 DESIGN](https://img.dokumen.tips/doc/110x75/5b81aee47f8b9a2b6f8cd4b5/design-review-guide-draft-western-australian-design-review-guide-for.jpg)