Embed Size (px)
Citation preview
MAY 2016 CRESST REPORT 853
CRESST SHIPHANDLING AUTOMATED ASSESSMENT ENGINE: UNDERWAY REPLENISHMENT (UNREP)
Alan D. Koenig
John J. Lee
Markus R. Iseli
CRESST Shiphandling Automated Assessment Engine: Underway Replenishment (UNREP)
CRESST Report 853
Alan D. Koenig, John J. Lee, and Markus R. Iseli CRESST/University of California, Los Angeles
May 2016
National Center for Research on Evaluation, Standards, and Student Testing (CRESST) Center for the Study of Evaluation (CSE)
Graduate School of Education & Information Studies University of California, Los Angeles
300 Charles E. Young Drive North GSE&IS Building, Box 951522 Los Angeles, CA 90095-1522
(310) 206-1532
Copyright © 2016 The Regents of the University of California. The work reported herein was supported by grant number N00014-14-1-0664 from the Office of Naval Research with funding to the National Center for Research on Evaluation, Standards, and Student Testing (CRESST). The findings and opinions expressed in this report are those of the authors and do not necessarily reflect the positions or policies of the Office of Naval Research. To cite from this report, please use the following as your APA reference: Koenig, A. D., Lee, J. J., & Iseli, M. R. (2016). CRESST shiphandling automated assessment engine: Underway replenishment (UNREP) (CRESST Report 853). Los Angeles, CA: University of California, Los Angeles, National Center for Research on Evaluation, Standards, and Student Testing (CRESST).
iii
TABLE OF CONTENTS
Abstract ......................................................................................................................................1 Introduction ................................................................................................................................1 Specific Skills Assessed .............................................................................................................2
Cognitive Task Analysis of UNREP .....................................................................................3 Phase 1: Approach Waiting Station .......................................................................................3 Phase 2: Maintain Waiting Station ........................................................................................4 Phase 3: Approach AOE ........................................................................................................4 Phase 4: Alongside AOE .......................................................................................................4 Phase 5: Breakaway ...............................................................................................................4
The UNREP Automated Assessment Engine (AAE) ................................................................6 The Data Model: Under the Hood of the AAE ......................................................................7
AAE Visualization Tool ............................................................................................................8 Scoring Rubrics Associated With Observable Variables .........................................................10 Phase 1: Approach Waiting Station .........................................................................................11
Trigger (When Scenario Assessment Begins) .....................................................................11 Clearance .............................................................................................................................11 SOG Steadiness ....................................................................................................................11 COG Steadiness ...................................................................................................................12 Time to Completion .............................................................................................................13
Phase 2: Maintain Waiting Station (WS) .................................................................................14 Trigger (When Phase 2 Assessment Begins) .......................................................................14 Clearance .............................................................................................................................14 Position ................................................................................................................................14 SOG Steadiness Relative to Oiler ........................................................................................14 COG Steadiness Relative to Oiler .......................................................................................15
Phase 3: Approach AOE ..........................................................................................................16 Trigger (When Phase 3 Assessment Begins) .......................................................................16 Position ................................................................................................................................16 COG Steadiness Relative to Oiler .......................................................................................16
Phase 4: Alongside AOE .........................................................................................................17 Trigger (When Phase 4 Assessment Begins) .......................................................................17 Position ................................................................................................................................17 SOG Steadiness Relative to Oiler ........................................................................................17 COG Steadiness Relative to Oiler .......................................................................................17
Phase 5: Breakaway .................................................................................................................19 Trigger (When Phase 5 Assessment Begins) .......................................................................19 Position ................................................................................................................................19 SOG Steadiness ....................................................................................................................19 COG Steadiness ...................................................................................................................19
Bayesian Network for UNREP ................................................................................................20 Discussion ................................................................................................................................20
AAE Utility ..........................................................................................................................21 References ................................................................................................................................22
1
CRESST SHIPHANDLING AUTOMATED ASSESSMENT ENGINE:
UNDERWAY REPLENISHMENT (UNREP)1
Alan D. Koenig, John J. Lee, and Markus R. Iseli CRESST/University of California, Los Angeles
Abstract
The U.S. Navy is looking to automate the assessment of shiphandling skills to allow for less supervised practice which in turn should reduce instructor load. As part of a broader initiative at the Surface Warfare Officers School (SWOS), CRESST has been working to develop this capability using an automated assessment engine (AAE), which infers student shiphandling proficiency based on meaningful, observable actions taken in the shiphandling simulator, the Conning Officers Virtual Environment (COVE). Ultimately, four separate instances of the AAE will be deployed at SWOS, one for each of the core shiphandling skill areas (called evolutions): Mooring to a Pier, Underway Replenishment (UNREP), Getting Underway from a Pier, and Harbor Transit. This report describes the rubrics and inference model (a Bayesian network) used in the AAE for the UNREP evolution.
Introduction
Like other branches of the military, the U.S. Navy has been required to reduce its training
time across all content areas, and this includes shiphandling training. As training at sea becomes
more costly, there is greater reliance put on training shiphandling skills in a simulation
environment under the instruction of master mariners. The Surface Warfare Officers School
(SWOS) command, based in Newport, Rhode Island, utilizes such a system called the Conning
Officers Virtual Environment (COVE) (Norris, 1998) in conjunction with a recently developed,
associated intelligent tutoring system (ITS) that can be paired with it, called the COVE-ITS
(Wong, Kirschenbaum & Peters, 2010). Together, these synthetic training systems provide
opportunities for students to practice shiphandling tasks with spoken coaching and feedback
provided based on student actions. However, in its current form, the COVE-ITS is unable to
provide deeper, more aggregated assessments of student performance, such as those that could
(1) identify skill areas that require remediation, and (2) identify root causes for misconceptions
or gaps in knowledge as they contribute to diminished skills.
1We thank our Office of Naval Research Program Manager, Ray Perez; our Assistant Director at CRESST, William Bewley; the following people from the Surface Warfare Officers School (SWOS) for their tremendous support—Bud Weeks, Phil LaPointe, current SWOS Executive Director Richard Callas, former SWOS Executive George Ponsolle, Jim Marion, and other SWOS N72 staff; our consultant and former SWOS Executive Director David Monroe; Lauren Ogren (Naval Undersea Warfare Center); and COVE-ITS developers Stanley Peters, Elizabeth Bratt, and Jia Huang (Stanford).

2
Originally based on earlier work in shipboard damage control (Iseli, Koenig, Lee, &
Wainess, 2010; Koenig, Lee, Iseli, & Wainess, 2009), the automated assessment engine (AAE)
developed by the National Center for Research on Evaluation, Standards and Student Testing
(CRESST) at the University of California, Los Angeles (UCLA) for the Surface Warfare
Officers School (SWOS) was designed to assess shiphandling skills in the domain of mooring to
a pier (Koenig, Lee, & Iseli, 2016). That assessment engine was designed to complement and
enhance the spoken coaching and feedback capabilities of the COVE-ITS, enabling instructors
(and students) to more accurately and efficiently identify strengths and weaknesses within the
shiphandling domain as they work in the COVE, and guide remediation to focus on root cause
misconceptions and/or gaps in knowledge. Continuing with this effort, the focus of the work
described in this report is the development of a similar automated assessment engine that
provides assessment and analysis of shiphandling skills within the underway replenishment
(UNREP) domain. This is part of a larger initiative driven by SWOS called the Navigation and
Shiphandling Training and Assessment Tools (NSTAT).
Like the Mooring AAE, the UNREP AAE is a software module that receives telemetry
from the COVE-ITS. From this telemetry, the AAE assesses (and infers) student shiphandling
proficiency by evaluating student actions within the situational contexts in which they occur. A
Bayesian network is used by the AAE to represent “assessment relevant” constructs and
variables, along with their conditional dependencies to one another. From this network, the AAE
makes probabilistic inferences of student mastery of various shiphandling skills. Specifically,
observable student actions and decisions are evaluated in context and subsequently scored. These
scores are propagated through the network as evidence, and in so doing, link these observable
actions to associated, more latent variables of interest, such as skill with control and
maneuvering, or skill with safety.
Specific Skills Assessed
After creating an AAE for mooring, CRESST was tasked with continuing the automated
assessment effort for SWOS by developing an AAE for the underway replenishment (UNREP)
shiphandling skill area, also known as an evolution. SWOS uses the term evolution to describe
the collection of shiphandling skills that pertain to a broader task. In this case, the set of skills
centers on refueling and resupplying a ship while it’s underway out at sea. While the skills for
this operation can generalize to any type of ship, the class of ship used by the COVE, COVE-
ITS, and the CRESST AAE for this effort is a DDG guided missile destroyer class ship, which is
the most common ship in the Navy. The specific skills assessed by the UNREP AAE include the
following:
3
Maneuver (overall): conning the ship so that it maneuvers safely and efficiently under various situational and environmental conditions, including wind and current
Safety Margins: maintaining safe distances from other ships, buoys, and shoal water (shallow) to avoid collisions and/or allision (hitting another ship that is stationary)
Use of Rudder and Propulsion: employing the controllable forces on a ship (rudder for turning; propulsion for twisting, forward and reverse movement, and lateral movement)
Clearance: keeping a safe distance from other ships and ensuring the depth of water under the keel (bottom) of the ship is sufficient to avoid grounding
Position: maintaining the ship’s position relative to an intended track (planned course)
Course Over Ground (COG) Steadiness: maintaining a steady course over ground as the ship is in motion while completing the UNREP operation. Note: COG is not always the same as the ship’s heading (as the ship may be pointed in a different direction than the ship is actually moving). Forces acting on the ship, such as wind and current, and engine and rudder orders will all affect COG.
Speed Over Ground (SOG) Steadiness: maintaining a steady speed over ground as the ship is in motion while completing the UNREP operation. Note: this is a scalar quantity of magnitude only; it does not include the direction component of the velocity vector, as this is addressed in COG.
Cognitive Task Analysis of UNREP
Master mariner instructors at the Surface Warfare Officers School in Newport, Rhode
Island, were consulted to identify the cognitive demands, relevant concepts, procedural tasks,
and success criteria required to successfully complete an UNREP evolution. The underway
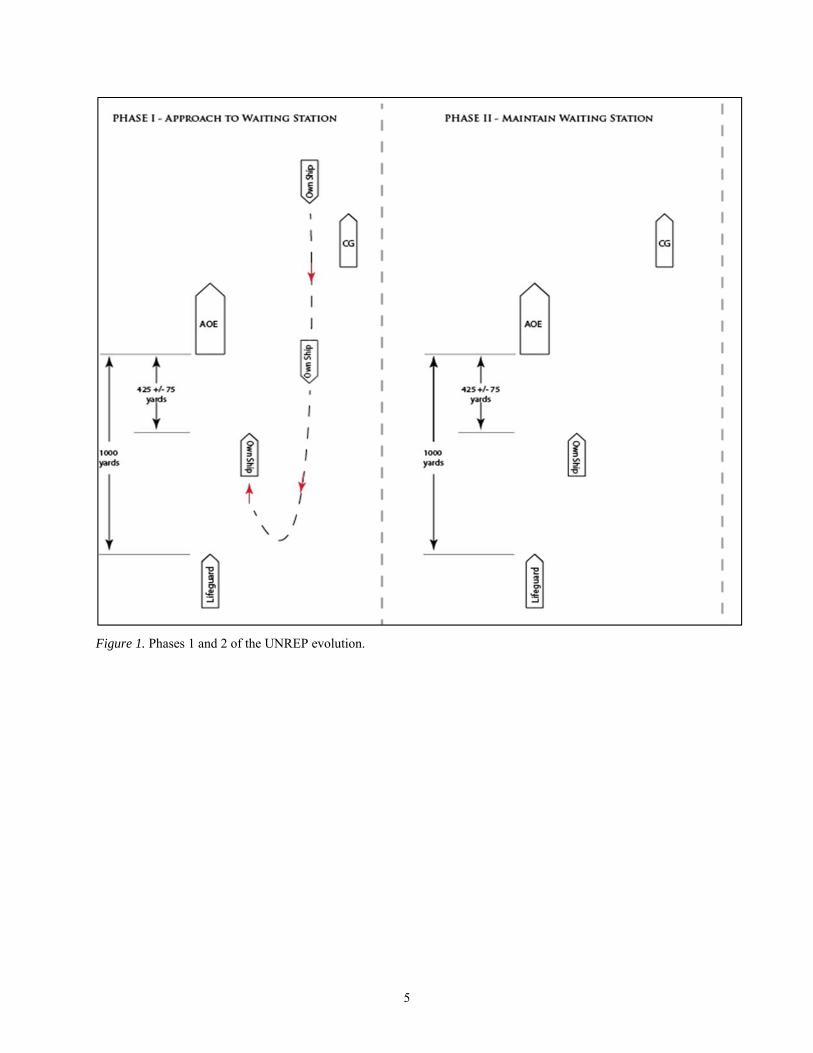
replenishment involves five phases, as follows (see Figure 1 and Figure 2 below):
1. Approach waiting station
2. Maintain waiting station (WSZ: waiting station zone)
3. Approach replenishment ship (typically a Fast Combat Support Ship, referred to as AOE)
4. Alongside AOE
5. Breakaway
Phase 1: Approach Waiting Station
The shiphandler conns the DDG (referred to in this document as OwnShip) so that it comes
on a reciprocal course from the oiler (180 degrees in the opposite direction) and needs to make a
180-degree turn behind the oiler while avoiding other nearby ships. A distance of about 425
yards (+/- 75 yards) is to be maintained.

4
Phase 2: Maintain Waiting Station
The shiphandler is tasked to maintain the waiting station (i.e., remain stationary in the
WSZ) until given approval by the oiler to proceed with the approach. Throughout this process,
the OwnShip and the oiler are moving at approximately 14 knots.
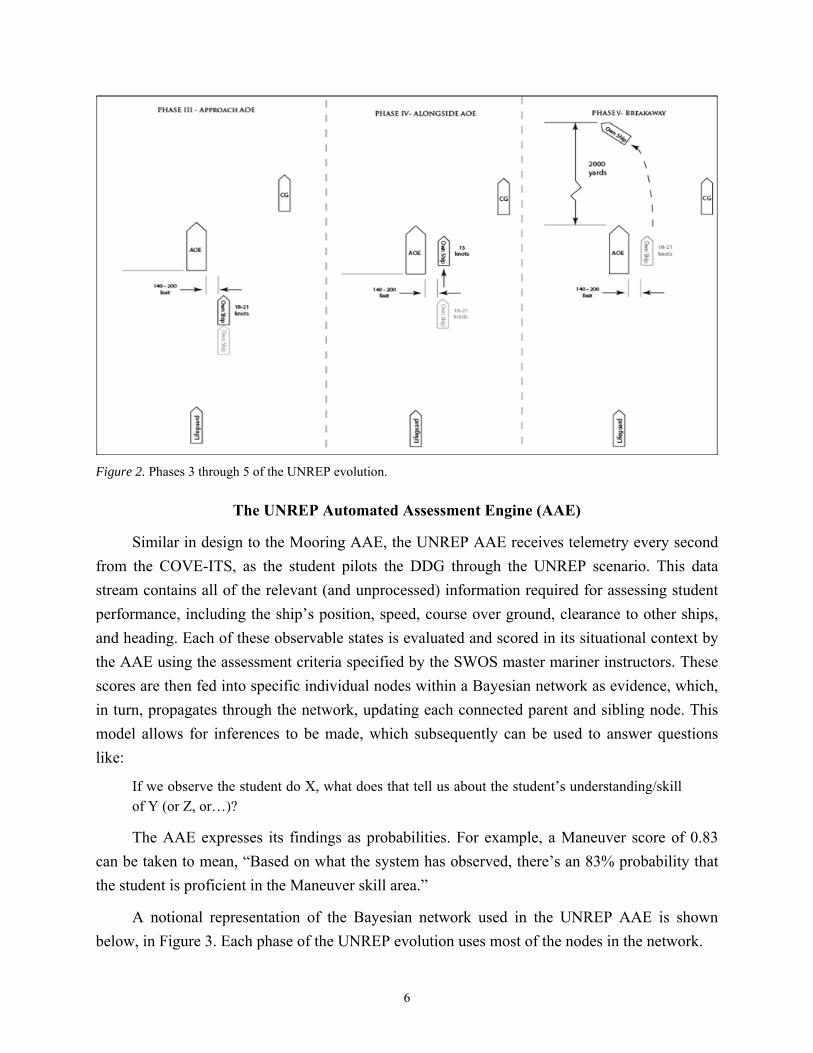
Phase 3: Approach AOE
The shiphandler is to hold the ship on course while moving up alongside the oiler.
Increasing speed and maintaining a 140–200 foot distance between the OwnShip and the oiler
accomplish this.
Phase 4: Alongside AOE
This phase begins when the OwnShip is safely alongside the oiler, with very minor speed
and course changes. The objective here for the shiphandler is to ensure that the OwnShip
maintains a 140–200 foot lateral distance from the oiler, while holding the ship’s fore-aft
position to within 10 feet of the refueling station on the oiler.
Phase 5: Breakaway
Once the replenishment of the ship is completed, the ship “breaks away” from the oiler by
increasing its speed to 18–21 knots, and follows a course away from that of the oiler (the
replenishment course, referred to as the Romeo corpen). If the OwnShip has to cross in front of
the oiler, it must maintain at least a 2000-yard safe distance. In general, crossing in front of the
oiler is discouraged unless absolutely necessary.
5
Figure 1. Phases 1 and 2 of the UNREP evolution.
6
Figure 2. Phases 3 through 5 of the UNREP evolution.
The UNREP Automated Assessment Engine (AAE)
Similar in design to the Mooring AAE, the UNREP AAE receives telemetry every second
from the COVE-ITS, as the student pilots the DDG through the UNREP scenario. This data
stream contains all of the relevant (and unprocessed) information required for assessing student
performance, including the ship’s position, speed, course over ground, clearance to other ships,
and heading. Each of these observable states is evaluated and scored in its situational context by
the AAE using the assessment criteria specified by the SWOS master mariner instructors. These
scores are then fed into specific individual nodes within a Bayesian network as evidence, which,
in turn, propagates through the network, updating each connected parent and sibling node. This
model allows for inferences to be made, which subsequently can be used to answer questions
like:
If we observe the student do X, what does that tell us about the student’s understanding/skill of Y (or Z, or…)?
The AAE expresses its findings as probabilities. For example, a Maneuver score of 0.83
can be taken to mean, “Based on what the system has observed, there’s an 83% probability that
the student is proficient in the Maneuver skill area.”
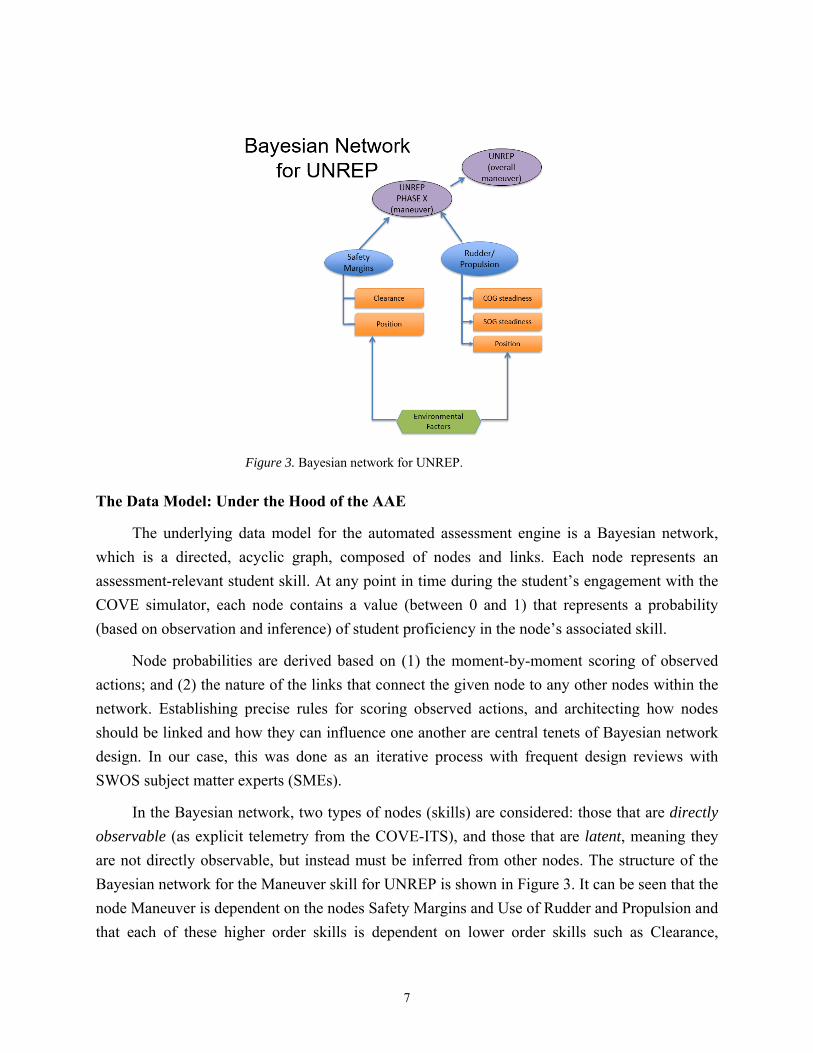
A notional representation of the Bayesian network used in the UNREP AAE is shown
below, in Figure 3. Each phase of the UNREP evolution uses most of the nodes in the network.
7
Figure 3. Bayesian network for UNREP.
The Data Model: Under the Hood of the AAE
The underlying data model for the automated assessment engine is a Bayesian network,
which is a directed, acyclic graph, composed of nodes and links. Each node represents an
assessment-relevant student skill. At any point in time during the student’s engagement with the
COVE simulator, each node contains a value (between 0 and 1) that represents a probability
(based on observation and inference) of student proficiency in the node’s associated skill.
Node probabilities are derived based on (1) the moment-by-moment scoring of observed
actions; and (2) the nature of the links that connect the given node to any other nodes within the
network. Establishing precise rules for scoring observed actions, and architecting how nodes
should be linked and how they can influence one another are central tenets of Bayesian network
design. In our case, this was done as an iterative process with frequent design reviews with
SWOS subject matter experts (SMEs).
In the Bayesian network, two types of nodes (skills) are considered: those that are directly
observable (as explicit telemetry from the COVE-ITS), and those that are latent, meaning they
are not directly observable, but instead must be inferred from other nodes. The structure of the
Bayesian network for the Maneuver skill for UNREP is shown in Figure 3. It can be seen that the
node Maneuver is dependent on the nodes Safety Margins and Use of Rudder and Propulsion and
that each of these higher order skills is dependent on lower order skills such as Clearance,
8
Position, COG Steadiness, and SOG Steadiness for each of the five phases. The directly
observable nodes considered as factors to the latent node of Safety Margins are Clearance and
Position. The directly observable nodes considered as factors to the latent node of Use of Rudder
and Propulsion include Speed Over Ground (SOG) Steadiness (both fore-aft and lateral), Course
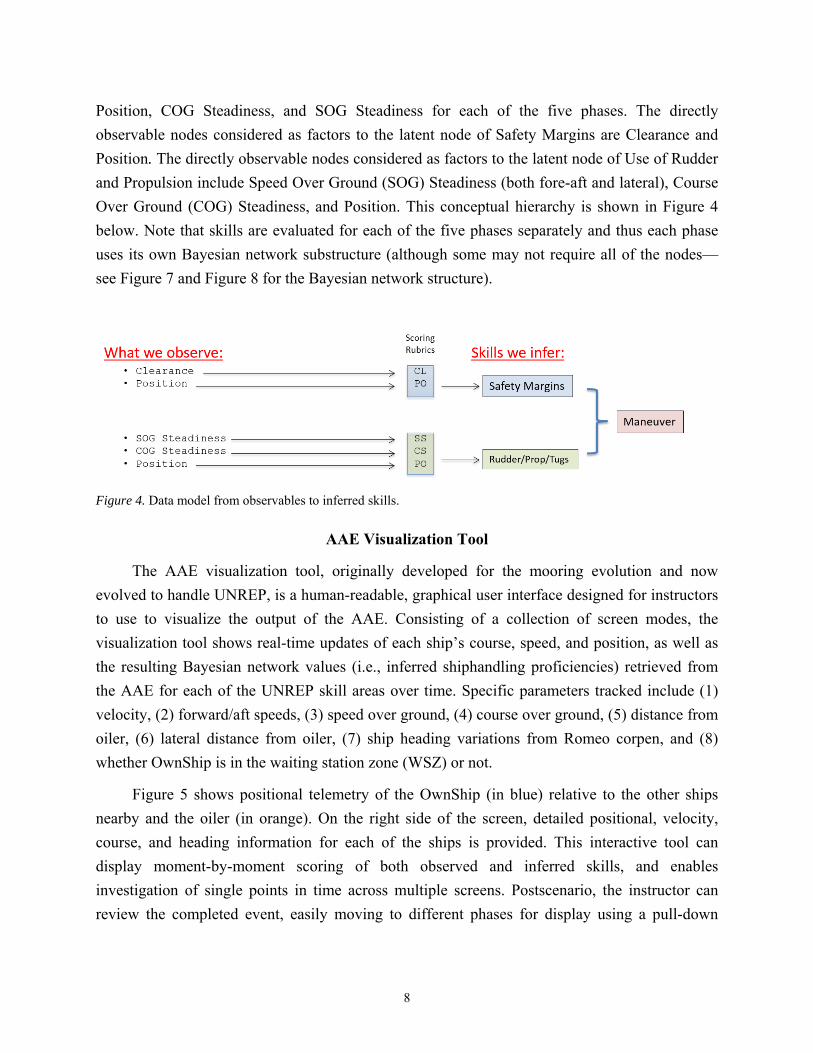
Over Ground (COG) Steadiness, and Position. This conceptual hierarchy is shown in Figure 4
below. Note that skills are evaluated for each of the five phases separately and thus each phase
uses its own Bayesian network substructure (although some may not require all of the nodes—
see Figure 7 and Figure 8 for the Bayesian network structure).
Figure 4. Data model from observables to inferred skills.
AAE Visualization Tool
The AAE visualization tool, originally developed for the mooring evolution and now
evolved to handle UNREP, is a human-readable, graphical user interface designed for instructors
to use to visualize the output of the AAE. Consisting of a collection of screen modes, the
visualization tool shows real-time updates of each ship’s course, speed, and position, as well as
the resulting Bayesian network values (i.e., inferred shiphandling proficiencies) retrieved from
the AAE for each of the UNREP skill areas over time. Specific parameters tracked include (1)
velocity, (2) forward/aft speeds, (3) speed over ground, (4) course over ground, (5) distance from
oiler, (6) lateral distance from oiler, (7) ship heading variations from Romeo corpen, and (8)
whether OwnShip is in the waiting station zone (WSZ) or not.
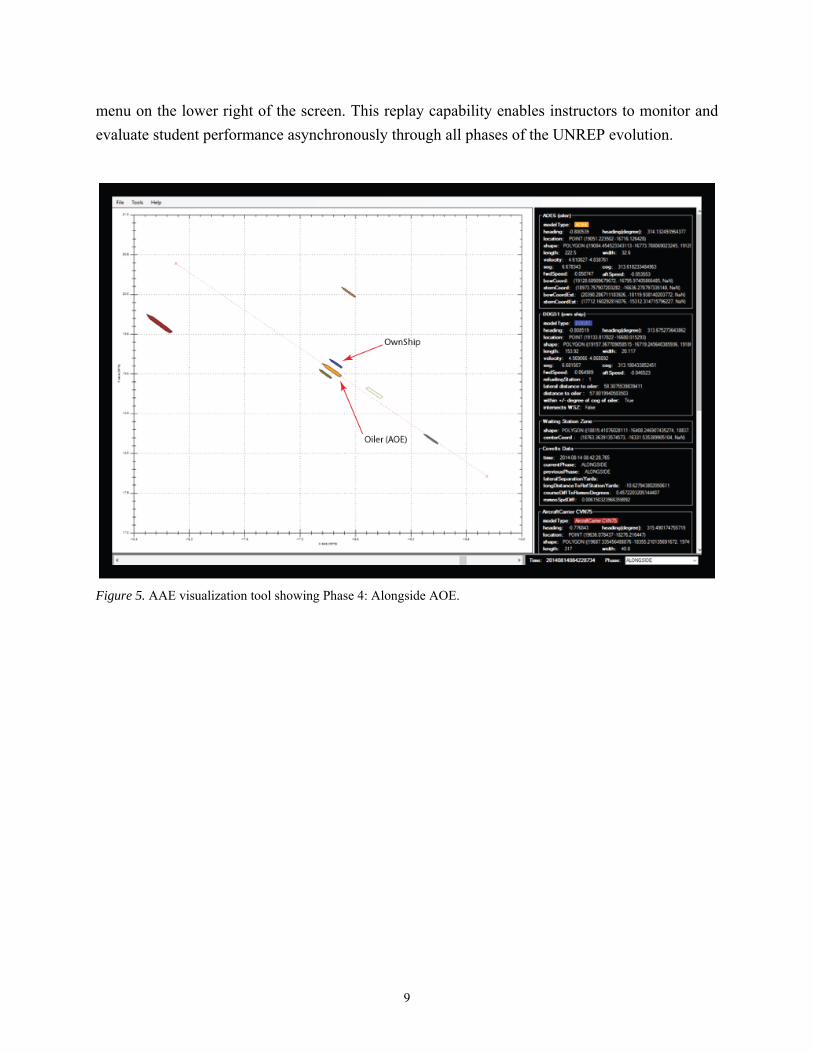
Figure 5 shows positional telemetry of the OwnShip (in blue) relative to the other ships
nearby and the oiler (in orange). On the right side of the screen, detailed positional, velocity,
course, and heading information for each of the ships is provided. This interactive tool can
display moment-by-moment scoring of both observed and inferred skills, and enables
investigation of single points in time across multiple screens. Postscenario, the instructor can
review the completed event, easily moving to different phases for display using a pull-down
9
menu on the lower right of the screen. This replay capability enables instructors to monitor and
evaluate student performance asynchronously through all phases of the UNREP evolution.
Figure 5. AAE visualization tool showing Phase 4: Alongside AOE.
10
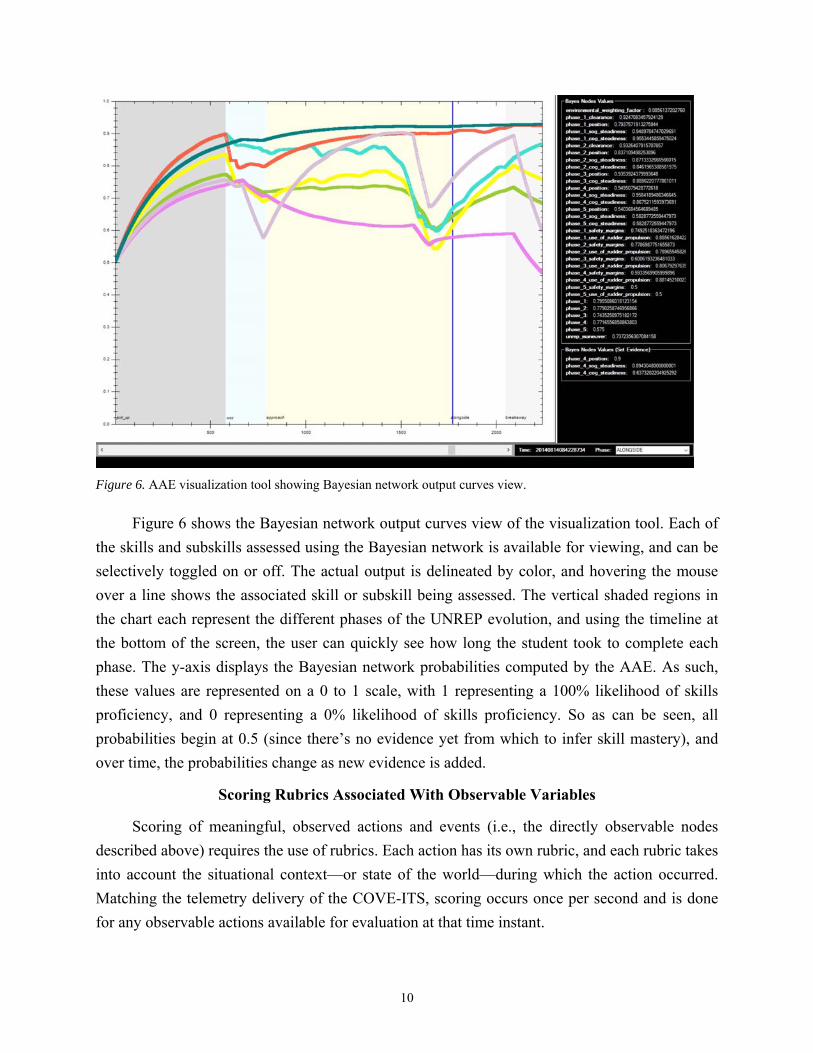
Figure 6. AAE visualization tool showing Bayesian network output curves view.
Figure 6 shows the Bayesian network output curves view of the visualization tool. Each of
the skills and subskills assessed using the Bayesian network is available for viewing, and can be
selectively toggled on or off. The actual output is delineated by color, and hovering the mouse
over a line shows the associated skill or subskill being assessed. The vertical shaded regions in
the chart each represent the different phases of the UNREP evolution, and using the timeline at
the bottom of the screen, the user can quickly see how long the student took to complete each
phase. The y-axis displays the Bayesian network probabilities computed by the AAE. As such,
these values are represented on a 0 to 1 scale, with 1 representing a 100% likelihood of skills
proficiency, and 0 representing a 0% likelihood of skills proficiency. So as can be seen, all
probabilities begin at 0.5 (since there’s no evidence yet from which to infer skill mastery), and
over time, the probabilities change as new evidence is added.
Scoring Rubrics Associated With Observable Variables
Scoring of meaningful, observed actions and events (i.e., the directly observable nodes
described above) requires the use of rubrics. Each action has its own rubric, and each rubric takes
into account the situational context—or state of the world—during which the action occurred.
Matching the telemetry delivery of the COVE-ITS, scoring occurs once per second and is done
for any observable actions available for evaluation at that time instant.
11
Scores of observable actions are expressed as values between 0 and 1, and are passed as
probabilities into the Bayesian network (as evidence) to be associated with their corresponding
observable nodes. As this occurs, the probabilities of all other connected nodes in the network
(both directly observable types and latent types) are immediately updated to reflect this new
information about the student. In this way, as the student progresses through the simulation, a
stream of constantly updating inferences is made regarding the student’s mastery of the various
shiphandling skills that pertain to UNREP.
Each scoring rubric was developed by CRESST based on repeated consultation with
subject matter experts at SWOS. The following sections describe each rubric by phase.
Phase 1: Approach Waiting Station
Trigger (When Scenario Assessment Begins)
All of the following conditions are required to trigger the beginning of Phase 1: OwnShip is within +/- 15 degrees of COG of oiler OwnShip is within 300 feet laterally of the oiler
Clearance
1. Calculate danger zone radius (DZR) DZR = 140 ft.
2. Check if any ships are within DZR around the current position, and use the table below to determine BN score based on the ship with the shortest distance from OwnShip.
Optimal (0.9) Adequate (0.65) Poor (0.1)
Nothing inside DZR 100 ft < DZR < 140 ft DZR < = 100 ft
Notes:
a. If collision occurs, give score of 0.0, and the overall score (i.e., computed running average score) is 0.0 forever no matter what else occurs.
b. If a score of 0.1 is received, overall score (i.e., computed running average score) is 0.25 forever no matter what else occurs.
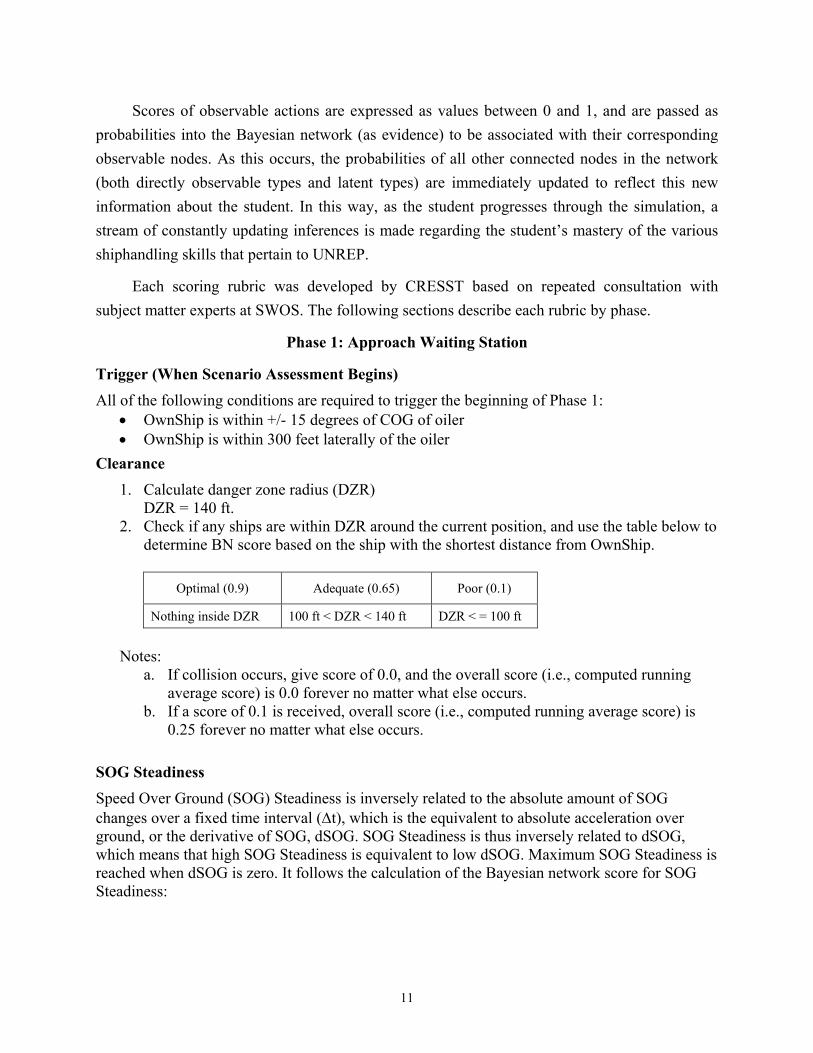
SOG Steadiness
Speed Over Ground (SOG) Steadiness is inversely related to the absolute amount of SOG changes over a fixed time interval (t), which is the equivalent to absolute acceleration over ground, or the derivative of SOG, dSOG. SOG Steadiness is thus inversely related to dSOG, which means that high SOG Steadiness is equivalent to low dSOG. Maximum SOG Steadiness is reached when dSOG is zero. It follows the calculation of the Bayesian network score for SOG Steadiness:
12
1. Calculate dSOG at time t as the difference of SOG OwnShip (SOGown) at time t+t and SOG OwnShip at time t, as follows: dSOG(t) = abs(SOGown(t+t) - SOGown(t)) / t. Example values:
Time SOGown dSOG(t)
t = 0 13 abs(11 – 13) /60
t = 10 11 abs(14 – 11) ) /60
t = 20 14 abs(9 – 14) ) /60
t = 30 9 abs(15 – 9) ) /60
t = 40 15 N/A (end of array reached)
a. Assume that SOG is measured in meters per second (m/s), t is measured in seconds,
and t = 60 seconds. This implies that dSOG(t) is calculated every 60 seconds.
2. Compute Bayesian network score (ScoreBN) from dSOG as follows:
0.90.90.5
,
if 0 then set 0.
Notes:
a. This formula assumes that an acceleration of 0.5 m/s2 or more will result in a BN score of zero.
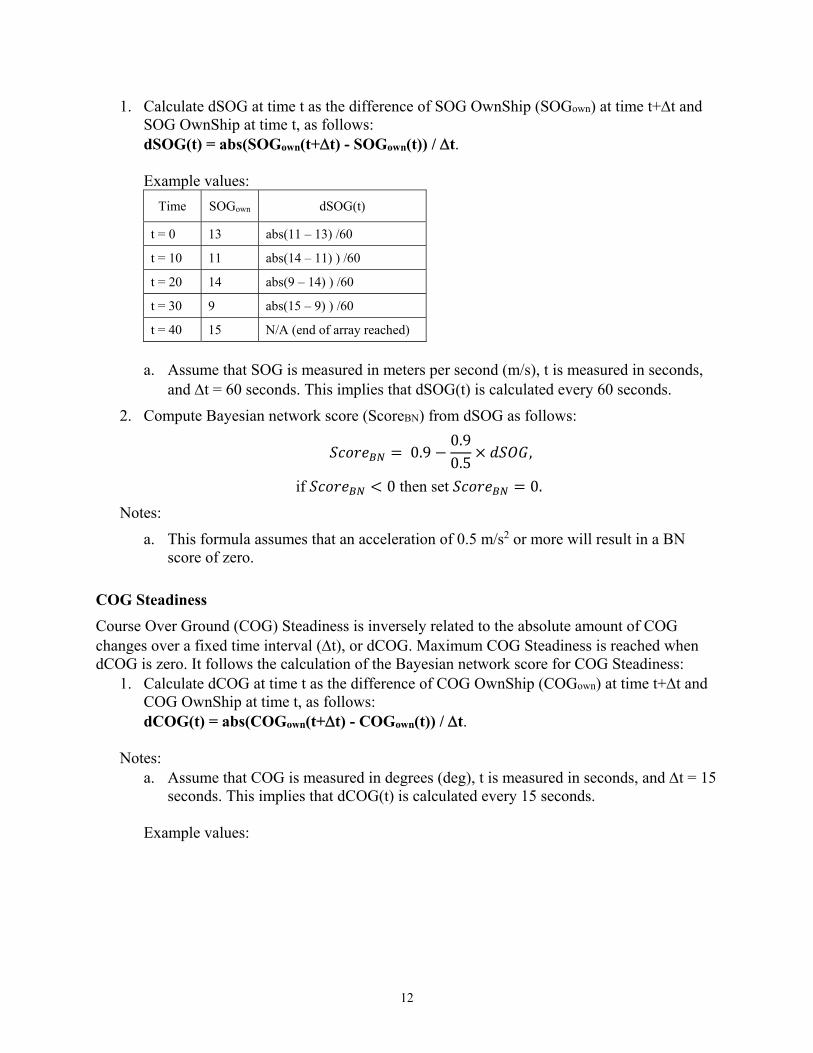
COG Steadiness
Course Over Ground (COG) Steadiness is inversely related to the absolute amount of COG changes over a fixed time interval (t), or dCOG. Maximum COG Steadiness is reached when dCOG is zero. It follows the calculation of the Bayesian network score for COG Steadiness:
1. Calculate dCOG at time t as the difference of COG OwnShip (COGown) at time t+t and COG OwnShip at time t, as follows: dCOG(t) = abs(COGown(t+t) - COGown(t)) / t.
Notes:
a. Assume that COG is measured in degrees (deg), t is measured in seconds, and t = 15 seconds. This implies that dCOG(t) is calculated every 15 seconds.
Example values:
13
Time COGown dCOG(t)
t = 0 130 abs(120 – 130) / 15
t = 10 120 abs(125 – 120) / 15
t = 20 125 abs(132 – 125) / 15
t = 30 132 abs(135 – 132) / 15
t = 40 135 N/A (end of array reached)
2. Compute Bayesian network score (ScoreBN) from dCOG as follows:
0.9 .
.,
if 0 then set = 0
Notes:
a. This formula assumes that time rate of change of ship’s COG heading of 0.67 degrees/s (or more) will result in a BN score of zero.
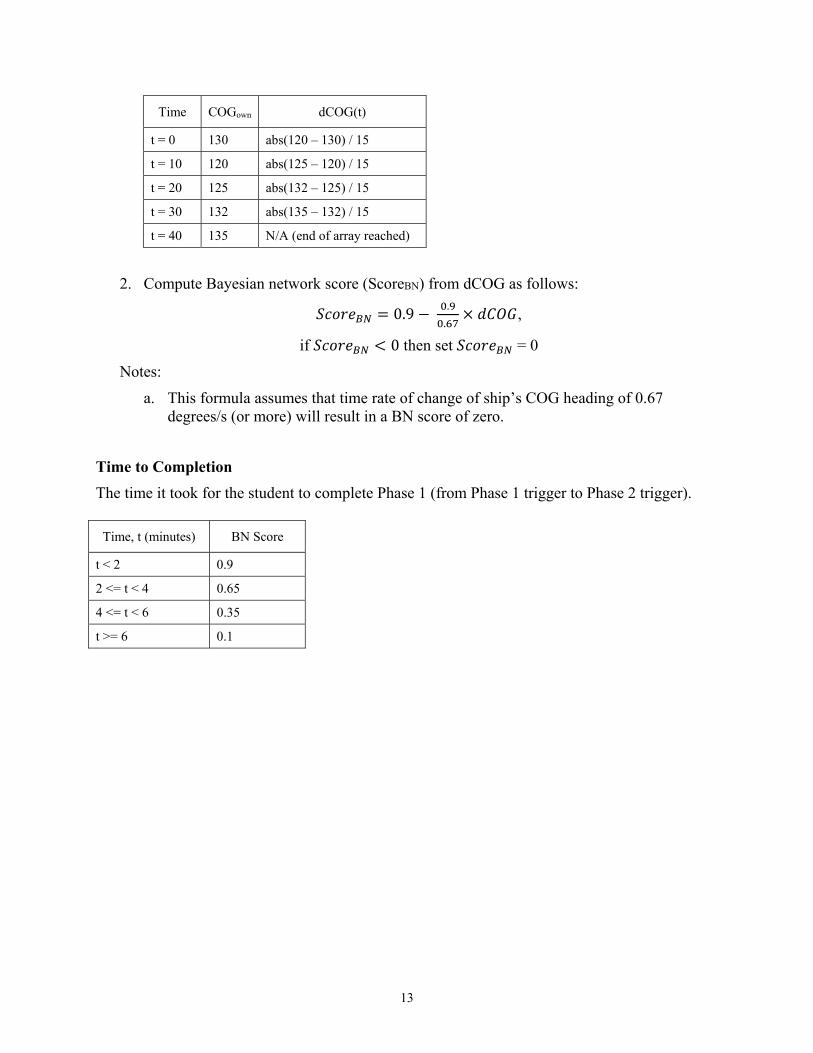
Time to Completion
The time it took for the student to complete Phase 1 (from Phase 1 trigger to Phase 2 trigger).
Time, t (minutes) BN Score
t < 2 0.9
2 <= t < 4 0.65
4 <= t < 6 0.35
t >= 6 0.1
14
Phase 2: Maintain Waiting Station (WS)
Trigger (When Phase 2 Assessment Begins)
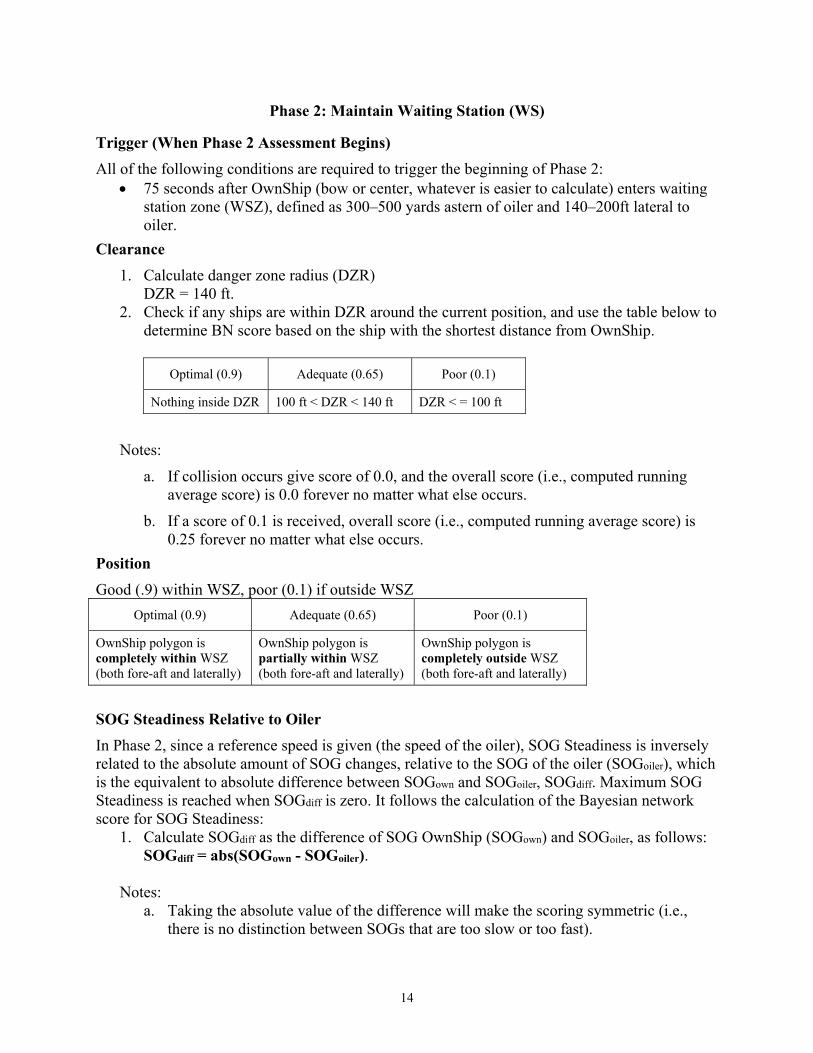
All of the following conditions are required to trigger the beginning of Phase 2: 75 seconds after OwnShip (bow or center, whatever is easier to calculate) enters waiting
station zone (WSZ), defined as 300–500 yards astern of oiler and 140–200ft lateral to oiler.
Clearance
1. Calculate danger zone radius (DZR) DZR = 140 ft.
2. Check if any ships are within DZR around the current position, and use the table below to determine BN score based on the ship with the shortest distance from OwnShip.
Optimal (0.9) Adequate (0.65) Poor (0.1)
Nothing inside DZR 100 ft < DZR < 140 ft DZR < = 100 ft
Notes:
a. If collision occurs give score of 0.0, and the overall score (i.e., computed running average score) is 0.0 forever no matter what else occurs.
b. If a score of 0.1 is received, overall score (i.e., computed running average score) is 0.25 forever no matter what else occurs.
Position
Good (.9) within WSZ, poor (0.1) if outside WSZ
Optimal (0.9) Adequate (0.65) Poor (0.1)
OwnShip polygon is completely within WSZ (both fore-aft and laterally)
OwnShip polygon is partially within WSZ (both fore-aft and laterally)
OwnShip polygon is completely outside WSZ (both fore-aft and laterally)
SOG Steadiness Relative to Oiler
In Phase 2, since a reference speed is given (the speed of the oiler), SOG Steadiness is inversely related to the absolute amount of SOG changes, relative to the SOG of the oiler (SOGoiler), which is the equivalent to absolute difference between SOGown and SOGoiler, SOGdiff. Maximum SOG Steadiness is reached when SOGdiff is zero. It follows the calculation of the Bayesian network score for SOG Steadiness:
1. Calculate SOGdiff as the difference of SOG OwnShip (SOGown) and SOGoiler, as follows: SOGdiff = abs(SOGown - SOGoiler).
Notes:
a. Taking the absolute value of the difference will make the scoring symmetric (i.e., there is no distinction between SOGs that are too slow or too fast).
15
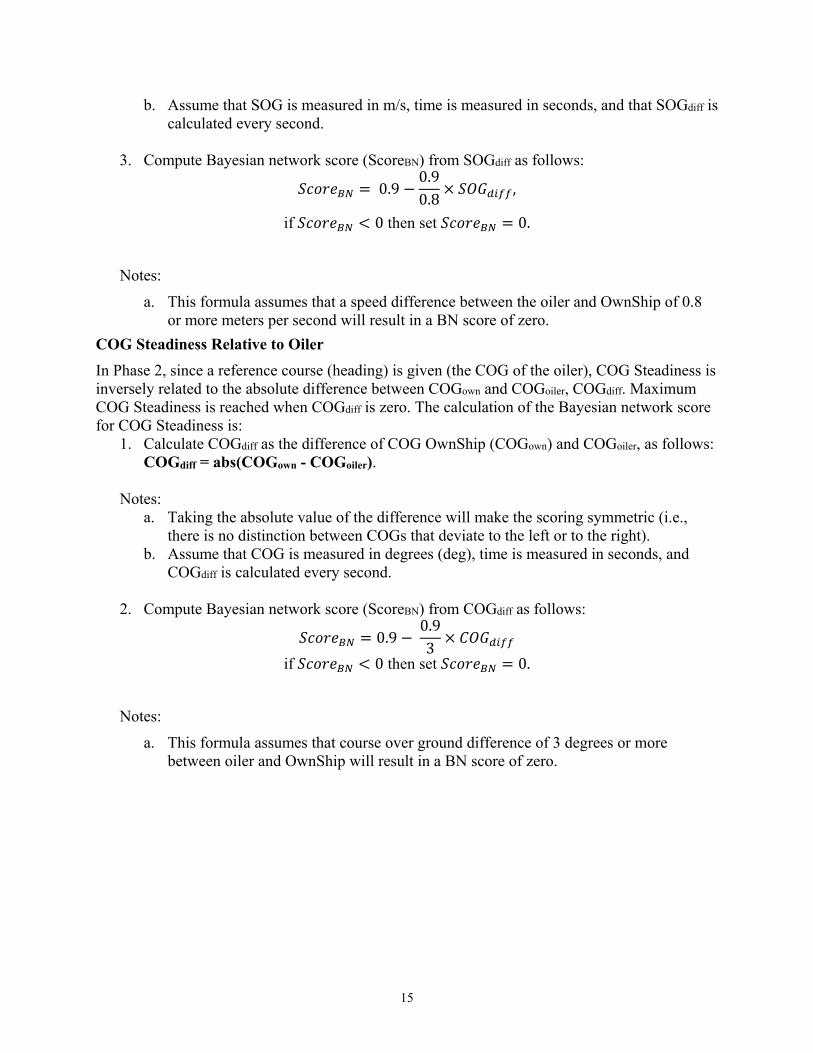
b. Assume that SOG is measured in m/s, time is measured in seconds, and that SOGdiff is calculated every second.
3. Compute Bayesian network score (ScoreBN) from SOGdiff as follows:
0.90.90.8
,
if 0 then set 0.
Notes:
a. This formula assumes that a speed difference between the oiler and OwnShip of 0.8 or more meters per second will result in a BN score of zero.
COG Steadiness Relative to Oiler
In Phase 2, since a reference course (heading) is given (the COG of the oiler), COG Steadiness is inversely related to the absolute difference between COGown and COGoiler, COGdiff. Maximum COG Steadiness is reached when COGdiff is zero. The calculation of the Bayesian network score for COG Steadiness is:
1. Calculate COGdiff as the difference of COG OwnShip (COGown) and COGoiler, as follows: COGdiff = abs(COGown - COGoiler).
Notes:
a. Taking the absolute value of the difference will make the scoring symmetric (i.e., there is no distinction between COGs that deviate to the left or to the right).
b. Assume that COG is measured in degrees (deg), time is measured in seconds, and COGdiff is calculated every second.
2. Compute Bayesian network score (ScoreBN) from COGdiff as follows:
0.9 0.93
if 0 then set 0.
Notes:
a. This formula assumes that course over ground difference of 3 degrees or more between oiler and OwnShip will result in a BN score of zero.
16
Phase 3: Approach AOE
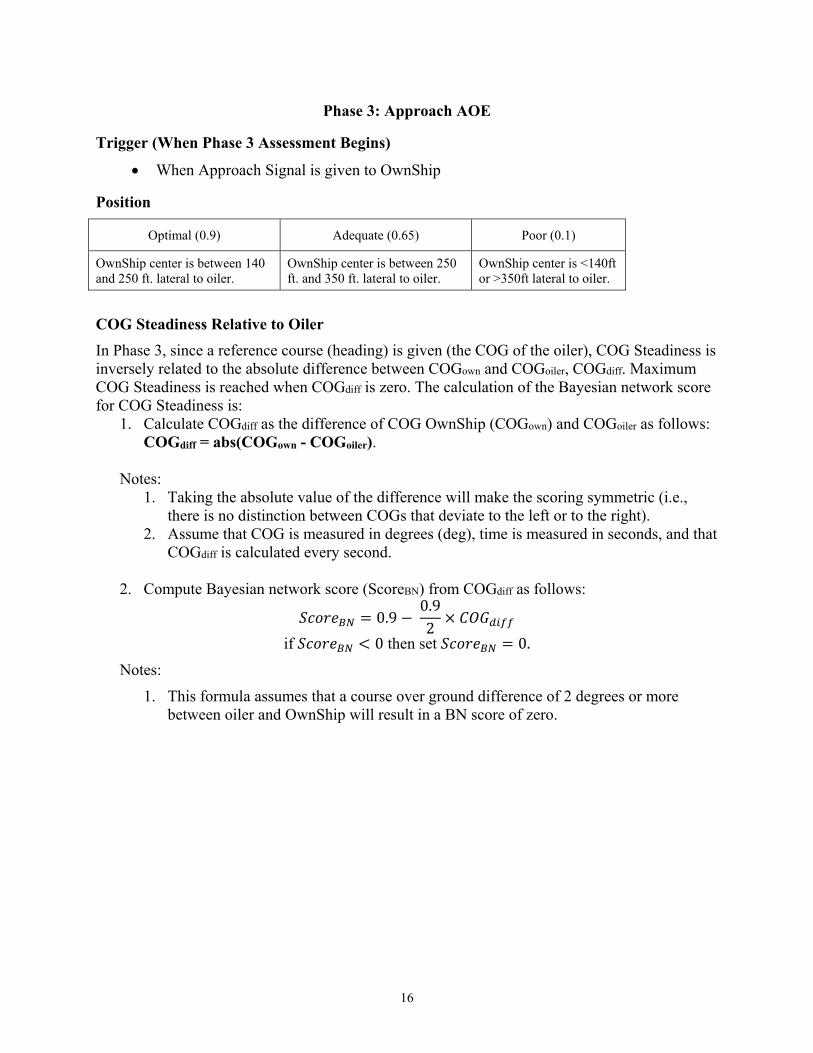
Trigger (When Phase 3 Assessment Begins)
When Approach Signal is given to OwnShip
Position
Optimal (0.9) Adequate (0.65) Poor (0.1)
OwnShip center is between 140 and 250 ft. lateral to oiler.
OwnShip center is between 250 ft. and 350 ft. lateral to oiler.
OwnShip center is <140ft or >350ft lateral to oiler.
COG Steadiness Relative to Oiler
In Phase 3, since a reference course (heading) is given (the COG of the oiler), COG Steadiness is inversely related to the absolute difference between COGown and COGoiler, COGdiff. Maximum COG Steadiness is reached when COGdiff is zero. The calculation of the Bayesian network score for COG Steadiness is:
1. Calculate COGdiff as the difference of COG OwnShip (COGown) and COGoiler as follows: COGdiff = abs(COGown - COGoiler).
Notes:
1. Taking the absolute value of the difference will make the scoring symmetric (i.e., there is no distinction between COGs that deviate to the left or to the right).
2. Assume that COG is measured in degrees (deg), time is measured in seconds, and that COGdiff is calculated every second.
2. Compute Bayesian network score (ScoreBN) from COGdiff as follows:
0.9 0.92
if 0 then set 0.
Notes:
1. This formula assumes that a course over ground difference of 2 degrees or more between oiler and OwnShip will result in a BN score of zero.
17
Phase 4: Alongside AOE
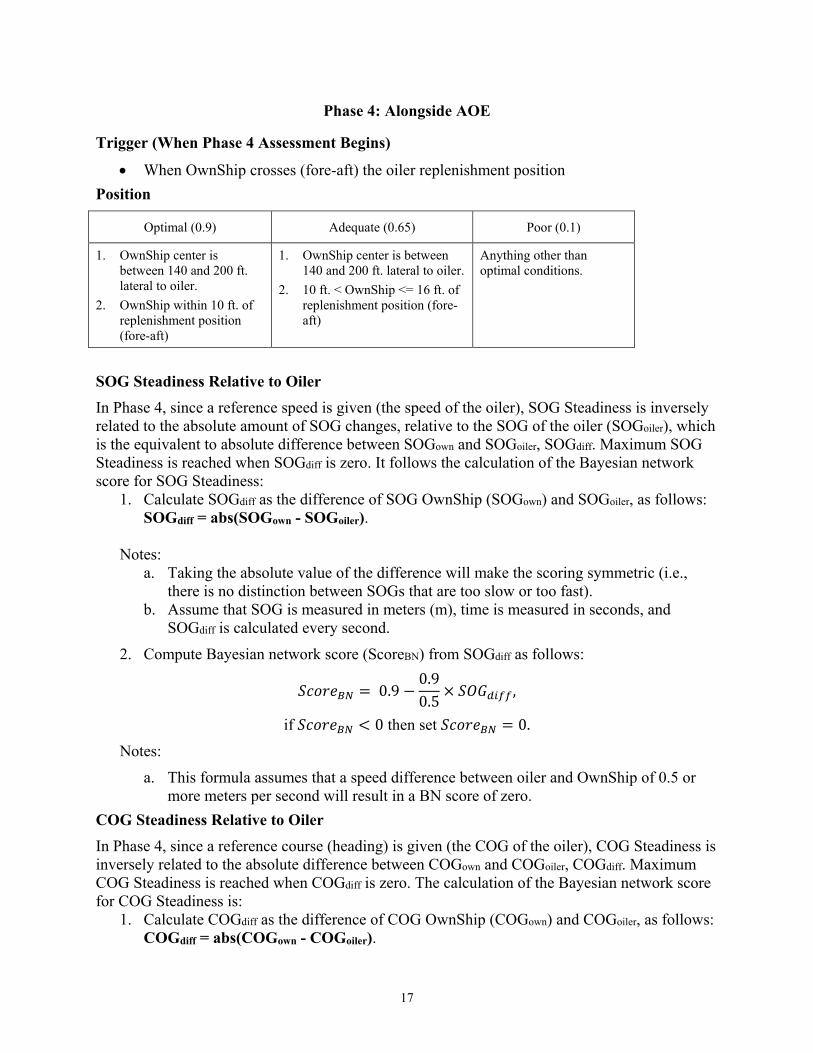
Trigger (When Phase 4 Assessment Begins)
When OwnShip crosses (fore-aft) the oiler replenishment position
Position
Optimal (0.9) Adequate (0.65) Poor (0.1)
1. OwnShip center is between 140 and 200 ft. lateral to oiler.
2. OwnShip within 10 ft. of replenishment position (fore-aft)
1. OwnShip center is between 140 and 200 ft. lateral to oiler.
2. 10 ft. < OwnShip <= 16 ft. of replenishment position (fore-aft)
Anything other than optimal conditions.
SOG Steadiness Relative to Oiler
In Phase 4, since a reference speed is given (the speed of the oiler), SOG Steadiness is inversely related to the absolute amount of SOG changes, relative to the SOG of the oiler (SOGoiler), which is the equivalent to absolute difference between SOGown and SOGoiler, SOGdiff. Maximum SOG Steadiness is reached when SOGdiff is zero. It follows the calculation of the Bayesian network score for SOG Steadiness:
1. Calculate SOGdiff as the difference of SOG OwnShip (SOGown) and SOGoiler, as follows: SOGdiff = abs(SOGown - SOGoiler).
Notes:
a. Taking the absolute value of the difference will make the scoring symmetric (i.e., there is no distinction between SOGs that are too slow or too fast).
b. Assume that SOG is measured in meters (m), time is measured in seconds, and SOGdiff is calculated every second.
2. Compute Bayesian network score (ScoreBN) from SOGdiff as follows:
0.90.90.5
,
if 0 then set 0.
Notes:
a. This formula assumes that a speed difference between oiler and OwnShip of 0.5 or more meters per second will result in a BN score of zero.
COG Steadiness Relative to Oiler
In Phase 4, since a reference course (heading) is given (the COG of the oiler), COG Steadiness is inversely related to the absolute difference between COGown and COGoiler, COGdiff. Maximum COG Steadiness is reached when COGdiff is zero. The calculation of the Bayesian network score for COG Steadiness is:
1. Calculate COGdiff as the difference of COG OwnShip (COGown) and COGoiler, as follows: COGdiff = abs(COGown - COGoiler).
18
Notes:
a. Taking the absolute value of the difference will make the scoring symmetric (i.e., there is no distinction between COGs that deviate to the left or to the right).
b. Assume that COG is measured in degrees (deg), time is measured in seconds, and COGdiff is calculated every second.
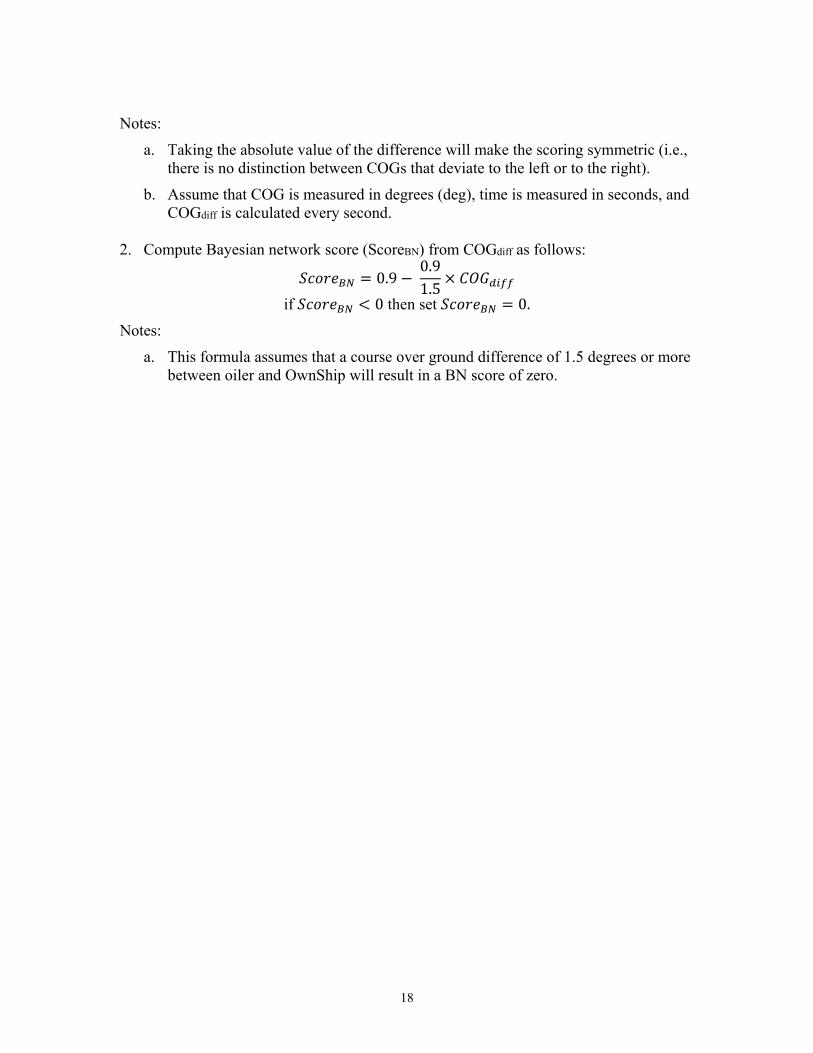
2. Compute Bayesian network score (ScoreBN) from COGdiff as follows:
0.9 0.91.5
if 0 then set 0.
Notes:
a. This formula assumes that a course over ground difference of 1.5 degrees or more between oiler and OwnShip will result in a BN score of zero.
19
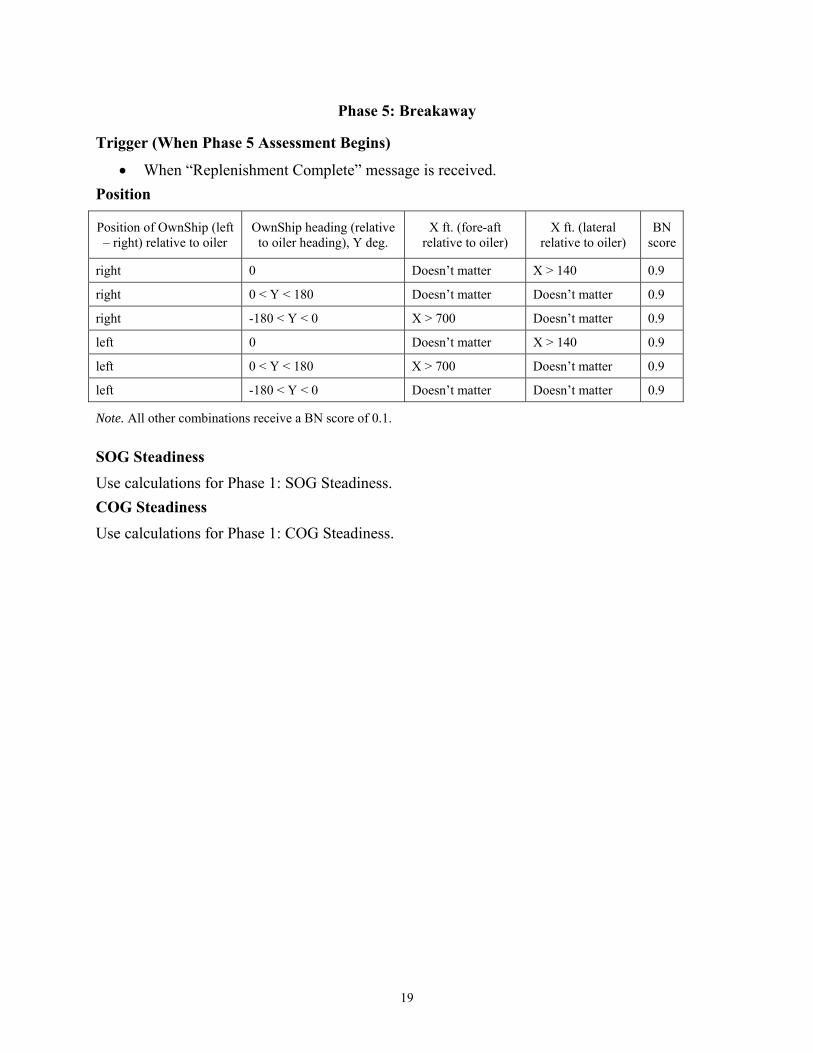
Phase 5: Breakaway
Trigger (When Phase 5 Assessment Begins)
When “Replenishment Complete” message is received.
Position
Position of OwnShip (left – right) relative to oiler
OwnShip heading (relative to oiler heading), Y deg.
X ft. (fore-aft relative to oiler)
X ft. (lateral relative to oiler)
BN score
right 0 Doesn’t matter X > 140 0.9
right 0 < Y < 180 Doesn’t matter Doesn’t matter 0.9
right -180 < Y < 0 X > 700 Doesn’t matter 0.9
left 0 Doesn’t matter X > 140 0.9
left 0 < Y < 180 X > 700 Doesn’t matter 0.9
left -180 < Y < 0 Doesn’t matter Doesn’t matter 0.9
Note. All other combinations receive a BN score of 0.1.
SOG Steadiness
Use calculations for Phase 1: SOG Steadiness.
COG Steadiness
Use calculations for Phase 1: COG Steadiness.
20
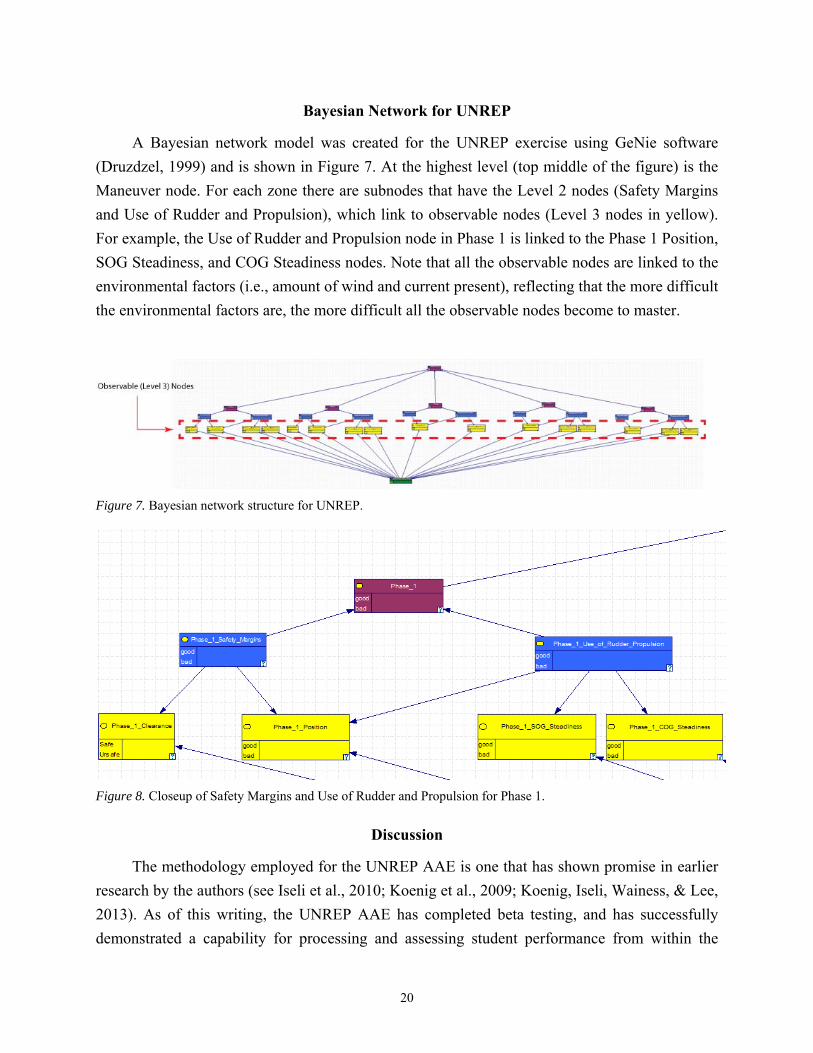
Bayesian Network for UNREP
A Bayesian network model was created for the UNREP exercise using GeNie software
(Druzdzel, 1999) and is shown in Figure 7. At the highest level (top middle of the figure) is the
Maneuver node. For each zone there are subnodes that have the Level 2 nodes (Safety Margins
and Use of Rudder and Propulsion), which link to observable nodes (Level 3 nodes in yellow).
For example, the Use of Rudder and Propulsion node in Phase 1 is linked to the Phase 1 Position,
SOG Steadiness, and COG Steadiness nodes. Note that all the observable nodes are linked to the
environmental factors (i.e., amount of wind and current present), reflecting that the more difficult
the environmental factors are, the more difficult all the observable nodes become to master.
Figure 7. Bayesian network structure for UNREP.
Figure 8. Closeup of Safety Margins and Use of Rudder and Propulsion for Phase 1.
Discussion
The methodology employed for the UNREP AAE is one that has shown promise in earlier
research by the authors (see Iseli et al., 2010; Koenig et al., 2009; Koenig, Iseli, Wainess, & Lee,
2013). As of this writing, the UNREP AAE has completed beta testing, and has successfully
demonstrated a capability for processing and assessing student performance from within the
21
COVE simulator, via processed telemetry received (offline) from the COVE-ITS. These
assessments included both the scoring of observable student actions (pertaining to Clearance,
Speed Over Ground, Course Over Ground, and Position), as well as inferences of student skills
proficiency in performing the UNREP evolution, including Maintaining Margins of Safety, Use
of Rudder and Propulsion, and Overall Ship Maneuvering. At each of these levels of assessment,
software testing has verified that the AAE is able to successfully detect and capture the data
required for the assessment measures and implement the associated scoring rubrics, as derived
from the SWOS SMEs.
In the coming months, and as logistics can be coordinated with SWOS students’
throughput, the UNREP AAE will undergo an assessment validation study, in which it will be
used to assess a sampling of SWOS students performing the UNREP evolution in the COVE.
The resulting scores and inferences made by the AAE will be compared to those made by expert
instructors, who will have observed and scored the same students during the same runs,
independent of the UNREP AAE. The results of this validity study will be used for further
discussion and refinement of the Bayesian network within the AAE to ensure that it is adequately
reflective and encompassing of the assessment priorities and practices of the SWOS instructors.
AAE Utility
Performing scoring within a simulation of meaningful and observable student actions, and
subsequently aggregating these scores and injecting them as evidence into Bayesian networks (or
other similar inferencing models) is well suited for automation using software. However the
design of such an automated system is not a trivial task, and indeed, has proven difficult in the
past, especially when applied to open, unconstrained, and dynamic simulation environments
(e.g., see Conati, Gertner, & VanLehn, 2002; Martin & VanLehn, 1995; Remolina,
Ramachandran, Stottler, & Howse, 2004). CRESST’s current efforts in automating the
assessment of shiphandling skills from student-demonstrated simulation performance will help
inform the body of knowledge and collection of best practices in this area. Automated
performance assessment of this type offers utility that extends beyond that of just military
applications, with relevance to other commercial sectors as well, including the medical training
and certification domain (Koenig et al., 2013).
22
References
Conati, C., Gertner, A., & VanLehn, K. (2002). Using Bayesian networks to manage uncertainty in student modeling. User modeling and user-adapted interaction, 12(4), 371–417.
Druzdzel, M. J. (1999). SMILE: Structural Modeling, Inference, and Learning Engine and GeNIe: A development environment for graphical decision-theoretic models (Intelligent Systems Demonstration). In Proceedings of the Sixteenth National Conference on Artificial Intelligence (AAAI-99) (pp. 902-903). Menlo Park, CA: AAAI Press/The MIT Press.
Iseli, M. R., Koenig, A. D., Lee, J. J., & Wainess, R. (2010). Automated assessment of complex task performance in games and simulations. In Proceedings of the Interservice/Industry Training, Simulation and Education Conference, Orlando, FL.
Koenig, A., Iseli, M., Wainess, R., & Lee, J. J. (2013). Assessment methodology for computer-based instructional simulations. Military Medicine, 178(10S), 47–54.
Koenig, A. D., Lee, J. J., & Iseli, M. R. (2016). CRESST shiphandling automated assessment engine: Mooring at a pier (CRESST Report 852). Los Angeles: University of California, Los Angeles, National Center for Research on Evaluation, Standards, and Student Testing (CRESST).
Koenig, A., Lee, J. J., Iseli, M., & Wainess, R. (November, 2009). A conceptual framework for assessing performance in games and simulations. Paper presented at the 2009 annual Interservice/Industry Training, Simulation and Education Conference (I/ITSEC), Orlando, FL.
Martin, J., & VanLehn, K. (1995). Student assessment using Bayesian nets. International Journal of Human-Computer Studies, 42(6), 575–591.
Norris, S. D. (1998). Task analysis of underway replenishment for virtual environment shiphandling simulator scenario development (Master’s thesis, Naval Postgraduate School). Retrieved from https://ntrl.ntis.gov/NTRL/dashboard/searchResults/titleDetail/ADA355905.xhtml
Remolina, E., Ramachandran, S., Stottler, R. H., & Howse, W. R. (2004). Intelligent simulation based tutor for flight training. Paper presented at the Industry/Interservice, Training, Simulation & Education Conference, Orlando, FL.
Wong, J. H., Kirschenbaum, S. S., & Peters, S. (2010). Developing a cognitive model of expert performance for ship navigation maneuvers in an intelligent tutoring system. Newport, RI: Naval Undersea Warfare Center Division.