Embed Size (px)
Citation preview

CRESST REPORT 746
Jamal Abedi
Jenny C. Kao
Seth Leon
Lisa Sullivan
Joan L. Herman
Rita Pope
Veena Nambiar
Ann M. Mastergeorge
EXPLORING FACTORS THAT
AFFECT THE ACCESSIBILITY
OF READING COMPREHENSION
ASSESSMENTS FOR STUDENTS
WITH DISABILITIES: A STUDY
OF SEGMENTED TEXT
NOVEMBER, 2008
National Center for Research on Evaluation, Standards, and Student Testing
Graduate School of Education & Information Studies
UCLA | University of California, Los Angeles


Exploring Factors that Affect the Accessibility of Reading Comprehension Assessments
for Students with Disabilities: A Study of Segmented Text
CRESST Report 746
Jamal Abedi CRESST/University of California, Davis
Jenny C. Kao, Seth Leon
CRESST/University of California, Los Angeles
Lisa Sullivan University of California, Davis
Joan L. Herman
CRESST/ University of California, Los Angeles
Rita Pope, Veena Nambiar University of California, Davis
Ann M. Mastergeorge
University of California, Davis, Human Development and Family Studies MIND Institute, School of Medicine
November 2008
National Center for Research on Evaluation, Standards, and Student Testing (CRESST) Center for the Study of Evaluation (CSE)
Graduate School of Education & Information Studies University of California, Los Angeles
300 Charles E. Young Drive North GSE&IS Bldg., Box 951522
Los Angeles, CA 90095-1522 (310) 206-1532

Copyright © 2008 The Regents of the University of California. The work reported herein was supported under a subcontract from the National Center on Educational Outcomes/University of Minnesota (NCEO/UMINN) funded by grant no. Q3036031101, as administered by the U. S. Department of Education. The findings and opinions expressed in this report are those of the authors and do not necessarily reflect the positions or policies of NCEO/UMINN or the U. S. Department of Education.

5
EXPLORING FACTORS THAT AFFECT THE ACCESSIBILITY OF
READING COMPREHENSION ASSESSMENTS
FOR STUDENTS WITH DISABILITIES: A STUDY OF SEGMENTED TEXT1
Jamal Abedi CRESST/University of California, Davis
Jenny C. Kao, Seth Leon CRESST/University of California, Los Angeles
Lisa Sullivan University of California, Davis
Joan L. Herman CRESST/ University of California, Los Angeles
Rita Pope, Veena Nambiar University of California, Davis
Ann M. Mastergeorge University of California, Davis, Human Development and Family Studies
MIND Institute, School of Medicine
Abstract
This study sought to explore factors that affect the accessibility of reading comprehension assessments for students with disabilities. The study consisted of testing students using reading comprehension passages that were broken down into shorter “segments” or “chunks.” The results of the segmenting study indicated that: (a) segmenting did not affect reading performance of students without disabilities; suggesting that it does not compromise the validity of reading assessment; (b) segmenting did not affect reading performance of students with disabilities; (c) the segmented version had a higher reliability for students with disabilities without affecting the reliability for students without disabilities; and (d) no trends were observed with student motivation, general emotions and moods with respect to the segmented assessment. The study also introduced the idea of incorporating some commonly used accommodations for students with disabilities, such as test breaks, into the assessment. Limitations of the study included a disability sample with mostly students with specific
1 We would like to acknowledge the valuable contribution of colleagues in this study. We express thanks to Martha Thurlow, Ross Moen, Deborah Dillon, and Kristi Liu, and other staff at the National Center on Educational Outcomes, and all members of the Partnership for Accessible Reading Assessment, including the Technical Advisory Committee for their helpful comments and suggestions. We are also grateful to Eva Baker for her support of this work. We would also like to thank Jisel Vega for her involvement in this study. We would also like to thank Sarah Abedi and Angela De Cenzo for assisting with data entry. Special thanks to all of the consultants, specialists, teachers, and students who volunteered to participate in the study.

6
learning disabilities and a high number of ELL students, as well as a reading assessment that only tested for reading comprehension and not other components of reading. More research using the methods in this study with different subjects can potentially shed additional light on accessibility issues in reading comprehension tests.
Introduction/Perspective
Students with disabilities have been historically excluded from accountability testing. However, recent legislation such as the reauthorization of the Individuals with Disabilities Education Act (IDEA) and the No Child Left Behind (NCLB) Act of 2001 mandate inclusion of these students in statewide accountability to promote higher achievement for these students. Although this is a very positive development, it has introduced many challenges for states to improve the quality of assessments for these students.
States are required to annually assess all of their students, which include students with disabilities. In addition, states are also required to report the academic achievement of students with disabilities as a separate subgroup (IDEA, 1997, 2004; NCLB, 2002). Participation of students with disabilities in assessment has consequently seen a dramatic increase since the implementation of NCLB. Klein, Wiley, and Thurlow’s (2006) review of state practices found that 44 states reported participation and performance for students with disabilities on all of their NCLB assessments. Although federal regulations allow states to count a small percentage of students taking alternate assessments (students with significant cognitive disabilities) toward their adequate yearly progress (AYP) calculations for NCLB, most students with disabilities take general assessments. Providing regular assessments that are accessible to students with disabilities is of paramount importance for states. As reported by states in the 2003–2004 Annual Performance Reports, 85 percent of middle school students with an individualized education plan (IEP) participated in regular reading assessments (Thurlow, Moen, & Altman, 2006). Therefore, it has become more critical to ensure fair and accurate assessments for students with disabilities.
In order to increase the participation of students with disabilities in general assessments, these students are often provided with testing accommodations. Accommodations are changes to testing materials or the testing environment, such as changes to the presentation, setting, timing or scheduling, or response method (Thurlow, Elliott, & Ysseldyke, 1998). Accommodations are meant to level the playing field for students with disabilities, and allow them to demonstrate their knowledge and skills without altering the underlying construct being measured. Although accommodations have been proposed and used, there is controversy about the validity of accommodated assessment outcomes and the threat that they may create for test score comparability. Consequently,

7
there has been a shift toward the concept of Universal Design, which would reduce the number of needed accommodations but still enable increased participation in assessments (Thompson, Johnstone, & Thurlow, 2002).
The present study borrowed from both concepts of providing accommodations as well as Universal Design, but initially began as an exploration of potential factors that interfere with the accessibility of reading assessments for students with disabilities. Students with disabilities traditionally perform at substantially lower levels on standardized tests than students with no apparent disabilities (Abedi, Leon & Mirocha, 2003; Ysseldyke et al., 1998). In the 2005 National Assessment of Educational Progress, the Nation’s Report Card, the percentage of students performing at or above the Basic level in reading was substantially different between students with disabilities (33%) and students without disabilities (75%) (Perie, Grigg, & Donahue, 2005). Although their lower performance may partly be attributed to their specific disability, other factors may potentially affect their performance, such as the lack of opportunity to learn in the classroom, students’ frustration and fatigue, or the lack of appropriate testing accommodations. Results from our previous study indicated that some test items functioned differently for students with disabilities than for students without disabilities. (Abedi, Leon, & Kao, 2007a, 2007b). The present study sought to extend the research toward exploring factors of a reading assessment that may interfere with its accessibility for students with disabilities.
Who Are Students with Disabilities?
There are over 6.7 million children and youth with disabilities in the United States (U.S. Department of Education, 2006). Students served by federally supported programs for disabilities during the 2005–2006 school year represented nearly 14% of total enrollment. Of these, nearly 41% (or over 2.7 million) were considered students with specific learning disabilities. Other cataloged disability categories include speech or language impairments (21.9% or nearly 1.5 million), mental retardation (8.3%, or just over half a million), and emotional disturbance (7.1%, or just under half a million)2. Data are also collected on students with hearing impairments, orthopedic impairments, other health impairments, visual impairments, multiple disabilities, deaf-blindness, autism, traumatic brain injury, and developmental delay (U.S. Department of Education, 2006).
2 The most up-to-date information on exact numbers of students with disabilities are available on the Web site for the Individuals with Disabilities Education Act (IDEA) data, at www.ideadata.org

8
Background of the Study
The present study is one in a series of research efforts by the Partnership for Accessible Reading Assessments (PARA) to identify factors that affect the accessibility of reading assessments for students with disabilities. This study investigated whether a specific test format feature would impact the performance of students with disabilities in a reading comprehension test. The format feature stems from combining the concepts of test breaks (an accommodation) working memory capacity (psychological theory), and test formatting. For the purposes of this study, we have termed this concept as “segmented text,” which is loosely related to the concept of “chunking.” “Chunking” has previously been described in the literature as related to working memory capacity, with the hypothesis that reading material chunked into meaningful units facilitates reading comprehension and efficiency (Casteel, 1988–89, 1990; Keenan, 1984; Stevens, 1981). In some of the literature chunking refers to breaking up or reorganizing sentences into units of thought. Our concept of segmenting also refers to grouping things into meaningful units, but, instead of chunking words and phrases together, we grouped “segments” of passages immediately with their corresponding items. In order to distinguish the present study from past literature on chunking, we use the term “segmented text” to refer to the way we grouped segments of reading passages immediately with their corresponding items. This would add to the literature where previous literature did not exist. The segmented text would also serve as a variation of “built-in” test breaks, as students would tackle individual passage segments one at a time. Having the accommodation built directly into the test would thereby reduce the need to provide the accommodation separately and facilitate administration. More detail on the segmenting process is provided in the Method section. The present study also includes preliminary investigation of motivation and emotional state of the test taker, both of, which may contribute to students’ performance.
In the next section we present a brief review of literature, which served as rationale for the present study. We considered the process of reading comprehension for all readers, as well as for readers with disabilities. We also considered aspects of test format that may affect reading comprehension, as well as student affective factors, such as motivation. Our specific research questions follow the literature review.
Literature Review
The main focus of this study is accessibility of reading comprehension assessments for students with disabilities. The literature review provided here introduces the general topic of reading, and then addresses specific issues in reading for students with disabilities. We then present a summary of research on the assessment of reading for these students. Issues

9
concerning accommodations for students with disabilities are important considerations in the assessment of these students. A brief discussion of accommodations is presented, including some literature related to segmenting, the main topic of this study. In addition to cognitive factors affecting performance of students with disabilities in reading, non-cognitive factors also influence their reading performance. In this study we explored some of the non-cognitive factors that may affect reading assessment outcomes of these students. Therefore, a summary of literature on non-cognitive factors has also been included.
Reading Theory
Reading in the English language involves a complex set of processes and abilities. Several cognitive processes are assumed to be imperative to the development of reading, particularly the reading of words. Siegel (1993) postulated five processes to be significant in the acquisition of reading. The first involves phonology, the association of sounds with letters and exceptions to the basic sound-letter correspondence rules being one of the most important skills necessary to develop in this category. Second, understanding of syntax, or the way in which words are put together to form phrases, is also thought to be an important process in reading. The third process, working memory, refers to the ability to hold information in the short term memory, while handling information coming in and acquiring information from the long term memory. Semantics, or the comprehension of meaning, is the fourth process thought to be important in reading. Lastly, orthography or the understanding of writing rules and knowledge of spelling is hypothesized to be integral to the reading process.
Specific abilities necessary for reading include word identification, phonemic awareness, comprehension, reading fluency, and vocabulary (Adams, 1990; Chall, 1967; Clay, 1993; Gough, Hoover, & Peterson, 1996; Snow, Burns, & Griffin, 1998; Stahl & Murray, 1998; Stanovich, 1994, as cited in Buly & Valencia, 2002). Capable readers draw on these various abilities, ranging from low-level processing skills, such as recognizing individual words, to high-order processing skills, such as bringing together information from different sources into “meaningful representations of text” and then relating this text back to prior knowledge (National Accessible Reading Assessment Projects, 2006, p. 4). Thus reading involves several levels of processes and skills that must be combined to make meaning of written text (Curtis & Glaser, 1983).
Reading comprehension is an important goal of the reading process and comprehension is influenced by several factors. The decoding process comprises one level of reading comprehension (Kintsch & Kintsch, 2005). Decoding skills are thought to be particularly
10
important in comprehension among younger children (Saarnio, Oka, & Paris, 1990). In addition, working memory span impacts the understanding of text (Garrison, Long, & Dowaliby, 1997; Kintsch & Kintsch, 2005; Saarnio et al., 1990). When the working memory is limited, the processing of text is constrained, thus impacting understanding. Other factors affecting reading comprehension include knowledge of words and general knowledge. Meaning and deep understanding occurs when an individual has prior knowledge in the memory to connect with the visual information received from the text (Baldwin, Peleg-Bruckner, & McClintock, 1985; Carr & Thompson, 1996; Smith, 1994). For instance, expert readers comprehend texts more easily than novice readers because of their vast experience and familiarity with domain specific vocabulary and knowledge (Kintsch & Kintsch, 2005).
Reading comprehension, then, does not simply involve decoding letters and sounds or seeing whole words, but is “the interaction of the child’s previous experience and language skills with the writer’s printed message” (Kibby, 1979, p. 390). Furthermore, metacognitive skills are imperative in reading comprehension (Kintsch & Kintsch, 2005; Miller, 2005; Oakhill & Cain, 2000). Good readers must have the ability to make inferences from the text or understand figurative language. The expert reader must also know when to use particular reading strategies and monitor understanding of text.
Additional factors such as motivation and interest affect reading comprehension (Kintsch & Kintsch, 2005). Saarnio et al. (1990) found that motivational factors such as positive and high self-perceptions in the area of reading, student value in reading, and the enjoyment of reading, influence the understanding of text. In addition, motivational factors gain importance as predictors of reading comprehension ability as readers’ age and develop more skill. The effect of topic interest may also have a separate effect from prior knowledge on reading comprehension (Baldwin et al., 1985).
Reading and Students with Disabilities
Although it is important to understand how reading development occurs for typical students, it is also necessary to examine how reading development for students with special needs may differ from typical students, or how a disability may affect the acquisition of reading skills. In doing this, however, one must keep in mind that students who are designated as having special needs are vastly heterogeneous in terms of their disability category; these differences may impact reading development for each group differentially and for some disability categories, reading development will not significantly differ from students without disabilities at all. The following disabilities are those the U.S. Department of Education (2006) recognized for students receiving special education services in the K–12

11
system: specific learning disabilities, speech or language impairments, mental retardation, emotional disturbance, multiple disabilities, hearing impairments, orthopedic impairments, other health impairments, visual impairments, autism, deaf-blindness, traumatic brain injury, and developmental delay. These broad disability categories can sometimes be broken down further into more specific disabilities; for example, dyslexia is a form of specific learning disability.
Research has been conducted on broad disability categories such as specific learning disabilities and more specific categories such as dyslexia. Having learning disabilities is believed to directly impact the acquisition of reading (Vaughn, Linan-Thompson, & Hickman, 2003). Swanson (1993) examined the effects of working memory on reading comprehension for students with disabilities. The results of that study support the idea that students with learning disabilities have weaker working memories than skilled readers because they have less working memory capacity available to them when engaging in reading tasks. Dyslexia has been the focus of much research, particularly because of its immense prevalence in the United States (Shaywitz et al., 2003). Research has shown that the cognitive deficit of dyslexia thought to inhibit reading acquisition is related to phonology (Shaywitz, 1998; Siegel, 1993; Snowling, Goulandris, & Defty, 1996; Stanovich, 1994).
Prior knowledge appears to affect both students with disabilities and those without disabilities. Carr and Thompson (1996) compared the reading comprehension abilities of students with learning disabilities with peers of the same age and reading level. Students were tested using reading passages on topics that were familiar and unfamiliar to students in order to test the effect of prior knowledge on reading comprehension outcomes. Their study reported that prior knowledge was a significant predictor of reading comprehension test results for both students with learning disabilities and their peers.
The reading process presents unique challenges for different subgroups of students with disabilities. Students with specific learning disabilities may have difficulties in one or more of the areas of acquiring listening, speaking, reading, writing, reasoning or mathematical skills (National Joint Committee on Learning Disabilities, 1998; Partnership for Accessible Reading Assessment, 2006a; 2006b; 2006c; 2006d; 2006e; 2006f; 2007). In terms of reading skills, the most prominent challenges for these students are basic print reading and reading comprehension (Gersten, Fuchs, Williams, & Baker, 2001). The underlying relationship between overall language development and reading skills suggests that delayed receptive and expressive language may contribute to reading difficulties for these students (Catts, Fey, Zhang, & Tomblin, 1999; Catts & Kamhi, 2005; Scarborough, 2001).
12
Students who are blind and read Braille interact with the reading process differently from students with visual impairments who may use assistive technology and magnifying equipment to read text. Although much research has examined the psychophysical aspects of reading Braille, little research has been conducted examining how reading development occurs on a cognitive level for Braille reading students who are blind (Knowlton & Wetzel, 1996). A study conducted by Carreiras and Alvarez (1999), however, explored the comprehension processes of reading Braille text and found that many cognitive processes were similar to those of reading printed text, particularly at the level of word processing. However, Braille readers did differ in sub-lexical processes. In particular, graphemic frequency, clause and sentence boundaries, and integration processes in Braille were not found to be significant.
The reading process for deaf students has been examined as well. Reading among students who are deaf or hard-of-hearing students appears to be influenced by the communication process as a whole. For example, Chamberlain (2002) suggested that reading development for these students will be impacted by their success in obtaining a primary language. If a signed or spoken primary language is incomplete this will alter the acquisition of reading skills. Goldin-Meadow and Mayberry (2001) argued that the reading process for students who are deaf or hard-of-hearing requires more than solid language skills. In addition, the skill of mapping between language and print must be developed. Reading comprehension may prove the most challenging for students who are deaf or hard of hearing due to the inability of these students to recognize words automatically and the difficulties with deciphering sentence patterns (Kelly, 2003). A study by Brown and Brewer (1996) examined how deaf and less skilled reading students draw inferences, taking into account ability. The study found that less skilled deaf readers were slower and made more errors on lexical decision tasks, indicating possible lexical processing issues.
Assessing Students with Disabilities
Accommodations. As mentioned earlier, students with disabilities traditionally perform at substantially lower levels than students with no apparent disabilities (Ysseldyke et al., 1998). Although students with more severe cognitive disabilities participate in alternate assessments, students with less severe cognitive disabilities participate in regular assessments, and are given testing accommodations suited to their specific needs. Accommodations allow for students with special needs to participate in regular assessments and for their test scores to become aggregated with the rest of the general population. Generally, accommodations are changes to the testing materials or testing environment, and do not alter the construct of the test (Lazarus, Thurlow, Lail, & Christensen, in press;
13
Thurlow et al., 1998). Examples of accommodations include changes to the presentation of the assessment (e.g., large font, read directions aloud), the response method of students (e.g., dictation, calculators, spell-checkers), the time allotted or schedule of test administration (e.g., test breaks, testing on multiple days), and the test setting (e.g., individual administration, small group setting, special adaptive lighting or furniture). Accommodation practices and standards are determined at the state level. When accommodation policies were examined across the states, the most commonly allowed accommodations were extended time, individual administration, dictated response to scribe, small-group administration, large print, Braille, and using an interpreter for instructions (Bolt & Thurlow, 2004).
Of these most commonly allowed accommodations, the research examining their effectiveness is not conclusive. Extended time is the most commonly allowed accommodation yet the research findings have not been conclusive in terms of its effects on student performance (Fuchs, Fuchs, Eaton, Hamlett & Karns, 2000; Lewis, Green, & Miller, 1999). The findings on the read aloud accommodation show that scores for students given this accommodation are in general more valid than when the accommodation was not implemented (Calhoon, Fuchs, & Hamlett, 2000; Fuchs et al., 2000). Dictated response to scribe is another commonly allowed accommodation, however the empirical findings show mixed and inconclusive results in terms of its effectiveness in increasing accessibility, validity and reliability (Fuchs et al., 2000; Koretz, 1997).
Accommodation decisions and practices are uneven and inconsistent in both implementation and reporting. There is often little consensus as to which accommodations should be utilized with specific students or testing situations (Thurlow, House, Boys, Scott, & Ysseldyke, 2000). Most states have a list of allowable accommodations. However, the protocol for implementing specific accommodations is not well defined (Thurlow, Lazarus, Thompson, & Blount-Morse, 2005). The decisions about accommodations in testing situations impact the performance of students with learning disabilities. Agreement on accommodation practices is further complicated by the fact that there is a limited body of research evidence on which accommodations are most appropriate (Abedi, 2006). However, recent research has focused on the most commonly implemented accommodations (Abedi, 2006; Bolt & Thurlow, 2004).
Bolt and Thurlow (2004) prepared a synthesis of nationwide research on the use of key accommodations for students with learning disabilities. Their findings showed that most studies examining the validity of accommodations consider how students with learning disabilities perform in comparison to students without learning disabilities (Fuchs et al., 2000). The most appropriate accommodations are expected to boost the scores of students

14
with learning disabilities without impacting the performance of students without learning disabilities. The test items may also be examined to determine how students with learning disabilities are performing on specific items as compared to students without learning disabilities. Another approach is to simply compare the performances of students with learning disabilities using accommodations to those of students taking the test without accommodations (Bolt & Thurlow, 2004).
Research using the above techniques to examine the most commonly implemented accommodations has not shown significant results on their impact in making assessments more accessible for students with learning disabilities. In one exception, the dictated response accommodation was shown to boost scores for students with learning disabilities (Bolt & Thurlow, 2004), however further research still needs to be conducted on the effectiveness of specific accommodations for specific subgroups of students.
Despite the debate over the impact of accommodations on increasing accessibility for students with learning disabilities, accommodations are widely used in most states (Thurlow et al., 2000). In practice, whether a student with a learning disability is eligible for testing accommodations is a decision that is made at the school level by an individualized education plan (IEP) team using knowledge of Federal Laws for guidance (IDEA, Section 504, Title I). The type of accommodations given to students during assessments should take into account the nature of the test as well as the individual student’s needs (Gartland & Strosnider, 2004). General factors to consider include whether a student can focus adequately in a whole classroom setting and maintain focus during the test administration (Elliott, Thurlow, Ysseldyke, & Erickson, 1997; Gartland & Strosnider, 2004).
Other factors that may impact the implementation of accommodations are awareness and availability of resources at both the school and classroom level. As an example, the use of an interpreter for instructions may not be available in all settings. In other situations, specifically middle school and high school, teachers are required to interact with hundreds of students daily and may not be as familiar with, or have access to, student IEPs. Another consideration is that students may not want to utilize accommodations that draw attention to their disability or separate them from the classroom setting.
Test Breaks as an Accommodation. Allowing test breaks, or providing frequent breaks throughout the administration of a test, is one of the most commonly allowed accommodations by states. In a review of 2005 state policies, 42 states listed test breaks as an allowable accommodation (Lazarus, Thurlow, Lail, Eisenbraun, & Kato, 2006). This accommodation includes breaks that are not built into the administration of the test. Such test
15
breaks would be permitted when a student feels distracted or not able to continue concentrating on the test. These breaks would be in addition to the breaks between subtests that are often built into test administration. The test break accommodation may be especially useful for students who are suffering from fatigue or frustration (Thurlow & Bolt, 2001). Students with learning disabilities may be susceptible to difficulties with concentration or issues of fatigue. Students with learning disabilities may also struggle with attention problems that make it more difficult for them to focus for the time required for each subtest administration.
However, providing frequent breaks has not been widely studied in the literature as an accommodation. There is no empirical evidence available which specifically examines the impact of test breaks for students with or without learning disabilities. There have been some studies which examined extending test administration over multiple days, which is an accommodation that falls under the same category as test breaks but is less frequently allowed by states (DiCerbo, Stanley, Roberts, & Blanchard, 2001; Walz, Albus, Thompson, & Thurlow, 2000).
In one such study, Walz et al. (2000) compared the performance of 112 seventh- and eighth-grade students on a 1- and 3-day administration of a state achievement test in reading. They also compared students with learning disabilities (48) with students without learning disabilities (64) for the two formats. In the 1-day format, students read all three passages and answered all of the corresponding questions. In the 3-day administration, students read one passage and the corresponding questions each day. However, the results of this study did not find a significant difference between the 1-day and 3-day test administration format for students with disabilities. In addition, students without disabilities received higher scores when the test was administered in 1 day.
In another study of this type, DiCerbo et al. (2001) modified the Stanford 9 reading comprehension test, which was developed for 1-day administration, for 939 third graders to study the impact of extending the administration over 2 or 3 days. Extending administration to a second or third day did not impact the overall time students were given to complete the test. This study did not specifically identify or compare students with learning disabilities. The results showed an increased scaled score of 12 points for students who were given either the 2- or 3-day test format. In addition, there was a significant interaction between reading comprehension level and the 2- or 3-day formats. Students who were low to average ability readers gained more from the 2- or 3-day format than high ability readers.

16
If offering frequent test breaks to students with disabilities can improve their test scores without altering the construct of the test, then it should be more widely provided in practice. However, research is needed to ensure that it is in indeed effective and valid for students with disabilities.
Chunking or Segmenting as an Accommodation. Segmenting text, as defined in the present study, (described in further detail in the Method section), has not been studied in past literature. However, the concept of segmenting borrows from previous work related to working memory capacity and “chunking” text into meaningful units. Chunking in previous literature has largely referred to breaking down words and phrases within a sentence into more manageable “chunks.” Although this literature is not extensive or conclusive, there have been some promising findings (Barrera, Liu, Thurlow & Chamberlain, 2006; Casteel, 1988–1989; 1990; Rasinski, 1990).
Past studies considered whether “chunking” text into meaningful units has an effect on comprehension and retention. For example, Rasinski (1990) reviewed literature which examined the impact of chunking text on reading comprehension performance. These studies employed the technique of “phrase cued text” to chunk reading passages into meaningful, short units. Phrase cuing is a form of text organizing that uses headings to focus the reader. In general, studies reviewed by Rasinksi showed that organizing text into smaller units did facilitate memory recall and improve comprehension for certain readers, specifically younger, struggling readers. This technique also improved comprehension for hearing impaired students.
There are several studies (Barrera et al., 2006; Casteel, 1988–1989; Hartley, 1992) that examined forms of chunking as instructional tools to improve reading comprehension for students with disabilities. For example, Barrera et al., (2006) utilized a technique known as “chunking and questioning aloud” as a strategy to improve reading comprehension for English language learners with disabilities. This strategy involved reading small chunks of passages and stopping to check students’ comprehension. Although the sample size was small, the findings suggested that this strategy did have a positive impact on reading comprehension levels. Hartley (1992) examined whether chunking text into sentences improved memory recall for 12–13 year old students. The results showed that this type of chunking did not have a significant impact on recall.
Although the definition of chunking in past literature differs from our current definition of segmenting, both concepts share the common ground of providing readers with meaningful “units” of thought as well as dealing with students’ working memory capacity.
17
Whether those units best occur intrasententially, or intersententially, deserves further research. The present study aims to add to this body of literature.
Measurement Theory. Classical measurement theory is based on the assumption that measurement error has a similar random distribution for all students and no differential subgroup trend is assumed (Allen & Yen, 1979). However, test bias can occur when performance on a test requires sources of knowledge different than those intended to be measured, causing the test scores to be less valid for a particular group (Penfield & Lam, 2000). Although students with disabilities’ lower test performances can partly be attributed to their disability, sometimes even students provided with accommodations meant to address their specific disability still do not perform to their maximum potential. Specific characteristics of a test itself can be a reason. Variables unrelated to the construct of an assessment may affect its reliability and validity for students with disabilities. Haladyna and Downing (2004) created a taxonomy consisting of 21 potential sources of systematic errors associated with construct-irrelevant variance, which included factors related to test development, such as item quality and test item format. Researchers should endeavor to identify these factors so that practitioners may improve the measurement of students’ knowledge.
Affective Factors and Student Test Performance
Even in ideal conditions in which a test is developed with perfection, and accommodations fully serve the needs of students, performance on an assessment can be influenced by affective factors such as anxiety and motivation. The literature has focused primarily on how these affective factors impact students without disabilities, which we briefly discuss below. A small body of research extends this work to some disability populations.
Motivation. Motivation has been found to impact reading comprehension tasks and in particular student performance on reading comprehension assessments. Guthrie and Wigfield (2005) examined two types of motivation: general motivation that is static across time and situational motivation that is specific to the task. Of these two types of motivation, situational was shown to be the most influential on reading comprehension assessments. In a review of 14 empirical studies, Schiefele (1999) found that situational motivation and text comprehension were significantly correlated. This relationship was independent of passage length, type of passage and difficulty level, method of learning, age of students and reading ability.

18
Guthrie and Wigfield (1999) suggested that motivational factors are of equal importance to cognitive factors in reading comprehension assessments. They found that motivation can have an indirect effect on cognitive processing. According to Guthrie and Wigfield motivation processes involved in reading comprehension can be broken down into key attributes: intrinsic motivation, task mastery goals, self-efficacy, personal interest and beliefs about reading. These separate elements of motivation have been shown to be the most relevant to reading tasks. In addition, these attributes can be manipulated and measured in relation to reading comprehension tasks. For example, passage interest or length may impact cognitive engagement and thus comprehension (Schiefele, 1999).
The impact of motivation on reading comprehension assessments is difficult to measure when we consider that overall motivation is a predictor in achievement levels. Cox and Guthrie (2001) found that levels of motivation predicted the amount of reading in Grades 3 and 5. Therefore, students who are more generally motivated are likely to spend more time engaging in reading, which has been shown to directly impact achievement on reading tasks (Baker & Wigfield, 1999).
More specifically, intrinsic motivation was found to be highly predictive of text comprehension. In a study by Wang and Guthrie (2004), intrinsic motivation was significantly correlated with reading comprehension achievement whereas past reading levels, extrinsic motivation, the amount of reading for enjoyment and in school, were statistically controlled.
Assessments of reading comprehension contain specific elements that may influence student motivation. For example, text interest, learner control, learner goals, difficulty sequence, and task complexity all impact situational motivation (Guthrie & Wigfield, 2005). These key aspects of reading comprehension assessments can be altered, thereby impacting student outcomes.
Student interest level has been found to impact reading comprehension levels for some students. A study by de Sousa and Oakhill (1996) examined elementary school reading assessments. They found that passage interest level was a more important factor for low-level readers than for high-level readers. The authors concluded that comprehension strategies were not employed as frequently when interest levels were low.
Several studies have shown that learner goals also impact student performance. Mastery goals at the time of learning result in increased student motivation and performance on assessments. Performance or avoidance goals result in decreased student achievement (Guthrie & Wigfield, 2005). Another aspect of motivation theory that may impact reading

19
comprehension assessments is student choice and control. Motivation levels have been found to be directly related to students’ choice and control over the testing environment (Ryan & Deci, 2000).
Motivation appears to have an even more significant impact on reading comprehension when complexity and difficult of the passage increases. Guthrie and Wigfield (2005) found that student motivation impacted performance on a complex comprehension task. However, motivation did not predict achievement on a less complex reading comprehension task.
Situational motivation may also be impacted by student self-efficacy. Self-efficacy can be manipulated by the placement of difficult items in assessments. In a study by Schunk and Zimmerman (1997) it was found that achievement on a reading comprehension assessment increased as self-efficacy increased. The authors suggested that placing easier items at the beginning of an assessment may increase self-efficacy and indirectly impact motivation levels.
Situational motivation can be manipulated in an assessment situation by incorporating intrinsically motivating activities into the testing environment. Guthrie and Wigfield (2005) concluded that motivation should be considered a component of reading comprehension. They suggested that valid assessments of reading comprehension should include a motivational dimension.
Affective Factors and Students with Disabilities
The research on the affective responses of students with learning disabilities to reading comprehension assessments and assessments in general is very limited. Durrant (1993) studied achievement attributions of students with learning disabilities and found that there were not significant differences in how these students attributed academic success. However, students with learning disabilities were more likely to attribute academic failures to lack of motivation. This would suggest that this subgroup of students may need additional motivational input to perform at their optimal level on assessments.
Student Reports of Motivation. Paris, Lawton, Turner, and Roth (1991) conducted a survey study of 1,000 students regarding their attitudes towards testing, highlighting motivation, strategies, and feelings. A secondary analysis divided a smaller sample of students into low and high achievers. The findings showed several trends. Motivation decreased from elementary to middle school. In addition, middle school students were found to use inappropriate test taking strategies. Differences were found between low and high achievers in that high achievers showed more persistence, had more positive self-perceptions, and made more appropriate use of strategies.

20
Differences in motivation levels appear between subgroups of students as well. Fulk, Brigham, and Lohman (1998) compared learning disabled (LD)3, emotionally behavior disabled (EBD) and average students (AA) on motivational characteristics using self-report instruments. Two additional measures, the Purposes of School Scale and the Motivated Strategies for Learning Questionnaire were used to examine attitudes towards school and testing. The results showed that students in the LD group had less positive views about school than either the EBD or AA group. LD students exhibited avoidance behaviors more than the other two groups. The study also found that LD students who were integrated into a general education classroom reported a higher degree of alienation from school than EBD students who were in a special education classroom. No differences were found between the three groups for self-regulation, self-efficacy, and cognitive strategy use.
Test Anxiety. A small body of literature focuses on the role of anxiety as a factor impacting student achievement on assessments (Al Safi, 2003; Elliot & McGregor, 1999; Wade & Moore, 1993). As with other factors, this research focuses primarily on students without disabilities. Two types of anxiety have been identified that may influence student performance, state and trait anxiety (Elliot & McGregor, 1999). State anxiety is situational and depends upon feelings about a particular context. Trait anxiety is a more static factor that does not change greatly over time. Both types of anxiety may influence student performance on tests. The factors that impact test anxiety are similar to those involved in motivation. The research in this area focuses on identifying factors that are involved in both state and trait anxiety. For example, several studies examine the role of mastery and performance goals.
In this area, Elliot and McGregor (1999) assessed achievement goals for college students during the second week of class. These findings were then compared to students’ academic performance as well as SAT scores. The results showed a significant relationship between exam performance and both performance avoidance and performance approach goals. The regression of state test anxiety on performance avoidance goals also yielded a significant result. In addition the authors proposed incorporating state test anxiety plus fear of failure and trait test anxiety into the approach/avoidance model of achievement motivation. The results showed that state test anxiety and fear of failure had a significant relationship to the adoption of performance avoidance goals.
Regarding students with learning disabilities, test anxiety has not been studied in depth. Wade and Moore (1993) asked students to respond to a questionnaire as well as to a sentence 3 The authors support spelling out terms rather than using acronyms (e.g., students with disabilities, rather than “SD”). However, when citing or referencing literature, we chose to retain the terminology as published by the source.

21
completion survey regarding their feelings about high stakes tests. All of the students in the study were classified as having learning disabilities. A large percentage of these students said that high stakes testing made them anxious and that it had an adverse impact on them both physically and emotionally. More specifically, 20% of the students in the study reported that testing was a negative experience overall.
Similarly, Al Safi (2003) found higher levels of anxiety in lower achieving students than high achieving students prior to testing. The author suggested that anxiety increases frustration levels, which then impact performance and achievement. It was found that increased anxiety had a negative impact on performance. The study also examined disposition as a role in test anxiety. High achievers exhibited increased levels of ambition prior to testing when compared to the lower achieving students in the sample. The results showed a significant effect of anxiety on low achievers, and a significant effect of ambition on high achievers.
Rationale
The following research questions guided the methodology, analyses and reporting of the segmented text reading assessment given to Grade 8 students. Research questions are grouped into two general categories: Accessibility and Affective Factors. The notion of segmented text was derived in part from building in test breaks directly into the test booklet as a means of ameliorating the accessibility of the test. Consequently, we examined whether this particular test feature would have acceptable reliability for students with disabilities, and whether it affected their performance on the test. This study also explored some preliminary questions on students’ motivation and emotional state, which could lead to future, more in-depth studies. We considered the questions related to Affective Factors to be secondary to the focus of our study, therefore, results for this portion should be interpreted with caution.
Research Questions
Accessibility.
Segmented Text and Reliability of the Reading Test 1. Does the original version of the reading test have similar reliability for students
with disabilities and students without disabilities?
2. Does the segmented version of the reading test have similar reliability for students with disabilities and students without disabilities?

22
Segmented Text and Performance 3. Does segmented text affect the performance of students without disabilities?
4. Does segmented text affect the performance of students with disabilities? 5. If the performance of both groups improves, is there a greater level of improvement
for students with disabilities?
Segmented Text and the correlation between teacher ratings, English language arts (ELA) achievement test levels and reading performance 6. Does the original version of the reading test have a similar correlation to teacher
ratings and ELA levels for students with disabilities and students without disabilities?
7. Does the segmented version of the reading test have a similar correlation to teacher ratings and ELA levels for students with disabilities and students without disabilities?
Affective Factors.
Segmented Text and Motivation 8. Do the students with disabilities in this study report lower motivation than students
without disabilities? 9. Do the students who take the segmented version of the test report higher motivation
than students who take the non-segmented version?
Segmented Text and Emotion/Mood Inventory (EMI) 10. Do students with disabilities in this study report more negative EMI responses than
students without disabilities when taking the reading test? 11. Do the students who take the segmented version of the test report less negative EMI
responses than students who take the non-segmented version? 12. Does the number of negative EMI responses change for students with disabilities as
they progress towards the end of the test?
Performance at the End versus Performance at the Beginning 13. Is there a difference in performance between students with disabilities and students
without disabilities on the last passage after controlling for performance on the first passage?
14. If so, does this difference in performance occur on both the segmented and non-segmented versions?

23
Method
Prior to finalizing the research design for the study, focus groups were conducted regarding the primary issues that arise related to standardized reading comprehension assessments. The decision to conduct a series of focus groups was based on a growing body of research in the social sciences showing that this is a useful research tool (Doxey, 1996; Morgan, 1997; Stewart, Shamdasani & Rook, 2007). Focus groups are ideal for examining broad themes and shared ideas from experts in a field (Morgan, 1997; Stewart et al., 2007). One of the goals of the focus groups was to gain a deeper understanding of specific issues that arise for educators and students who have experience with standardized reading comprehension assessments. A second goal was to uncover some of the emerging themes that influence the performance of students with learning disabilities. The focus groups were designed to expand on the research knowledge regarding reading assessments and provide practical information about the issues that impact student performance. The emerging themes from the focus groups suggest that there are several important factors that need to be examined more thoroughly when considering issues of accessibility on standardized reading assessments. For a detailed description of the focus group participants, methods and results please refer to Appendix A.
Population and Sample
A total of 738 eighth-grade students from 34 classrooms (21 teachers total) at 10 public schools in California participated in this study. Two of the schools were located in Northern California, whereas the remaining schools were located in Southern California. All schools were located in either a large city or in the urban fringe of a large city. Table 1 below shows basic characteristics of the participating schools. Due to confidentiality agreements with the testing sites, names and exact locations of participating schools will not be revealed in this report.

24
Table 1
Characteristics of Student Population, by Participating School
School
Student participants (percentage of total
study sample) Top race/ethnicity
enrollment
Percentage of free/reduced lunch
eligibility
Percentage of students with Disabilities
1 6.2% 98.6% Hispanic 91.7 11.0%
2 9.1% 62.6% Hispanic 69.0 11.0%
3 2.3% 82.0% Hispanic 93.3 9.3%
4 6.8% 94.7% Hispanic 87.8 9.8%
5 8.3% 80.3% Hispanic 83.9 12.2%
6 12.2% 98.3% Hispanic 97.1 10.8%
7 24.8% 95.3% Hispanic 93.0 10.5%
8 23.0% 47.9% White 46.1 9.3%
9 0.9% 43.3% White 57.4 10.3%
10 6.4% 38.4% White 8.4 9.3%
Note. The second column provides information on what percentage of the participants in the present study come from each of the 10 schools. The race/ethnicity, free/reduced lunch eligibility, and percentage of students with disabilities columns represent the schools’ overall population from the 2005–2006 school year. Source is public data. White denotes non-Hispanic. Percentage of students with disabilities represents those participating in regular assessments.
Of the total 738 student participants in this study, 368 (49.9%) were female and 370 (50.1%) were male. Of the total student participants, approximately 72% were Latino, 18 % were Caucasian, 5% were Asian or Pacific Islander, 4% were African-American, and the remainder were American Indian, or Other. Of the student participants, 734 had information on their California English Learner status. Approximately 37% of the total sample were considered Redesignated Fluent English Proficient (RFEP), 30% were English language learners (ELL), 28% were English-only (EO), and 6% were Initially Fluent English Proficient (IFEP).
There were 117 students (15.9%) with disabilities who participated in this study (620 were students without disabilities, and the status of one student was unavailable). All of the participating students with disabilities were students who participate in mainstream classrooms and take regular assessments. Of the 117 students with disabilities, 107 were students with specific learning disabilities, 2 were deaf or hard of hearing, 3 were autistic, 2 had speech or language impairment, and 4 had other health impairments4. Although 41% of the total population of students with disabilities served in the United States are students with 4 Numbers do not total 117 because one student was listed as having two of the disability categories.

25
learning disabilities (U.S. Department of Education, 2006), our random sample yielded 91% of our total population of students with disabilities as students with learning disabilities. Although our intention was to investigate factors that affect accessibility of students with disabilities, because our sample was primarily students with learning disabilities, we caution that our results may not be representative of the total population of students with disabilities.
Of the 117 students who were classified as students with disabilities, 79 or 68.1% were ELL and 38 or 31.9% were non-ELL (one student had a missing code on ELL status). In contrast, only 22.5% of students without disabilities were English language learners. This disproportional rate of ELL students represented in the learning disability category (68.1% of students with disabilities versus 22.5% of students without disabilities) illustrates major issues in classification of ELL students as students with learning disabilities. This trend, which is consistent with the literature (see for example, Abedi, 2006; Artiles, Rueda, Salazar, & Higareda, 2005), indicates that ELL students at the lower level of English proficiency have a much higher chance of being classified as having a learning disability than non-ELL students.
Instruments
For this portion of the study, a reading comprehension test was the primary instrument used. Secondary instruments included student background questions and student motivation scale (collectively referred to as student questionnaires), which were printed inside the reading test booklet. There was also a student background questionnaire for teachers to complete. The instruments are described in further detail below.
Reading Test. A reading comprehension test was created consisting of three reading passages from existing state assessments. The test was designed to be administered in approximately 50 minutes (or one class period). The first passage was the longest at approximately 700 words, whereas the other two passages were approximately 550 words each. Each passage contained 8 items with 4 possible answer choices, for a total of 24 items in each test. The reading passages and items were obtained, with written permission, from publicly-released eighth-grade standardized reading comprehension tests from two different states other than California. Passages were chosen based on the type and length. Only informational passages were considered (e.g. fiction and literature were excluded). Only passages consisting of multiple-choice items were considered. Passages with a blend of multiple-choice and constructed-response items were excluded.
Of the passages chosen, test items that addressed students’ understanding of and ability to analyze informational text were chosen. Items that queried literary knowledge were

26
omitted. Questions pertaining to vocabulary were also retained. One of the passages contained figures related to the text, whereas another contained a graphical image related but not pertinent to the content. Minor modifications to the way the passages were originally published by states were made. For example, although all three passages contained questions specifically referring to paragraphs by numbers, the third passage was not originally numbered. For the purposes of consistency, we numbered the paragraphs in the third passage as well. Additionally, after expert review of the passages, we corrected a few minor grammatical errors in the first passage.
Two versions of the reading test were created: Version A was standard and Version B was segmented. Segmented text refers to the process of breaking down passages into smaller segments, with corresponding test items immediately following the segments (Please see Appendix B for an example of segmented text). The only difference between Version A and Version B was the segmenting. The process of segmenting the text was completed based on where in the passage an answer could be found, as well as in consideration of natural paragraph breaks (i.e., paragraphs were not split up). Therefore, it was necessary to re-order some of the items from the way they were originally published. Additionally, segments did not always fit neatly on a single page. It became necessary for some segments to continue on to a following page due to space limitations. Items appeared in the same order in both versions of the test, regardless of segmenting. Inferential questions (i.e., questions referring to the entire passage) were placed last in a series of questions. Each passage was broken down into three or four segments, and each passage segment was grouped with one to three test items (not including the inferential questions).
The two versions of the test were professionally printed into a two-sided booklet format with saddle stitching on off-white paper. All text was printed in Garamond font, point size 13. Passages were printed centered on the page with an approximate width of 5 inches, whereas test item lines were printed with an approximate width of 4 inches. A preliminary administration with basic photocopied, single-staple, single-sided tests revealed that students were intimidated by the size of the packets. The professionally printed booklets appeared thinner in size and also appeared less informal.
Student Questionnaires. Students were asked basic questions about their background and reading experiences. These questions were built into the front pages of the test booklets to facilitate administration (see table in Appendix F for these questions and results by student disability status). After each of the three reading passages (and corresponding items), students were asked to think about how hard the reading passage was, and asked to circle words corresponding to their mood and affective state. This was created to obtain a

27
preliminary sense of emotional factors affecting student performance. For the purposes of this report, this will be referred to as the Emotion/Mood Inventory (EMI). The words included were general words attributed to feelings, derived in part from Bloomquist’s (1996) “Feelings Vocabulary Chart.” Additionally, a few words were contributed by reading experts when asked what words would describe the feeling of cognitive overload. The words were a mix of positive, negative and neutral words (see Appendix G for the EMI). There were seven negative emotional words after each passage. To assess the internal consistency of the combined negative EMI scale a Cronbach’s alpha approach was applied. The resulting Cronbach’s alpha for the 21 negative EMI items was equal to 0.904 indicating strong internal consistency.
Also built in to the test booklets was a 10-item, 4-point Likert-type post-test motivation scale. The motivation scale was adapted from Sundre (2000), which combines items querying “importance” and “effort” for a “Total Motivation” score. Wording in the items was modified to suit an eighth-grade reading level. The scale was modified from 5-point to 4-point (omitting “neutral”) in order to force agreement or disagreement. The concept of “neutral” was also deemed as potentially complex for students in eighth grade. The motivation scale appeared on the final two pages of the test booklets. The internal consistency of the motivation scale was examined using the Cronbach’s alpha approach. Two items were removed due to low item to total correlation resulting in an 8-item scale with Cronbach’s alpha equal to 0.827 indicating good internal consistency.
As described above, test booklets combined all student questionnaires, test items, and motivation scale into one booklet (with two versions, original and segmented) to facilitate administration.
Student Background Questionnaire for Teachers. The classroom teachers (21 total) were asked to answer a Student Background Questionnaire for the students we tested. In addition to basic background information, this questionnaire asked teachers to rate, based on their personal opinion, each of their students’ reading comprehension ability based on the same five categories used to classify student performance on the California state standards tests: Advanced, Proficient, Basic, Below Basic, and Far Below Basic. Teachers were also asked to mark what each student’s California Standards Test Proficiency Level was, as well as obtain each student’s California Standards Test Scale Score in English/Language Arts from the prior year.
28
Procedure
Data collection occurred between December 2006 and July 2007. Recruitment flyers were sent out to schools in both Southern and Northern California. Classroom visits were coordinated either by a specific site coordinator at the school, or with the teachers directly. The school site coordinators or teachers contacted us if they wished to participate in the study, as required by our Institutional Review Board (IRB). Classrooms and teachers were therefore enrolled in the study based on teacher interest. Efforts were made to send recruitment flyers to schools with larger student bodies and a greater percentage of students with disabilities who participate in regular assessments.
The two versions of the test booklet (original and segmented) were randomly assigned to students within intact classrooms. The random assignment of test booklets controlled for many sources of threats to internal validity of the design, including threat due to selection, maturation, mortality, and history (see Gay, 1981). A test administration script was used consistently across all classrooms. Administration of the test booklets required approximately one full class period, which was typically 50 to 60 minutes in length. Some classes were 2 hours in length (13 out of 34). Students with disabilities in all of the participating classrooms are typically given extra time during regular assessments, as part of their Individualized Education Plans (IEP). In one school, students were regularly provided small group test administration. We provided these accommodations for our reading test whenever possible.
Test administrators composed general observational notes following each site visit. Test administrators noted the testing environment, including the testing time, students’ focus on the test, questions students may have asked, teachers’ input or feedback, and other general comments relating to the visit. An aggregated summary of these notes are available in Appendix E.
Participating teachers were compensated with gift cards to Target, a major retail store. Teachers received $50 for each classroom enrolled in the study, and $50 for each set of student background questions and ratings provided per classroom.
Statistical Design. For estimating the reliability of the reading comprehension test in this study, we chose the internal consistency approach (Cronbach’s Alpha) for two main reasons: (1) the reading comprehension test was considered an unidimensional assessment because it only measured the reading comprehension construct among several components of reading; and (2) due to logistical issues there were no data on test-retest or parallel forms for estimating reliability of the test.

29
For analyses of performance data a linear analysis of the variance model was used. As indicated earlier in this report, students were randomly assigned to either an experimental condition where they received a segmented reading comprehension booklet or to a control condition where they received a regular reading comprehension booklet. Therefore, random assignment of test booklets within intact classrooms controlled for higher level sources such as class, teacher and school effects. Because students are from intact classrooms where student individual performance is affected by overall class composition and teacher and school characteristics, one might choose to use a hierarchical linear model (HLM) to analyze the data from the test administration. Although a HLM model could be used for this case, the fact that students were randomly assigned within the intact classroom, make the use of ANOVA justified. In an analysis of the variance model framework, we used student test scores from the state assessment as a covariate to control for possible initial differences that were not controlled by random assignment of test booklets to students. Therefore, for analyzing students’ performance in reading comprehension we used an analysis of covariance (ANCOVA) model. For the analyses of non-cognitive variables such as student mood and motivation, we used a simple ANOVA model.
Results
Results of Part 2 are organized by research question.
Accessibility
Segmented Text and Reliability of the Assessment. 1. Does the original version of the reading test have similar reliability for students
with disabilities and students without disabilities?
2. Does the segmented version of the reading test have similar reliability for students with disabilities and students without disabilities?
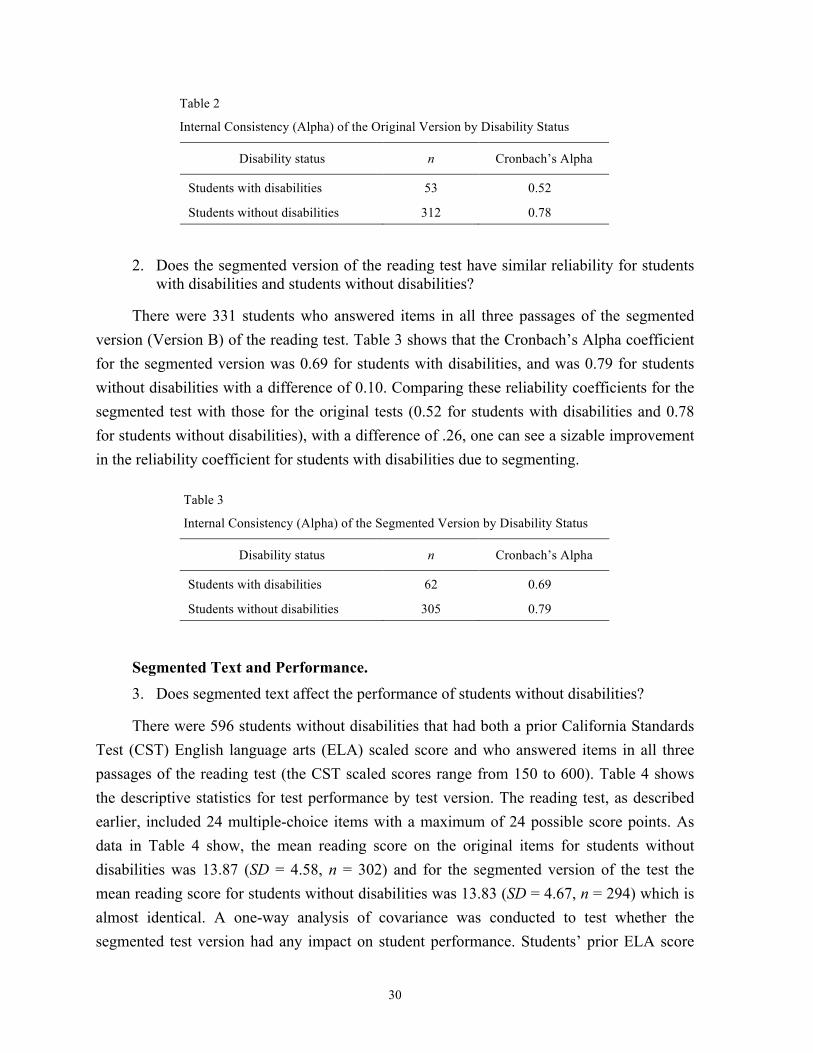
In order to investigate the first two research questions, internal consistency of both versions of the reading test was examined through KR-20/Cronbach’s alpha approach. There were 330 students who answered items in all three passages of the original (Version A) reading test. Table 2 shows that students with disabilities showed low internal consistency on the original version of the test (Alpha = 0.52) when compared to students without disabilities (Alpha = 0.78).
30
Table 2
Internal Consistency (Alpha) of the Original Version by Disability Status
Disability status n Cronbach’s Alpha
Students with disabilities 53 0.52
Students without disabilities 312 0.78
2. Does the segmented version of the reading test have similar reliability for students with disabilities and students without disabilities?
There were 331 students who answered items in all three passages of the segmented version (Version B) of the reading test. Table 3 shows that the Cronbach’s Alpha coefficient for the segmented version was 0.69 for students with disabilities, and was 0.79 for students without disabilities with a difference of 0.10. Comparing these reliability coefficients for the segmented test with those for the original tests (0.52 for students with disabilities and 0.78 for students without disabilities), with a difference of .26, one can see a sizable improvement in the reliability coefficient for students with disabilities due to segmenting.
Table 3
Internal Consistency (Alpha) of the Segmented Version by Disability Status
Disability status n Cronbach’s Alpha
Students with disabilities 62 0.69
Students without disabilities 305 0.79
Segmented Text and Performance. 3. Does segmented text affect the performance of students without disabilities?
There were 596 students without disabilities that had both a prior California Standards Test (CST) English language arts (ELA) scaled score and who answered items in all three passages of the reading test (the CST scaled scores range from 150 to 600). Table 4 shows the descriptive statistics for test performance by test version. The reading test, as described earlier, included 24 multiple-choice items with a maximum of 24 possible score points. As data in Table 4 show, the mean reading score on the original items for students without disabilities was 13.87 (SD = 4.58, n = 302) and for the segmented version of the test the mean reading score for students without disabilities was 13.83 (SD = 4.67, n = 294) which is almost identical. A one-way analysis of covariance was conducted to test whether the segmented test version had any impact on student performance. Students’ prior ELA score

31
was used as a covariate to control for any potential differences between groups of students taking the two test versions.
Table 4
Descriptive Statistics of Test Performance for Students without Disabilities by Test Version
Version Mean SD n
Original 13.87 4.58 302
Segmented 13.83 4.67 294
Total 13.88 4.62 596
Table 5 presents a summary of the analysis of covariance. As data in Table 5 show, there is no statistically significant difference between performance of students without disabilities under the original and segmented assessments after controlling for students’ reading score F(1,593) = 1.51, p = .220. These findings suggest that the segmented version did not alter the reading construct; therefore, segmenting is not a threat to the validity of reading assessments.
Table 5
Analysis of Covariance Results Comparing Performance of Students without Disabilities under the Original and Segmented Versions of the Reading Test
Source df F η2 p
CST Reading (covariate) 1 693.18 . 519 .000
Test version (original v. segmented) 1 1.51 .003 .220
Error 593
Total 595
Note. We present mean and standard deviation to 2 decimal points, and η2 and p-values to 3 decimal points.
4. Does segmented text affect the performance of students with disabilities?
There were 110 students with disabilities who had both a prior ELA scaled score and who answered items in all three passages of the reading test. Table 6 shows the descriptive statistics for test performance by test version.

32
Table 6
Descriptive Statistics of Test Performance for Students with Disabilities by Test Version
Version Mean SD n
Original 9.94 3.32 52
Segmented 9.16 4.20 58
Total 9.52 3.81 110
A one-way analysis of covariance was used to test whether the version of the test had an impact on student performance. Students’ prior ELA scale was used as a covariate to control for any potential differences in performance between groups of students taking the two test versions. As data in Table 6 show, mean reading score for students with disabilities is 9.94 (SD = 3.32, n = 52) and under the segmented version the mean for students with disabilities was 9.16 (SD = 4.20, n = 58).
Table 7 shows the results of analysis of covariance comparing performance of students with disabilities under the two versions of the test. As data in Table 7 shows, there was no statistically significant difference between students with disabilities on the two versions of the test F(1,107) = .36, p = .551. A substantial number of students with disabilities in this study were also categorized as ELL. Therefore analysis was also performed that included ELL as an additional covariate. Again there was no statistically significant difference between students with disabilities on the two versions of the test F(1,107) = 1.26, p = .724. This suggests that the segmented version did not affect the performance of students with disabilities.
Table 7
Analysis of Covariance Results Comparing Performance of Students with Disabilities under the Original and Segmented Versions of the Reading Test
Source df F η2 p
CST reading (covariate) 1 22.71 .175 .000
Test version (original v. segmented) 1 .36 .003 .551
Error 107
Total 109
Note. Covariates appearing in the model are evaluated at the following values: ELA scaled score = 277.54.
It is important to note at this point that the scores from the segmented assessments for students with disabilities show greater variability than the scores for students without

33
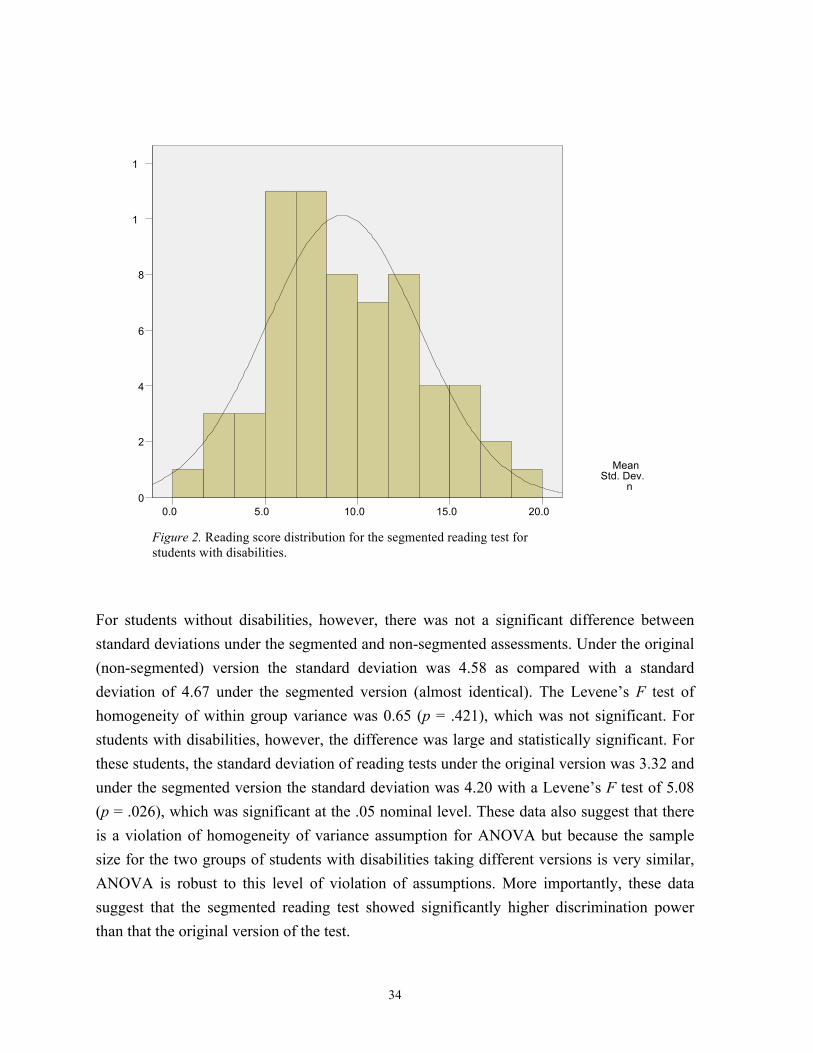
disabilities. Figure 1 shows the distribution of scores from the original version of the test for students with disabilities and Figure 2 presents the score distribution for the segmented version of the test for students with disabilities. These figures show the differential level of score variability in the two outcome scores.
Comparing the two distributions suggest that the segmented version had a wider
distribution than the original version of the reading test for students with disabilities.
Figure 1. Reading score distribution for the original (non-segmented) reading test for students with disabilities.
20.00
15.00
10.00
5.00
6
4
2
0
Mean =9.98 Std. Dev.
=3.30 n =53
34
For students without disabilities, however, there was not a significant difference between standard deviations under the segmented and non-segmented assessments. Under the original (non-segmented) version the standard deviation was 4.58 as compared with a standard deviation of 4.67 under the segmented version (almost identical). The Levene’s F test of homogeneity of within group variance was 0.65 (p = .421), which was not significant. For students with disabilities, however, the difference was large and statistically significant. For these students, the standard deviation of reading tests under the original version was 3.32 and under the segmented version the standard deviation was 4.20 with a Levene’s F test of 5.08 (p = .026), which was significant at the .05 nominal level. These data also suggest that there is a violation of homogeneity of variance assumption for ANOVA but because the sample size for the two groups of students with disabilities taking different versions is very similar, ANOVA is robust to this level of violation of assumptions. More importantly, these data suggest that the segmented reading test showed significantly higher discrimination power than that the original version of the test.
Figure 2. Reading score distribution for the segmented reading test for students with disabilities.
20.00
15.00
10.00
5.00
0.00
12
10
8
6
4
2
0
Mean =9.17 Std. Dev.
=4.14 n =63

35
5. If the performance of both groups improves, is there a greater level of improvement for students with disabilities?
There was no significant effect of segmented text on performance for either group of students (students with or without disabilities). Therefore, no further analyses were performed to address this question.
As indicated earlier in this report, all students were assigned randomly to test versions (original or segmented). This random assignment should control for teacher and schools effects. However, to examine the possibility of any remaining teacher and or school effects, and also the effect of time and day of test administration, we also analyzed students in intact classes using a hierarchical linear model to account for potential classroom differences. In this approach students were nested within classrooms. Student-level reading performance served as the outcome variable. Test version was included as an independent variable at the student level. Prior ELA achievement was a covariate at both the student and classroom levels. Results were similar to the ANOVA outcomes described above, as test version did not have a significant impact. The model coefficient suggested that students taking the segmented version would score 0.32 points higher than students taking the original version but this difference was not large enough to be significant (p = .190).
Segmented Text and the Correlation between Teacher Ratings, English Language Arts (ELA) Achievement Test Level and Reading Performance. 6. Does the original version of the reading test have a similar correlation to teacher
ratings and ELA levels for students with disabilities and students without disabilities?
7. Does the segmented version of the reading test have a similar correlation to teacher ratings and ELA levels for students with disabilities and without disabilities?
Correlations between reading performance on each version of the assessment, teacher ratings of student reading ability, and prior ELA performance levels are displayed in Table 8. In general, there was a stronger correlation between reading performance and both prior ELA level and teacher ratings in the students without disabilities population when compared to students with disabilities. For example the correlation between reading performance on the original assessment and teacher ratings of reading ability was 0.21 for students with disabilities compared to 0.63 for students without disabilities. The difference between these two correlations was significant (p < .01). The correlation between reading performance on the segmented version and teacher ratings of reading performance was 0.26 for students with disabilities compared to 0.57 for students without disabilities. Although the gap between

36
correlations appeared somewhat smaller on the segmented version this difference was also significant (p < .05).
When considering the correlations between the reading assessment and ELA level there were also large differences between students with disabilities and students without disabilities. On both the original and segmented versions the difference between the correlations was significant (p < .01).
Table 8
Correlations of Total Reading Test Score with Teacher Ratings of Reading Ability and English Language Arts Performance Level by Subgroup
Subgroup n Correlation with
teacher rating Correlation with
ELA level
Students with disabilities–original 44 0.21 0.44
Students with disabilities–segmented 49 0.26 0.39
Students without disabilities–original 295 0.63 0.72
Students without disabilities–segmented 290 0.57 0.72
Affective Factors
Segmented Text and Motivation. 8. Do the students with disabilities in this study report lower motivation than students
without disabilities? 9. Do the students who take the segmented version of the test report higher motivation
than students who take the non-segmented version?
A two-factor analysis of variance was conducted to answer research Questions 8 and 9. Student disability status and test version served as the two factors while total motivation score was the outcome measure. Mean motivation scores are displayed in Table 9.

37
Table 9
Descriptive Statistics of Motivation Scale by Subgroup
Subgroup n Mean SD
Students with disabilities-original 53 22.21 3.65
Students with disabilities-segmented 60 22.83 3.44
Students with disabilities-total 113 22.54 3.54
Students without disabilities-original 313 21.36 5.07
Students without disabilities-segmented 296 22.16 4.23
Students without disabilities-total 609 21.75 4.70
Original version total 366 21.48 4.89
Segmented version total 356 22.27 4.12
Overall total 722 21.87 4.54
Table 10
ANOVA Motivation by Students with Disability and Test Version
Source Type III sum
of squares df Mean square F Sig.
Corrected model 168.91 3 56.30 2.75 0.042
Intercept 186,192.28 1 186,192.28 9,086.51 0.000
Students with disabilities 55.31 1 55.31 2.70 0.101
Test version 48.47 1 48.47 2.37 0.124
Students with disabilities * Test version 0.75 1 .75 0.04 0.849
Error 14,692.10 717 20.49
Total 359,745.00 721
Corrected total 14,861.00 720
ANOVA results are shown in Table 10. There was no significant difference in either main effect of the two factors. In answer to research Question 8, students with disabilities did not report significantly lower motivation than students without disabilities F(1, 721) = 2.70, p = .101. Similarly, in answer to research question 9 students who took the segmented test version did not report significantly higher motivation than those students who took the original test version F(1, 721) = 2.37, p = .124. There was also no interaction effect between the two factors on motivation F(1, 721) = 0.04, p = .849.

38
Segmented Text and Emotion/Mood Inventory (EMI). 10. Do students with disabilities in this study report more negative EMI responses than
students without disabilities when taking the reading test?
11. Do the students who take the segmented version of the test report more negative EMI responses than students who take the non-segmented version?
12. Does the number of negative EMI responses increase for students with disabilities as they progress towards the end of the test?
A repeated measures analysis with two between-subjects factors and one within factor was used to answer research Questions 10, 11, and 12. The two between factors in the model were test version and student disability status. The number of negative EMI responses related to each of the three reading passages served as the repeating factor. A descriptive comparison of the mean number of negative EMI responses for each passage across the two factors is presented in Table 11 whereas between subjects effects are presented in Table 12. Within subject effects are shown in Table 13. Results of the repeated measures ANOVA indicate a significant between-subjects effect of disability status F(1, 728) = 7.48 p = .006. This suggests that across both test versions students with disabilities reported fewer negative EMI responses than students without disabilities. Although the reported means of negative EMI responses appeared slightly lower on the first two passages of the segmented version than on the original version the difference was not large enough to result in a significant main effect of version F(1,728) = .071, p = .401. There was also no significant between-subjects interaction between disability status and version.
Tests of within-subjects effect revealed no significant interaction between either disability status or version and the repeating factor. That is to say there was no meaningful change in the number of negative EMI responses across the three passages that could be related to disability status or version.

39
Table 11
Descriptive Statistics for Total Negative Emotion/Mood Inventory Responses by Passage
Negative emotion/mood inventory responses Disability
status Test
version Mean SD N
Passage #1 Yes Original 1.70 1.74 53
Segmented 1.35 1.69 62
Total 1.51 1.71 115
No Original 1.92 1.78 312
Segmented 1.79 1.73 305
Total 1.86 1.75 617
Total Original 1.89 1.77 365
Segmented 1.72 1.73 367
Total 1.80 1.75 732
Passage #2 Yes Original 1.36 1.59 53
Segmented 1.35 1.64 62
Total 1.36 1.61 115
No Original 1.95 1.93 312
Segmented 1.86 1.78 305
Total 1.90 1.85 617
Total Original 1.86 1.89 365
Segmented 1.77 1.76 367
Total 1.82 1.83 732
Passage #3 Yes Original 1.45 1.70 53
Segmented 1.08 1.58 62
Total 1.25 1.64 115
No Original 1.70 1.93 312
Segmented 1.80 1.90 305
Total 1.75 1.91 617
Total Original 1.66 1.90 365
Segmented 1.68 1.87 367
Total 1.67 1.88 732

40
Table 12
Between Subjects Effects for Total Negative Emotion/Mood Inventory Responses
Source Type III sum
of squares df Mean square F Sig.
Intercept 2,997.32 1 2,997.32 378.83 0.000
Students with disabilities 59.17 1 59.17 7.48 0.006
Test version 5.59 1 5.59 0.71 0.401
Students with disabilities * Test version 2.93 1 2.93 0.37 0.543
Error 5,759.90 728 7.91
Note. * = Interaction term between “students with disabilities” and “test version.
Table 13
Within Subjects Effects for Total Negative Emotion/Mood Inventory (EMI) Responses
Source Type III sum
of squares df Mean square F Sig.
Repeated factor (Negative EMI) 6.86 2.00 3.43 3.48 0.031
Students with disabilities by repeated factor (Negative EMI) disabilities by repeated factor (Negative EMI)
2.38 2.00 1.19 1.21 0.299
Test version 1.71 2.00 0.85 0.87 0.420
Students with disabilities by test version disabilities by repeated factor (Negative EMI) 3.78 2.00 1.89 1.92 0.147
Error 1,434.15 1,456.00 0.98 1,434.15
Performance at the End versus Performance at the Beginning. 13. Is there a difference in performance between students with disabilities and students
without disabilities on the last passage after controlling for performance on the first passage?
14. If so, does this difference in performance occur on both the segmented and non-segmented versions?
A two-factor analysis of covariance was employed to answer research Questions 13 and 14. Students’ performance on the first passage served as a covariate to control for student ability. Student disability status was one factor while test version served as the second factor. The main effect of disability status was significant F(1, 731) = 9.29, p = 0.002 indicating that students with disabilities scored below students without disabilities on the last passage while controlling for performance on the first passage. Estimated means as shown in Table 14

41
indicate that students with disabilities scored about half a point lower than students without disabilities on the last passage while controlling for first passage performance. ANOVA results are shown in Table 15.
Table 14
Estimated Means of Last Passage Performance by Disability Status
95% Confidence interval
Disability status Mean SE Lower bound Upper bound
Students with disabilities 3.76 0.16 3.45 4.06
Students without disabilities 4.27 0.07 4.15 4.40
Note. The maximum score for each passage was 8.00. First passage covariate was evaluated at the following value: 4.56.
Table 15
ANOVA Last Passage Performance by Students with Disability and Test Version
Source Type III sum
of squares df Mean square F Sig.
Corrected model 768.02 4.00 192.01 73.63 0.000
Intercept 358.49 1.00 358.49 137.47 0.000
Passage # 1 627.98 1.00 627.98 240.82 0.000
Students with disabilities 24.22 1.00 24.22 9.29 0.002
Test version 0.07 1.00 0.07 0.03 0.868
Students with disabilities * Test version 0.19 1.00 0.19 0.07 0.789
Error 1,895.82 727.00 2.61
Total 15,531.00 732.00
Corrected total 2,663.84 731.00
Note. * = Interaction term between “students with disabilities” and “test version.
The version of the test was not significantly F(1,731) = 0.03, p = 0.868 related to performance on the last passage and there was also no significant interaction F(1, 731) = 0.07, p = 0.789 between test version and disability status. In other words, students with disabilities had more trouble with the last passage than students without disabilities regardless of which version of the test they took.

42
Summary and Discussion
Research on academic achievement of students with disabilities indicates a substantial, perpetual gap in the performance of these students as compared with students without disabilities. Aside from their specific disabilities, many different factors can potentially contribute to such a performance gap, such as lack of opportunity to learn, and issues concerning the validity and accessibility of assessments for students with disabilities. Assessments that are developed and field tested mainly for mainstream students may not be appropriate for students with disabilities. Literature on the assessment of students with disabilities has identified many sources of construct-irrelevant variance that may differentially impact assessment outcomes for these students.
The focus of this study, reading assessments, is important for many reasons. First, in terms of the current accountability system, reading is a major topic in the NCLB Title I assessment. Second and more importantly, reading is the foundation underlying instruction and assessment in all other content areas. Students with difficulty in reading may have problems understanding instructional and assessment materials across all content areas.
For this study, a reading comprehension assessment, which was designed to be potentially more accessible for students with disabilities, was administered to eighth-grade students. The purpose was to explore the possibility of having test breaks “built in” to test booklets, thereby maximizing students’ working memory capacity, and also reducing the potential for disengagement during a long test. Students were randomly assigned either to original format booklets or “segmented” versions. In the segmented version (Version B), three long reading comprehension passages were segmented into smaller sections based on natural paragraph breaks, and their corresponding questions were placed immediately after each segment. If students with disabilities have more difficulty maintaining focus or engaging in assessment activities, they should perform better when a passage is broken down into more manageable “segments.”
The questions addressed in the segmenting study included: (1) validity of segmenting, whether segmenting alters the construct being measured; (2) effectiveness of segmenting, whether segmenting helps to improve the performance of students with disabilities; (3) improving the quality of assessment, whether segmenting increases reliability of assessment; and (4) whether motivation or other non-cognitive factors have a relationship with students’ performance.
In summary, results of the study indicated that: (1) segmenting did not affect the reading performance of students without disabilities; suggesting that it is not a threat to the
43
validity of reading assessment; (2) segmenting did not affect the reading performance of students with disabilities; (3) the segmented version had a higher reliability for students with disabilities without affecting the reliability for students without disabilities; and (4) segmenting did not produce any significant trend on student motivation, general emotions and moods.
Results indicated students with disabilities showed low internal consistency on the original version of the test when compared to students without disabilities. However, on the segmented version of the test, the gap in reliability coefficients was not as large. It appears that the difference in reliability for students with disabilities was partly due to item location (i.e., where an item appears in a sequence of items), with the first two items and the last five items having low (and even negative) item to total correlations in the original version. This was not seen in the segmented version. The increase in the reliability may suggest that the segmented version may be more accessible to students with disabilities. However, if it is more accessible, and has “better” reliability, why did we not see an improved performance in the test? It may be that overall, the test was still very difficult for students with disabilities, who scored, on average, roughly 40% correct on the test. This is also supported by the low correlations between our reading test and students’ prior English language arts score (on the state standardized test).
However, a major finding of this study is that the segmented version of the reading test increased the discrimination power of reading for students with disabilities. As indicated earlier, the segmented version showed a significantly larger variance suggesting that students with disabilities had a better opportunity to present what they know and can do, particularly at the higher section of performance distribution. Due to small sample size and due to the lack of representation of all categories of students with disabilities such discrimination power did not translate to performance differences between the original and the segmented version. Although our intention was to investigate factors that affect accessibility of students with disabilities, because our sample was mostly students with learning disabilities (91%), we caution that our results may not be representative of the total population of students with disabilities.
The results of analyses of data from this study also revealed that a majority of students with disabilities were English language learners. Over 68% of the students with disabilities who participated in this study were English language learners whereas only 22.5% of students without disabilities were ELLs. This confirms the concerns that many educators have on misclassification of ELL students as students with disabilities (Abedi, 2006; Artiles, et al., 2005). Researchers focusing on the validity of a classification system for ELL students
44
argue that ELL students at the lower level of English language proficiency have a much higher chance of being misclassified as students with learning disabilities (Artiles et al., 2005). There can be many reasons for misclassification which may entail greater policy issues related to funding and accountability reporting, discussion of which is beyond the scope of this report. It is still noteworthy because the results of our study may have been quite different had the percentage of ELL students been more proportionally represented across the two groups.
This trend of higher numbers of ELL students in the disability group in this study has a major consequence on the interpretation of the results of this study. Inability to detect significant improvement with segmenting the reading assessment may be due to the fact that students had considerable problems with the reading test due to complex linguistic structures and difficult vocabulary. Therefore, segmenting or any other formatting improvements may not be powerful enough to make a difference, with the sample of students included in this study.
Limitations of the Study
Despite the somewhat “better” reliability, students with disabilities did not have higher scores on the segmented version of the assessment. However, there were limitations to this study, one of the most significant being the composition of our sample. First, as noted above, ELL students in our sample were disproportionately represented in the students with disabilities group, suggesting a possibility of a high rate of misclassification. The results of our study suggest that segmenting was not powerful enough to help students overcome challenges with vocabulary and language-related issues. However, segmenting the text was intended to aid students with disabilities, not ELL students, so that the results of our study perhaps may not provide enough information on the effects of segmenting for students with disabilities. Moreover, our disability sample was mostly students with learning disabilities, thus our results may not be representative of the total population of students with disabilities, and it is unclear that within these unspecified learning disabilities, whether segmented text would have impacted students with specific types of disabilities more than others.
There were other limitations to the study. Students were aware that this was a low-stakes test which did not affect their grades or permanent records. Casual observation (noted in the Summary of Post-Visit Notes in Appendix E) revealed many students simply “bubbling in” quickly throughout the test. Also, there were limitations to the test booklets. The format of Version B (segmented version) caused many students to overlook and skip specific pages, and therefore miss several questions. This was also due in part to students’

45
lack of familiarity with the style and concept of segmented text. Furthermore, our reading comprehension tests are not generalizable to reading tests. State reading assessments vary from state to state based on standards, but typically involve items beyond just reading comprehension passages, and sometimes consist of a blend of multiple-choice and constructed-response items. Due to study limitations, we were not able to administer constructed-response items and explore their potential effects. Additionally, the booklets were not of a traditional reading test format, because there were breaks asking students to provide feedback, disrupting the flow of test taking.
There were also limitations to the non-cognitive aspects of our study. We did not have adequate time to provide both a pre- and post-test motivation scale. Perhaps a pre-test motivation scale would reveal low motivation prior to the test, and no difference in a post-test scale. Additionally, our Emotion/Mood Inventory was meant to be a preliminary exploration of emotions and moods, and is therefore not validated in the field.
Because this study had a large population of students with learning disabilities, future research might consider focusing on students with specific and varied disabilities. In addition, the relationship between students’ motivation and non-cognitive factors is worth further exploration with other test format features, as these issues are inevitably intertwined. More specifically, issues related to motivation and engagement deserve further exploration.
This study contributed to the understanding of factors affecting accessibility of reading assessments for students with disabilities in two very important ways: First, it provided a methodological paradigm to the study of accessibility of a reading comprehension assessment for students with disabilities. Secondly, it empirically examined a specific factor affecting accessibility of assessments for these students. Given that literature on the factors affecting accessibility of assessments for students with disabilities is scarce, it is imperative to design and implement studies that shed light upon accessibility issues. This process will facilitate designing test items in addition to providing valid and reliable assessments for these students who will potentially be left behind if effective remedies are not offered.


47
References Abedi, J. (2006). Psychometric issues in ELL assessment and special education eligibility.
Teachers College Record, 108(11), 2282–2303.
Abedi, J., Leon, S., & Kao, J. C. (2007a). Examining differential distractor functioning in reading assessments for students with disabilities. Minneapolis, MN: University of Minnesota, Partnership for Accessible Reading Assessment.
Abedi, J., Leon, S., & Kao, J. C. (2007b). Examining differential item functioning in reading assessments for students with disabilities. Minneapolis, MN: University of Minnesota, Partnership for Accessible Reading Assessment.
Abedi, J., Leon, S., & Mirocha, J. (2003). Impact of student language background on content-based performance: Analyses of extant data (CRESST Tech. Rep. No. 603). Los Angeles: University of California, National Center for Research on Evaluation, Standards, and Student Testing (CRESST).
Adams, M. J. (1990). Beginning to read: Thinking and learning about print. Cambridge, MA: MIT Press.
Al Safi, A. T. (2003). The differences in self-learning disposition, test anxiety, and level of ambition between high and low achiever students in first grade of high school. Journal of the Social Sciences, 30(1), 69–96.
Allen, M. J., & Yen, W. M. (1979). Introduction to measurement theory. Monterey, CA: Brooks/Cole.
Artiles, A. J., Rueda, R., Salazar, J., & Higareda, I. (2005). Within-group diversity in minority disproportionate representation: English Language Learners in urban school districts. Exceptional Children, 71(3), 283–300.
Baker, L., & Wigfield, A. (1999). Dimensions of children’s motivations for reading and their relations to reading activity and reading achievement. Reading Research Quarterly, 34(4), 452–477.
Baldwin, R. S., Peleg-Bruckner, Z., & McClintock, A. H. (1985). Effects of topic interest and prior knowledge on reading comprehension. Reading Research Quarterly, 20(4), 497–504.
Barrera, M., Liu, K., Thurlow, M., & Chamberlain, S. (2006). Use of chunking and questioning aloud to improve the reading comprehension of English language learners with disabilities (ELLs with Disabilities Report No. 17). Minneapolis, MN: University of Minnesota, National Center on Educational Outcomes.
Bloomquist, M. L. (1996). Skills training for children with behavior disorders: A parent and therapist guidebook. New York: The Guilford Press.
Bolt, S. E., & Thurlow, M. L. (2004). Five of the most commonly allowed accommodations in state policy: Synthesis of research. Remedial and Special Education, 25(3), 141–152.
Brown, P. M., & Brewer, L. C. (1996). Cognitive processes of deaf and hearing skilled and less skilled readers. Journal of Deaf Studies and Deaf Education, 1(4), 263–270.
48
Buly, M., & Valencia, S. (2002). Below the bar: Profiles of students who fail state reading assessments. Educational Evaluation and Policy Analysis, 24(3), 219–239.
Calhoon, M. B., Fuchs, L. S., & Hamlett, C. L. (2000). Effects of computer-based test accommodations on mathematics performance assessments for secondary students with learning disabilities. Learning Disability Quarterly, 23(4), 271–282.
Carr, S. C., & Thompson, B. (1996). The effects of prior knowledge and schema activation strategies on the inferential reading comprehension of children with and without learning disabilities. Learning Disability Quarterly, 19(1), 48–61.
Carreiras, M., & Alvarez, C. J. (1999). Comprehension processes in Braille reading. Journal of Visual Impairment and Blindness, 93(9), 589–595.
Casteel, C. A. (1988–89). Effects of chunked reading among learning disabled students: An experimental comparison of computer and traditional chunked passages. Journal of Educational Technology Systems, 17(2), 115–121.
Casteel, C. A. (1990). Effects of chunked text-material on reading comprehension of high and low ability readers. Reading Improvement, 27(4), 269–275.
Catts, H. W., & Kamhi, A. (Eds.). (2005). Language and reading disabilities (2nd ed.). Boston: Pearson Education.
Catts, H. W., Fey, M. E., Zhang, X., & Tomblin, J. B. (1999). Language basis of reading and reading disabilities. Journal of Speech and Hearing Research, 36, 948–958.
Chall, J. S. (1967). Learning to read: The great debate: An inquiry into the science, art, and ideology of old and new methods of teaching children to read, 1910–1965. New York: City College, Carnegie Corporation of New York.
Chamberlain, C. (2002). Reading skills of deaf adults who sign: Good and poor readers compared. Unpublished doctoral dissertation, McGill University, Montreal, Canada.
Clay, M. M. (1993). An observation survey of early literacy achievement. Portsmouth, NH: Heinemann.
Cox, K. E., & Guthrie, J. T. (2001). Motivational and cognitive contributions to students’ amount of reading. Contemporary Educational Psychology, 26(1), 116–131.
Curtis, M. E., & Glaser, R. (1983). Reading theory and the assessment of reading achievement. Journal of Educational Measurement, 20(2), 133–147.
de Sousa, I., & Oakhill, J. (1996). Do levels of interest have an effect on children’s comprehension monitoring performance? British Journal of Educational Psychology, 66, 471–482.
DiCerbo, K., Stanley, E., Roberts, M., & Blanchard, J. (2001, April). Attention and standardized reading test performance: Implications for accommodation. Paper presented at the annual meeting of the National Association of School Psychologists, Washington, DC.
49
Doxey, I. (1996, September). Three approaches for developing training materials and curriculum policies. Paper presented at the annual conference of the European Early Childhood Education Research Association, Lisbon, Portugal. (ERIC Document Reproduction Service No. ED400961)
Durrant, J. E. (1993). Attributions for achievement outcomes among behavioral subgroups of children with learning disabilities. The Journal of Special Education, 27(3), 306–320.
Elliot, A. J., & McGregor, H. A. (1999). Test anxiety and the hierarchical model of approach and avoidance achievement motivation. Journal of Personality and Social Psychology, 76(4), 628–644.
Elliott, J., Thurlow, M., Ysseldyke, J., & Erickson, R. (1997). Providing assessment accommodations for students with disabilities in state and district assessments (Policy Directions No. 7). Minneapolis, MN: University of Minnesota, National Center on Educational Outcomes. Retrieved April 13, 2007, from http://cehd.umn.edu/nceo/OnlinePubs/Policy7.html
Fuchs, L. S., Fuchs, D., Eaton, S. B., Hamlett, C., & Karns, K. (2000). Supplementing teacher judgments about test accommodations with objective data sources. School Psychology Review, 29(1), 65–85.
Fulk, B. M., Brigham, F. J., & Lohman, D. A. (1998). Motivation and self-regulation: A comparison of students with learning and behavior problems. Remedial and Special Education, 19(5), 300–309.
Garrison, W., Long, G., & Dowaliby, F. (1997). Working memory capacity and comprehension processes in deaf readers. Journal of Deaf Studies and Deaf Education, 2(2), 78–94.
Gartland, D., & Strosnider, D. (2004). State and district-wide assessments and students with learning disabilities: A guide for states and school districts. Learning Disabilities Quarterly, 27(2), 67–76.
Gay, L. R. (1981). Educational research: Competencies for analysis and application (2nd ed.). Columbus, OH: Charles E. Merrill.
Gersten, R., Fuchs, L., Williams, J., & Baker, S. (2001). Teaching reading comprehension to students with learning disabilities: A review of research. Review of Educational Research, 71(2), 279–320.
Goldin-Meadow, S. & Mayberry, R. I. (2001). How do profoundly deaf children learn to read? Learning Disabilities Research & Practice, 16, 222–229.
Gough, P. B., Hoover, W. A., & Peterson, C. L. (1996). Reading comprehension difficulties: Processes and intervention. Mahwah, NJ: Lawrence Erlbaum Associates.
Guthrie, J. T., & Wigfield, A. (1999). How motivation fits into a science of reading. Scientific Studies of Reading, 3, 199–205.
Guthrie, J. T., & Wigfield, A. (2005). Roles of motivation and engagement in reading comprehension assessment. In S. G. Paris & S. A. Stahl (Eds.), Children’s reading comprehension and assessment (pp. 187–213). Mahwah, NJ: Lawrence Erlbaum Associates.
50
Haladyna, T. M., & Downing, S. M. (2004). Construct-irrelevant variance in high-stakes testing. Educational Measurement: Issues and Practice, 23(1), 17–27.
Hartley, J. (1992, August). Does what goes in determine what comes out? Recalling structured text. Paper presented at the Annual Meeting of the American Psychological Association, Washington, DC.
Individual with Disabilities Education Act of 1997, Pub. L. No. 105-17, 111 Stat. 37 (1997).
Individuals with Disabilities Education Act (IDEA), as amended in 2004, PL 108-446, 20 USC 1400 et seq.
Keenan, S. A. (1984). Effects of chunking and line length on reading efficiency. Visible Language, 18(1), 61–80.
Kelly, L. P. (2003). Considerations for designing practice for deaf readers. Journal of Deaf Studies and Deaf Education, 8(2), 171–186.
Kibby, M. M. (1979). Passage readability affects the oral reading strategies of disabled readers. The Reading Teacher, 32(4), 390–396.
Kintsch, W., & Kintsch, E. (2005). Comprehension. In S. G. Paris & S. A. Stahl (Eds.), Children’s reading comprehension and assessment (pp. 71–104). Mahwah, NJ: Lawrence Erlbaum Associates.
Klein, J. A., Wiley, H. I., & Thurlow, M. L. (2006). Uneven transparency: NCLB tests take precedence in public assessment reporting for students with disabilities (Technical Report No. 43). Minneapolis, MN: University of Minnesota, National Center on Educational Outcomes.
Knowlton, M., & Wetzel, R. (1996). Braille reading rates as a function of reading tasks. Journal of Visual Impairment and Blindness, 90(3), 227–236.
Koretz, D. (1997). The assessment of students with disabilities in Kentucky (CRESST Tech. Rep. No. 431). Los Angeles: University of California, National Center for Research on Evaluation, Standards, and Student Testing (CRESST).
Lazarus, S. S., Thurlow, M. L., Lail, K. E., & Christensen, L. (in press). Evolution of state accommodation policies: 12 years of change, 1993–2005. The Journal of Special Education.
Lazarus, S. S., Thurlow, M. L., Lail, K. E., Eisenbraun, K. D., & Kato, K. (2006). 2005 state policies on assessment participation and accommodations for students with disabilities (Synthesis Report 64). Minneapolis, MN: University of Minnesota, National Center on Educational Outcomes. Retrieved September 6, 2007, from http://cehd.umn.edu/nceo/OnlinePubs/Synthesis64/Synthesis64.pdf
Lewis, D., Green, D. R., & Miller, L. (1999, June). Using differential item functioning analyses to assess the validity of testing accommodated students with disabilities. Paper presented at the National Conference on Large-Scale Assessment, Snowbird, UT.
Miller, P. (2005). Reading comprehension and its relation to the quality of functional hearing: Evidence from readers with different functional hearing abilities. American Annals of the Deaf, 150(3), 305–485.

51
Morgan, D. L. (1997). Focus groups as qualitative research. Thousand Oaks, CA: Sage Publications.
National Accessible Reading Assessment Projects. (2006). Defining reading proficiency for accessible large-scale assessments: Some guiding principles and issues. Minneapolis, MN: Author.
National Joint Committee on Learning Disabilities (1998). Operationalizing the NJCLD definition of learning disabilities for ongoing assessment in schools. Asha, 40 (Suppl. 18), in press. Retrieved August 2005, from http://www.ldonline.org/njcld/operationalizing.pdf
No Child Left Behind Act of 2001, Pub. L. No. 107-110, 115 Stat. 1425 (2002).
Oakhill, J., & Cain, K. (2000). Children’s difficulties in text comprehension: Assessing causal issues. Journal of Deaf Studies and Deaf Education, 5(1), 51–59.
Paris, S. G., Lawton, T. A., Turner, J. C., & Roth, J. L. (1991). A developmental perspective on standardized achievement testing. Educational Researcher, 20(5), 12–20.
Partnership for Accessible Reading Assessment (2006a). Reading and students with autism. Retrieved July 17, 2008, from The Partnership for Accessible Reading Assessment (PARA) web site: http://www.readingassessment.info/resources/publications/readingandautism.htm
Partnership for Accessible Reading Assessment (2006b). Reading and students with emotional or behavioral disabilities. Retrieved July 17, 2008, from The Partnership for Accessible Reading Assessment (PARA) web site: http://www.readingassessment.info/resources/publications/readingandemotbehav.htm
Partnership for Accessible Reading Assessment (2006c). Reading and students with mental retardation. Retrieved July 17, 2008, from The Partnership for Accessible Reading Assessment (PARA) web site: http://www.readingassessment.info/resources/publications/mentalretardation.htm
Partnership for Accessible Reading Assessment (2006d). Reading and students with specific learning disabilities. Retrieved July 17, 2008, from The Partnership for Accessible Reading Assessment (PARA) web site: http://www.readingassessment.info/resources/publications/readingandld.htm
Partnership for Accessible Reading Assessment (2006e). Reading and students with speech or language impairments. Retrieved July 17, 2008, from The Partnership for Accessible Reading Assessment (PARA) web site: http://www.readingassessment.info/resources/publications/readingandspeech.htm
Partnership for Accessible Reading Assessment (2006f). Reading and students with visual impairments or blindness. Retrieved July 17, 2008, from The Partnership for Accessible Reading Assessment (PARA) web site: http://www.readingassessment.info/resources/publications/visualimpairment.htm

52
Partnership for Accessible Reading Assessment (2007). Reading and students who are deaf or hard of hearing. Retrieved July 17, 2008, from The Partnership for Accessible Reading Assessment (PARA) web site: http://www.readingassessment.info/resources/publications/deafOrhardofhearning.html
Penfield, R. D., & Lam, T. C. M. (2000). Assessing differential item functioning in performance assessment. Educational Measurement: Issues and Practice, 19(3), 5–15.
Perie, M., Grigg, W., & Donahue, P. (2005). The Nation’s Report Card: Reading 2005 (NCES 2006-451). U.S. Department of Education, National Center for Education Statistics. Washington, DC: U.S. Government Printing Office.
Rasinski, T. V. (1990). The effects of cued phrase boundaries on reading performance: A review. Kent, OH: Kent State University, Department of Teacher Development and Curriculum Studies.
Ryan, R. M., & Deci, E. L. (2000). Intrinsic and extrinsic motivations: Classic definitions and new directions. Contemporary Educational Psychology, 25(1), 54–67.
Saarnio, D. A., Oka, E. R., & Paris, S. G. (1990). Developmental predictors of children’s reading comprehension. In T. H. Carr & B. A. Levy (Eds.), Reading and its development: Components skills approaches (pp. 57–79). San Diego, CA: Academic Press.
Scarborough, H. (2003). Connecting early language and literacy to later reading (dis)abilities: Evidence, theory and practice. In S. B. Neuman & D. K. Dickinson (Eds.), Handbook of early literacy research (pp. 97–110). New York: Guilford Press.
Schiefele, U. (1999). Interest and learning from text. Scientific Studies of Reading, 3, 257–279.
Schunk, D., & Zimmerman, B. (1997). Developing self-efficacious readers and writers: The role of social and self-regulatory processes. In J. Guthrie & A. Wigfield (Eds.), Reading engagement: Motivating readers through integrated instruction (pp. 34–51). Newark, DE: International Reading Association.
Shaywitz, S. E. (1998). Current concepts: Dyslexia. New England Journal of Medicine, 338(5), 307–312.
Shaywitz, S. E., Shaywitz, B. A., Fulbright, R. K., Skudlarski, P., Mencl, W. E., Constable, R. T., et al. (2003). Neural systems for compensation and persistence: Young adult outcome of childhood reading disability. Biological Psychiatry, 54(1), 25–33.
Siegel, L. S. (1993). Phonological processing deficits as the basis of a reading disability. Developmental Review, 13(3), 246–257.
Smith, F. (1994). Understanding reading: A psycholinguistic analysis of reading and learning to read (5th ed.). Hillsdale, NJ: Erlbaum.
Snow, C. E., Burns, M. S., & Griffin, P. (1998). Preventing reading difficulties in young children. Washington, DC: National Academy Press.
Snowling, M. J., Goulandris, N., & Defty, N. (1996). A longitudinal study of reading development in dyslexic children. Journal of Educational Psychology, 88(4), 653–669.

53
Stahl, S. A., & Murray, B. A. (1998). Issues involved in defining phonological awareness. Journal of Educational Psychology, 86, 221–234.
Stanovich, K. E. (1994). Romance and reality. The Reading Teacher, 47, 280–291. Stevens, K. C. (1981). Chunking material as an aid to reading comprehension. Journal of
Reading, 25(2), 126–129. Stewart, D. W., Shamdasani, P. N., Rook, D. W. (2007). Focus groups: Theory and practice
(2nd ed.). Thousand Oaks, CA: Sage Publications. Sundre, D. L. (2000). Motivation scale background and scoring guide. Harrisonburg, VA:
James Madison University, Center for Assessment and Research Studies. Retrieved June 22, 2006, from http://www.jmu.edu/assessment/resources/resource_files/sos_scoring_guide.pdf
Swanson, H. L. (1993). Individual differences in working memory: A model testing and subgroup analysis of learning-disabled and skilled readers. Intelligence, 17(3), 285–332.
Thompson, S. J., Johnstone, C., & Thurlow, M. L. (2002). Universal design applied to large scale assessments (Synthesis Report No. 44). Minneapolis, MN: University of Minnesota, National Center on Educational Outcomes.
Thurlow, M., & Bolt, S. (2001). Empirical support for accommodations most often allowed in state policy (Synthesis Report No. 41). Minneapolis, MN: University of Minnesota, National Center on Educational Outcomes.
Thurlow, M. L., Elliott, J. L., & Ysseldyke, J. E. (1998). Testing students with disabilities: Practical strategies for complying with district and state requirements. Thousand Oaks, CA: Corwin Press.
Thurlow, M. L., House, A., Boys, C., Scott, D., & Ysseldyke, J. E. (2000). State participation and accommodation policies for students with disabilities: 1999 update (Synthesis Report No. 33). Minneapolis, MN: University of Minnesota, National Center on Educational Outcomes.
Thurlow, M. L., Lazarus, S. S., Thompson, S. J., & Blount-Morse, A. (2005). State policies on assessment participation and accommodations for students with disabilities. Journal of Special Education, 38(4), 232–240.
Thurlow, M. L., Moen, R., & Altman, J. (2006). Annual performance reports: 2003–2004 state assessment data. Minneapolis, MN: University of Minnesota, National Center on Educational Outcomes. Retrieved September 6, 2007, from http://cehd.umn.edu/nceo/OnlinePubs/APR2003-04.pdf
U.S. Department of Education (2006). Individuals with Disabilities Education Act (IDEA) database. Alexandria, VA: Author, Office of Special Education and Rehabilitative Services.
Vaughn, S., Linan-Thompson, S., & Hickman, P. (2003). Response to instruction as a means of identifying students with reading/learning disabilities. Exceptional Children, 69(2), 391–409.

54
Wade, B., & Moore, M. (1993). The test’s the thing: Viewpoints of students with special educational needs. Educational Studies, 19(2), 181–191.
Walz, L., Albus, D., Thompson, S., & Thurlow, M. (2000). Effects of a multiple day test administration on the performance of special education students (Minnesota Report No. 34). Minneapolis, MN: University of Minnesota, National Center on Educational Outcomes.
Wang, J. H. Y. & Guthrie, J. T. (2004). Modeling the effects of intrinsic motivation, extrinsic motivation, amount of reading, and past reading achievement on text comprehension between U.S. and Chinese students. Reading Research Quarterly, 39(2), 162–186.
Ysseldyke, J. E., Thurlow, M. L., Langenfeld, K. L., Nelson, J. R., Teelucksingh, E., & Seyfarth, A. (1998). Educational results for students with disabilities: What do the data tell us? (Technical Report No. 23). Minneapolis, MN: University of Minnesota, National Center on Educational Outcomes.

55
APPENDIX A: Focus Group Sessions
Rationale
Focus groups were conducted with educators and experts in the field of education. The methods and results for this component of the study are presented below. The findings from the focus groups informed the segmenting aspect of the overall study by providing valuable information about the issues that arise for students and teachers when standardized reading comprehension assessments are administered in a classroom setting. Issues of motivation, fatigue and accommodations were highlighted. All of these factors appear to have an influence on student performance outcomes. In addition, the participants provided information that has not been widely discussed in the research literature.
Method
Participants
A total of 28 people participated in 5 separate focus groups. The 19 participants from the first two focus groups consisted of graduate students in education, which included many former school teachers. Five of the nine focus group participants from the final three focus groups had been classroom teachers prior to becoming specialists. All focus group participants with educators were, at the time of the sessions, working in Northern California. The participants were chosen because of their backgrounds in reading instruction, working with students with learning disabilities and knowledge of current standardized assessment procedures.
Instruments
A protocol of discussion points and questions was developed to guide the focus group process. The key issues included motivation, frustration, fatigue, accommodations, and formatting of tests. The focus group protocol was field tested in a graduate class in survey methodology with 12 students. Estimates of reliability and content coverage were obtained (see Appendix B for the focus group protocol).
Procedure
The three focus group sessions with educators were held in the summer and fall of 2006. The recruitment was done via local schools. Participants were asked if they would like to take part in an open discussion of the issues of accessibility for students with disabilities who participate in standardized assessments. The first group involved two school psychologists and a reading specialist. The second group involved two consultants from the
56
assessment division of the California Department of Education. The third group was comprised of two reading specialists, a cognitive psychologist, and a school psychologist. For the purposes of this study, all participants were considered consultants and were provided with an honorarium for their time. Three members of our research team facilitated the focus group discussions using the protocol described above. Participants were also encouraged to discuss their own experiences with reading comprehension assessments and to contribute any additional experiences or specific challenges they felt were important.
Results
The results are divided into the following broad categories: motivation, fatigue, and accommodations.
Motivation
Motivation was described as a key factor by most of the focus group participants. Given the fact that students with learning disabilities may have many factors contributing to a decrease in their levels of performance on assessments, the issue of incentives was raised. It was noted that students with learning disabilities may be struggling to maintain their motivation in academic activities in general. Positive encouragement and other incentives were considered especially important for this subgroup of students. In order for students with learning disabilities to give their full effort in assessment settings, the participants noted the importance of motivation. Many of the participants observed how issues of motivation were connected to low self-esteem, stress and depression.
Specifically the participants noted that these students may feel like they are continually failing in school and in assessment situations. As one participant stated, “Some kids just give up. They get test stress and it’s easier to fail than to go forward.” A reading specialist said that her students will admit to her, but not their parents, that they “bubble-in” the answers on standardized tests. “They look at the test and just want to put something down.”
The participants described the long trajectory of failure that many students have been on since entering school. This has impacted students’ levels of motivation. As an example, one participant mentioned that students may be impacted by struggling in school for several years. “Their self-esteem is so low because they may have failed since kindergarten.” When these students experience failure year after year, they may simply give up hope. This is especially apparent in the context of standardized tests because many students do not feel motivated to do their best. These feelings are compounded by the fact that the material does not match their ability levels.

57
Fatigue
One of the factors that many of the focus group participants mentioned was fatigue. Fatigue is considered a critical factor in testing students with disabilities. This factor was highlighted, especially when considering reading comprehension assessments. When asked to rank a list of format issues that might impact accessibility in testing environments for students with learning disabilities, all of the participants placed fatigue in their top three rankings as “most likely” to interfere. Several participants mentioned that reading long passages which may also be extremely difficult for some students can create a cascade of effects. For example, fatigue may lead to a decrease in motivation, and increased levels of anxiety and frustration.
These effects may also lead students to simply “bubble-in” answers to complete the test as quickly as possible. One participant noted during a standardized testing situation, a student told her, “I got worn out about half way through and then bubbled in the rest.” Other focus group participants had also experienced students who decided to randomly fill-in the answers, instead of struggling to complete the test.
Accommodations
Accommodations in testing were mentioned as another challenge for students with learning disabilities. Some of the key concerns regarding accommodations include access, knowledge of IEPs, and limited accommodation types.
Access to accommodations. The participants noted that there are issues of access to appropriate accommodations for individual students. Accommodations may be implemented randomly and inappropriately—depending on the school and classroom context. Particular schools or classrooms may not be able to provide the most appropriate accommodations to given students. For example, some students with learning disabilities might benefit most from computer assisted formats or specific technology. However, these accommodations are not widely available in most schools.
Knowledge of IEPs. Another element of accommodations is the teachers’ knowledge of their students’ Individualized Education Plans (IEPs). This was not considered to be a factor in elementary school settings. However, when students reach middle school and beyond, it becomes increasingly difficult for teachers to track all of their students’ IEPs and the types of accommodations that may be required. One participant noted that in middle school and high school, the student may need to advocate for themselves. Other participants responded that it is unlikely that students in these age groups would be interested in drawing attention to their learning disabilities by requesting particular accommodations.

58
Types of accommodations. Another issue regarding accommodations that was raised is the limited number and type of accommodations that are state approved. Most schools follow the state approved list of accommodations. If a school or teacher wants to request an accommodation for a student that is not approved, they would be required to participate in a lengthy process of hearings through the state board of education. For example, students with learning disabilities that are less prevalent may require accommodations that are more individualized to their needs. This would be very difficult to implement given the current state guidelines.
Discussion
The numbers of students with learning disabilities participating in standardized reading assessments may continue to rise in the context of the No Child Left Behind Act (NCLB, 2002). A complete and thorough picture of how these students are interacting with these assessments is necessary. The unique factors that impact their performance provide valuable information that may influence future test design and administration of standardized assessments, as well as the implementation of accommodations. We are optimistic that the design and administration of standardized assessments in the future will take into account some of the factors outlined in this study that appear to have a profound influence on the performance of students with learning disabilities.
One of the most consistent comments of the participants was that students with learning disabilities often disengage from testing and simply “bubble-in” their answers. This is an area that has not been examined in research thoroughly and is certainly a factor that impacts the performance of students with learning disabilities on assessments. The validity of standardized assessments is undermined when students are randomly “bubbling-in” the answers; however there is no mechanism in place to account for this phenomenon. It would be helpful for teachers and test administrators to make a note on test materials of students who seem to be merely “bubbling-in” answers. This is potentially valuable information when analyzing the results of the assessment.
Levels of motivation seem to play a role in test performance. This factor needs to be more thoroughly examined in relation to students with learning disabilities. The focus group participants noted that levels of motivation among this subgroup of students are often particularly low. The research confirms this observation (Paris et al., 1991; Wade & Moore, 1993) and suggests that incentives and positive encouragement are especially important for students struggling to engage in assessments. Most classroom teachers are aware that students require encouragement to perform optimally on standardized assessments, however

59
the levels of encouragement and support provided to students vary widely from classroom to classroom. This is a factor that is extremely difficult to control.
Similarly the types of accommodations provided to students vary across test situations. Current research in this area is inconsistent regarding the effectiveness of accommodations on increasing accessibility for students. Future research needs to be directed at expanding our understanding of which accommodations are most effective in specific assessment settings and with students with specific learning disabilities. The most commonly implemented accommodations are often not the most effective tool for increasing accessibility to assessments (Elliott et al., 1997).
The educators who participated in this study acknowledged that implementation of accommodations is often more difficult in middle and high schools. This suggests that more thorough guidelines need to be in place to ensure that teachers are given the information they require to provide students with the most appropriate accommodations. In addition, teachers need thorough information on each of their students so that students are not expected to self-advocate for accommodations.
Limitations of the study
The study was limited by sampling a small number of educators from Northern California. Our understanding of factors affecting accessibility for students with learning disabilities on assessments would be greatly enhanced by conducting additional focus groups with a wider sample of educators working in different communities. In addition, the emerging themes we found would be enriched by conducting focus groups with both parents and students. In particular, hearing student perspectives on their experiences with standardized reading assessments would be an invaluable resource.
This study was also restricted by a lack of previous research on the factors that impact accessibility for students with learning disabilities on standardized assessments. Perhaps this is a result of the recent changes in Federal Law (NCLB, 2002) that now require all students to participate in standardized assessments.

60
Focus Group Summaries:
Session 1 Facilitator: Jamal Abedi Participants: Graduate Students at UC Davis School of Education Date: February 13, 2006 Background of Participants Twelve UC Davis graduate students participated in this focus group, a majority of who were teachers and had experience with students with disabilities. The Importance of Including Students with Disabilities in Assessments The participants cited several reasons as to why it is important to include students with disabilities in state and national assessments. Students talked about testing as a right and addressed the idea that all students should be held to high standards. Focus group participants also pointed out the importance of testing students with disabilities for accountability purposes. Use of the Same Assessments with Students with Disabilities and Mainstream Students Some participants felt that the same assessment should be used for students with disabilities, indicating these participants felt that a move toward universal design in assessment is necessary. Others felt that differences in testing should be utilized in order to accommodate the needs of students with special needs. Factors that Affect Test Accessibility for Students with Disabilities The participants state two factors, diversity in disabilities and introduction of bias through accommodation, as having a major impact on test accessibility for students with disabilities. Disabilities are diverse, so different factors may affect students with disabilities. It is difficult to make one test that will work for everyone. In addition, there is bias, certain accommodations may not be fair. For example a teacher or aide may just give answers to students if the accommodation is to have a person present during the test. How to Create a Test that is Accessible to Students with Various Disabilities Participants cited several ideas for creating an accessible exam for students with disabilities. Although some of the suggestions would pertain to only specific groups of students with disabilities (i.e., using larger font on an exam for students who are visually impaired), other suggestions could possibly be used with all students (i.e., computer testing).
Longer testing time Use larger font Provide testing materials in Braille Removal of complex linguistics

61
Ask only a few questions in a variety of ways Use a broad range of questions, easy to hard Make the test longer Use less graphics Use multiple approaches in testing that are consistent with the teacher’s modes of
presentation Use manipulatives or concrete objects in testing Use multimedia, computers, video (Use of technology would require training on how
to take the test.) Use closed captioned television sets Use individualized computer testing (What happens at schools that don’t have
computers? Many schools don’t have computers.) Give tests on tape where someone reads it and it is recorded Test students on individualized content Do one on one or small group testing Give a child an assistant to answer questions or help express answers Let parents accompany child Have another person read test items Test the child verbally Create portfolio-based assessments Let any student who wants to have the accommodation have it
Future Focus Group Participants Participants in this focus group expressed that students, parents, administrators, teachers, and district psychologists could provide valuable insight on issues pertaining to the assessment of students with disabilities and should participate in future focus groups.

62
Session 2 Facilitator: Jamal Abedi Participants: Graduate Students at UC Davis School of Education Date: April 25, 2006 Background of Participants This focus group consisted of people with a background in K–12 classroom teaching, community college instruction, and university teaching assistants. All had experiences with students with disabilities in a professional and or personal capacity. This group had contact with students who are blind, have learning disabilities, dyslexia, dysgraphia, auditory processing issues or impairments, reading disability, physical disabilities, attention-deficit hyperactivity disorder (ADHD), autism, visually impairments, and speaking impairments. Accommodations Two participants brought up the issue that in providing accommodations, the construct of the test may be changed. One participant expressed the need to accommodate the disability in testing without changing the content of the assessment (i.e., translating a test to Braille for a blind student). However, if a reading test is changed to audio, the nature of the test is different, thus being problematic. Students can be given a test in a different environment to reduce distraction. Students can be given more time to complete a test, especially in the case of students with processing issues. Two participants expressed that it is unfair to use the same test for students with disabilities and is necessary to make changes to the test for these students. Format One participant expressed that a test being too long or containing too much text may be daunting and cause anxiety. Use of visuals may help. However, another participant noted that pictures could be helpful in some contexts but in others could be just as distracting as text. One participant noted that test questions should be narrowly focused and should not contain extra information. Experts should be involved in examining test constructs. Tests should be piloted and focus groups should be conducted to determine issues in the test. Participants ranked format issues that may interfere with accessibility of reading assessments for students with disabilities. Factors thought to interfere with accessibility include frustration with test length or long reading passages, too many options on a multiple choice test, frustration with test difficulty, fatigue, and general feelings of inadequacy due to having a disability.

63
Session 3 Facilitator: Lisa Sullivan Participants: School Psychologists (2), Reading Specialist Date: June 12, 2006 Background of Participants Two school psychologists and one reading specialist from a local school district in Davis, California participated in the focus group. One school psychologist had worked in private practice and in the public school system for 20+ years. The second school psychologist also had over 20 years experience working in schools with children with learning disabilities and behavioral disabilities. The reading specialist had worked both as a Special Education teacher and as a reading teacher for 25 years, and had a great deal of knowledge on different reading programs and how they help students. Accommodations One participant felt that testing kids out of grade level was valuable. This involves testing students according to their reading level, not their age level. Many of the accommodations that are most appropriate for students are very difficult to get. They require going to the State Board of Education. Challenges Participants believed that there are many reasons why students are struggling with reading. There is an over-representation of ELL students who are classified as having learning disabilities. A language evaluation is key. Factors such as background, time spent at home exposed to language and reading, parents education, etc., have a huge impact on learning. We may test an autistic child, an ELL student and a language disabled student in the same way. Ideally, a reading assessment would not just test for reading comprehension, but it would be testing causal factors that impact reading comprehension. Fatigue is a big factor, especially when the material is far too difficult. These students are often weaker in test taking strategies. Students with processing disorders, neurodevelopmental disorders or psychological disorders are generally going to have more trouble with strategies and with accessing testing. These students have less exposure to test taking strategies because they are more focused on basic skills. They are less exposed to higher level academic language that is necessary to be successful on assessments. Format and Style The participants cited that having something built into the assessment that would identify the limitations or factors impacting skills is important. It’s important to vary the test passages. Some very short passages would tell us if they can comprehend at this level first. The current format is intimidating to LD students. They are struggling to read so they may not read all of
64
the directions or the full item. When you add into this mix the fact that they probably don’t apply test taking strategies then it all adversely affects their performance. Interacting with Students Participants believed that many students taking standardized tests reach a ceiling and they stop. They say to themselves, ‘I feel overwhelmed, I’m not happy. I feel unsuccessful’. Many stop trying after the first day and simply bubble in the answers. They all have different drop off points, but eventually they stop putting in an effort. For students with learning disabilities, it would seem much fairer to give these students a chance to tell us when they’ve reached their limit. It might be interesting to determine if it’s just a matter of a low stimulation activity. This drop-off may not be purely a response to the test. If we could compare how they perform on various low and high stimulation activities, we might be able to say more about this response. Participants believe that many students don’t see the point of standardized tests. They don’t have any direct impact on them. It would be really helpful if we explained what we will learn from the test and then follow-up when the results come back. Some kids also need more feedback as they are going along.
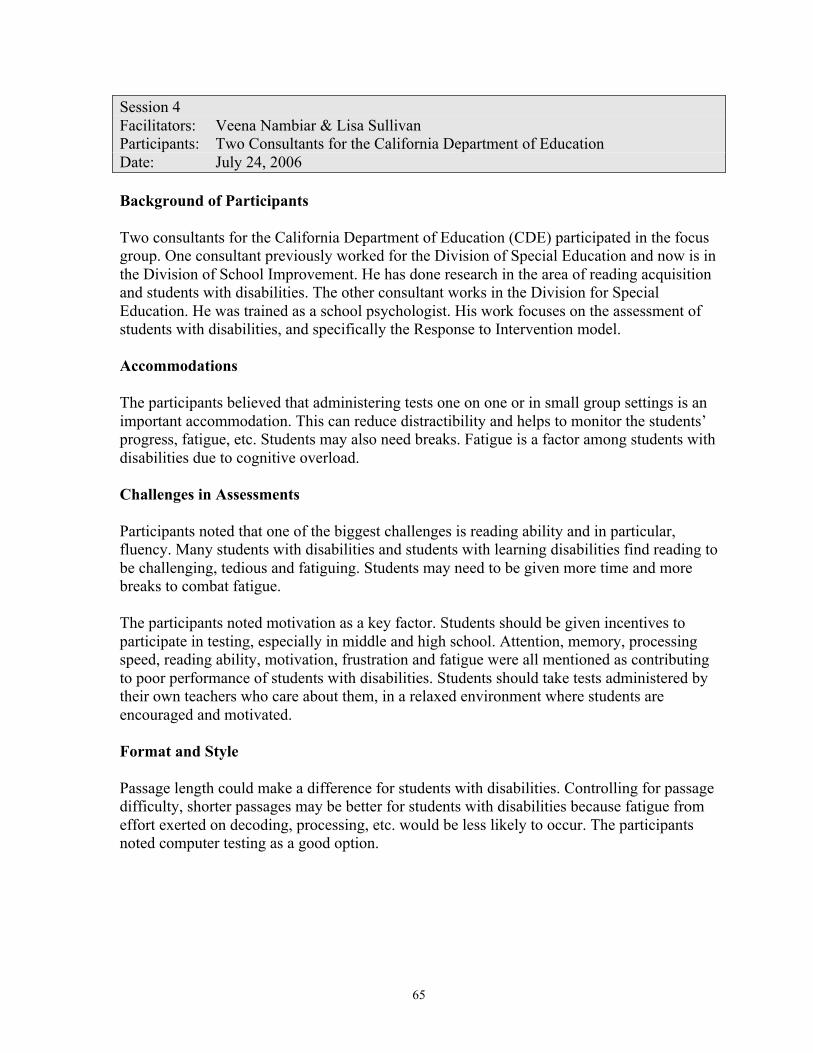
65
Session 4 Facilitators: Veena Nambiar & Lisa Sullivan Participants: Two Consultants for the California Department of Education Date: July 24, 2006 Background of Participants Two consultants for the California Department of Education (CDE) participated in the focus group. One consultant previously worked for the Division of Special Education and now is in the Division of School Improvement. He has done research in the area of reading acquisition and students with disabilities. The other consultant works in the Division for Special Education. He was trained as a school psychologist. His work focuses on the assessment of students with disabilities, and specifically the Response to Intervention model. Accommodations The participants believed that administering tests one on one or in small group settings is an important accommodation. This can reduce distractibility and helps to monitor the students’ progress, fatigue, etc. Students may also need breaks. Fatigue is a factor among students with disabilities due to cognitive overload. Challenges in Assessments Participants noted that one of the biggest challenges is reading ability and in particular, fluency. Many students with disabilities and students with learning disabilities find reading to be challenging, tedious and fatiguing. Students may need to be given more time and more breaks to combat fatigue. The participants noted motivation as a key factor. Students should be given incentives to participate in testing, especially in middle and high school. Attention, memory, processing speed, reading ability, motivation, frustration and fatigue were all mentioned as contributing to poor performance of students with disabilities. Students should take tests administered by their own teachers who care about them, in a relaxed environment where students are encouraged and motivated. Format and Style Passage length could make a difference for students with disabilities. Controlling for passage difficulty, shorter passages may be better for students with disabilities because fatigue from effort exerted on decoding, processing, etc. would be less likely to occur. The participants noted computer testing as a good option.

66
Interacting with Students The participants felt that it is important to have testing day observations of students to see if they are getting tired or frustrated. It would be informative to use a survey measure of motivation, fatigue, and interest level to obtain some data on how these factors could affect achievement.
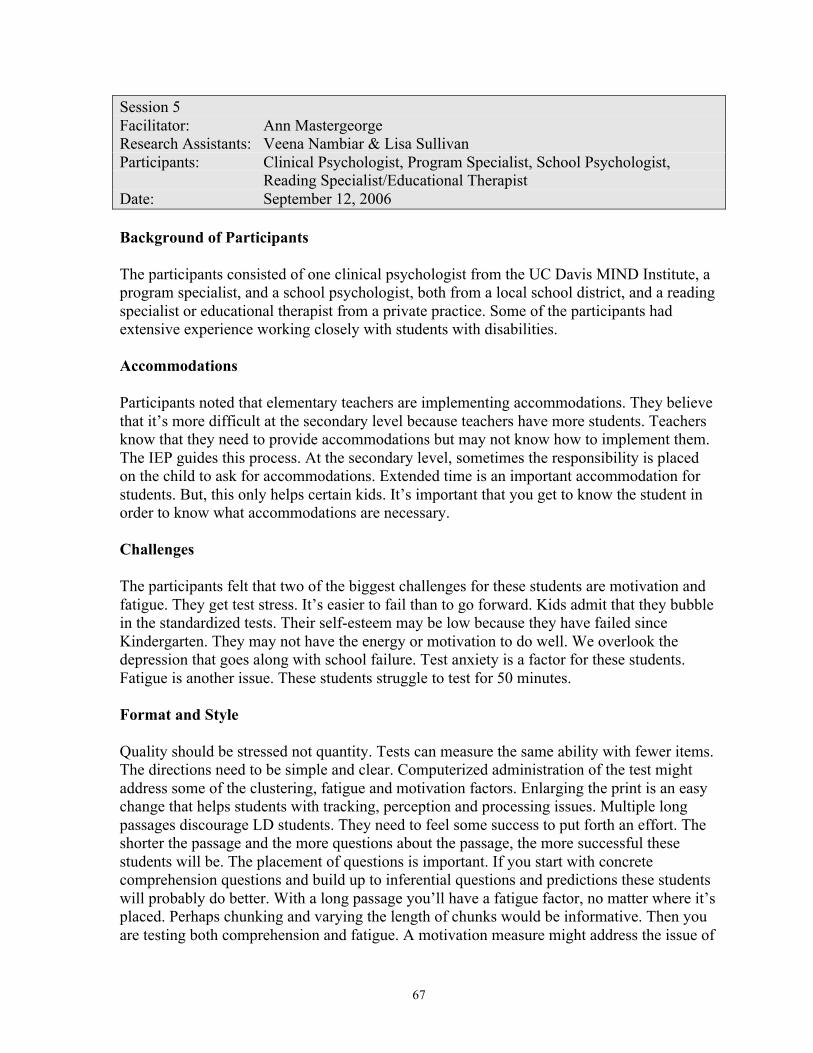
67
Session 5 Facilitator: Ann Mastergeorge Research Assistants: Veena Nambiar & Lisa Sullivan Participants: Clinical Psychologist, Program Specialist, School Psychologist,
Reading Specialist/Educational Therapist Date: September 12, 2006 Background of Participants The participants consisted of one clinical psychologist from the UC Davis MIND Institute, a program specialist, and a school psychologist, both from a local school district, and a reading specialist or educational therapist from a private practice. Some of the participants had extensive experience working closely with students with disabilities. Accommodations Participants noted that elementary teachers are implementing accommodations. They believe that it’s more difficult at the secondary level because teachers have more students. Teachers know that they need to provide accommodations but may not know how to implement them. The IEP guides this process. At the secondary level, sometimes the responsibility is placed on the child to ask for accommodations. Extended time is an important accommodation for students. But, this only helps certain kids. It’s important that you get to know the student in order to know what accommodations are necessary. Challenges The participants felt that two of the biggest challenges for these students are motivation and fatigue. They get test stress. It’s easier to fail than to go forward. Kids admit that they bubble in the standardized tests. Their self-esteem may be low because they have failed since Kindergarten. They may not have the energy or motivation to do well. We overlook the depression that goes along with school failure. Test anxiety is a factor for these students. Fatigue is another issue. These students struggle to test for 50 minutes. Format and Style Quality should be stressed not quantity. Tests can measure the same ability with fewer items. The directions need to be simple and clear. Computerized administration of the test might address some of the clustering, fatigue and motivation factors. Enlarging the print is an easy change that helps students with tracking, perception and processing issues. Multiple long passages discourage LD students. They need to feel some success to put forth an effort. The shorter the passage and the more questions about the passage, the more successful these students will be. The placement of questions is important. If you start with concrete comprehension questions and build up to inferential questions and predictions these students will probably do better. With a long passage you’ll have a fatigue factor, no matter where it’s placed. Perhaps chunking and varying the length of chunks would be informative. Then you are testing both comprehension and fatigue. A motivation measure might address the issue of

68
a child randomly marking the bubbles. It would helpful to know how motivation might be impacting their performance. Another simple format item is placing a graphic at the top of the page for each passage. This helps students keep track of what they’ve read. Interacting with Students Participants felt that many students don’t see the end point. Relevance is a huge factor. Many don’t feel these tests have any relevance. The psychosocial context in which many children are living interferes with their ability to learn adequately. It’s rare that students with learning disabilities don’t also have other risk factors at home. Most kids will put forth an effort if there is a consequence. The State Standards test has no consequence to them. If they had an incentive they might hang in there a little longer. The participants believe that it’s crucial for them to get feedback.

69
APP
EN
DIX
B:
Segm
ente
d T
ext E
xam
ple
Fi
gure
1. R
eadi
ng p
assa
ge e
xam
ple
usin
g se
gmen
ted
text
form
at. C
opyr
ight
ed b
y th
e C
omm
onw
ealth
of V
irgin
ia D
epar
tmen
t of E
duca
tion.
All
right
s res
erve
d.
Rep
rodu
ced
with
per
mis
sion
.
69

70
70
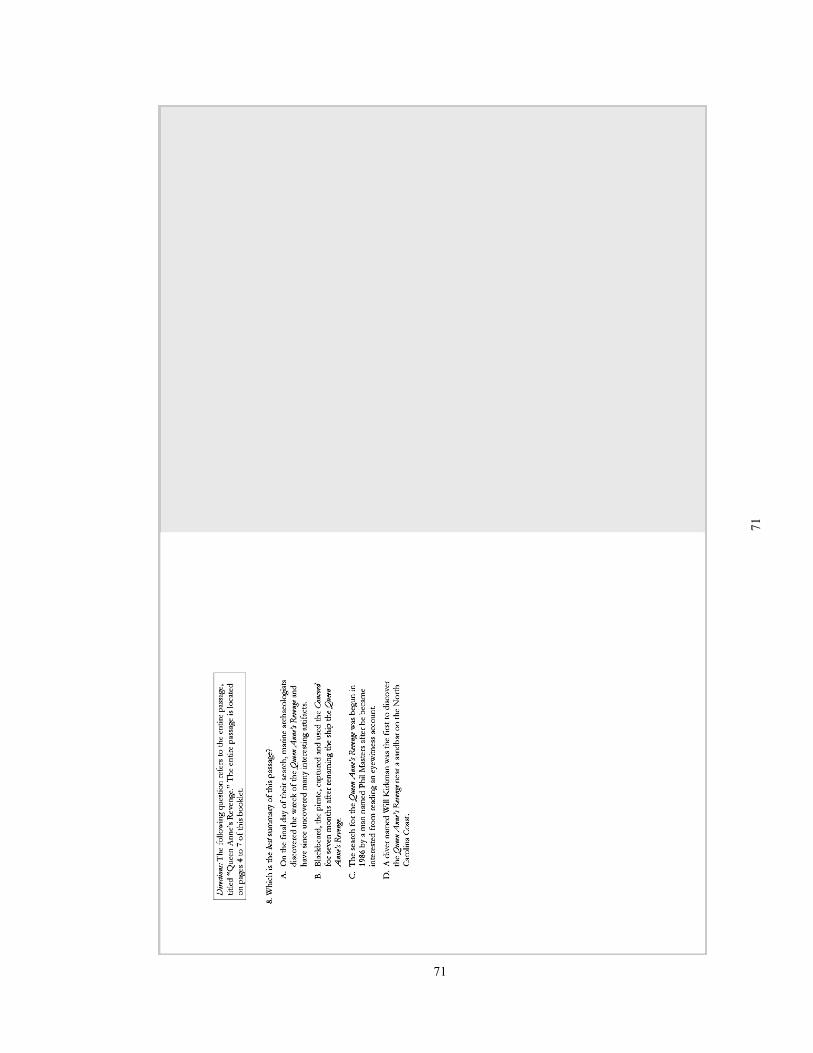
71
71

72
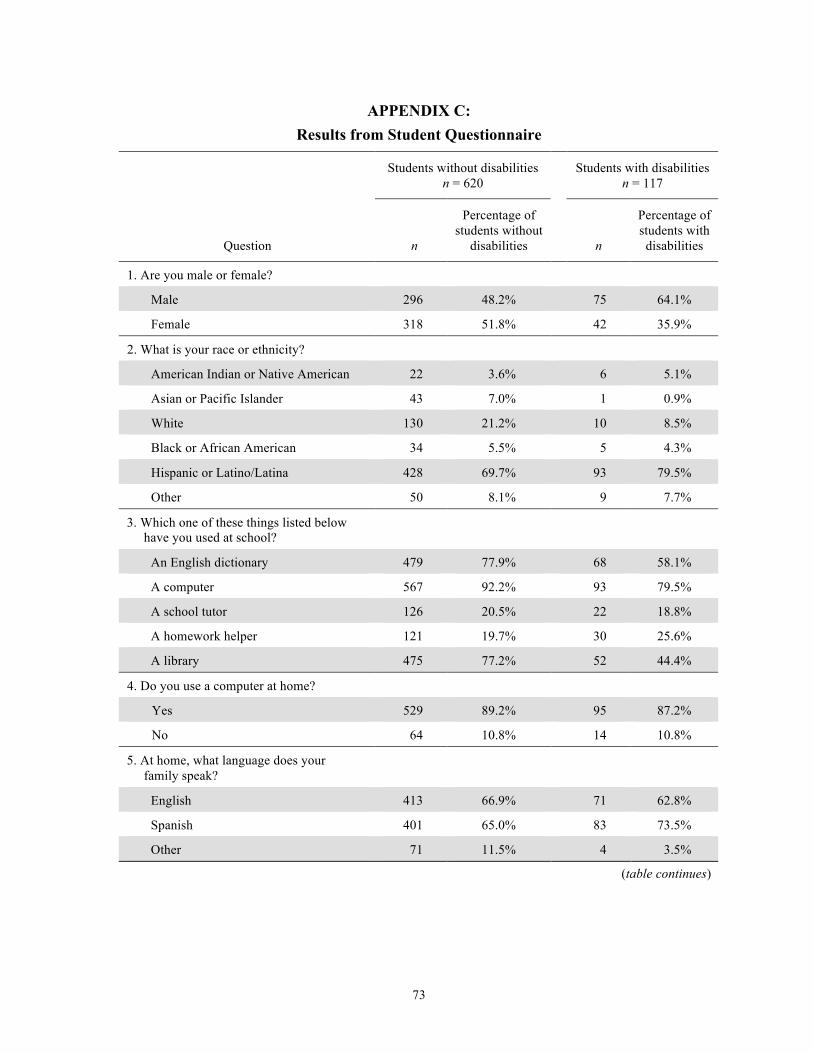
73
APPENDIX C: Results from Student Questionnaire
Students without disabilities n = 620
Students with disabilities n = 117
Question n
Percentage of students without
disabilities n
Percentage of students with disabilities
1. Are you male or female?
Male 296 48.2% 75 64.1%
Female 318 51.8% 42 35.9%
2. What is your race or ethnicity?
American Indian or Native American 22 3.6% 6 5.1%
Asian or Pacific Islander 43 7.0% 1 0.9%
White 130 21.2% 10 8.5%
Black or African American 34 5.5% 5 4.3%
Hispanic or Latino/Latina 428 69.7% 93 79.5%
Other 50 8.1% 9 7.7%
3. Which one of these things listed below have you used at school?
An English dictionary 479 77.9% 68 58.1%
A computer 567 92.2% 93 79.5%
A school tutor 126 20.5% 22 18.8%
A homework helper 121 19.7% 30 25.6%
A library 475 77.2% 52 44.4%
4. Do you use a computer at home?
Yes 529 89.2% 95 87.2%
No 64 10.8% 14 10.8%
5. At home, what language does your family speak?
English 413 66.9% 71 62.8%
Spanish 401 65.0% 83 73.5%
Other 71 11.5% 4 3.5%
(table continues)
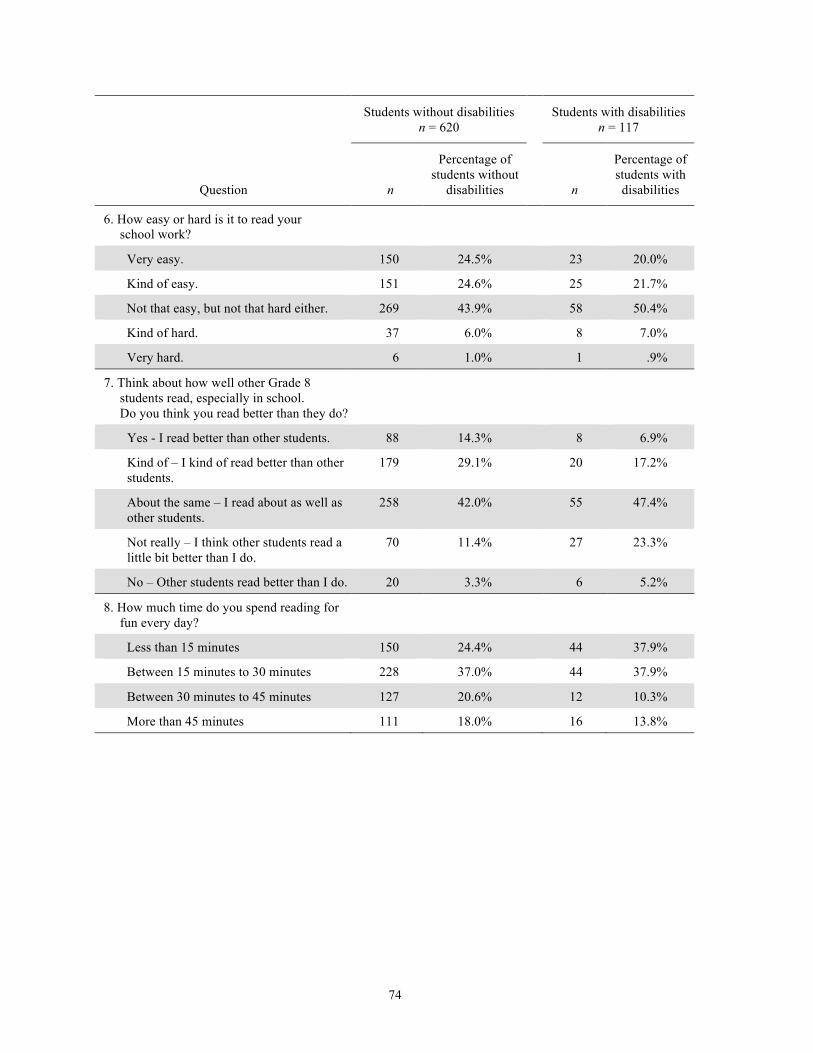
74
Students without disabilities n = 620
Students with disabilities n = 117
Question n
Percentage of students without
disabilities n
Percentage of students with disabilities
6. How easy or hard is it to read your school work?
Very easy. 150 24.5% 23 20.0%
Kind of easy. 151 24.6% 25 21.7%
Not that easy, but not that hard either. 269 43.9% 58 50.4%
Kind of hard. 37 6.0% 8 7.0%
Very hard. 6 1.0% 1 .9%
7. Think about how well other Grade 8 students read, especially in school. Do you think you read better than they do?
Yes - I read better than other students. 88 14.3% 8 6.9%
Kind of – I kind of read better than other students.
179 29.1% 20 17.2%
About the same – I read about as well as other students.
258 42.0% 55 47.4%
Not really – I think other students read a little bit better than I do.
70 11.4% 27 23.3%
No – Other students read better than I do. 20 3.3% 6 5.2%
8. How much time do you spend reading for fun every day?
Less than 15 minutes 150 24.4% 44 37.9%
Between 15 minutes to 30 minutes 228 37.0% 44 37.9%
Between 30 minutes to 45 minutes 127 20.6% 12 10.3%
More than 45 minutes 111 18.0% 16 13.8%

75
APPENDIX D: Emotion/Mood Inventory (EMI)
THINKING ABOUT WHAT YOU JUST READ
1. Think about the passage you just read. Think about the test questions too. How easy or hard were the passage and the questions? Circle your response.
o Very easy. o Kind of easy. o Not that easy, but not that hard either. o Kind of hard. o Very hard.
2. How does taking this test make you feel? Please circle all the words that describe how you feel. There is no right or wrong answer. If none of these words describe how you feel, please circle NONE.
good tired
energetic upset
bored confident
frustrated okay
happy stressed
blanked out interested
relaxed bad
NONE

76
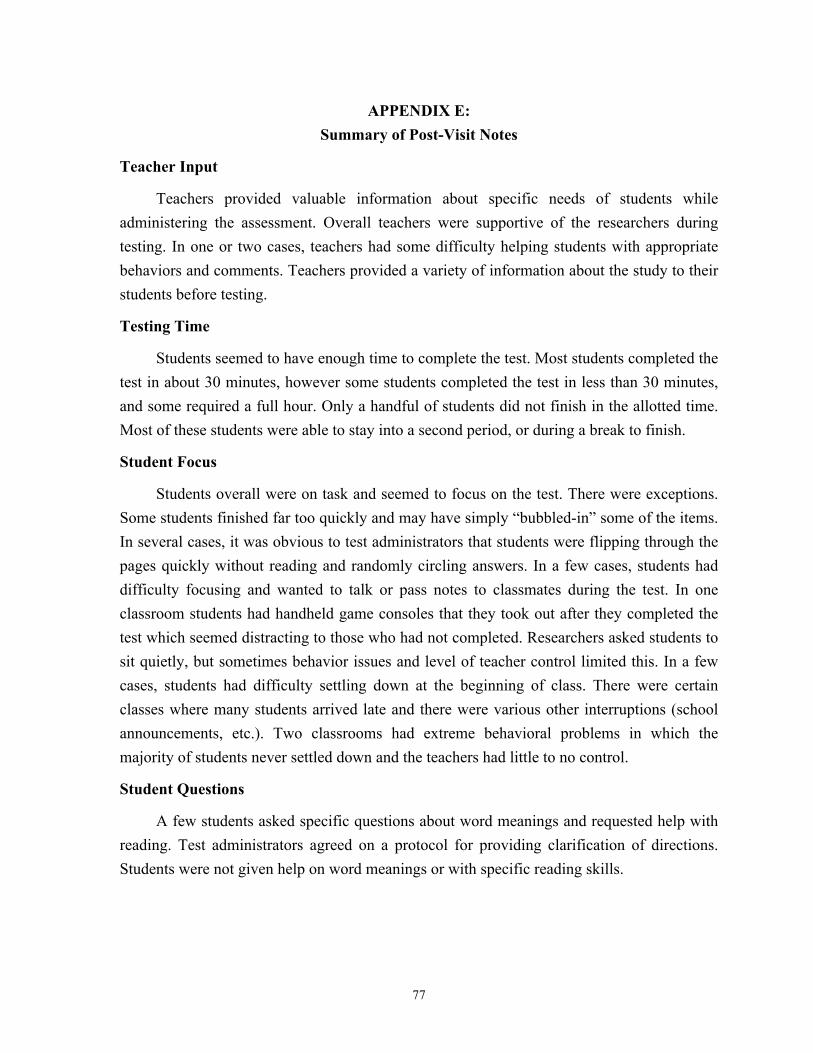
77
APPENDIX E: Summary of Post-Visit Notes
Teacher Input
Teachers provided valuable information about specific needs of students while administering the assessment. Overall teachers were supportive of the researchers during testing. In one or two cases, teachers had some difficulty helping students with appropriate behaviors and comments. Teachers provided a variety of information about the study to their students before testing.
Testing Time
Students seemed to have enough time to complete the test. Most students completed the test in about 30 minutes, however some students completed the test in less than 30 minutes, and some required a full hour. Only a handful of students did not finish in the allotted time. Most of these students were able to stay into a second period, or during a break to finish.
Student Focus
Students overall were on task and seemed to focus on the test. There were exceptions. Some students finished far too quickly and may have simply “bubbled-in” some of the items. In several cases, it was obvious to test administrators that students were flipping through the pages quickly without reading and randomly circling answers. In a few cases, students had difficulty focusing and wanted to talk or pass notes to classmates during the test. In one classroom students had handheld game consoles that they took out after they completed the test which seemed distracting to those who had not completed. Researchers asked students to sit quietly, but sometimes behavior issues and level of teacher control limited this. In a few cases, students had difficulty settling down at the beginning of class. There were certain classes where many students arrived late and there were various other interruptions (school announcements, etc.). Two classrooms had extreme behavioral problems in which the majority of students never settled down and the teachers had little to no control.
Student Questions
A few students asked specific questions about word meanings and requested help with reading. Test administrators agreed on a protocol for providing clarification of directions. Students were not given help on word meanings or with specific reading skills.
78
Student Participation
Parent information letters or parent permission forms were sent home. On average, a few students in each classroom were not able to participate. The reasons for non-participation included parents withdrawing their child from participation, or the students requesting not to participate. In a few cases, students were pulled out of class for other ongoing testing (e.g., National Assessment of Educational Progress). Students who arrived very late to class were not asked to participate. Students not participating (or who finished early) were asked by teachers to work on homework (or other quiet activity).
Classroom Personnel
Several classrooms had personnel in addition to the teacher, such as a resource specialist. In some cases, the resource specialist was permanently assigned to the classroom, and helped students with disabilities with general questions during test administration. One classroom had a leadership coordinator present for a program to keep students out of gangs.
Data from Teachers
There were some issues with gathering all of the data from teachers at the sites. As the assessment only took one class period, it was occasionally difficult to insist on teachers providing the Student Background Questionnaires and Instructional Practices Questionnaires. Several teachers did not have them completed and had to send them later. In a few cases teachers did not complete questionnaires for all of their students.
Timing of Test Administration
A general observation was that students who were tested at the end of the day seemed less focused than students tested in the morning. Also, when the test was administered during one of the last periods on a Friday after lunch, students seemed especially distracted. Testing also seemed to be impacted by whether students were preparing to go off-track (many schools in Los Angeles are on a year-round, track-based system). In general, the students getting ready to go off-track seemed a little bit more distracted.
There were a few cases of new students, who just entered the school within a few weeks. The background data received from the school and teachers was limited for these students, although they did complete the assessment.
Student Feedback
When students were introduced to the researchers and then told that they would be taking a test, many students replied that tests were boring and that they hated tests.

79
Researchers used this opening to share the goal of the study – making tests fairer for students. In general, students seemed intrigued to be part of a study. This was, in part, dependent on how much information teachers shared with their students about the study. For example, one teacher (who had three classrooms participate in the study) informed her students that they would be “playing a part” in helping make tests better. Additionally, some students provided verbal feedback after completing the test. Of the students who volunteered feedback, most said they preferred the format of the segmented test and felt it was “easier.” Students volunteered that the passages were boring. Based on casual observation of student responses, there was some variation in which passage was least boring.
Teacher Feedback
Teachers were interested in the results of the study. Overall, teachers felt that the segmented test would provide more reliable data on their students. Several of the teachers also expressed curiosity about the motivation questions. One special education teacher mentioned that she verbally asked her students similar questions following assessments. She felt it was valuable to know how students were feeling while taking a test as this might impact their performance.
Accommodations
Extended time was the most common accommodation provided to students in the study. One student was allowed to use a dictionary, an accommodation that his teacher specified. All teachers were asked to provide the accommodations that students with disabilities required during testing. Extended time was allowed for all students who needed additional time to complete the test. However, as mentioned, only a few students in the sample needed time beyond the class period to complete the assessment. Three of the classrooms were grouped together in a “small group” setting comprising only of students with disabilities. These classes were part of students’ regular schedule as a “resource room” and these students received regular testing during these class periods.
Testing Environments
Test environments varied from school to school and classroom to classroom, however there were no dramatic differences with the exception of one school which was in a low socioeconomic status neighborhood and appeared to have regular school crime and violence. Many of the students in this setting had difficulty focusing and were disruptive, especially in two of the four classrooms that participated. These teachers also had trouble controlling their students. One classroom contained an additional adult as part of a leadership program to
80
prevent students from joining gangs. However, test administrators found this person socializing with students and contributing to the disruption.
Several classes were held in bungalows and there was some noise from neighboring classrooms. One classroom had a substitute teacher and the students seemed a little less focused. Some classrooms were arranged in a way that was conducive to testing whereas others were less conducive. Several of the classrooms visited were on block schedules and students were able to finish the test in the second class period or during the break. In a few cases, this involved students completing the test whereas other students were talking and having a quick break before the second block began. There were several classes where behavior issues made testing extremely difficult (students talked over the teacher and were generally disruptive).