Embed Size (px)
Citation preview
Credit Suisse – Investor Conference, NYCompany Presentation25 - 26 February 2016

Pakistan’s No. 1 commercial bank
1
# 1 bank in Pakistan by(1): International footprint
HBL maintains a AAA/A-1+ rating (JCR-VIS)(2) with a stable outlook
Track record of 75 years
Universal banking model across financial services including asset management and insurance segments
One of the largest banking networks in South Asia
Overseas coverage in 28 countries
Network covers financial major hubs; London, New York, Brussels, Singapore, Dubai, Hong Kong and 65 international branches (including branches of subsidiaries)
Positioned as a regional player to increase market share in
− Remittances
− Trade finance
− Investment banking
Note: Based on US$1.00: PKR 104.74(1) As of 31 December 2015 except
- Market capitalization as of February 22, 2016(2) Japan Credit Rating Agency - Vital Information Services.
Kenya
Seychelles
Mauritius
SingaporeMaldives
Sri Lanka
Bangladesh
Nepal
Afghanistan
Kyrgyz Republic
United States
of America
United Kingdom
Hong Kong
Turkey
Oman
UAEBahrain
Lebanon
FranceBelgium
Netherlands
Switzerland
Tanzania
Uganda
Burundi
Subsidiary
Related Entity
Branch
Head Office and Domestic Branch Network
AssetsPKR 2,218bn(US$ 21bn)
#1
DepositsPKR 1,635bn(US$ 16bn)
#1
# of Domestic Branches
1,663#1
# of ATMs 1,947#1
# of Customers 11mn +#1
Net profitPKR 35bn
(US$ 335mn)#1
Market capitalization
PKR 269bn(US$ 2.6bn)
#1
Representative office
ChinaIran
India

2
Pakistan has a total of 44 banks including Government Owned Banks, Privatized Banks, Development Financial Institutions, Private Banks and Foreign Banks
Since 1991, 4 of the top 5 banks (HBL, UBL, MCB, and ABL) in Pakistan have been privatized
State Bank of Pakistan, the main regulator is generally viewed as one of the most prudent regulators in the region
All banks in Pakistan are currently under transitional Basel III regime
A strong public central credit information bureau and four private credit bureaus allow for effective credit origination and monitoring
Pakistan’s banking sector today
21.2
16.314.2
9.7 9.5
HBL NBP UBL MCB ABL
(1) Based on 31 December 2015 financials
The five largest banks in Pakistan by total assets(1)Sector overview
(US$bn)
Secondary sale of HBL shares by the GoP was the largest ever equity offering in Asian Frontier Markets
Oversubscribed by 1.6 times at the final offer price
76% of the offering size allocated to foreign investors
CDC and IFC came in as “anchor” investors
Many major global institutional investors participated, taking a >1% stake
Privatisation of Pakistan banks
Sale date
% stake sold
Apr 2015
41.5%
Jun 2014
19.8%
Dec 2014
10.1%
Proceeds raised (US$mn) 1,010 388 143
Divestments by the GoP of holdings in Pakistan banks
Secondary Public offering of HBL
One of the lowest bank penetrations offers room for growth
Source: Business MonitorNote: Selected Asian countries only
0
10
20
30
40
Japan
New
Ze
ala
nd
Au
str
alia
Hon
g K
ong
Bru
nei
Taiw
an
Ma
laysia
Sa
moa
S.
Kore
a
Sri
Lanka
Bh
uta
n
Thaila
nd
Ind
ia
Fiji
Sin
ga
pore
Ind
onesia
Pa
kis
tan
Nep
al
Ph
ilipp
ine
s
Ba
ngla
desh
Chin
a
Kir
iba
ti
Tim
or-
Le
ste
Cam
bodia
Vie
tnam
Lao
s
Afg
hanis
tan
Pa
pua N
.G.
Myanm
ar

HBL – the foundation of Pakistan’s financial sector
3
1941Incorporated in Bombay
1947
Established operations in Pakistan and moved Head Office to Karachi
1951Established first international branch in Sri Lanka
1972
Built Habib Bank Plaza, which was commissioned to commemorate the Bank’s 25th anniversary
1974Nationalized
Corporate milestones Current shareholders(1)
Major awards & innovations
Major awards
2004Majority control acquired by AKFED
2007Public listing on the Stock Exchanges
(1) Data as of 31 December 2015
2012First Pakistani bank to achieve PKR1tn in deposits
Products tailored towards women in cooperation with GBA, IFC and Westpac
Innovations
Products tailored towards youth to expand services to the underbanked
Best Bank in Pakistan
2015
Best Bank in Pakistan
2014
Bank of the Year Pakistan
2014
Safest Bank in Pakistan
2014
Best Trade Finance Provider
Pakistan 2014
Best Trade Finance Bank
Pakistan 2014
Safest Bank in Pakistan
2015
Best Retail Bank In Pakistan
2015
Brand of the year in Pakistan
2015
Best Local Trade Finance Bank in
Pakistan 2015
Best Investment Bank in Pakistan
2015
Best Domestic Bank in Pakistan
2015
AKFED51%
Others 38%
CDC5%
IFC3%
AKFED related entities
3%

Branch Banking
Corporate &
Investment
Banking
TreasuryInternational
Banking
Innovation &
Financial
Inclusion
Payment
Services
Group
Financial
Institutions &
Global Trade
Services
Islamic Banking Other businesses
Largest branch
network in
Pakistan of
1,663 branches
(14% of total
bank branches)
Share of 20%
of total bank
accounts in
Pakistan
Corporate
Banking Group
offers both
funded and non-
funded products
Investment
banking offers
advisory, equity
capital markets,
project finance
and infrastructure
advisory,
syndication and
debt capital
markets
Fixed
income
Equity
Foreign
exchange
Proprietary
trading
International
network of 65
branches in 28
countries
International
operations
managed via
regional hubs:
- Europe, Middle
East & Americas
- Asia & Africa
Branchless
banking
Digital
banking
- Internet
- Mobile
Employee
banking
Alternate
delivery
channels
(ATM &CDM)
Cash
management
Debit cards
POS and IPG
Relationship
management
with both
domestic and
international
financial
institutions
Provides trade
finance, cash
management,
treasury,
bilateral loans
and nostro
accounts
Sharia
compliant
product offering
Distributed
through Islamic
windows in
conventional
branches and
44 dedicated
Islamic banking
branches
Global
remittances –
serving remitters
and their
beneficiaries
through a range
of products and
solutions
Wholly owned
subsidiary
7 mutual funds
2 pension funds
Insurance
presence via
associate
companies
Universal business model
4
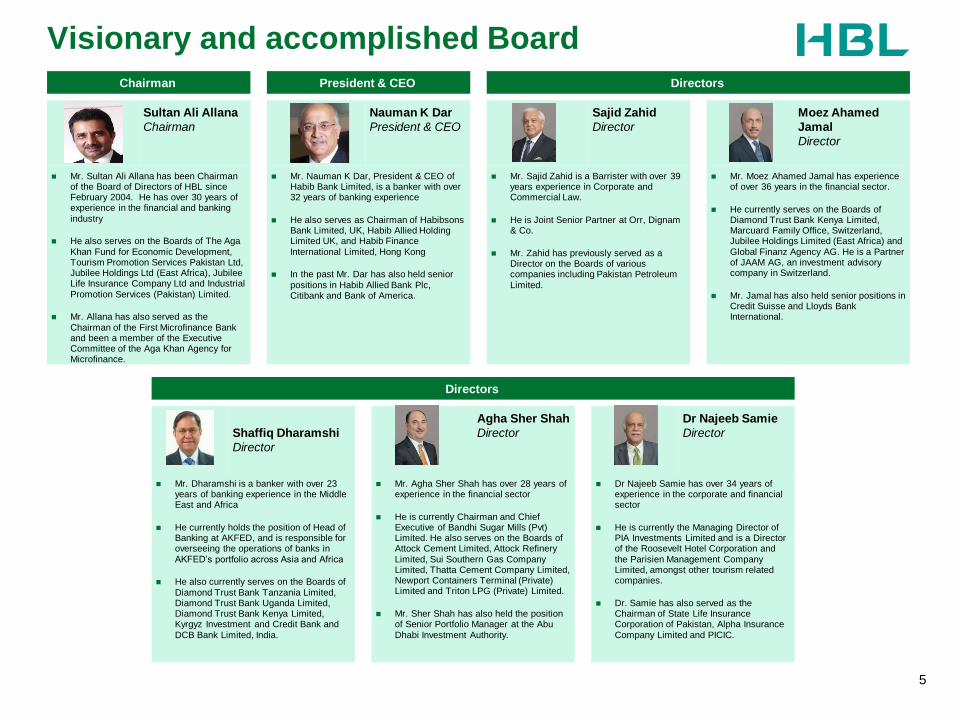
Visionary and accomplished Board
Chairman President & CEO Directors
Sultan Ali Allana
Chairman
Nauman K Dar
President & CEO
Sajid Zahid
Director
Moez Ahamed
Jamal
Director
Mr. Sultan Ali Allana has been Chairman of the Board of Directors of HBL since February 2004. He has over 30 years of experience in the financial and banking industry
He also serves on the Boards of The Aga Khan Fund for Economic Development, Tourism Promotion Services Pakistan Ltd, Jubilee Holdings Ltd (East Africa), Jubilee Life Insurance Company Ltd and Industrial Promotion Services (Pakistan) Limited.
Mr. Allana has also served as the Chairman of the First Microfinance Bank and been a member of the Executive Committee of the Aga Khan Agency for Microfinance.
Mr. Nauman K Dar, President & CEO of Habib Bank Limited, is a banker with over32 years of banking experience
He also serves as Chairman of Habibsons Bank Limited, UK, Habib Allied Holding Limited UK, and Habib Finance International Limited, Hong Kong
In the past Mr. Dar has also held senior positions in Habib Allied Bank Plc, Citibank and Bank of America.
Mr. Sajid Zahid is a Barrister with over 39 years experience in Corporate and Commercial Law.
He is Joint Senior Partner at Orr, Dignam & Co.
Mr. Zahid has previously served as a Director on the Boards of various companies including Pakistan Petroleum Limited.
Mr. Moez Ahamed Jamal has experience of over 36 years in the financial sector.
He currently serves on the Boards of Diamond Trust Bank Kenya Limited, Marcuard Family Office, Switzerland, Jubilee Holdings Limited (East Africa) and Global Finanz Agency AG. He is a Partner of JAAM AG, an investment advisory company in Switzerland.
Mr. Jamal has also held senior positions in Credit Suisse and Lloyds Bank International.
Directors
Shaffiq Dharamshi
Director
Agha Sher Shah
Director
Dr Najeeb Samie
Director
Mr. Dharamshi is a banker with over 23 years of banking experience in the Middle East and Africa
He currently holds the position of Head of Banking at AKFED, and is responsible for overseeing the operations of banks in AKFED’s portfolio across Asia and Africa
He also currently serves on the Boards of
Diamond Trust Bank Tanzania Limited, Diamond Trust Bank Uganda Limited, Diamond Trust Bank Kenya Limited, Kyrgyz Investment and Credit Bank and DCB Bank Limited, India.
Mr. Agha Sher Shah has over 28 years of experience in the financial sector
He is currently Chairman and Chief Executive of Bandhi Sugar Mills (Pvt) Limited. He also serves on the Boards of Attock Cement Limited, Attock Refinery Limited, Sui Southern Gas Company Limited, Thatta Cement Company Limited, Newport Containers Terminal (Private) Limited and Triton LPG (Private) Limited.
Mr. Sher Shah has also held the position of Senior Portfolio Manager at the Abu Dhabi Investment Authority.
Dr Najeeb Samie has over 34 years of experience in the corporate and financialsector
He is currently the Managing Director of PIA Investments Limited and is a Director of the Roosevelt Hotel Corporation and the Parisien Management Company Limited, amongst other tourism related companies.
Dr. Samie has also served as the Chairman of State Life Insurance Corporation of Pakistan, Alpha Insurance Company Limited and PICIC.
5

First class senior management team
6(1) Number of years in HBL / years in banking / Total work experience .
Experienced management team with significant experience with HBL and other local and international banks
Strong track record of growth and profitability overseeing HBL’s net profit increasing from PKR17bn to PKR35bn between 2010 and 2015 (+16% CAGR)
Acquired Barclays’ Pakistan business to add high-quality talent to the Bank, similar to that experienced following the Bank’s purchase of Citi Pakistan’s consumer business.
Faisal AnwarChief Compliance Officer3 / 31/ 31(1)
Naveed AsgharChief Marketing Officer2 / 2 / 23 (1)
Rayomond KotwalChief Financial Officer2 / 19 / 30(1)
Nausheen AhmadCompany Secretary & Head Legal10 / 10 / 28(1)
Ayaz AhmedHead, Acquisitions & Investments16 / 24 / 34(1)
HBL’s management team is highly experienced in managing domestic and international banks
Aamir Irshad
Head, Corporate & Investment Banking11 / 25 / 28(1)
Anwar ZaidiHead, Financial Institutions & Global Trade Services14 / 35 / 35(1)
Salahuddin ManzoorGlobal Treasurer6 / 33 / 33(1)
Faiq SadiqHead, Payment Services16 / 26 / 26(1)
Hassan Raza
Head, Structured Credits4 / 24 / 24(1)
Mirza Saleem BaigHead, Islamic Banking15 / 31 / 33(1)
Sima KamilHead, Branch Banking15 / 30 / 30(1)
Dr. Aamir MatinHead Technology Strategy1 / 5 / 301)
Jamal NasirGlobal Head Human and Organizational Development2 / 19 / 29(1)
Salim AmlaniChief Internal Auditor11 / 40 / 40(1)
Tariq M. AkbarHead, Global Operations16 / 40 / 41(1)
Rizwan HaiderChief Risk Officer14 / 35 / 36(1)
Abbas HasanHead International BankingEurope, Middle East & Americas
4 / 31 / 32(1)
Abrar MirChief Innovation & Financial Inclusion Officer1 / 15 / 21(1)
Abid SattarHead International BankingAsia & Africa11 / 33 / 33(1)

Progress since privatization – Balance sheet
7
Net Advances
259317
349382
456 455 460 457500
564595
633
2004 2005 2006 2007 2008 2009 2010 2011 2012 2013 2014 2015
(PKRbn)
Total assets
488 529 594689 750
864 9251,140
1,6101,715
1,865
2,218
2004 2005 2006 2007 2008 2009 2010 2011 2012 2013 2014 2015
(PKRbn)
Deposits
405 433 459531
597683
747
934
1,215
1,4011,525
1,635
2004 2005 2006 2007 2008 2009 2010 2011 2012 2013 2014 2015
(PKRbn)
Shareholders equity
3241
53 60 66
8496
109
133142
170183
2004 2005 2006 2007 2008 2009 2010 2011 2012 2013 2014 2015
(PKRbn)

Progress since privatization – Operating results
8
Return on Equity
21%
26% 27%
17%17% 18%
19%
22%
19%17%
20% 20%
2004 2005 2006 2007 2008 2009 2010 2011 2012 2013 2014 2015
Total Revenue
2433
39 4048
5460
71 74 74
92
115
2004 2005 2006 2007 2008 2009 2010 2011 2012 2013 2014 2015
(PKRbn)
Operating profit
10
1722 21
2631
3541 43
37
50
65
2004 2005 2006 2007 2008 2009 2010 2011 2012 2013 2014 2015
(PKRbn)
Profit after taxation
6
1013
10 1113
17
22 23 23
3135
2004 2005 2006 2007 2008 2009 2010 2011 2012 2013 2014 2015
(PKRbn)

Deposits remain the growth engine
9
Deposit composition
Cost of deposits
Growth in current deposits
26.0% 26.7% 26.2% 29.4% 34.2% 36.7%
45.6% 42.3% 40.8%43.9%
43.9% 45.8%
28.4% 31.0% 33.0% 26.7% 21.9% 17.5%
2010 2011 2012 2013 2014 2015
Fixed Deposits Savings Accounts Current Accounts
0.00%
1.00%
2.00%
3.00%
4.00%
5.00%
6.00%
1Q
10
2Q
10
3Q
10
4Q
10
1Q
11
2Q
11
3Q
11
4Q
11
1Q
12
2Q
12
3Q
12
4Q
12
1Q
13
2Q
13
3Q
13
4Q
13
1Q
14
2Q
14
3Q
14
4Q
14
1Q
15
2Q
15
3Q
15
4Q
15
Cost of Deposits -DomesticCost of Deposits -InternationalTotal Cost of Deposits
194249
317
411
522600
2010 2011 2012 2013 2014 2015
(PKRbn)
3.0%
2.6%
0.9%
Net interest margin(1)
0.0%
4.0%
8.0%
12.0%
4Q10 4Q11 4Q12 4Q13 4Q 14 4Q 15
Income yield
Cost of funds
Net interest margin
1Q10
(1) Income Yield = (Interest Income + Investment Income) / Net Earning Assets.Cost of Funds = Interest Expense / Total Liabilities.Net Interest Margin = Income Yield – Cost of Funds.
7.6%
4.4%
3.2%

27%
46%
40%
46%
HBL UBL MCB ABL
Up to three
months17.9%
Three months
to one year48.4%
One to five
years28.1%
More than five
years5.6%
Conservative investment portfolio
10
Increasing investments in PIBs
Split of investment by type
GoP securities have historically remained an attractive
investment due to their spread over the cost of deposits.
Since 2013, banks have been building their PIB portfolios
in anticipation of falling interest rates. This has helped to
alleviate the severe spread compression.
HBL has the lowest relative PIB holdings due to
conservative market risk limits.
Market
Treasury Bills49.9%
PIBs
33.5%
Other GoP
securities4.6%
Other debt
securities8.1%
Equity and other
investments2.7%
Split of government and other debt securities by maturity
Pakistan
Government
debt: 88%
Total:PKR1,245bn
Total:PKR1,245bn
PIBs vs Total deposits

NPL composition by industry segments
SOE3.5% Wholesale
& retail 11.5%
Textile 26.7%
Financial 1.6%
Power & energy 2.4%
Oil and Gas3.9%
Individual 4.9%
Agriculture 8.8%
Others36.7%
A diversified loan portfolio…
11
Loan portfolio composition by line of business
Data as at 31 December 2015
Loan portfolio composition by industry segments
SOE9.8%
Government7.0%
Wholesale & retail 4.1%
Textile 8.3%
Financial 8.2%
Power & energy 7.5%
Oil and Gas3.3%
Individual 8.1%
Agriculture 5.9%
Others37.8%
NPL composition by line of business
Net loans: PKR633bn
NPL: PKR76.8bn
Corporate47.8%
Retail7.6%
Commercial6.0%
Agriculture4.7%
Consumer4.7%
Others4.0%
International25.1%
Net loans: PKR633bn
Corporate46.0%
Retail11.1%
Commercial13.3%
Agriculture3.0%
Consumer1.3%
Others0.1%
International25.2%
NPL: PKR76.8bn
NPL ratio:
10.9%

Large and diversified international presence which is unique among regional peers
12
International footprint
HBL currently holds complete banking licenses in key regional locations including Sri Lanka, Afghanistan, Oman, UAE, Bahrain and Bangladesh
Well-positioned regional player to increase market share in:
− Remittances
− Trade finance
− Investment banking
First Pakistani bank to have applied for a banking license in China. Branch expected to be operational by end of 2016
Subsidiary
Related Entity
Branch
Head Office and Domestic Branch Network
Direct presence in 22 countries
Network of 65 branches(1)
Presence in key financial hubs; London, New York, Brussels, Singapore, Dubai and Hong Kong
Presence in 6 countries through associates and related entities
Comprehensive regional coverage
(1) Includes branches of HBL’s subsidiaries.
Kenya
Seychelles
Mauritius
SingaporeMaldives
Sri Lanka
Bangladesh
Nepal
Afghanistan
Kyrgyz Republic
United States
of America
United Kingdom
Hong Kong
Turkey
Oman
UAEBahrain
Lebanon
FranceBelgium
Netherlands
Switzerland
Tanzania
Uganda
Burundi
Strategic development area for the bank
ChinaIran
India
Representative office
India
China
Iran

Well positioned to serve a growing remittance market
13
Pakistani remittance market
International remittances form the mainstay of Pakistan’s Balance of Payments with double digit growth over the last several years
In the 7 months of FY16, overseas workers remitted more than US$11bn back to Pakistan, up 6% year-on-year
Of this amount, the leading source nations are Saudi Arabia (30%), UAE (22%), USA (14%) and UK (13%)
Given its strong international network, HBL is well placed to serve the home remittance market and as of Dec’15 had a 24.0% (Dec’14 22.5%) market share
Home remittances provide a plethora of opportunities for cross-selling (deposits, loans etc.). Banks are also incentivized by the SBP for remittances channeled through their counters.
HBL home remittance volumes (2004 – 2015), PKRbn
47 55 67 79 95129
159
227271
308
386
483
2004 2005 2006 2007 2008 2009 2010 2011 2012 2013 2014 2015

Strong investment in technology underpins commitment to the future
14
Investing in building house capability for development of customer facing solutions that are required to
meet fast changing customer requirements and evolving business models1
Continuous investment in strong relationship management with existing Global vendors2
Increasing investment in technologies to enable increased level of Digitization of processes and products3
Investment decisions in major technology solutions to be guided by the principle of “Appropriate”
technology at the right price instead of aiming for the “cutting” edge technology at a significant premium
which may not be relevant to the maturity level of our markets
4
I.T Governance structure being revamped to make it more responsive to the fast evolving needs and new
business models5
A very strong focus on building “Mobile” based solutions for various customer segments6

13 15
19 22
31
(0.1%)0.3%
0.1% 0.2%
(0.2%)
2011 2012 2013 2014 2015
Consumer NCL Ratio
(PKRbn)
9 10 12 15
18 2 4
5
6
16
4 3 2
3
3
2011 2012 2013 2014 2015
Income from Fx
Income / gain on investments
Fee, Commission, Brokerage & other income
Strategic initiatives to continue driving growth
15
Growth in Consumer Lending
Other growth vectors
Growth in Agricultural Financing
14.8 15.5
18.6
24.2
28.6
2011 2012 2013 2014 2015
(PKRbn)
Drive growth in agricultural / rural lending through unique sales force
of Agriculture Field Officers. Expand product range to cover entire
value chain.
Launch a unique product offering for women and women-owned
businesses, to improve their access to financial services
Enhance cross-sell of savings and investment products as fee driver:
- Bancassurance where we have market leadership with estimated
45% share
- Asset management – acquisition of PICIC AMC will double AUMs
Enter microfinance space through acquisition of First MicroFinance
Bank
Strengthen and fully leverage international network. Grow regional
presence by investing in local brands (DTB, KICB, Himalayan Bank)
Increasing fee and other non-interest income
(PKRbn)

Strong balance sheet with ample liquidity, high capitalization and conservative risk management
16
Strong deposit growth Liabilities composed mainly of sticky deposits
747 934
1,215 1,401 1,525
1,635
61.6% 48.9%
41.4% 40.3% 39.0% 38.7%
2010 2011 2012 2013 2014 2015
Total deposits Loans-to-deposits ratio
(PKRbn)
Current29.4%
Savings36.8%
Time14.1%
Other liabilities19.7%
Total liabilities:
PKR2,036bn
Conservative risk management practices
66 70 78 80 80 77
55 60
65 67 66 69
83.5% 85.1% 82.6% 83.5% 83.2% 90.1%
2010 2011 2012 2013 2014 2015
NPL Provisions held Coverage ratio
(PKRbn)
Robust capital base…
78 89
97 109
129 139
14.6% 15.6% 15.3% 15.4%
16.2% 17.0%
12.1% 13.2% 12.6%
11.3% 13.3% 13.1%
2010 2011 2012 2013 2014 2015
Tier 1 capital CAR Tier 1 ratio
(PKRbn)

27
34 36 36
48
60
17
22 23 23
31 35
2010 2011 2012 2013 2014 2015PBT NPAT
(PKRbn)
Delivering consistently strong profitability
17
Return on Equity(1)Cost to income ratio
20.7%
23.4%
20.6%18.2%
22.4% 22.8%
2010 2011 2012 2013 2014 2015
40.6% 41.3% 41.2%
48.6%44.8%
42.2%
2010 2011 2012 2013 2014 2015
Profit before tax (“PBT”) / Net profit after tax (“NPAT”)
(1) ROE is calculated excluding Surplus on Revaluation of assets.

Strong earnings and dividends
18
Strong set of earnings even with bonus shares issued
Growing dividend payments
14.1 18.3 18.4 17.2
21.6 23.9
7.3x 5.3x
6.4x
9.7x 10.0x 8.4x
2010 2011 2012 2013 2014 2015
EPS P/E
(PKR)
1) Based on share price as at 31 December of respective year ends and full year EPS
(1)
2 for 101 for 10 1 for 10 1 for 10 1 for 10
Bonus shares
6.0 6.5 7.0 7.5 8.0
12.0 14.0
54.1% 46.1% 38.3% 40.8% 46.6% 55.7% 58.5%
2009 2010 2011 2012 2013 2014 2015
DPS Dividend payout ratio
(PKR)
The Board will determine future dividend payments while
striking a balance between:
– ensuring that sufficient capital is available for HBL to
achieve its strategic objectives and
– providing shareholders with an attractive return on
investment
HBL’s net profit has grown at a CAGR of 11% from 2010 to
2015
The return on equity and return on assets for HBL were
22.8% and 1.7% respectively for 2015 vs 15.7% and 1.5%
respectively for the Pakistani banking sector

19
Appendix

Consolidated balance sheet
20
….....….….….. (PKR Mln) ..…...…....…..
2010 2011 2012 2013 2014 2015
Assets
Cash & Bank Balances 119,053 150,749 205,210 192,818 202,562 207,721
Lending to Financial Institutions 30,339 41,581 24,828 35,271 34,314 44,318
Investments 254,909 418,604 797,095 826,062 922,691 1,244,887
Advances 459,750 457,368 499,818 563,700 595,295 633,383
Others 60,649 71,253 83,523 97,419 109,756 88,114
Total Assets 924,700 1,139,555 1,610,474 1,715,270 1,864,618 2,218,423
Liabilities
Bills payable 9,775 13,895 18,943 19,422 21,990 28,082
Borrowings 40,460 39,474 196,588 107,864 103,411 314,319
Deposit and other accounts 747,375 933,632 1,214,964 1,401,230 1,524,645 1,634,944
Sub-ordinated loans 4,282 5,036 5,441 2,633 - 10,000
Other liabilities 26,557 37,931 41,809 41,687 44,977 48,458
Total liabilities 828,449 1,029,968 1,477,745 1,572,836 1,695,023 2,035,803
Shareholders' equity
Share capital 10,019 11,021 12,123 13,335 14,669 14,669
Reserves 76,823 89,126 106,594 117,299 132,265 143,684
Equity attributable to the bank 86,842 100,147 118,717 130,634 146,934 158,352
Non controlling interest 1,213 1,236 1,227 1,886 1,185 1,692
Surplus on revaluation of assets - net of deferred tax 8,196 8,204 12,785 9,914 21,476 22,576
Total equity 96,251 109,587 132,729 142,434 169,595 182,620

Consolidated statement of profit and loss
21
…....……….….. (PKR Mln) ..…...……..…..2010 2011 2012 2013 2014 2015
Mark-up/ return/ profit/ interest earned 81,325 98,580 116,773 120,605 137,416 144,232
Mark-up/ return/ profit/ interest expensed 34,330 42,182 59,012 65,207 68,833 66,064
Net mark-up/ profit/ interest income 46,995 56,398 57,761 55,398 68,583 78,169
Non mark-up/ interest income
Fee, commission, brokerage and other income 8,041 8,971 9,794 11,561 14,951 17,832
Income / gain on investments 1,380 2,021 3,566 4,846 5,627 16,002
Income from dealing in foreign currencies 3,189 3,756 2,568 2,299 2,847 2,749
Total non mark-up / interest income 12,611 14,748 15,928 18,706 23,425 36,584
Total income 59,606 71,146 73,689 74,103 92,008 114,753
Non mark-up/ interest expense
Administrative expenses 24,253 29,372 30,381 36,110 41,254 48,400
Other expenses 700 743 733 744 973 1,312
Total non mark-up / interest expenses 24,953 30,114 31,114 36,854 42,227 49,713
Profit before tax and provisions 34,653 41,032 42,575 37,249 49,781 65,040
Net provisions 7,613 6,711 7,013 1,115 1,531 4,754
Profit before tax 27,040 34,321 35,562 36,134 48,250 60,286
Taxation 10,006 11,988 12,770 13,106 16,768 25,185
Profit after tax 17,034 22,333 22,792 23,027 31,483 35,102

Net Advances (By Line of Business)
22
PKR Mln
Group 31-Dec-14 % 31-Dec-15 %
Corporate 299,244 50% 302,539 48%
Retail (excluding Agriculture) 44,406 7% 48,334 8%
Commercial 32,003 5% 38,247 6%
Agriculture 25,190 4% 29,929 5%
Consumer 21,742 4% 30,026 5%
Others (Islamic&FI) 13,510 2% 25,344 4%
Domestic 436,095 73% 474,418 75%
International banking 159,200 27% 158,965 25%
Bank 595,295 100% 633,383 100%
US$ Mln
International banking 31-Dec-14 % 31-Dec-15 %
Gulf 795 50% 890 59%
South Asia 112 7% 116 8%
UK / Europe 375 24% 275 18%
Others 302 19% 237 16%
International banking 1,584 100% 1,518 100%


![Participation in Investor Conference and presentation on financial results for H1 FY16 [Company Update]](https://img.dokumen.tips/doc/110x75/577ca6f51a28abea748c2008/participation-in-investor-conference-and-presentation-on-financial-results.jpg)


![Investor and Analyst Q1 FY16 - Conference Call [Company Update]](https://img.dokumen.tips/doc/110x75/577cb29f1a28aba7118c1c65/investor-and-analyst-q1-fy16-conference-call-company-update.jpg)

![Investor Road Show & Edelweiss Securities Ltd. Conference [Company Update]](https://img.dokumen.tips/doc/110x75/577c98671a28ab163a8b5e41/investor-road-show-edelweiss-securities-ltd-conference-company-update.jpg)
![Presentation for Investor Conference [Company Update]](https://img.dokumen.tips/doc/110x75/577c7c7b1a28abe0549ac786/presentation-for-investor-conference-company-update.jpg)


![Schedule of Investor Conference call & Presentation [Company Update]](https://img.dokumen.tips/doc/110x75/577c87841a28abe054c48277/schedule-of-investor-conference-call-presentation-company-update.jpg)
![Investor and Analyst Q2 FY16 - Conference Call [Company Update]](https://img.dokumen.tips/doc/110x75/577ca7411a28abea748c4ee2/investor-and-analyst-q2-fy16-conference-call-company-update.jpg)


![Transcript Analyst / Investor Conference Call [Company Update]](https://img.dokumen.tips/doc/110x75/577c7af71a28abe05496b6ec/transcript-analyst-investor-conference-call-company-update.jpg)


