Embed Size (px)
Citation preview

The Absolute Basics

What is Being Valued?
Enterprise value – is the value of the firm to all providers of capital.. Equity, debt and other.
Equity value – is the value of the firm to the providers of equity capital only, i.e. Shares.

Valuation Approach – the ChoicesCashflow Valuation
DCF EVA
Multiples Enterprise Equity Operational
Asset based – break up scenariosOptimal Deprival Value – market power Capitalisation Rate – real estate assets

Presentation LogicDeals with:
Cost of capital – common to all methodsCapital structure – common to all
methods
Cashflow model
Multiple model

Capital Structure IGenerally the capital structure consists of:
1.Equity – representing business and asset risk
2.Debt – representing financial risk

Capital Structure II
Debt is lower cost than equity, but
Using more debt adds financial risk, and
Thus – increases the cost of equity
Debt may have tax advantages.
Cost of Capital IValue is destroyed unless projects and
companies meet or beat their cost of capital:
1. Cost of capital is an opportunity cost – the sacrifice to investing in the company
2. Cost of capital represents the risks in investing in the company

Cost of Capital IIValue is destroyed unless projects and
companies meet or beat their cost of capital:
1. All providers face their own cost of capital – debt, equity, or a mixture
2. The company faces a mix or blend called weighted average cost of capital.

All Roads Lead to Cost of CapitalDespite apparent differences, all valuation
methods:
1.Can and are related to a cost of capital – DCF, EVA, Cap rate, ODV, asset value
2.Including multiples, can be directly linked to cost of capital through the reciprocal relationship
3.Express cost of capital components in one way or another

The Cost of Debt CapitalThe market cost of raising the marginal
tranche of debt capital (the next increment)...
1.The riskfree rate (as proxied by [say] well traded government debt in country of cashflow origin)
Plus
2.A debt premium reflecting industry and company business risk
As determined by rating or market data.

Riskfree rate of interest – such as the interest paid on government bondsPLUSA premium for taking risk....

The Cost of Equity CapitalThe market cost of raising the marginal
tranche of equity capital (the next increment)...
1.The riskfree rate (as proxied by [say] well traded government debt in country of cashflow origin)
Plus
2.The premium for investing in equities (ERP equity risk premium) of 4.0% – 7.0%
Times Equity Beta (the index of company risk)

The Riskfree rate PLUS a premium for equity market riskadjusted by BETA... The company risk index

Two Betas – Equity and Asset
Equity beta = asset beta / (1 – debt % ) Only equity beta can be measured in the
market
Asset beta = equity beta * (1 – debt % ) Asset beta must be derived from equity
beta

Example The equity beta for the tele communications industry often sits at around 0.80.
The Debt to total capital ratio for the tele communication industry often sits at around 50%
So:
Equity beta = 0.80
Asset beta = 0.80 * ( 1 - .50)
= 0.40

Estimating BetaBuilding an equity beta:
Establish the equity beta for an industry Find asset beta given industry capital
structure Use company capital structure to find
company equity beta
Draw data from Bloomberg, Reuters, Valueline or similar

ExampleIndustry equity beta is 0.80
Industry Debt to capital is 50%
My company Debt to total capital is 65%
Asset beta is:0.80 * (1 - .50) = 0.40)
My equity beta is:0.40 / (1-.65) = 1.14

Summarising....Cost of debt = risk free + debt risk premiumCost of equity = risk free + (equity beta * ERP)
In the capital structure of debt and equity:
Equity is valued at the cost of equity Debt is valued at the cost of debt
Last twist:
Debt is adjusted for tax deductibility... Multiply it by (1 – Tc).... The corporate tax rate.

Last twist: tax and cost of debtDebt cost is adjusted for tax deductibility... Multiply it by (1 – Tc).... The corporate tax rate.
So:Corporate tax rate = 30%Cost of debt = 8.5%
Tax adjusted cost of debt = 0.08 * (1 – 0.3) = 5.6%

Blend Equity and Debt Costs to calculate WACC
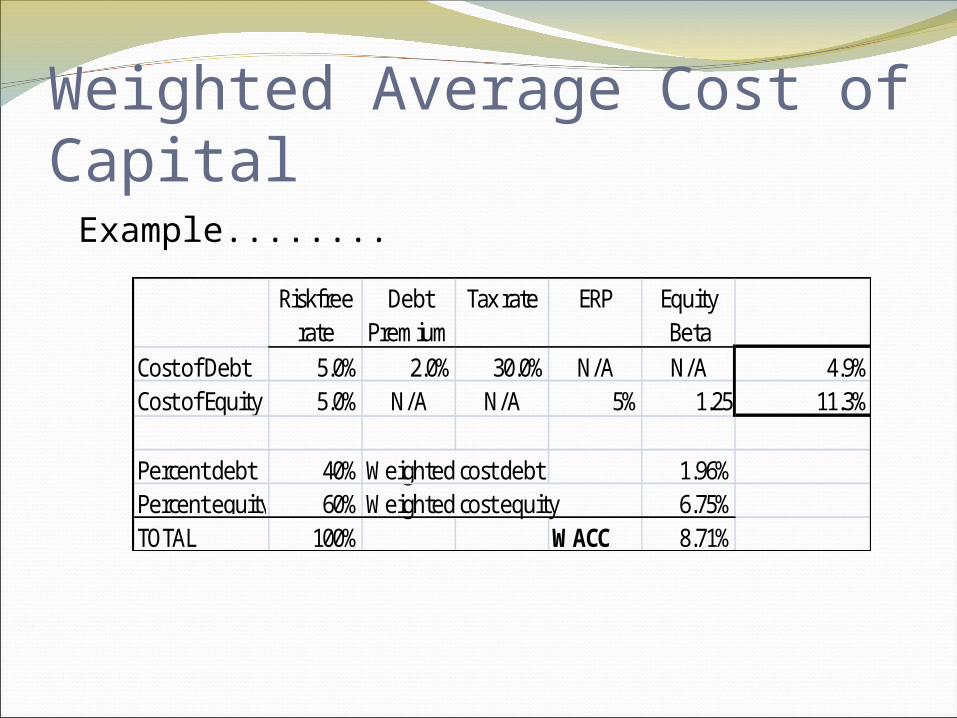
Weighted Average Cost of Capital Example........
Riskfree rate
Debt Premium
Tax rate ERP Equity Beta
Cost of Debt 5.0% 2.0% 30.0% N/A N/A 4.9%Cost of Equity 5.0% N/A N/A 5% 1.25 11.3%
Percent debt 40% Weighted cost debt 1.96%Percent equity 60% Weighted cost equity 6.75%TOTAL 100% WACC 8.71%

The Cashflow Valuation EquationValue of near term cashflowsPlusTerminal value
Discounted to Present value at:
1.The WACC for the value of the enterprise2.The cost of equity for the value of equity
Cashflow to the enterprise is....Earnings before interest and taxes (EBIT) Minus Cash taxes on EBIT Minus Investments Plus Depreciation Plus (minus) Change in Working
capital equals
Free Cash Flow…. Available to ALL INVESTORS

Estimating Terminal Value I
1. Estimate a constant growth rate ( g ) from last year of the near term flows out to “infinity”
2. Multiply the estimated cashflow of the last year of the near forecast period by 1 + g

Estimating Terminal Value II
3. Divide this value by cost of capital minus g to get terminal value
4. Discount TV back to the present using cost of capital.

Enterprise and Equity ValueEnterprise value = near term plus terminalEquity value = enterprise value less
debt
Test: Cashflow sensitivities Cost of capital sensitivities Terminal value sensitivities (growth rate)

Why test? Growth 5%Cost of capital 12%
Near term 150$ 175$ 190$ Terminal 2,850$
PV near term 409$ PV terminal 1,811$
Value 2,220$
Growth 3%Cost of capital 12%
Near term 150$ 175$ 190$ Terminal 2,174$
PV near term 409$ PV terminal 1,382$
Value 1,791$

The Valuation Multiple EquationBased on comparative analysis. Popular in
media:
Comparisons drawn from: Market observations Transaction observations Fundamental data
All adjusted to “normalise” data and allow as analysis of “like with like” to greatest extent possible or feasible.
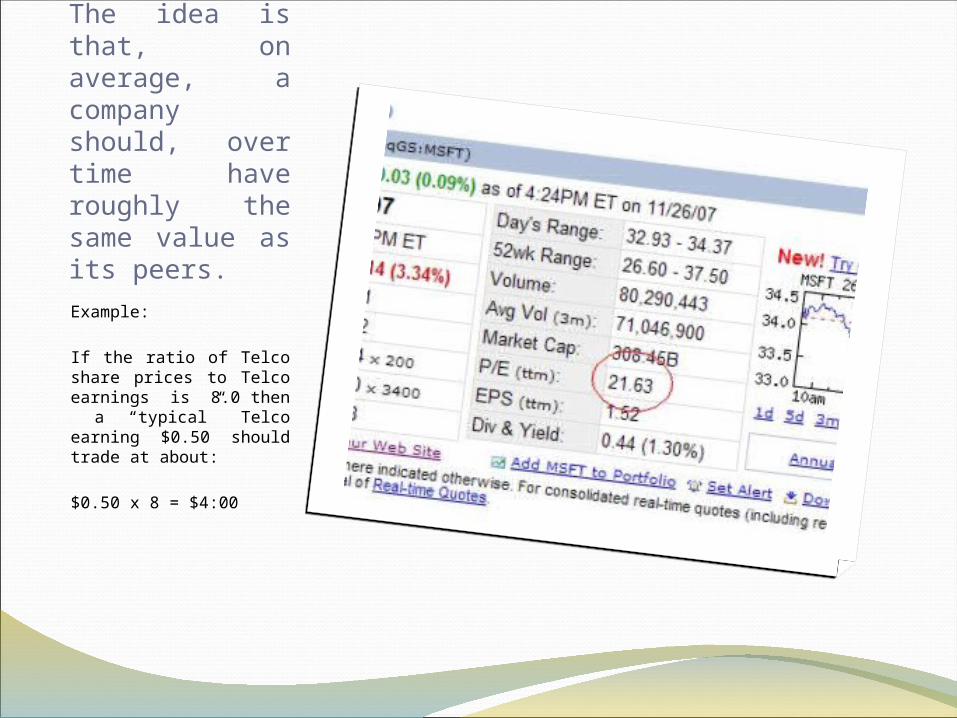
The idea is that, on average, a company should, over time have roughly the same value as its peers.Example:
If the ratio of Telco share prices to Telco earnings is 8.0 then a “typical” Telco earning $0.50 should trade at about:
$0.50 x 8 = $4:00

Multiple Valuation - ProcessProcess to calculate:
Identify an appropriate variable Find the necessary inputs for the calculation Normalise - adjust the numbers to remove
extraordinary or one off effects Compute ratio – numerous formulae available Apply multiple to company being valued
Check against another method

Enterprise MultiplesEstimate value of the enterprise to all capital
providers:
EBITDA – most “cash like”, skirts accounting issues, captures operating costs, only deals with tax indirectly.
Revenue – useful with negative or zero earnings, skirts accounting treatment, difficult to “launder”.

Equity MultiplesEstimate value of the enterprise to equity
capital providers: P|EBIT – avoids tax and capital structure
differences, pre tax relationship to other methods.
P|E – very popular, oft quoted, simple to understand, difficult to compare because of tax and capital structure differences.
A helpful relationship: 1 / P|EBIT = (pre tax) ROIC

Operating MultiplesMany industries have unique operating
multiples which can be used comparatively:
Media P | number of subscribers Energy P | KWh production capacity Accommodation P | number of room Tourism P | visitor nights / spend Agriculture P | output per stock unit Telecom P | fixed / mobile subscribers
Identical process to other cases. Identical weaknesses.

Multiples - CharacteristicsAdvantages
Simple and resource light Easy to communicate Commonly used
Disadvantages Single variable focus simplistic Assume “straight line” trend Subjective in normalising and comparing

Conclusions Valuation is...
A blend of art and science but a disciplined and systematic blend.
Thoroughly dependent on all of the explicit and implicit assumptions made.
An estimation process whose outer limits ought to be tested for revision purposes.
Likely to perform best when it reflects “fit for purpose” decisions in design.