Embed Size (px)
Citation preview
NUREG/CR–6891 ANL–04/20
Crack Growth Rates of Irradiated Austenitic Stainless Steel Weld Heat Affected Zone in BWR Environments
Manuscript Completed: August 2004 Date Published: March 2005
Prepared by O. K. Chopra, B. Alexandreanu, E. E. Gruber, R. S. Daum, and W. J. Shack
Argonne National Laboratory 9700 South Cass Avenue Argonne, IL 60439
W. H. Cullen, Jr., NRC Project Manager
Prepared for Division of Engineering Technology Office of Nuclear Regulatory Research U.S. Nuclear Regulatory Commission Washington, DC 20555–0001 NRC Job Code Y6388

ii
iii
Abstract
Austenitic stainless steels (SSs) are used extensively as structural alloys in the internal components of reactor pressure vessels because of their superior fracture toughness. However, exposure to high levels of neutron irradiation for extended periods can exacerbate the corrosion fatigue and stress corrosion cracking (SCC) behavior of these steels by affecting the material microchemistry, material microstructure, and water chemistry. Experimental data are presented on crack growth rates of the heat affected zone (HAZ) in Types 304L and 304 SS weld specimens before and after they were irradiated to a fluence of 5.0 x 10²⁰ n/cm2 (E > 1 MeV) (≈0.75 dpa) at ≈288°C. Crack growth tests were conducted under cycling loading and long hold time trapezoidal loading in simulated boiling water reactor environments on Type 304L SS HAZ of the H5 weld from the Grand Gulf reactor core shroud and on Type 304 SS HAZ of a laboratory–prepared weld. The effects of material composition, irradiation, and water chemistry on growth rates are discussed.

iv
v
Contents
Abstract........................................................................................................................................................ iii
Executive Summary.................................................................................................................................... xi
Foreword ..................................................................................................................................................... xiii
Acknowledgments ...................................................................................................................................... xv
1. Introduction ......................................................................................................................................... 1
2. Experimental........................................................................................................................................ 3
2.1 Alloys and Specimen Preparation.......................................................................................... 3
2.2 Test Facility............................................................................................................................. 9
2.3 Crack Growth Test Procedure................................................................................................ 10
2.2.1 Procedure................................................................................................................ 11
2.2.2 SEM Examination of Fracture Surfaces ............................................................... 13
2.2.3 Data Qualification.................................................................................................. 14
3. Results and Discussion ....................................................................................................................... 15
3.1 Crack Growth Tests on Nonirradiated Stainless Steel Weld HAZ Specimens................... 15
3.1.1 Specimen GG5B–A of the HAZ from Grand Gulf Core Shroud H5 SA Weld, Test CGR-10 ........................................................................................... 15
3.1.2 Specimen 85–3A–TT of the HAZ from Laboratory–Prepared SMA Weld, Test CGR-11 ...................................................................................................... 18
3.1.3 Specimen GG3B–A–TT of the HAZ from Grand Gulf Core Shroud H5 SA Weld, Test CGR-14..................................................................................... 25
3.1.4 Specimen 85–YA of the HAZ from Laboratory–Prepared SMA Weld, Test CGR-22 ...................................................................................................... 28
3.2 Crack Growth Tests on Irradiated Stainless Steels in BWR Environments........................ 32
3.2.1 Specimen GG5T–A of Type 304L SS HAZ Irradiated to 5.0 x 10²⁰ n/cm2...... 32
3.2.2 Specimen GG5T–B of Type 304L SS HAZ Irradiated to 5.0 x 10²⁰ n/cm2 ...... 34
3.2.3 Specimen 85–1A–TT of Type 304 SS HAZ Irradiated to 5.0 x 10²⁰ n/cm2 ..... 36
3.2.4 Specimen 85–7A of Type 304 SS HAZ Irradiated to 5.0 x 10²⁰ n/cm2............. 43
3.2.5 CGRs of Austenitic SS Weld HAZ under Continuous Cycling ......................... 45
vi
3.2.6 CGRs of Austenitic SS Weld HAZ under Constant Load or Cycling with Long Hold Periods............................................................................................. 47
3.2.7 Fracture Toughness of Irradiated Austenitic SS Weld HAZ in High-Purity Water at 288°C .................................................................................................. 48
4. Summary.............................................................................................................................................. 49
References ................................................................................................................................................... 51
vii
Figures
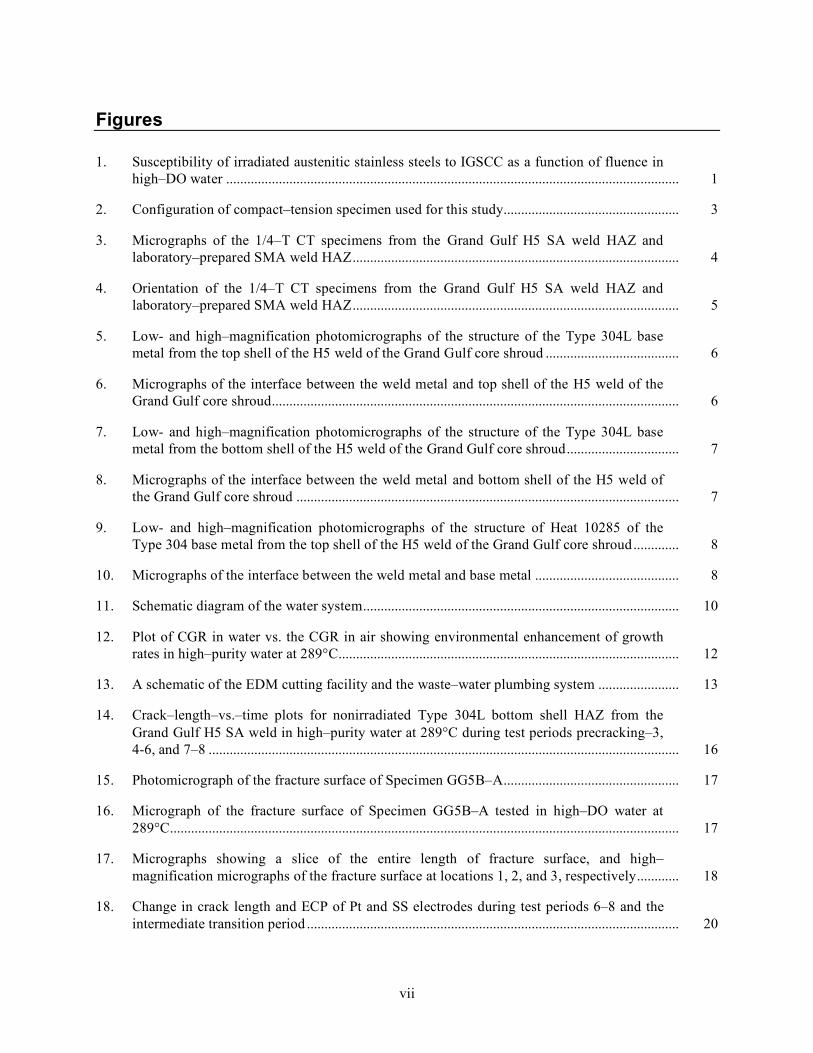
1. Susceptibility of irradiated austenitic stainless steels to IGSCC as a function of fluence in high–DO water ................................................................................................................................. 1
2. Configuration of compact–tension specimen used for this study.................................................. 3
3. Micrographs of the 1/4–T CT specimens from the Grand Gulf H5 SA weld HAZ and laboratory–prepared SMA weld HAZ............................................................................................. 4
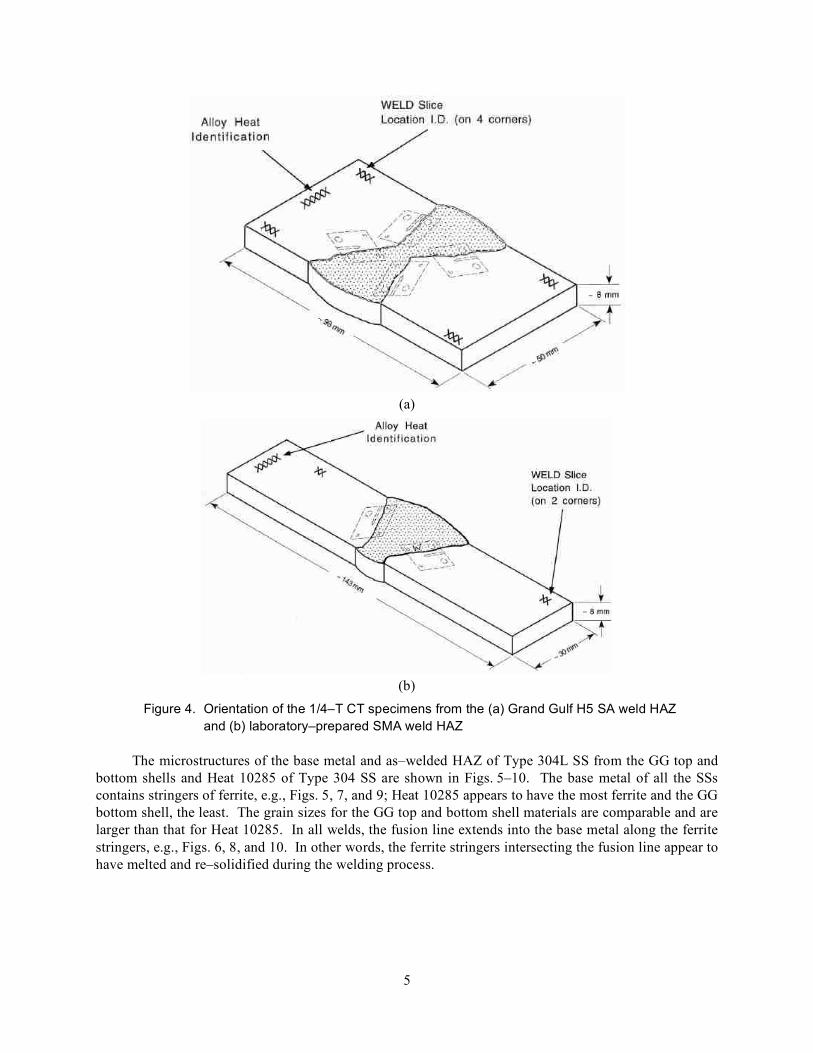
4. Orientation of the 1/4–T CT specimens from the Grand Gulf H5 SA weld HAZ and laboratory–prepared SMA weld HAZ............................................................................................. 5
5. Low- and high–magnification photomicrographs of the structure of the Type 304L base metal from the top shell of the H5 weld of the Grand Gulf core shroud ...................................... 6
6. Micrographs of the interface between the weld metal and top shell of the H5 weld of the Grand Gulf core shroud.................................................................................................................... 6
7. Low- and high–magnification photomicrographs of the structure of the Type 304L base metal from the bottom shell of the H5 weld of the Grand Gulf core shroud................................ 7
8. Micrographs of the interface between the weld metal and bottom shell of the H5 weld of the Grand Gulf core shroud ............................................................................................................. 7
9. Low- and high–magnification photomicrographs of the structure of Heat 10285 of the Type 304 base metal from the top shell of the H5 weld of the Grand Gulf core shroud............. 8
10. Micrographs of the interface between the weld metal and base metal ......................................... 8
11. Schematic diagram of the water system.......................................................................................... 10
12. Plot of CGR in water vs. the CGR in air showing environmental enhancement of growth rates in high–purity water at 289°C................................................................................................. 12
13. A schematic of the EDM cutting facility and the waste–water plumbing system ....................... 13
14. Crack–length–vs.–time plots for nonirradiated Type 304L bottom shell HAZ from the Grand Gulf H5 SA weld in high–purity water at 289°C during test periods precracking–3, 4-6, and 7–8 ...................................................................................................................................... 16
15. Photomicrograph of the fracture surface of Specimen GG5B–A.................................................. 17
16. Micrograph of the fracture surface of Specimen GG5B–A tested in high–DO water at 289°C................................................................................................................................................. 17
17. Micrographs showing a slice of the entire length of fracture surface, and high–magnification micrographs of the fracture surface at locations 1, 2, and 3, respectively............ 18
18. Change in crack length and ECP of Pt and SS electrodes during test periods 6–8 and the intermediate transition period .......................................................................................................... 20
viii
19. Photomicrographs of the fracture surfaces of the two halves of Specimen 85–3A-TT............... 20
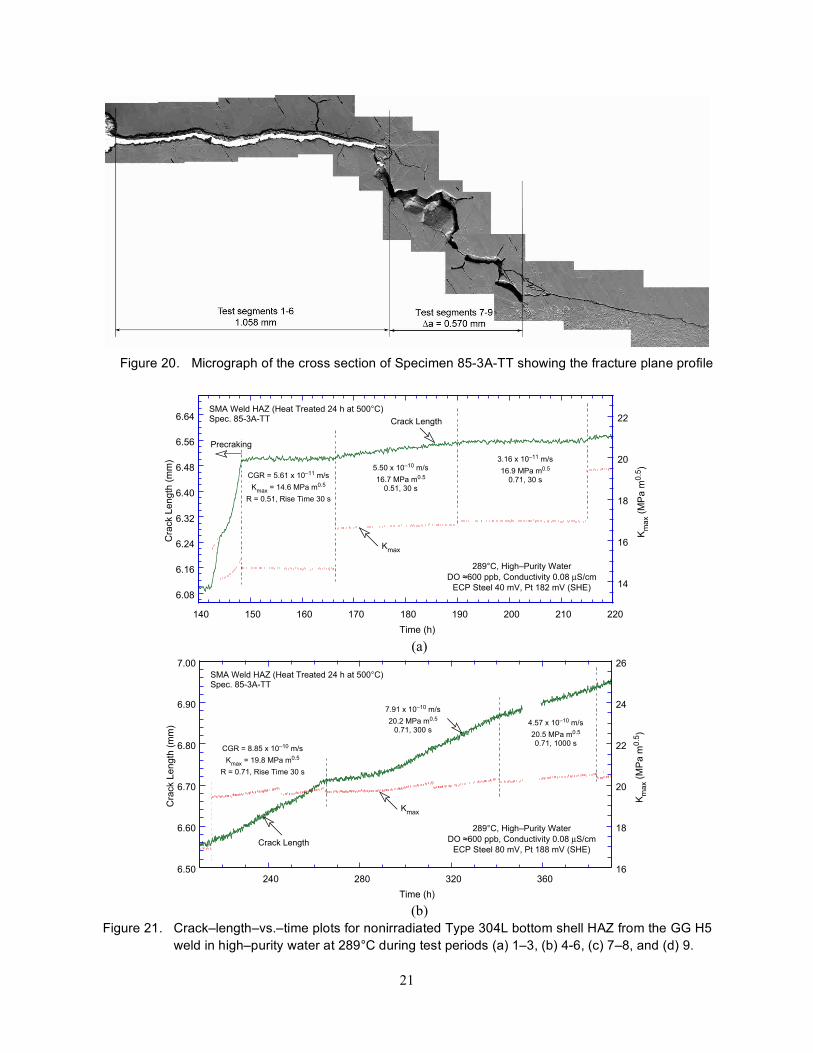
20. Micrograph of the cross section of Specimen 85-3A-TT showing the fracture plane profile..... 21
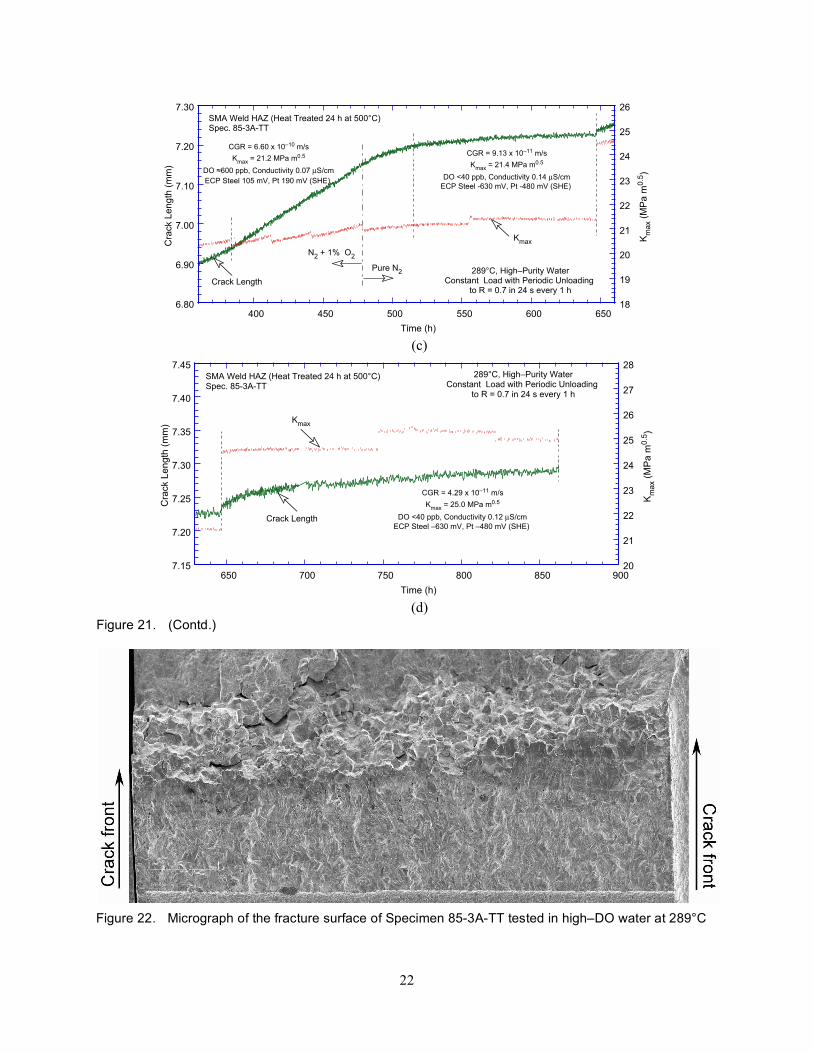
21. Crack–length–vs.–time plots for nonirradiated Type 304L bottom shell HAZ from the Grand Gulf H5 SA weld in high–purity water at 289°C during test periods 1–3, 4-6, 7–8, and 9 .................................................................................................................................................. 21
22. Micrograph of the fracture surface of Specimen 85-3A-TT tested in high–DO water at 289°C................................................................................................................................................. 22
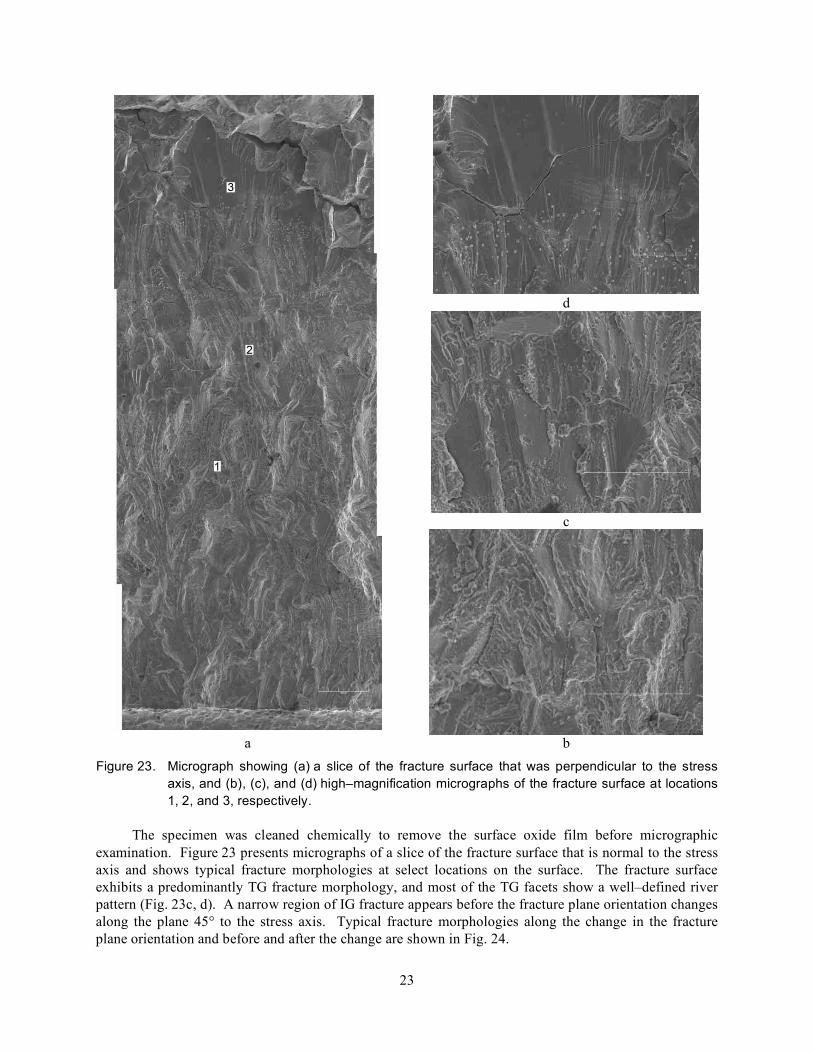
23. Micrograph showing a slice of the fracture surface that was perpendicular to the stress axis, and high–magnification micrographs of the fracture surface at locations 1, 2, and 3, respectively ....................................................................................................................................... 23
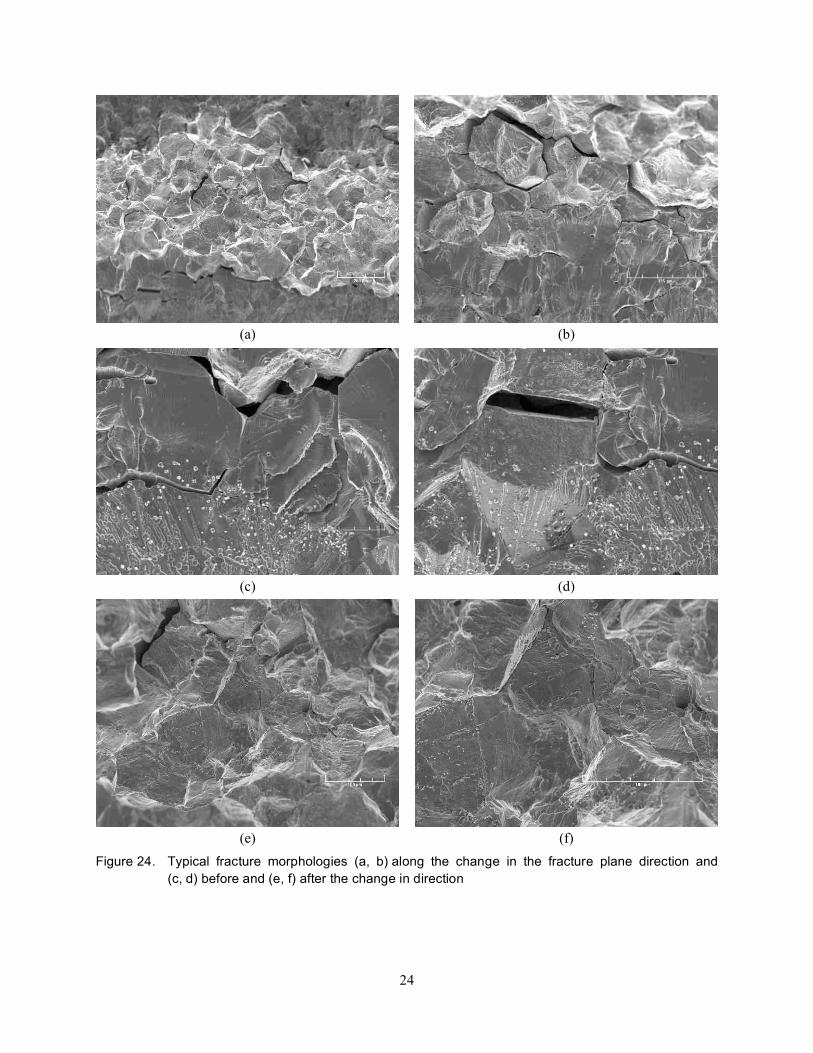
24. Typical fracture morphologies along the change in the fracture plane direction and before and after the change in direction ..................................................................................................... 24
25. Micrograph of the cross section of Specimen GG3B-A-TT showing the fracture plane profile ................................................................................................................................................ 26
26. Micrograph of the fracture surface of Specimen GG3B-A-TT tested in high–DO water at 289°C................................................................................................................................................. 26
27. Crack–length–vs.–time plots for nonirradiated thermally–treated Type 304L bottom shell HAZ from the Grand Gulf H5 SA weld in high–purity water at 289°C during test periods precracking, 1-5a, and 5b–7............................................................................................................. 27
28. Micrographs showing a slice of the entire length of the fracture surface, and high magnification micrographs of the fracture surface at locations 1, 2, and 3, respectively ....................................................................................................................................... 28
29. Micrograph of the fracture surface of Specimen 85–YA tested in BWR environment at 289°C................................................................................................................................................. 29
30. Crack–length–vs.–time plots for nonirradiated as–welded Type 304 SMA weld HAZ in high–purity water at 289°C during test periods up to 2, 3–5, and 6.............................................. 30
31. Micrograph showing a slice of the entire length of the fracture surface and high–magnification micrographs of the fracture surface at locations A, B, and C, respectively. ........ 31
32. Crack–length–vs.–time plots for irradiated Grand Gulf H5 weld HAZ in high–purity water at 289°C during test periods precracking–3, 4–6, and 7–8............................................................ 33
33. Crack–length–vs.–time plots for irradiated Grand Gulf H5 weld HAZ Specimen GG5T–B in high–purity water at 289°C during test periods precracking–3, 4–7, and 8–10....................... 34
34. Change in crack length and ECP of Pt and SS electrodes when the DO level in feedwater was decreased from ≈350 to <30 ppb ............................................................................................. 35
35. Photomicrograph of the fracture surface of Specimen GG5T–B .................................................. 36

ix
36. Change in crack length and ECP of Pt and SS electrodes when the DO level in feedwater was decreased from ≈250 to <30 ppb ............................................................................................. 37
37. Photomicrograph of the fracture surface of Specimen 85-1A TT................................................. 38
38. Micrograph of the fracture surface of Specimen 85-1A-TT tested in BWR environments ........ 38
39. Crack–length–vs.–time plots for irradiated SMA weld HAZ Specimen 85-1A-TT in high-purity water at 289°C during test periods 1–2, 3–5, and 6–7 ........................................................ 39
40. Micrographs showing the fracture surface of 85-1A-TT at positions A and B in Fig. 38........... 40
41. Micrographs showing the fracture surface of 85-1A-TT at position C in Fig. 38 ....................... 40
42. Micrographs showing the fracture surface of 85-1A-TT at positions D and E in Fig. 38 .......... 41
43. Photomicrographs showing a slice of the entire length of the fracture surface and high–magnification photomicrographs of the fracture surface at positions A, B, C and D, respectively ....................................................................................................................................... 42
44. Load vs. load-line displacement curve for irradiated SMA weld HAZ Specimen 85-1A-TT in high-purity water at 289°C .......................................................................................................... 43
45. Fracture toughness J–R curve for irradiated SMA weld HAZ Specimen 85-1A-TT in high-purity water at 289°C ....................................................................................................................... 43
46. Crack–length–vs.–time plots for irradiated SMA weld HAZ Specimen 85-7A in high-purity water at 289°C during test periods 1–3, 4–5, and 6–8 ........................................................ 44
47. Photomicrograph of the fracture surface of Specimen 85-7A....................................................... 45
48. CGR data for irradiated and nonirradiated specimens of laboratory–prepared Type 304 SS SMA weld HAZ and Type 304L SA weld HAZ from the Grand Gulf core shroud under continuous cycling at 289°C in high–purity water with 300–500 ppb dissolved oxygen ........... 46
49. CGR data under constant load with periodic partial unloads for nonirradiated and irradiated SS weld HAZ specimens in high–purity water at 289°C.............................................. 47
50. Plot of fracture toughness JIc as a function of neutron exposure at 288°C for austenitic SSs in air and SS SMA weld HAZ in high–purity water............................................................... 48
x
Tables
1. Composition of Type 304 stainless steels investigated.................................................................. 3
2. Tensile properties of the austenitic stainless steels irradiated in the Halden reactor ................... 4
3. Crack growth results for Specimen GG5B–A of Type 304L HAZ in high–purity water at 289°C................................................................................................................................................. 15
4. Crack growth results for Specimen 85–3A–TT of nonirradiated Type 304 SS SMA weld HAZ in high–purity water at 289°C................................................................................................ 19
5. Crack growth results for Specimen GG3B–A–TT of Type 304L HAZ in high–purity water at 289° ............................................................................................................................................... 25
6. Crack growth results for Specimen 85–YA of nonirradiated Type 304 SS SMA weld HAZ in high–purity water at 289°C ......................................................................................................... 29
7. Crack growth results for Specimen GG5T–A of Type 304L HAZ in high–purity water at 289°C................................................................................................................................................. 32
8. Crack growth results for Specimen GG5T–B of Type 304L HAZ in high–purity water at 289°C................................................................................................................................................. 34
9. Crack growth results for Specimen 85–1A–TT of Type 304 SS SMA weld HAZ in high–purity water at 289°C ....................................................................................................................... 37
10. Crack growth data for specimen 85–7A of SS SMA Weld HAZ in high–purity water at 289°C................................................................................................................................................. 44
xi
Executive Summary
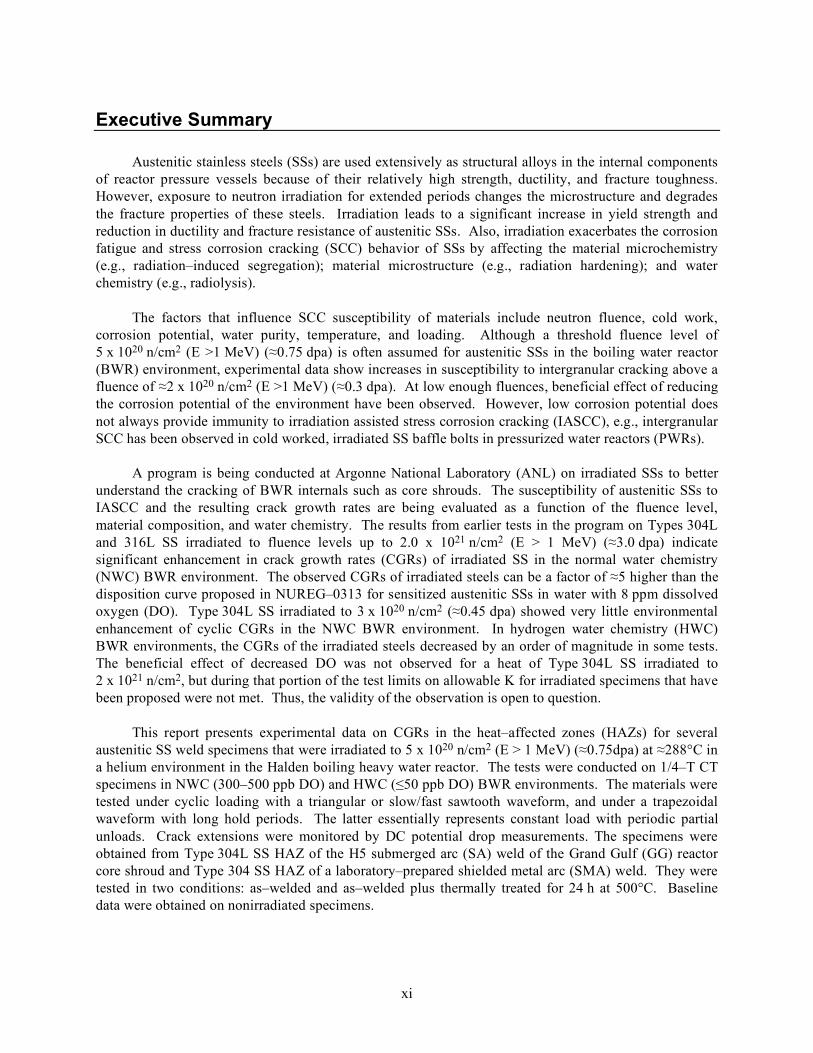
Austenitic stainless steels (SSs) are used extensively as structural alloys in the internal components of reactor pressure vessels because of their relatively high strength, ductility, and fracture toughness. However, exposure to neutron irradiation for extended periods changes the microstructure and degrades the fracture properties of these steels. Irradiation leads to a significant increase in yield strength and reduction in ductility and fracture resistance of austenitic SSs. Also, irradiation exacerbates the corrosion fatigue and stress corrosion cracking (SCC) behavior of SSs by affecting the material microchemistry (e.g., radiation–induced segregation); material microstructure (e.g., radiation hardening); and water chemistry (e.g., radiolysis).
The factors that influence SCC susceptibility of materials include neutron fluence, cold work, corrosion potential, water purity, temperature, and loading. Although a threshold fluence level of 5 x 10²⁰ n/cm2 (E >1 MeV) (≈0.75 dpa) is often assumed for austenitic SSs in the boiling water reactor (BWR) environment, experimental data show increases in susceptibility to intergranular cracking above a fluence of ≈2 x 10²⁰ n/cm2 (E >1 MeV) (≈0.3 dpa). At low enough fluences, beneficial effect of reducing the corrosion potential of the environment have been observed. However, low corrosion potential does not always provide immunity to irradiation assisted stress corrosion cracking (IASCC), e.g., intergranular SCC has been observed in cold worked, irradiated SS baffle bolts in pressurized water reactors (PWRs).
A program is being conducted at Argonne National Laboratory (ANL) on irradiated SSs to better understand the cracking of BWR internals such as core shrouds. The susceptibility of austenitic SSs to IASCC and the resulting crack growth rates are being evaluated as a function of the fluence level, material composition, and water chemistry. The results from earlier tests in the program on Types 304L and 316L SS irradiated to fluence levels up to 2.0 x 10²¹ n/cm2 (E > 1 MeV) (≈3.0 dpa) indicate significant enhancement in crack growth rates (CGRs) of irradiated SS in the normal water chemistry (NWC) BWR environment. The observed CGRs of irradiated steels can be a factor of ≈5 higher than the disposition curve proposed in NUREG–0313 for sensitized austenitic SSs in water with 8 ppm dissolved oxygen (DO). Type 304L SS irradiated to 3 x 10²⁰ n/cm2 (≈0.45 dpa) showed very little environmental enhancement of cyclic CGRs in the NWC BWR environment. In hydrogen water chemistry (HWC) BWR environments, the CGRs of the irradiated steels decreased by an order of magnitude in some tests. The beneficial effect of decreased DO was not observed for a heat of Type 304L SS irradiated to 2 x 10²¹ n/cm2, but during that portion of the test limits on allowable K for irradiated specimens that have been proposed were not met. Thus, the validity of the observation is open to question.
This report presents experimental data on CGRs in the heat–affected zones (HAZs) for several austenitic SS weld specimens that were irradiated to 5 x 10²⁰ n/cm2 (E > 1 MeV) (≈0.75dpa) at ≈288°C in a helium environment in the Halden boiling heavy water reactor. The tests were conducted on 1/4–T CT specimens in NWC (300–500 ppb DO) and HWC (≤50 ppb DO) BWR environments. The materials were tested under cyclic loading with a triangular or slow/fast sawtooth waveform, and under a trapezoidal waveform with long hold periods. The latter essentially represents constant load with periodic partial unloads. Crack extensions were monitored by DC potential drop measurements. The specimens were obtained from Type 304L SS HAZ of the H5 submerged arc (SA) weld of the Grand Gulf (GG) reactor core shroud and Type 304 SS HAZ of a laboratory–prepared shielded metal arc (SMA) weld. They were tested in two conditions: as–welded and as–welded plus thermally treated for 24 h at 500°C. Baseline data were obtained on nonirradiated specimens.
xii
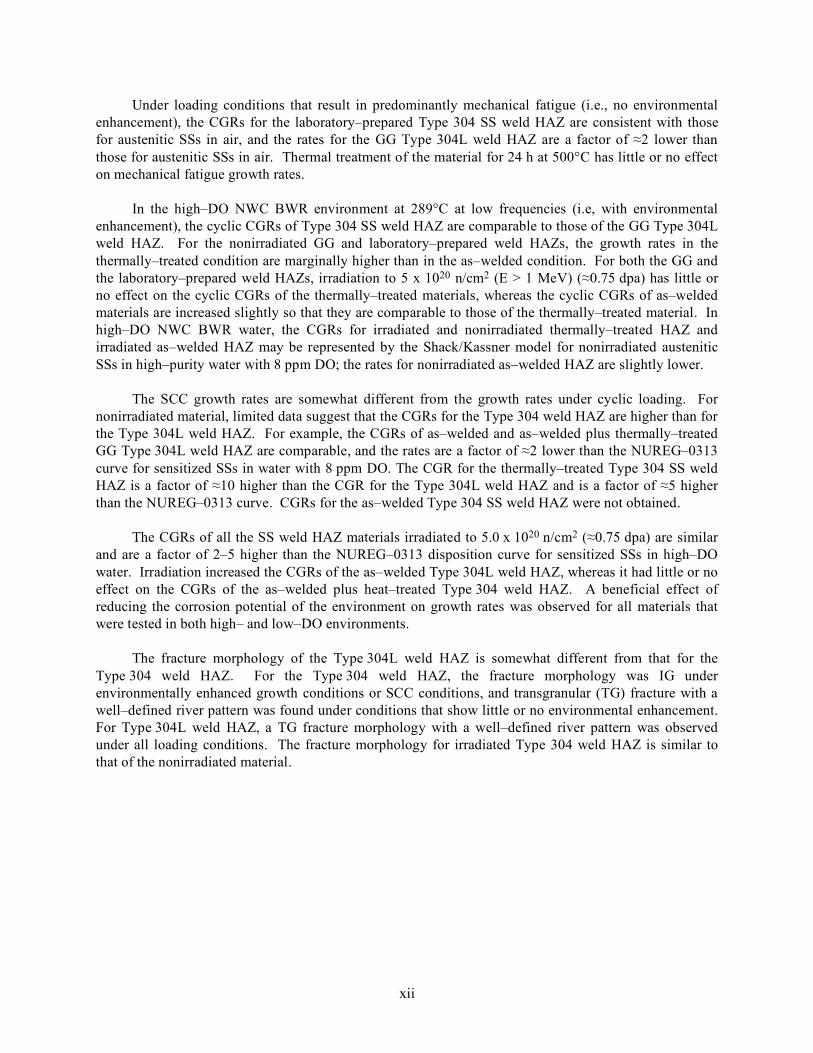
Under loading conditions that result in predominantly mechanical fatigue (i.e., no environmental enhancement), the CGRs for the laboratory–prepared Type 304 SS weld HAZ are consistent with those for austenitic SSs in air, and the rates for the GG Type 304L weld HAZ are a factor of ≈2 lower than those for austenitic SSs in air. Thermal treatment of the material for 24 h at 500°C has little or no effect on mechanical fatigue growth rates.
In the high–DO NWC BWR environment at 289°C at low frequencies (i.e, with environmental enhancement), the cyclic CGRs of Type 304 SS weld HAZ are comparable to those of the GG Type 304L weld HAZ. For the nonirradiated GG and laboratory–prepared weld HAZs, the growth rates in the thermally–treated condition are marginally higher than in the as–welded condition. For both the GG and the laboratory–prepared weld HAZs, irradiation to 5 x 10²⁰ n/cm2 (E > 1 MeV) (≈0.75 dpa) has little or no effect on the cyclic CGRs of the thermally–treated materials, whereas the cyclic CGRs of as–welded materials are increased slightly so that they are comparable to those of the thermally–treated material. In high–DO NWC BWR water, the CGRs for irradiated and nonirradiated thermally–treated HAZ and irradiated as–welded HAZ may be represented by the Shack/Kassner model for nonirradiated austenitic SSs in high–purity water with 8 ppm DO; the rates for nonirradiated as–welded HAZ are slightly lower.
The SCC growth rates are somewhat different from the growth rates under cyclic loading. For nonirradiated material, limited data suggest that the CGRs for the Type 304 weld HAZ are higher than for the Type 304L weld HAZ. For example, the CGRs of as–welded and as–welded plus thermally–treated GG Type 304L weld HAZ are comparable, and the rates are a factor of ≈2 lower than the NUREG–0313 curve for sensitized SSs in water with 8 ppm DO. The CGR for the thermally–treated Type 304 SS weld HAZ is a factor of ≈10 higher than the CGR for the Type 304L weld HAZ and is a factor of ≈5 higher than the NUREG–0313 curve. CGRs for the as–welded Type 304 SS weld HAZ were not obtained.
The CGRs of all the SS weld HAZ materials irradiated to 5.0 x 10²⁰ n/cm2 (≈0.75 dpa) are similar and are a factor of 2–5 higher than the NUREG–0313 disposition curve for sensitized SSs in high–DO water. Irradiation increased the CGRs of the as–welded Type 304L weld HAZ, whereas it had little or no effect on the CGRs of the as–welded plus heat–treated Type 304 weld HAZ. A beneficial effect of reducing the corrosion potential of the environment on growth rates was observed for all materials that were tested in both high– and low–DO environments.
The fracture morphology of the Type 304L weld HAZ is somewhat different from that for the Type 304 weld HAZ. For the Type 304 weld HAZ, the fracture morphology was IG under environmentally enhanced growth conditions or SCC conditions, and transgranular (TG) fracture with a well–defined river pattern was found under conditions that show little or no environmental enhancement. For Type 304L weld HAZ, a TG fracture morphology with a well–defined river pattern was observed under all loading conditions. The fracture morphology for irradiated Type 304 weld HAZ is similar to that of the nonirradiated material.

xiii
Foreword

xiv

xv
Acknowledgments
The authors thank T. M. Galvin, L. A. Knoblich, E. J. Listwan, and R. W. Clark for their contributions to the experimental effort. This work is sponsored by the Office of Nuclear Regulatory Research, U.S. Nuclear Regulatory Commission, under NRC Job Code Y6388; Project Manager: W. H. Cullen, Jr.

xvi
1
1. Introduction
Austenitic stainless steels (SSs) are used extensively as structural alloys in reactor pressure vessel internal components because of their high strength, ductility, and fracture toughness. However, exposure to neutron irradiation for extended periods changes the microstructure and degrades the fracture properties of these steels. Irradiation leads to a significant increase in yield strength and reduction in ductility and fracture resistance of austenitic SSs.1–4 Radiation can exacerbate the corrosion fatigue and stress corrosion cracking (SCC) behavior of SSs1,5,6 by affecting the material microchemistry (e.g., radiation–induced segregation); material microstructure (e.g., radiation hardening); and water chemistry (e.g., radiolysis).
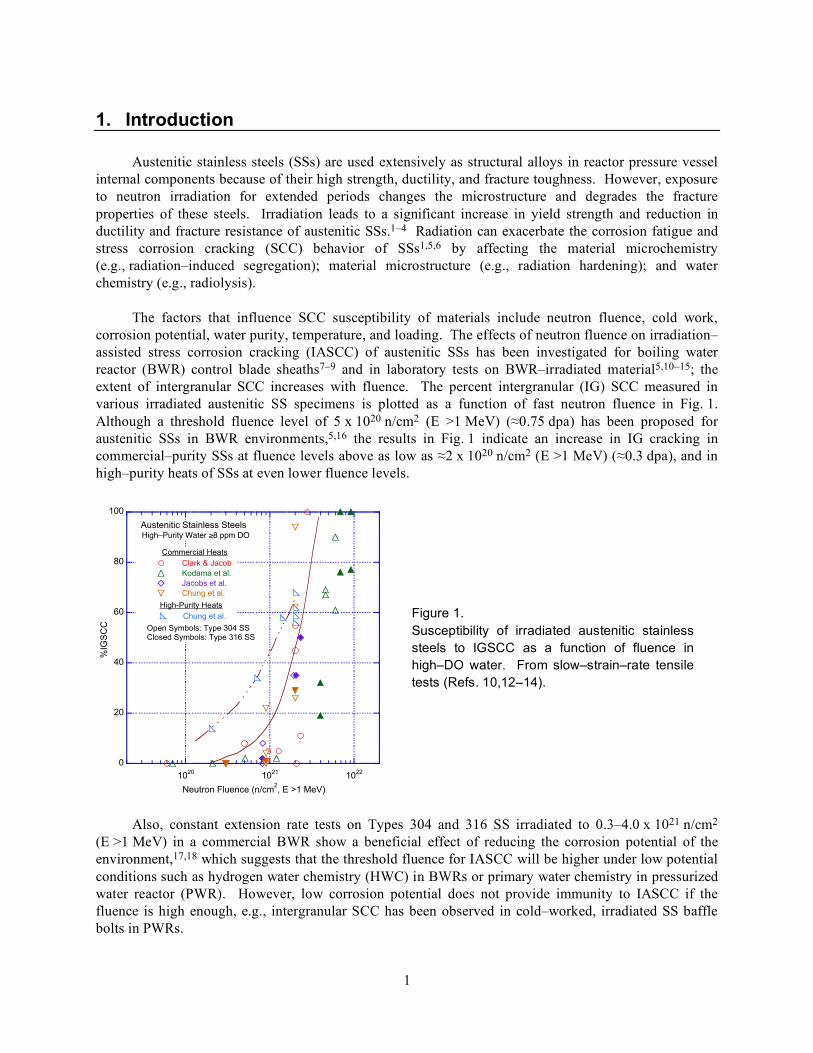
The factors that influence SCC susceptibility of materials include neutron fluence, cold work, corrosion potential, water purity, temperature, and loading. The effects of neutron fluence on irradiation–assisted stress corrosion cracking (IASCC) of austenitic SSs has been investigated for boiling water reactor (BWR) control blade sheaths7–9 and in laboratory tests on BWR–irradiated material5,10–15; the extent of intergranular SCC increases with fluence. The percent intergranular (IG) SCC measured in various irradiated austenitic SS specimens is plotted as a function of fast neutron fluence in Fig. 1. Although a threshold fluence level of 5 x 10²⁰ n/cm2 (E >1 MeV) (≈0.75 dpa) has been proposed for austenitic SSs in BWR environments,5,16 the results in Fig. 1 indicate an increase in IG cracking in commercial–purity SSs at fluence levels above as low as ≈2 x 10²⁰ n/cm2 (E >1 MeV) (≈0.3 dpa), and in high–purity heats of SSs at even lower fluence levels.
0
20
40
60
80
100
1020
1021
1022
Clark & Jacob
Kodama et al.
Jacobs et al.
Chung et al.
Chung et al.
%IG
SC
C
Neutron Fluence (n/cm2, E >1 MeV)
Austenitic Stainless SteelsHigh–Purity Water !8 ppm DO
Open Symbols: Type 304 SSClosed Symbols: Type 316 SS
Commercial Heats
High-Purity Heats
Figure 1. Susceptibility of irradiated austenitic stainless steels to IGSCC as a function of fluence in high–DO water. From slow–strain–rate tensile tests (Refs. 10,12–14).
Also, constant extension rate tests on Types 304 and 316 SS irradiated to 0.3–4.0 x 10²¹ n/cm2
(E >1 MeV) in a commercial BWR show a beneficial effect of reducing the corrosion potential of the environment,17,18 which suggests that the threshold fluence for IASCC will be higher under low potential conditions such as hydrogen water chemistry (HWC) in BWRs or primary water chemistry in pressurized water reactor (PWR). However, low corrosion potential does not provide immunity to IASCC if the fluence is high enough, e.g., intergranular SCC has been observed in cold–worked, irradiated SS baffle bolts in PWRs.
2
Argonne National Laboratory (ANL) is conducting a program of SCC testing and associated evaluations on irradiated SSs to support the regulatory request to better understand the safety issues attendant to the cracking of BWR internals such as core shrouds. The susceptibility of austenitic SSs to IASCC is being evaluated as a function of the fluence level, material composition, and water chemistry. Crack growth rate (CGR) tests are being conducted on Types 304 and 316 SS base metal and weld heat–affected zones (HAZ) irradiated to fluence levels up to 2.0 x 10²¹ n/cm2 (E > 1 MeV) (3.0 dpa) at ≈288°C. The CGR tests are being conducted in normal water chemistry (NWC) and HWC BWR environments at ≈289°C.
The results of the tests conducted earlier on irradiated Type 304 and 316 SS indicate significant enhancement of CGRs for irradiated steels in the NWC BWR environment.19,20 Crack growth rates a factor of ≈5 higher than the disposition curve proposed in NUREG–031321 for sensitized austenitic SSs in water with 8 ppm dissolved oxygen (DO) have been observed. The CGRs of Type 304L SS irradiated to 0.9 and 2.0 x 10²¹ n/cm2 (1.35 and 3.0 dpa) and of Type 316L SS irradiated to 2.0 x 10²¹ n/cm2 (3 dpa) were comparable. A test on Type 304L SS irradiated to 0.3 x 10²¹ n/cm2 (0.45 dpa) showed little environmental enhancement of cyclic CGRs in the NWC BWR environment, and the CGRs under SCC conditions were below the disposition curve given in NUREG–0313 for sensitized SSs in water with 8 ppm DO.
The results from these earlier tests also indicated that in low–DO BWR environments, the CGRs of the irradiated steels decreased by an order of magnitude in some tests, e.g., Type 304L SS irradiated to 0.9 x 10²¹ n/cm2 and Type 316L SS irradiated to 2 x 10²¹ n/cm2. As noted previously, the benefit of low–DO appears to decrease with increasing fluence. A threshold of about 5 x 10²¹ n/cm2 has been suggested.5,16 However, the beneficial effect of decreased DO was not observed in a test on Type 304L SS irradiated to 2 x 10²¹ n/cm2, although it is possible that this different behavior is associated with the loss of constraint in the specimen due to the high applied load.19
This report presents experimental data on the CGRs of Types 304L and 304 SS weld HAZ specimens irradiated to ≈5.0 x 10²⁰ n/cm2 (E > 1 MeV) (≈0.75 dpa) at ≈288°C. The irradiations were carried out in a He environment in the Halden heavy water boiling reactor. Crack growth rate tests were performed in BWR environments on Type 304L SS HAZ of the H5 weld from the Grand Gulf (GG) reactor core shroud and on Type 304 SS HAZ of a laboratory–prepared weld. The effects of fluence and water chemistry on growth rates are discussed.
3
2. Experimental
Crack growth rate tests have been conducted on several austenitic SS weld HAZ specimens that were irradiated to 5 x 10²⁰ n/cm2 (E > 1 MeV) (≈0.75dpa) at ≈288°C in a helium environment in the Halden boiling heavy water reactor. The tests were performed on 1/4–T compact tension (CT) specimens in NWC and HWC BWR environments at 289°C. Baseline data were obtained on nonirradiated specimens.
2.1 Alloys and Specimen Preparation
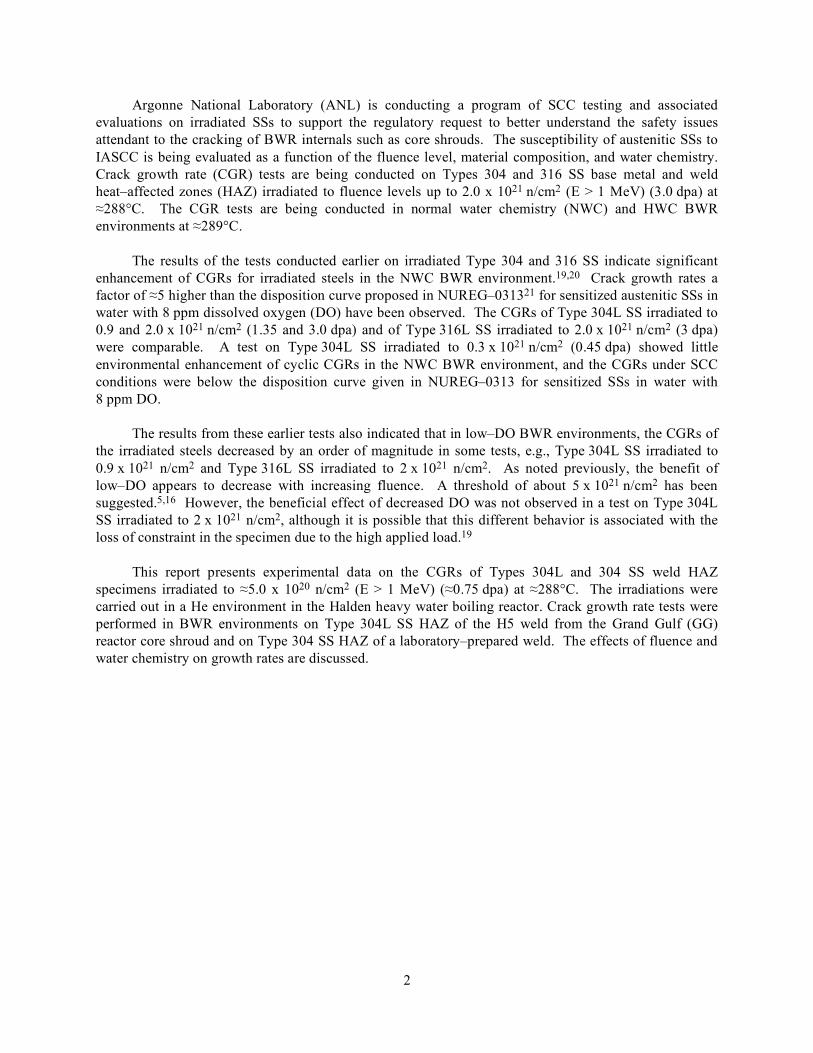
A modified configuration of the CT specimen geometry, Fig. 2, was used in the present study. Specimens were obtained from the H5 core–shroud weld of the cancelled GG reactor and a shielded metal arc (SMA) weld prepared from a 30–mm plate of Type 304 SS (Heat 10285). The top and bottom shroud shells for the GG H5 weld were fabricated from SA 240 Type 304L hot–rolled plate using a double–V joint design and welded by the submerged arc (SA) method with ER308L filler metal. The SMA weld was prepared in the laboratory by welding two 70 x 178 mm (2.75 x 7.0 in.) pieces of 30–mm thick (1.18–in. thick) plate. The weld had a single V joint design and was produced by 31 weld passes using E308 filler metal. Passes 1–5 were produced with 3.2–mm (0.125–in.) filler metal rod and 178–mm/min (7–ipm) travel speed, and passes 6–31 were produced with 4.0–mm (0.156–in.) filler metal rod and 216–mm/min (8.5–ipm) travel speed. Between passes the laboratory weld surfaces were cleaned by wire brush and grinding and rinsed with de–mineralized water or alcohol. Similar details of the GG weld preparation are not known to the authors. The composition of Type 304 SSs used in the present study is presented in Table 1.
7.00
7.00
3.30
3.30
.794
CENTERED
3.00 DIA.
2 THRU HOLES
+.05- .00
15.00
14.00
6.50
'M'
A .02A
A .02
B
B .02
A .02
A .02
6.00
12.00
2.00
1.53 DIA
2 THRU HOLES
2.00
2.00
1.45
3.25
1.45
#56 (1.19) DIA. DRILL 3.25 DP.
#0-80 UNF-2B TAP 2.17 ±.06 DP. 2 HOLES.
XXX-X
SPECIMEN ID
C
C .02
C .02
.45 R
.45
DETAIL 'M'
Figure 2. Configuration of compact–tension specimen used for this study (dimensions in mm)
Table 1. Composition (wt.%) of Type 304 stainless steels investigated
Steel Type
Heat ID
Analysis
Ni
Si
P
S
Mn
C
N
Cr
Mo
O
304 10285 Vendor 8.40 0.51 0.032 0.006 1.64 0.058 – 18.25 0.41 – ANL 8.45 0.60 0.015 0.007 1.90 0.070 0.084 18.56 0.51 0.013
304L GG Top Shell ANL 9.05 0.53 0.027 0.016 1.84 0.013 0.064 18.23 0.44 0.010 GG Bottom Shell ANL 8.95 0.55 0.023 0.008 1.80 0.015 0.067 18.62 0.31 0.014
The tensile properties of the GG core shroud shell and Heat 10285, in the mill–annealed condition
and after sensitization at 600°C for 10.5 h, are listed in Table 2. The tests were conducted on cylindrical
4
specimens, 5.1 mm diameter and 20.3 mm gauge length, in air at 289°C and 0.008 %/s strain rate. The sensitization heat treatment had little effect on the tensile strength of the GG steel, whereas the strength of Heat 10285 was decreased. For the irradiated SSs, the yield stress was estimated from the correlation developed by Odette and Lucas22; the increase in yield stress (MPa) is expressed in terms of the fluence (dpa) by the relationship
Δσy = 670 [1 – exp(–dpa/2)]0.5. (1)
The ultimate stresses for the irradiated steels were estimated from the data in Ref. 14. The tensile yield and ultimate stresses for the irradiated SSs are also given in Table 2. The tensile properties of the sensitized material were used to determine the K/size criterion for nonirradiated and irradiated HAZ specimens, both in the as–welded and as–welded plus thermally–treated conditions.
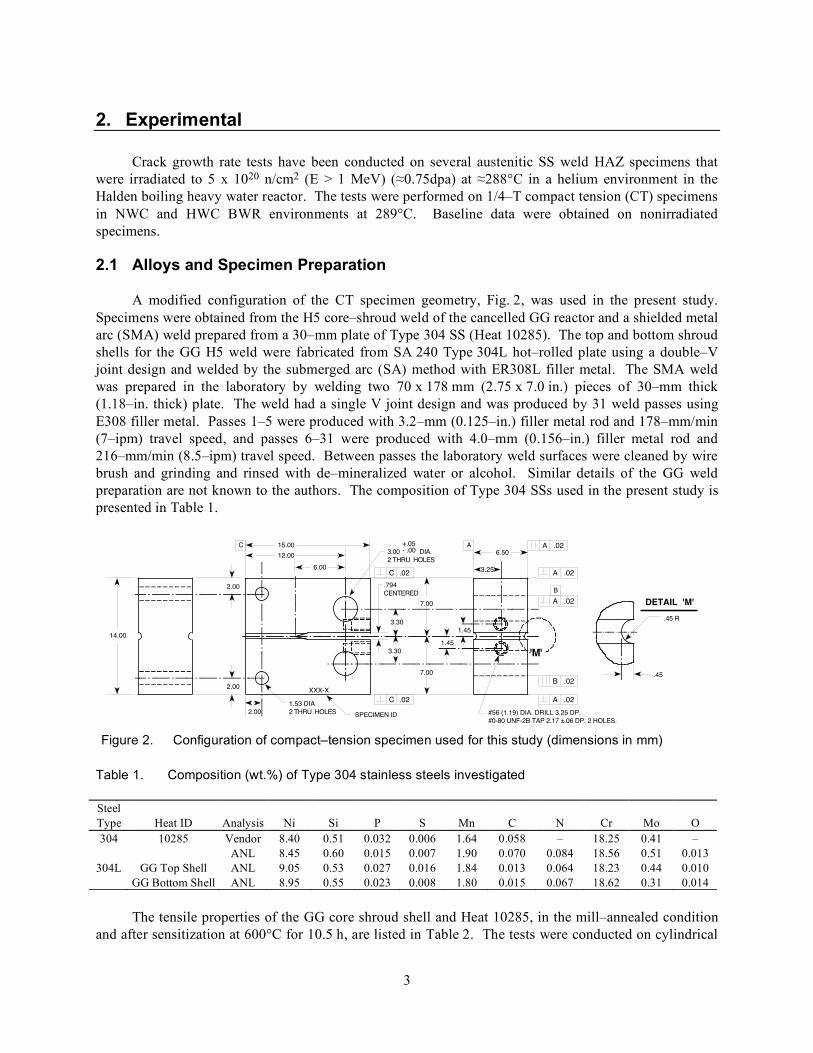
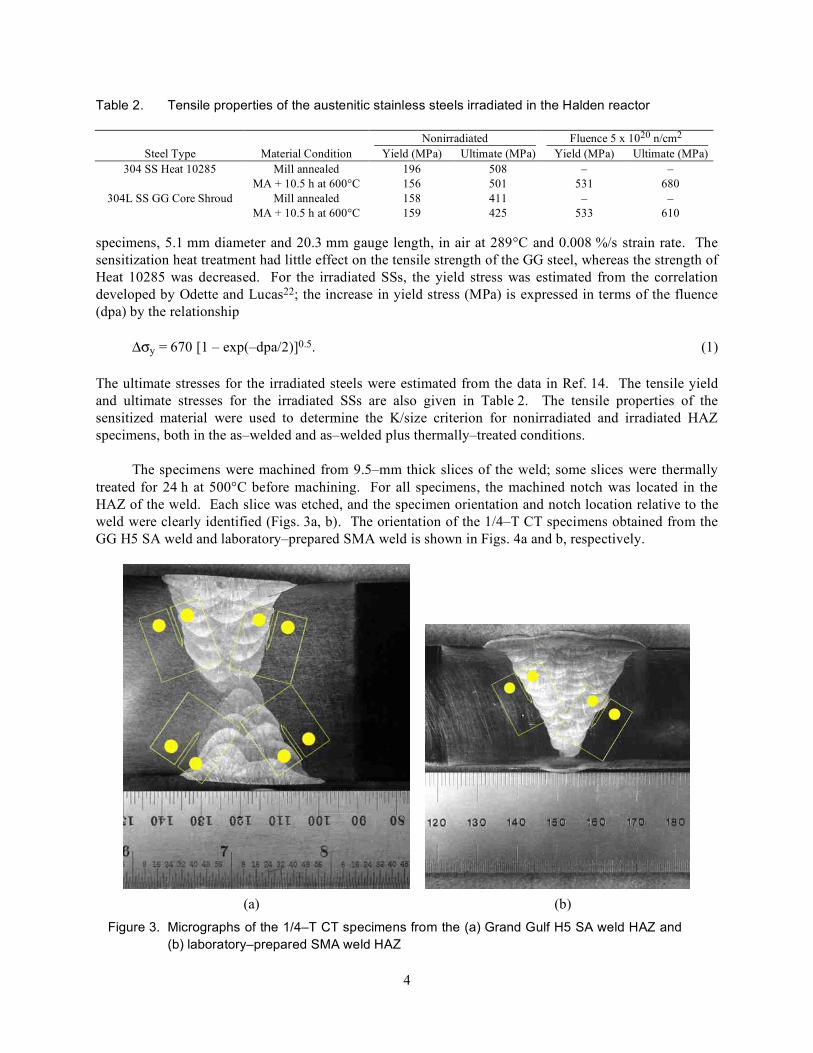
The specimens were machined from 9.5–mm thick slices of the weld; some slices were thermally treated for 24 h at 500°C before machining. For all specimens, the machined notch was located in the HAZ of the weld. Each slice was etched, and the specimen orientation and notch location relative to the weld were clearly identified (Figs. 3a, b). The orientation of the 1/4–T CT specimens obtained from the GG H5 SA weld and laboratory–prepared SMA weld is shown in Figs. 4a and b, respectively.
(a) (b)
Figure 3. Micrographs of the 1/4–T CT specimens from the (a) Grand Gulf H5 SA weld HAZ and (b) laboratory–prepared SMA weld HAZ
Table 2. Tensile properties of the austenitic stainless steels irradiated in the Halden reactor
Nonirradiated Fluence 5 x 10²⁰ n/cm2 Steel Type Material Condition Yield (MPa) Ultimate (MPa) Yield (MPa) Ultimate (MPa)
304 SS Heat 10285 Mill annealed 196 508 – – MA + 10.5 h at 600°C 156 501 531 680
304L SS GG Core Shroud Mill annealed 158 411 – – MA + 10.5 h at 600°C 159 425 533 610
5
(a)
(b)
Figure 4. Orientation of the 1/4–T CT specimens from the (a) Grand Gulf H5 SA weld HAZ and (b) laboratory–prepared SMA weld HAZ
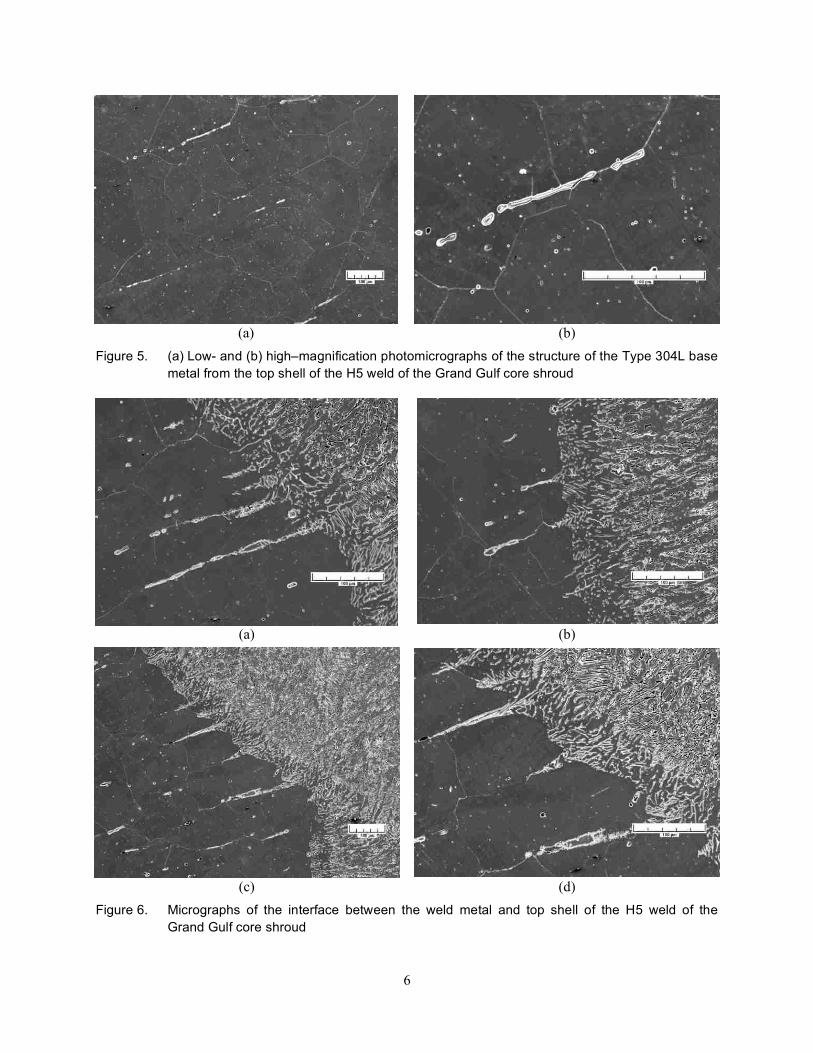
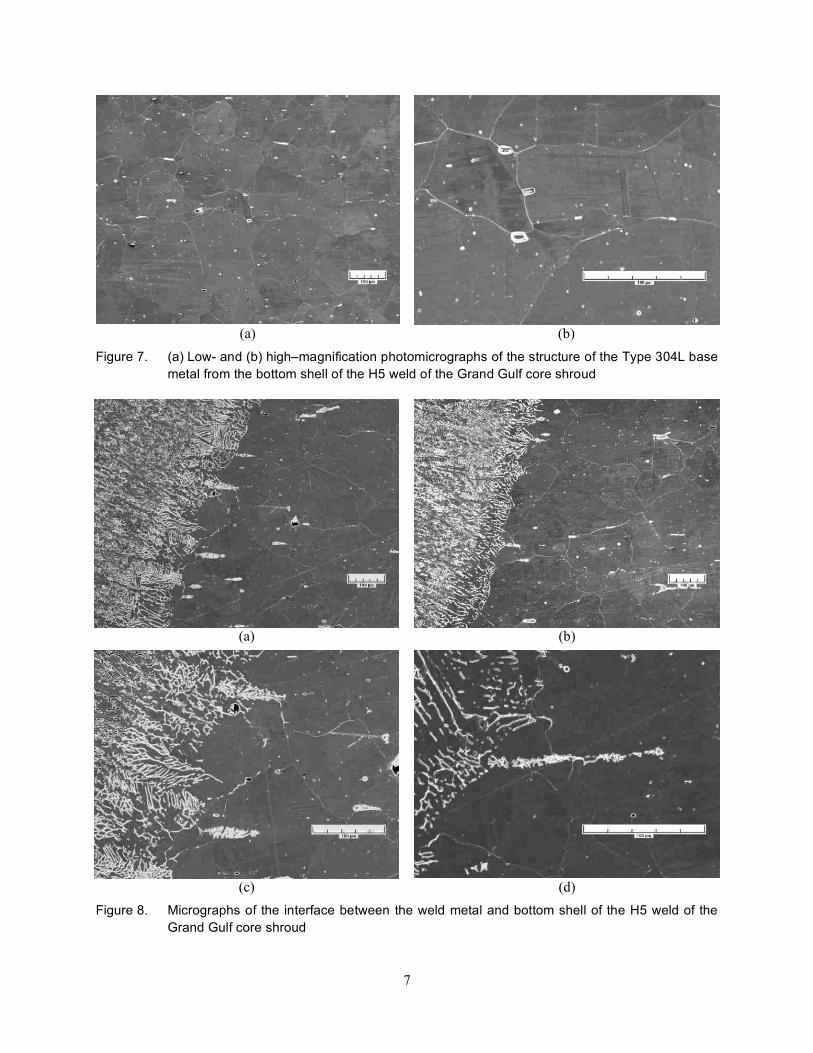
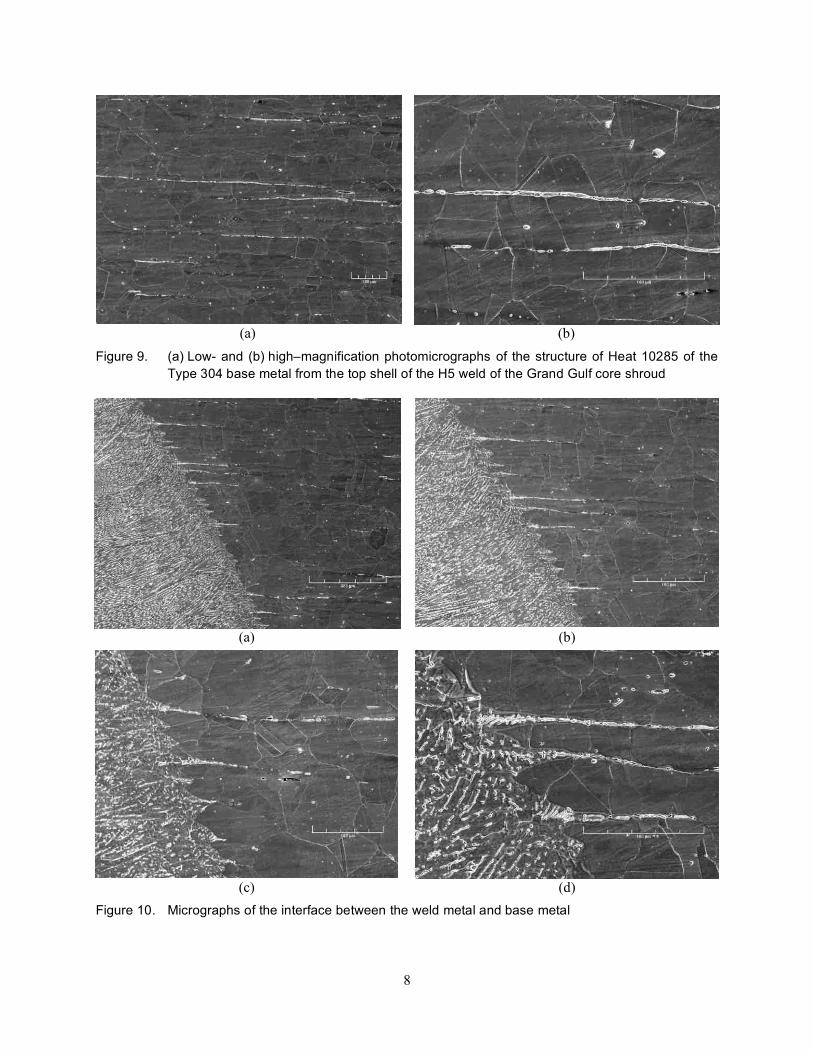
The microstructures of the base metal and as–welded HAZ of Type 304L SS from the GG top and bottom shells and Heat 10285 of Type 304 SS are shown in Figs. 5–10. The base metal of all the SSs contains stringers of ferrite, e.g., Figs. 5, 7, and 9; Heat 10285 appears to have the most ferrite and the GG bottom shell, the least. The grain sizes for the GG top and bottom shell materials are comparable and are larger than that for Heat 10285. In all welds, the fusion line extends into the base metal along the ferrite stringers, e.g., Figs. 6, 8, and 10. In other words, the ferrite stringers intersecting the fusion line appear to have melted and re–solidified during the welding process.
6
(a) (b)
Figure 5. (a) Low- and (b) high–magnification photomicrographs of the structure of the Type 304L base metal from the top shell of the H5 weld of the Grand Gulf core shroud
(a) (b)
(c) (d)
Figure 6. Micrographs of the interface between the weld metal and top shell of the H5 weld of the Grand Gulf core shroud
7
(a) (b)
Figure 7. (a) Low- and (b) high–magnification photomicrographs of the structure of the Type 304L base metal from the bottom shell of the H5 weld of the Grand Gulf core shroud
(a) (b)
(c) (d)
Figure 8. Micrographs of the interface between the weld metal and bottom shell of the H5 weld of the Grand Gulf core shroud
8
(a) (b)
Figure 9. (a) Low- and (b) high–magnification photomicrographs of the structure of Heat 10285 of the Type 304 base metal from the top shell of the H5 weld of the Grand Gulf core shroud
(a) (b)
(c) (d)
Figure 10. Micrographs of the interface between the weld metal and base metal
9
2.2 Test Facility
The facility for conducting crack growth tests on irradiated materials is designed for in–cell testing, with the test train, furnace, and other required equipment mounted on top of a portable wheeled cart that can be easily rolled into the cell. A 1–liter SS autoclave is installed inside the furnace for conducting tests in simulated BWR environments. Water is circulated through a port in the autoclave cover plate that serves both as inlet and outlet. The hydraulic actuator is mounted on top of the frame, with the load train components suspended beneath it. The 22–kN (5–kip) load cell is at the top of the pull rod. The furnace is mounted on a pneumatic cylinder and can be raised to enclose the autoclave with the load cage and the specimen during the test.
The 1/4–T CT specimen is mounted in the clevises with Inconel pins. The specimen and clevises are kept electrically insulated from the load train by using oxidized Zircaloy pins and mica washers to connect the clevises to the rest of the load train. Platinum wires are used for the current and potential leads. The current leads are attached to SS split pins that are inserted into the holes at the top and bottom of the specimen. The potential leads are attached by screwing short SS pins into threaded holes in the specimen and attaching the platinum wires with in–line SS crimps. An Instron Model 8500+ Dynamic Materials Testing System is used to load the specimen.
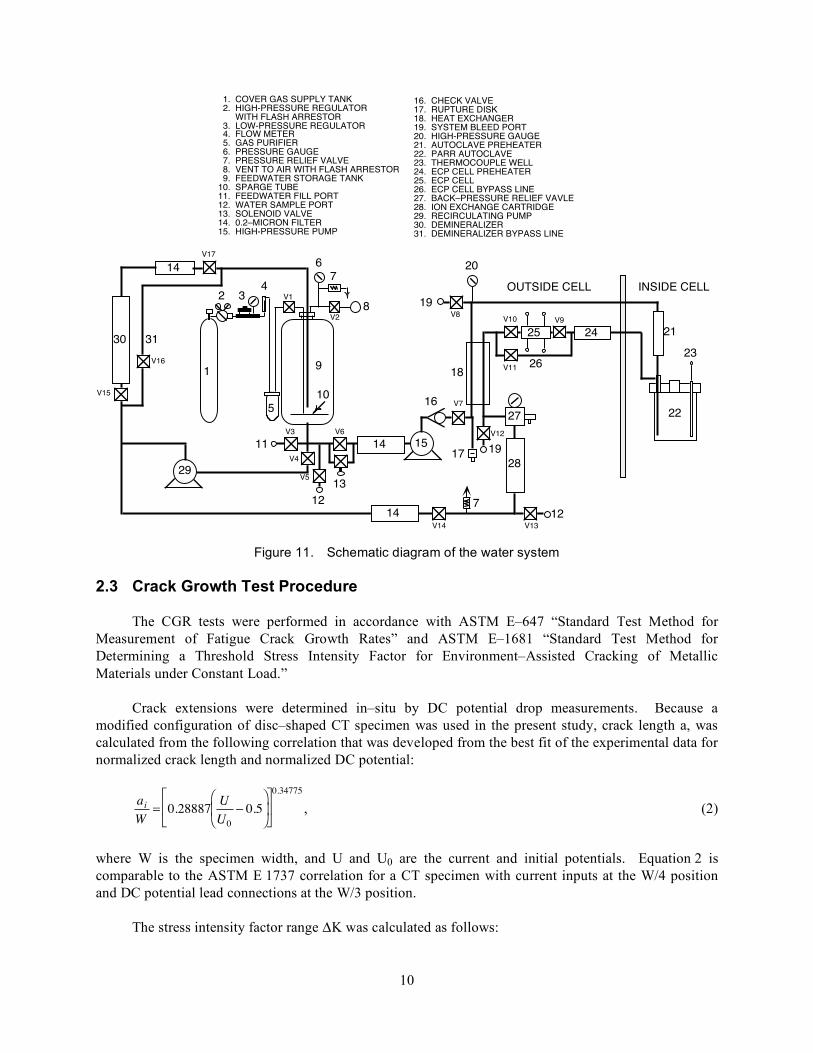
The recirculating water system consists of a storage tank, high pressure pump, regenerative heat exchanger, autoclave preheater, test autoclave, electrochemical potential (ECP) cell preheater, ECP cell, regenerative heat exchanger, Mity MiteTM back-pressure regulator, an ion–exchange cartridge, a 0.2 micron filter, a demineralizer resin bed, another 0.2 micron filter, and return line to the tank. A schematic diagram of the recirculating water system is shown in Fig. 11. A detailed description of the test facility is presented in Ref. 19.
An out–of–cell test facility, identical to the in–cell test facility but without the ion exchange cartridge (item #28 in Fig, 11), was used to obtain baseline data on nonirradiated specimens. Also, the out–of–cell facility is equipped with a larger feedwater pump that is capable of 30–180 mL/min flow rates, compared to 10–20 mL/min for the in–cell pump.
The BWR environments comprise high–purity deionized water that contains either ≈300 ppb or <30 ppb DO, resulting in ECPs for SS that range from 160 to -500 mV. The feedwater is stored in a 135–L SS tank manufactured by Filpaco Industries. The tank is designed for vacuums and over–pressures up to 414 kPa (60 psig). The deionized water is prepared by passing purified water through a set of filters that comprise a carbon filter, an Organex–Q filter, two ion exchangers, and a 0.2–mm capsule filter. The DO level in water is established by bubbling nitrogen that contains ≈1% oxygen through the deionized water in the supply tank. For the low–DO tests, the DO level is reduced to <10 ppb by bubbling nitrogen or nitrogen plus 5% hydrogen through the water. The cover gas of the storage tank is nitrogen plus 1% oxygen for the high–DO environment, and either pure nitrogen or nitrogen plus 5% hydrogen for the low–DO environment. The ECP of a Pt electrode and a SS sample located at the exit of the autoclave were monitored continuously during the test, and water samples were taken periodically to measure pH, resistivity, and DO concentration. The DO level was measured in the in–cell facility by the colorimetric technique using CHEMets sampling ampoules and in the out–of–cell facility by a dissolved oxygen analyzer from Orbisphere Laboratories, which included an oxygen indicator and an electrochemical probe.
10
1. COVER GAS SUPPLY TANK
2. HIGH-PRESSURE REGULATOR
WITH FLASH ARRESTOR
3. LOW-PRESSURE REGULATOR 4. FLOW METER
5. GAS PURIFIER
6. PRESSURE GAUGE
7. PRESSURE RELIEF VALVE
8. VENT TO AIR WITH FLASH ARRESTOR
9. FEEDWATER STORAGE TANK
10. SPARGE TUBE
11. FEEDWATER FILL PORT
12. WATER SAMPLE PORT
13. SOLENOID VALVE
14. 0.2–MICRON FILTER
15. HIGH-PRESSURE PUMP
16. CHECK VALVE
17. RUPTURE DISK
18. HEAT EXCHANGER
19. SYSTEM BLEED PORT
20. HIGH-PRESSURE GAUGE
21. AUTOCLAVE PREHEATER
22. PARR AUTOCLAVE
23. THERMOCOUPLE WELL
24. ECP CELL PREHEATER
25. ECP CELL
26. ECP CELL BYPASS LINE
27. BACK–PRESSURE RELIEF VAVLE
28. ION EXCHANGE CARTRIDGE
29. RECIRCULATING PUMP
30. DEMINERALIZER
31. DEMINERALIZER BYPASS LINE
20
12
19
30
147
5
6
8
9
10
11
13
1517
21
23
24
OUTSIDE CELL INSIDE CELLV1
V3 V6
V7
V8
V17
22
V2
25
14
16
19
27
712
V12
V13
2829
V9
1826
V10
V11V16
V4
V15
14
V14
V5
1
2 34
31
Figure 11. Schematic diagram of the water system
2.3 Crack Growth Test Procedure
The CGR tests were performed in accordance with ASTM E–647 “Standard Test Method for Measurement of Fatigue Crack Growth Rates” and ASTM E–1681 “Standard Test Method for Determining a Threshold Stress Intensity Factor for Environment–Assisted Cracking of Metallic Materials under Constant Load.”
Crack extensions were determined in–situ by DC potential drop measurements. Because a modified configuration of disc–shaped CT specimen was used in the present study, crack length a, was calculated from the following correlation that was developed from the best fit of the experimental data for normalized crack length and normalized DC potential:
ai
W= 0.28887
U
U0
! 0.5"
# $
%
& '
(
)
*
+
,
-
0.34775
, (2)
where W is the specimen width, and U and U0 are the current and initial potentials. Equation 2 is comparable to the ASTM E 1737 correlation for a CT specimen with current inputs at the W/4 position and DC potential lead connections at the W/3 position.
The stress intensity factor range ΔK was calculated as follows:
11
!K =!P
BBNW( )1/ 2
2+a
W
"
# $
%
& '
1(a
W
"
# $
%
& '
3 / 2fa
W
"
# $
%
& ' (3)
!P = Pmax
" Pmin
for R > 0 (4)
fa
W
!
" #
$
% & = 0.886+ 4.64
a
W
!
" #
$
% & '13.32
a
W
!
" #
$
% &
2
+14.72a
W
!
" #
$
% &
3
' 5.6a
W
!
" #
$
% &
4
. (5)
where
Pmax
and
Pmin
are maximum and minimum applied load, a is crack length, and W is the specimen width. The effective thickness Beff of a side–grooved specimen can be calculated as the root mean square of the full and reduced thicknesses, i.e., (B·BN)0.5.
2.2.1 Procedure
All specimens were fatigue precracked in the test environment at load ratio R = 0.2–0.3, frequency of 1–5 Hz, and maximum stress intensity factor Kmax ≈15 MPa m1/2. After 0.3–0.5 mm crack extension, R was increased incrementally to 0.7, and the loading waveform changed to a slow/fast sawtooth with rise times of 30–1000 s. The loading history was then changed to a trapezoidal waveform, R = 0.7, hold period at peak of 1– or 2–h, and unload/reload period of 24–s to measure SCC growth rates. For some specimens, CGRs were also obtained under constant load. During individual test periods, Kmax was maintained approximately constant by periodic load shedding (less than 2% decrease in load at any given time).
Under cyclic loading, the CGR (m/s) can be expressed as the superposition of the rate in air (i.e., mechanical fatigue) and the rates due to corrosion fatigue and SCC, given as
!aenv =
!aair +
!acf +
!aSCC . (6)
The CGRs in air, !aair (m/s), were determined from the correlation developed by James and Jones23:
!aair = CSS S(R) ΔK3.3/TR , (7)
where R is the load ratio (Kmin/Kmax), ΔK is Kmax – Kmin in MPa m1/2, TR is the rise time (s) of the loading waveform, and function S(R) is expressed in terms of the load ratio R as follows:
S(R) = 1.0 R <0 S(R) = 1.0 + 1.8R 0 <R <0.79 S(R) = -43.35 + 57.97R 0.79 <R <1.0 (8)
Function CSS is given by a third–order polynomial of temperature T (°C), expressed as
CSS = 1.9142 x 10⁻¹² + 6.7911 x 10⁻¹⁵ T – 1.6638 x 10⁻¹⁷ T2 + 3.9616 x 10⁻²⁰ T3. (9)
Environmental effects on fatigue crack growth of nonirradiated austenitic SSs have been investigated by Shack and Kassner.24 In the absence of any significant contribution of SCC to growth rate, the CGRs in water with ≈0.3 ppm DO are best represented by the expression,
12
!aenv =
!aair + 4.5 x 10⁻⁵ (
!aair )0.5 (10)
and in water with ≈8 ppm DO by the expression,
!aenv =
!aair + 1.5 x 10⁻⁴ (
!aair )0.5. (11)
The CGR (m/s) under SCC conditions is represented by the correlation given in NUREG–0313, Rev. 2,21
!aSCC = A (K)2.161, (12)
where K is the stress intensity factor (MPa m0.5), and the magnitude of constant A depends on the water chemistry and composition and structure of the steel. A value of 2.1 x 10⁻¹³ has been proposed in NUREG–0313 for sensitized SS in water chemistries with 8 ppm DO. The magnitude of constant A will be smaller in low–DO environments such as HWC BWR or PWR.
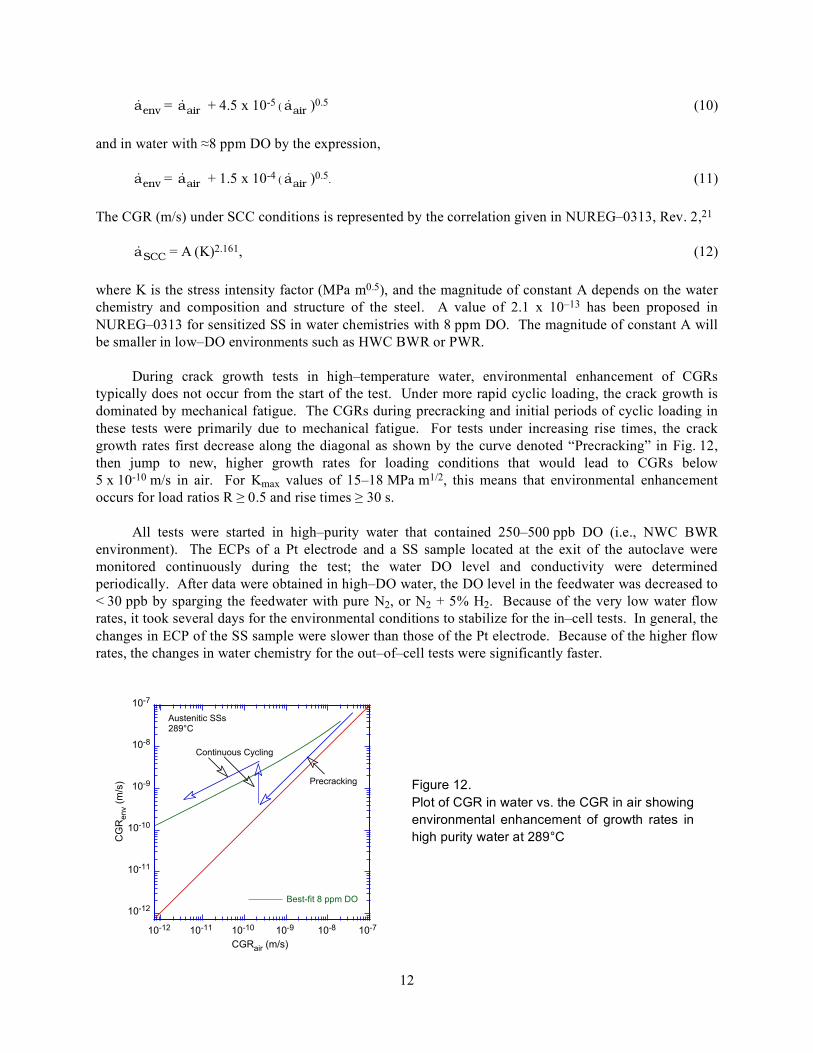
During crack growth tests in high–temperature water, environmental enhancement of CGRs typically does not occur from the start of the test. Under more rapid cyclic loading, the crack growth is dominated by mechanical fatigue. The CGRs during precracking and initial periods of cyclic loading in these tests were primarily due to mechanical fatigue. For tests under increasing rise times, the crack growth rates first decrease along the diagonal as shown by the curve denoted “Precracking” in Fig. 12, then jump to new, higher growth rates for loading conditions that would lead to CGRs below 5 x 10⁻¹⁰ m/s in air. For Kmax values of 15–18 MPa m1/2, this means that environmental enhancement occurs for load ratios R ≥ 0.5 and rise times ≥ 30 s.
All tests were started in high–purity water that contained 250–500 ppb DO (i.e., NWC BWR environment). The ECPs of a Pt electrode and a SS sample located at the exit of the autoclave were monitored continuously during the test; the water DO level and conductivity were determined periodically. After data were obtained in high–DO water, the DO level in the feedwater was decreased to < 30 ppb by sparging the feedwater with pure N2, or N2 + 5% H2. Because of the very low water flow rates, it took several days for the environmental conditions to stabilize for the in–cell tests. In general, the changes in ECP of the SS sample were slower than those of the Pt electrode. Because of the higher flow rates, the changes in water chemistry for the out–of–cell tests were significantly faster.
10-12
10-11
10-10
10-9
10-8
10-7
10-12 10-11 10-10 10-9 10-8 10-7
Best-fit 8 ppm DO
CG
Renv (
m/s
)
CGRair (m/s)
Austenitic SSs289°C
Precracking
Continuous Cycling
Figure 12. Plot of CGR in water vs. the CGR in air showing environmental enhancement of growth rates in high purity water at 289°C
13
After the test the final crack size was marked by fatigue cycling in air at room temperature. The specimens were then fractured, and the fracture surface of both halves of the specimen was photographed with a telephoto lens through the hot cell window. The fracture surfaces of the out–of–cell test specimens were examined by scanning electron microscopy (SEM). The final crack length of each half of the fractured specimen was determined from the photograph by the 9/8 averaging technique.
2.2.2 SEM Examination of Fracture Surfaces
The fracture surfaces of the irradiated specimens were also examined by a scanning electron microscope (SEM) located in the hot–cell facility to further validate the crack extension measurements and to characterize the fracture morphology. To reduce the exposure to the SEM operator, the examinations were performed on thin slices of the fracture surface cut from the fractured CT specimen using a Charmilles-Andrew Model EF330 traveling–wire electro–discharge machine (EDM).
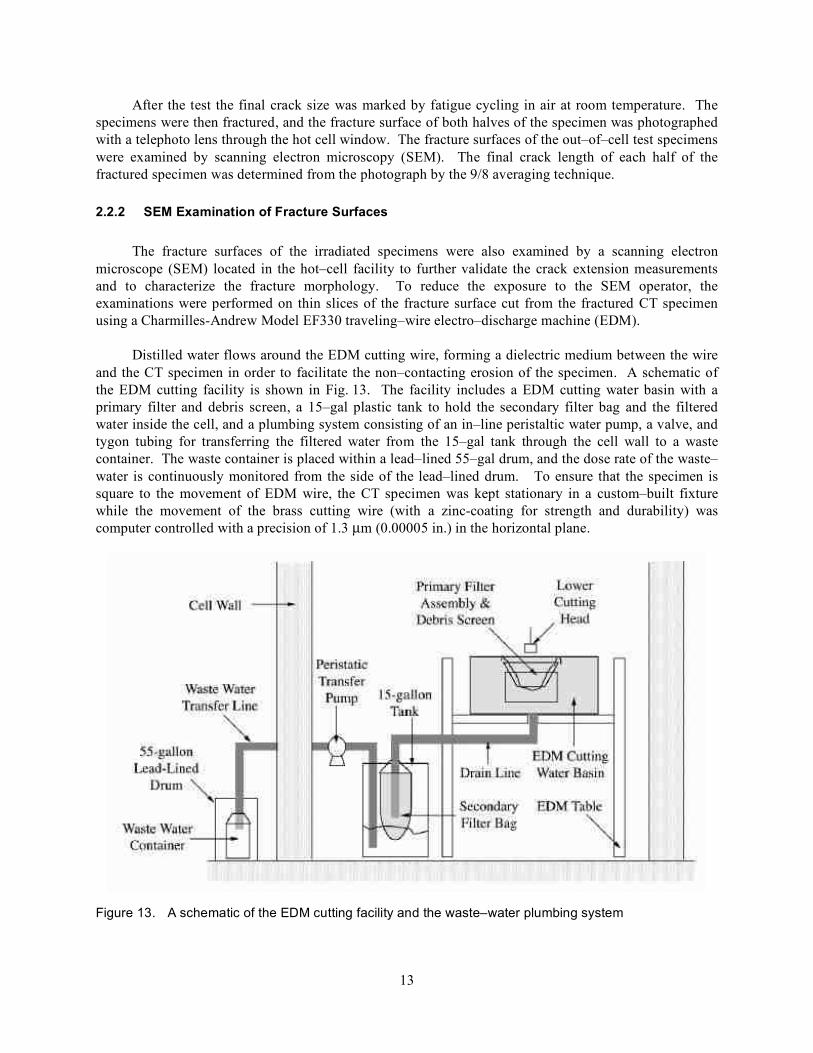
Distilled water flows around the EDM cutting wire, forming a dielectric medium between the wire and the CT specimen in order to facilitate the non–contacting erosion of the specimen. A schematic of the EDM cutting facility is shown in Fig. 13. The facility includes a EDM cutting water basin with a primary filter and debris screen, a 15–gal plastic tank to hold the secondary filter bag and the filtered water inside the cell, and a plumbing system consisting of an in–line peristaltic water pump, a valve, and tygon tubing for transferring the filtered water from the 15–gal tank through the cell wall to a waste container. The waste container is placed within a lead–lined 55–gal drum, and the dose rate of the waste–water is continuously monitored from the side of the lead–lined drum. To ensure that the specimen is square to the movement of EDM wire, the CT specimen was kept stationary in a custom–built fixture while the movement of the brass cutting wire (with a zinc-coating for strength and durability) was computer controlled with a precision of 1.3 µm (0.00005 in.) in the horizontal plane.
Figure 13. A schematic of the EDM cutting facility and the waste–water plumbing system
14
For a detailed examination of the fracture surfaces, some nonirradiated specimens of interest were stripped of oxides using a two–step procedure. First, the specimens were boiled in a solution consisting of 20% NaOH and 5% KMnOH for 1 h. Then, they were boiled for an additional 1 h in a 20% (NH4)2C6H6O7 solution. Upon completion of this procedure, the samples were ultrasonically cleaned successively in distilled water, methanol, and isopropanol.
2.2.3 Data Qualification
The CGR test results were validated in accordance with the specimen size criteria of ASTM E 1681 and E 647. These criteria require that the plastic zone at the tip of a fatigue crack be small relative to the specimen geometry. The ASTM specifications for specimen K/size criteria are intended to ensure applicability and transferability of the cracking behavior of a component or specimen of a given thickness under a specific loading condition to a crack associated with a different geometry, thickness, and loading condition.
For constant load tests, ASTM E 1681 requires that
Beff and (W – a) ≥2.5 (K/σys)2, (13)
and for cyclic loading ASTM 647 requires that
(W – a) ≥(4/π) (K/σys)2, (14)
where K is the applied stress intensity factor, and !ys is the yield stress of the material. For tests on
irradiated material, side–grooved specimens are strongly recommended, with a depth for each side groove between 5 and 10% of the specimen thickness. In high–temperature water, because the primary mechanism for crack growth during continuous cycling is not mechanical fatigue, Eq. 13 is the more appropriate criterion, but Eq. 14 may give acceptable results. For high–strain hardening materials, i.e., materials with an ultimate–to–yield stress ratio (σult/σys) ≥1.3, both criteria allow the use of the flow stress defined as σf = (σult + σys)/2 rather than the yield stress.
The K/size criteria were developed for materials that show work hardening and, therefore, may not be valid for materials irradiated to fluence levels where, on a local level, they do not strain harden. This lack of strain hardening, or strain softening, is most dramatic when dislocation channeling occurs but may also occur at lower fluences. For moderate to highly irradiated material, it has been suggested that an effective yield stress, defined as the average of the nonirradiated and irradiated yield stresses, be used25; this discounts the irradiation–induced increase in yield stress by a factor of 2. In the present study, an effective flow stress was used to determine the valid Kmax for SS weld HAZ specimens irradiated to a fluence level of 5 x 10²⁰ n/cm2.
15
3. Results and Discussions
3.1 Crack Growth Tests on Nonirradiated Stainless Steel Weld HAZ Specimens
This section presents the results of crack growth tests in the BWR environment with nonirradiated specimens of Type 304L GG core shroud H5 weld HAZ and Type 304 laboratory–prepared weld HAZ. The GG weld HAZ specimens were from the bottom shell of the H5 weld and were in the as–welded (GG5B–A) and as–welded plus thermally treated condition (GG3B–A–TT). The Type 304 SS laboratory–prepared weld HAZ specimen was in the as–welded plus thermally treated condition (853B–A–TT).
3.1.1 Specimen GG5B–A of the HAZ from Grand Gulf Core Shroud H5 SA Weld, Test CGR-10
The environmental and loading conditions, experimental CGRs, allowed values of Kmax from the K/size criterion in Eq. 13, and the deviation of applied Kmax from the allowed value are given in Table 3 for Specimen GG5B–A. During most test periods, Kmax was maintained approximately constant by periodic load shedding. The test was started in high–DO water (≈580 ppb DO in effluent) and a flow rate of 140 mL/min. Because of a faulty reference electrode, the ECPs of the Pt and SS electrodes in the effluent could not be monitored during the test. The water conductivity was monitored continuously.
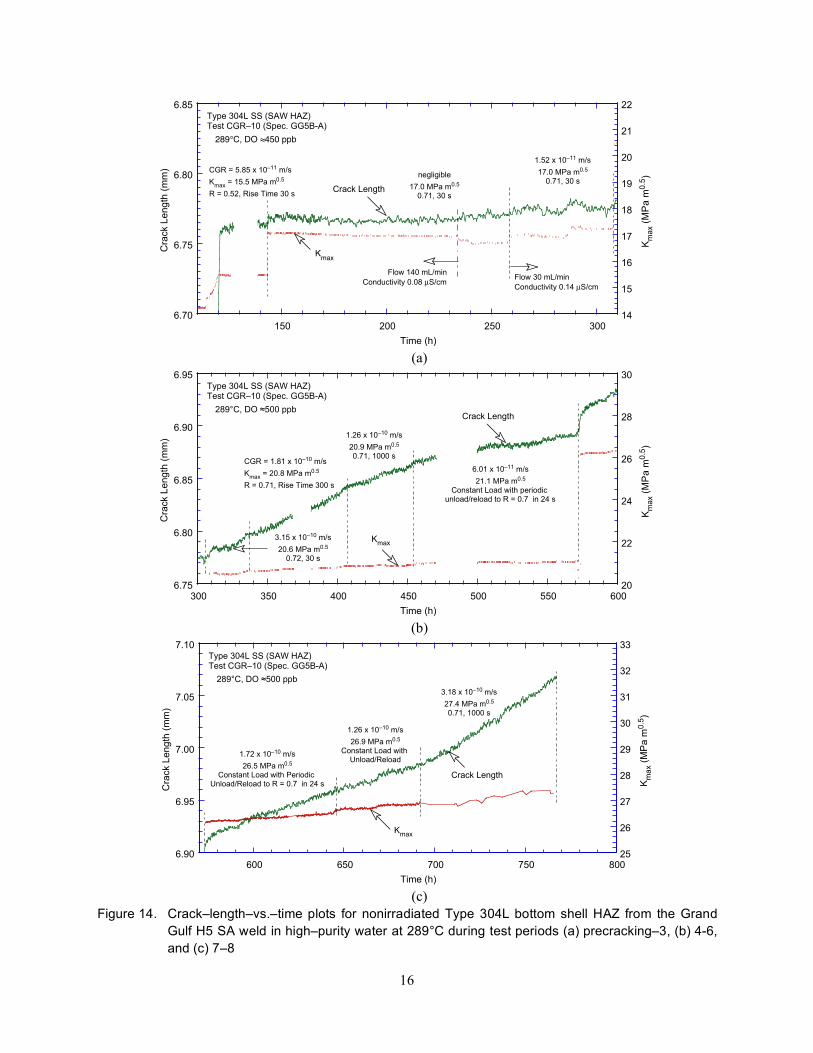
Precracking was initiated at R = 0.23, Kmax ≈15 MPa m1/2, and a triangular waveform. After ≈0.6 mm advance, R was increased incrementally to 0.7 and the waveform changed to a slow/fast sawtooth with a rise time of 30 s; in all cases the fast rate (time to unload) was 2 s. The changes in the crack length and Kmax with time during the various test periods are shown in Figs. 14a–c. During the initial 300–h test period (precracking and test periods 1–2b in Table 3), no environmental enhancement was observed in the measured growth rates. Also, decreasing the flow rate from 140 to 35 mL/min had little or no effect on the CGRs, although the conductivity increased from ≈0.07 to 0.14 µS/cm.
Table 3. Crack growth results for Specimen GG5B–Aa of Type 304L HAZ in high–purity water at 289°C
Test
Test Time,
Flow Rate,
Cond.,c
O2 Conc.,c
R Load
Rise Time,
Down Time,
Hold Time,
Kmax,
ΔK,
Growth Rate,
Allowed Kmax,d
Deviation in Kmax,d
Periodb h CC/min µS/cm ppb Ratio s s s MPa·m1/2 MPa·m1/2 m/s MPa·m1/2 % Pre a 97 140 0.07 580 0.23 0.25 0.25 0 16.7 12.9 7.57E-08 19.3 -13 Pre b 98 140 0.07 580 0.23 0.25 0.25 0 15.0 11.5 3.42E-08 19.1 -22 Pre c 114 140 0.08 590 0.23 7.5 7.5 0 14.2 11.0 3.59E-10 19.1 -25 Pre d 120 140 0.07 590 0.23 0.50 0.50 0 15.7 12.1 3.40E-08 18.7 -16
1 143 140 0.08 485 0.52 30 2 0 15.5 7.4 5.85E-11 18.6 -17 2a 259 30 0.12 440 0.71 30 2 0 17.0 4.9 negligible 18.6 -9 2b 306 35 0.14 450 0.71 30 2 0 17.0 4.9 1.52E-11 18.6 -9 2c* 337 35 0.14 464 0.72 30 2 0 20.6 5.8 3.15E-10 18.6 11 3* 407 35 0.14 460 0.71 300 2 0 20.8 6.0 1.81E-10 18.5 13 4* 455 35 0.13 500 0.71 1,000 2 0 20.9 6.1 1.26E-10 18.5 13 5 572 35 0.13 500 0.71 12 12 3600 21.1 – 6.01E-11 18.4 14 6 646 105 0.08 500 0.71 12 12 3600 26.5 – 1.72E-10 18.3 45 7 692 105 0.07 500 0.71 12 12 3600 26.9 – 1.55E-10 18.2 47 8 767 105 0.07 500 0.71 1,000 2 0 27.4 7.9 3.18E-10 18.1 51
aNonirradiated Grand Gulf H5 SA weld bottom shell HAZ, as–welded condition. bAn asterisk indicates environmental enhancement of growth rates under cyclic loading. cRepresents values in the effluent. dBased on flow stress.
16
6.70
6.75
6.80
6.85
14
15
16
17
18
19
20
21
22
150 200 250 300
Cra
ck L
en
gth
(m
m)
Km
ax (
MP
a m
0.5
)
Time (h)
Type 304L SS (SAW HAZ)Test CGR–10 (Spec. GG5B-A)
289°C, DO !450 ppb
Kmax
Crack Length
1.52 x 10⁻¹¹ m/s
17.0 MPa m0.5
0.71, 30 s
CGR = 5.85 x 10⁻¹¹ m/s
Kmax
= 15.5 MPa m0.5
R = 0.52, Rise Time 30 s
Flow 140 mL/min
Conductivity 0.08 µS/cmFlow 30 mL/min
Conductivity 0.14 µS/cm
negligible
17.0 MPa m0.5
0.71, 30 s
(a)
6.75
6.80
6.85
6.90
6.95
20
22
24
26
28
30
300 350 400 450 500 550 600
Cra
ck L
en
gth
(m
m)
Km
ax (
MP
a m
0.5
)
Time (h)
Type 304L SS (SAW HAZ)Test CGR–10 (Spec. GG5B-A)
289°C, DO !500 ppb
Kmax
Crack Length
6.01 x 10⁻¹¹ m/s
21.1 MPa m0.5
Constant Load with periodic unload/reload to R = 0.7 in 24 s
CGR = 1.81 x 10⁻¹⁰ m/s
Kmax
= 20.8 MPa m0.5
R = 0.71, Rise Time 300 s
1.26 x 10⁻¹⁰ m/s
20.9 MPa m0.5
0.71, 1000 s
3.15 x 10⁻¹⁰ m/s
20.6 MPa m0.5
0.72, 30 s
(b)
6.90
6.95
7.00
7.05
7.10
25
26
27
28
29
30
31
32
33
600 650 700 750 800
Cra
ck L
en
gth
(m
m)
Km
ax (
MP
a m
0.5
)
Time (h)
Type 304L SS (SAW HAZ)Test CGR–10 (Spec. GG5B-A)
289°C, DO !500 ppb
Kmax
Crack Length
1.72 x 10⁻¹⁰ m/s
26.5 MPa m0.5
Constant Load with Periodic Unload/Reload to R = 0.7 in 24 s
1.26 x 10⁻¹⁰ m/s
26.9 MPa m0.5
Constant Load with Unload/Reload
3.18 x 10⁻¹⁰ m/s
27.4 MPa m0.5
0.71, 1000 s
(c)
Figure 14. Crack–length–vs.–time plots for nonirradiated Type 304L bottom shell HAZ from the Grand Gulf H5 SA weld in high–purity water at 289°C during test periods (a) precracking–3, (b) 4-6, and (c) 7–8
17
After ≈310 h, Kmax was increased to ≈20 MPa m1/2, and rise time increased to 300 s and then 1000 s. Under these conditions, environmental enhancement of CGRs is observed. After ≈450 h the loading waveform was changed to a trapezoidal shape with 3600–s hold period and 12–s unload and reload periods. For Specimen GG5B–A, the experimental Kmax values were generally higher (≈13% higher during test periods 2c–5 and ≈45–50% higher during periods 6–8) than the allowed Kmax based on flow stress and Eq. 13.
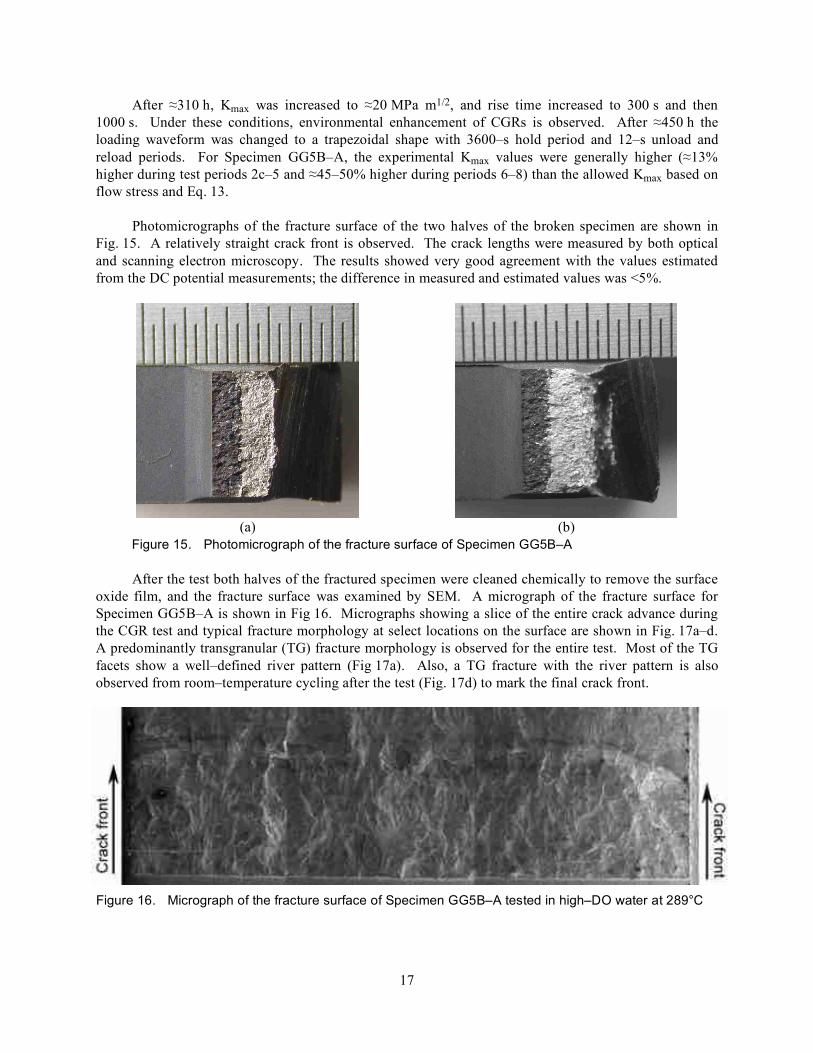
Photomicrographs of the fracture surface of the two halves of the broken specimen are shown in Fig. 15. A relatively straight crack front is observed. The crack lengths were measured by both optical and scanning electron microscopy. The results showed very good agreement with the values estimated from the DC potential measurements; the difference in measured and estimated values was <5%.
(a) (b)
Figure 15. Photomicrograph of the fracture surface of Specimen GG5B–A
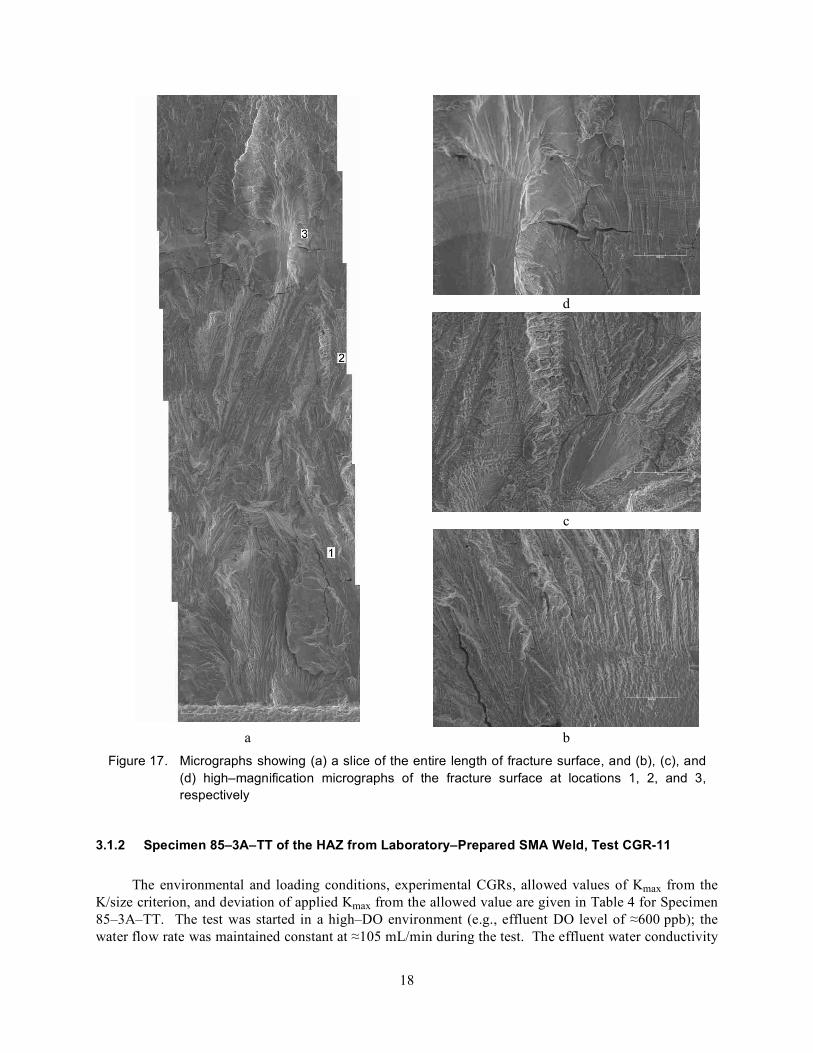
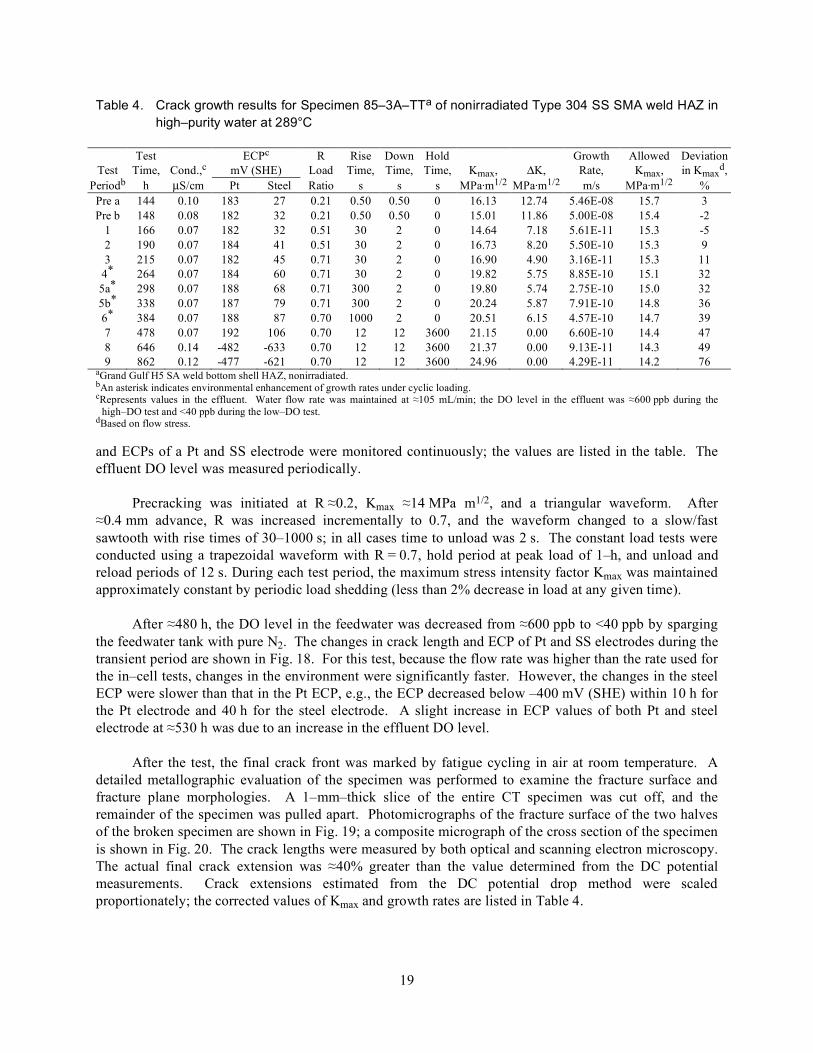
After the test both halves of the fractured specimen were cleaned chemically to remove the surface oxide film, and the fracture surface was examined by SEM. A micrograph of the fracture surface for Specimen GG5B–A is shown in Fig 16. Micrographs showing a slice of the entire crack advance during the CGR test and typical fracture morphology at select locations on the surface are shown in Fig. 17a–d. A predominantly transgranular (TG) fracture morphology is observed for the entire test. Most of the TG facets show a well–defined river pattern (Fig 17a). Also, a TG fracture with the river pattern is also observed from room–temperature cycling after the test (Fig. 17d) to mark the final crack front.
Figure 16. Micrograph of the fracture surface of Specimen GG5B–A tested in high–DO water at 289°C
18
3.1.2 Specimen 85–3A–TT of the HAZ from Laboratory–Prepared SMA Weld, Test CGR-11
The environmental and loading conditions, experimental CGRs, allowed values of Kmax from the K/size criterion, and deviation of applied Kmax from the allowed value are given in Table 4 for Specimen 85–3A–TT. The test was started in a high–DO environment (e.g., effluent DO level of ≈600 ppb); the water flow rate was maintained constant at ≈105 mL/min during the test. The effluent water conductivity
d
c
a b
Figure 17. Micrographs showing (a) a slice of the entire length of fracture surface, and (b), (c), and (d) high–magnification micrographs of the fracture surface at locations 1, 2, and 3, respectively
19
and ECPs of a Pt and SS electrode were monitored continuously; the values are listed in the table. The effluent DO level was measured periodically.
Precracking was initiated at R ≈0.2, Kmax ≈14 MPa m1/2, and a triangular waveform. After ≈0.4 mm advance, R was increased incrementally to 0.7, and the waveform changed to a slow/fast sawtooth with rise times of 30–1000 s; in all cases time to unload was 2 s. The constant load tests were conducted using a trapezoidal waveform with R = 0.7, hold period at peak load of 1–h, and unload and reload periods of 12 s. During each test period, the maximum stress intensity factor Kmax was maintained approximately constant by periodic load shedding (less than 2% decrease in load at any given time).
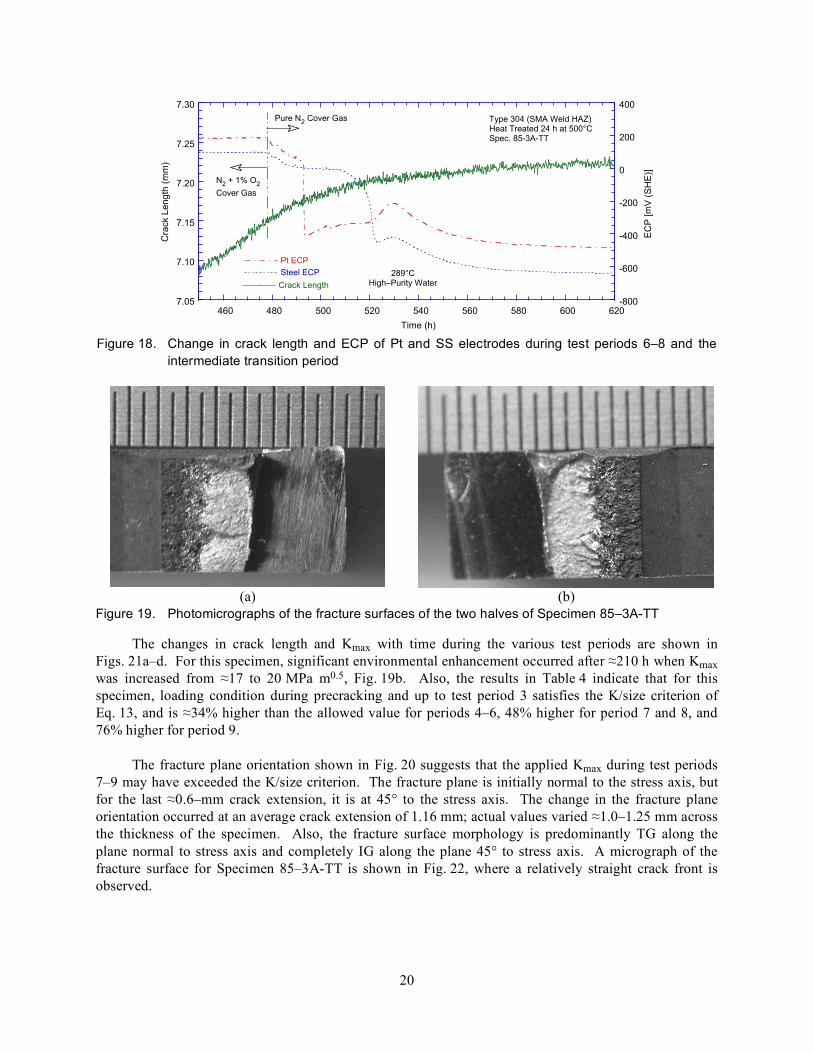
After ≈480 h, the DO level in the feedwater was decreased from ≈600 ppb to <40 ppb by sparging the feedwater tank with pure N2. The changes in crack length and ECP of Pt and SS electrodes during the transient period are shown in Fig. 18. For this test, because the flow rate was higher than the rate used for the in–cell tests, changes in the environment were significantly faster. However, the changes in the steel ECP were slower than that in the Pt ECP, e.g., the ECP decreased below –400 mV (SHE) within 10 h for the Pt electrode and 40 h for the steel electrode. A slight increase in ECP values of both Pt and steel electrode at ≈530 h was due to an increase in the effluent DO level.
After the test, the final crack front was marked by fatigue cycling in air at room temperature. A detailed metallographic evaluation of the specimen was performed to examine the fracture surface and fracture plane morphologies. A 1–mm–thick slice of the entire CT specimen was cut off, and the remainder of the specimen was pulled apart. Photomicrographs of the fracture surface of the two halves of the broken specimen are shown in Fig. 19; a composite micrograph of the cross section of the specimen is shown in Fig. 20. The crack lengths were measured by both optical and scanning electron microscopy. The actual final crack extension was ≈40% greater than the value determined from the DC potential measurements. Crack extensions estimated from the DC potential drop method were scaled proportionately; the corrected values of Kmax and growth rates are listed in Table 4.
Table 4. Crack growth results for Specimen 85–3A–TTa of nonirradiated Type 304 SS SMA weld HAZ in high–purity water at 289°C
Test
Test Time,
Cond.,c
ECPc mV (SHE)
R Load
Rise Time,
Down Time,
Hold Time,
Kmax,
ΔK,
Growth Rate,
Allowed Kmax,
Deviation in Kmax
d, Periodb h µS/cm Pt Steel Ratio s s s MPa·m1/2 MPa·m1/2 m/s MPa·m1/2 %
Pre a 144 0.10 183 27 0.21 0.50 0.50 0 16.13 12.74 5.46E-08 15.7 3 Pre b 148 0.08 182 32 0.21 0.50 0.50 0 15.01 11.86 5.00E-08 15.4 -2
1 166 0.07 182 32 0.51 30 2 0 14.64 7.18 5.61E-11 15.3 -5 2 190 0.07 184 41 0.51 30 2 0 16.73 8.20 5.50E-10 15.3 9 3 215 0.07 182 45 0.71 30 2 0 16.90 4.90 3.16E-11 15.3 11
4* 264 0.07 184 60 0.71 30 2 0 19.82 5.75 8.85E-10 15.1 32 5a* 298 0.07 188 68 0.71 300 2 0 19.80 5.74 2.75E-10 15.0 32 5b* 338 0.07 187 79 0.71 300 2 0 20.24 5.87 7.91E-10 14.8 36 6* 384 0.07 188 87 0.70 1000 2 0 20.51 6.15 4.57E-10 14.7 39 7 478 0.07 192 106 0.70 12 12 3600 21.15 0.00 6.60E-10 14.4 47 8 646 0.14 -482 -633 0.70 12 12 3600 21.37 0.00 9.13E-11 14.3 49 9 862 0.12 -477 -621 0.70 12 12 3600 24.96 0.00 4.29E-11 14.2 76
aGrand Gulf H5 SA weld bottom shell HAZ, nonirradiated. bAn asterisk indicates environmental enhancement of growth rates under cyclic loading. cRepresents values in the effluent. Water flow rate was maintained at ≈105 mL/min; the DO level in the effluent was ≈600 ppb during the
high–DO test and <40 ppb during the low–DO test. dBased on flow stress.
20
The changes in crack length and Kmax with time during the various test periods are shown in Figs. 21a–d. For this specimen, significant environmental enhancement occurred after ≈210 h when Kmax was increased from ≈17 to 20 MPa m0.5, Fig. 19b. Also, the results in Table 4 indicate that for this specimen, loading condition during precracking and up to test period 3 satisfies the K/size criterion of Eq. 13, and is ≈34% higher than the allowed value for periods 4–6, 48% higher for period 7 and 8, and 76% higher for period 9.
The fracture plane orientation shown in Fig. 20 suggests that the applied Kmax during test periods 7–9 may have exceeded the K/size criterion. The fracture plane is initially normal to the stress axis, but for the last ≈0.6–mm crack extension, it is at 45° to the stress axis. The change in the fracture plane orientation occurred at an average crack extension of 1.16 mm; actual values varied ≈1.0–1.25 mm across the thickness of the specimen. Also, the fracture surface morphology is predominantly TG along the plane normal to stress axis and completely IG along the plane 45° to stress axis. A micrograph of the fracture surface for Specimen 85–3A-TT is shown in Fig. 22, where a relatively straight crack front is observed.
7.05
7.10
7.15
7.20
7.25
7.30
-800
-600
-400
-200
0
200
400
460 480 500 520 540 560 580 600 620
Crack Length
Pt ECP
Steel ECP
Cra
ck L
en
gth
(m
m)
EC
P [
mV
(S
HE
)]
Time (h)
Type 304 (SMA Weld HAZ)Heat Treated 24 h at 500°CSpec. 85-3A-TT
289°CHigh–Purity Water
Pure N2 Cover Gas
N2 + 1% O
2
Cover Gas
Figure 18. Change in crack length and ECP of Pt and SS electrodes during test periods 6–8 and the
intermediate transition period
(a) (b)
Figure 19. Photomicrographs of the fracture surfaces of the two halves of Specimen 85–3A-TT
21
Figure 20. Micrograph of the cross section of Specimen 85-3A-TT showing the fracture plane profile
6.08
6.16
6.24
6.32
6.40
6.48
6.56
6.64
14
16
18
20
22
140 150 160 170 180 190 200 210 220
Cra
ck L
en
gth
(m
m)
Km
ax (
MP
a m
0.5
)Time (h)
SMA Weld HAZ (Heat Treated 24 h at 500°C)Spec. 85-3A-TT
289°C, High–Purity Water
DO !600 ppb, Conductivity 0.08 µS/cm
ECP Steel 40 mV, Pt 182 mV (SHE)
Kmax
Crack Length
CGR = 5.61 x 10⁻¹¹ m/s
Kmax
= 14.6 MPa m0.5
R = 0.51, Rise Time 30 s
5.50 x 10⁻¹⁰ m/s
16.7 MPa m0.5
0.51, 30 s
Precraking
3.16 x 10⁻¹¹ m/s
16.9 MPa m0.5
0.71, 30 s
(a)
6.50
6.60
6.70
6.80
6.90
7.00
16
18
20
22
24
26
240 280 320 360
Cra
ck L
en
gth
(m
m)
Km
ax (
MP
a m
0.5
)
Time (h)
SMA Weld HAZ (Heat Treated 24 h at 500°C)Spec. 85-3A-TT
289°C, High–Purity Water
DO !600 ppb, Conductivity 0.08 µS/cm
ECP Steel 80 mV, Pt 188 mV (SHE)
Kmax
Crack Length
CGR = 8.85 x 10⁻¹⁰ m/s
Kmax
= 19.8 MPa m0.5
R = 0.71, Rise Time 30 s
7.91 x 10⁻¹⁰ m/s
20.2 MPa m0.5
0.71, 300 s4.57 x 10–10 m/s
20.5 MPa m0.5
0.71, 1000 s
(b)
Figure 21. Crack–length–vs.–time plots for nonirradiated Type 304L bottom shell HAZ from the GG H5 weld in high–purity water at 289°C during test periods (a) 1–3, (b) 4-6, (c) 7–8, and (d) 9.
22
6.80
6.90
7.00
7.10
7.20
7.30
18
19
20
21
22
23
24
25
26
400 450 500 550 600 650
Cra
ck L
en
gth
(m
m)
Km
ax (
MP
a m
0.5
)
Time (h)
SMA Weld HAZ (Heat Treated 24 h at 500°C)Spec. 85-3A-TT
289°C, High–Purity WaterConstant Load with Periodic Unloading
to R = 0.7 in 24 s every 1 h
Kmax
Crack Length
Pure N2
N2 + 1% O
2
CGR = 9.13 x 10⁻¹¹ m/s
Kmax
= 21.4 MPa m0.5
DO <40 ppb, Conductivity 0.14 µS/cm
ECP Steel -630 mV, Pt -480 mV (SHE)
CGR = 6.60 x 10⁻¹⁰ m/s
Kmax
= 21.2 MPa m0.5
DO !600 ppb, Conductivity 0.07 µS/cm
ECP Steel 105 mV, Pt 190 mV (SHE)
(c)
7.15
7.20
7.25
7.30
7.35
7.40
7.45
20
21
22
23
24
25
26
27
28
650 700 750 800 850 900
Cra
ck L
ength
(m
m)
Km
ax (
MP
a m
0.5
)
Time (h)
SMA Weld HAZ (Heat Treated 24 h at 500°C)Spec. 85-3A-TT
289°C, High–Purity WaterConstant Load with Periodic Unloading
to R = 0.7 in 24 s every 1 h
Kmax
Crack Length
CGR = 4.29 x 10⁻¹¹ m/s
Kmax
= 25.0 MPa m0.5
DO <40 ppb, Conductivity 0.12 µS/cm
ECP Steel –630 mV, Pt –480 mV (SHE)
(d)
Figure 21. (Contd.)
Figure 22. Micrograph of the fracture surface of Specimen 85-3A-TT tested in high–DO water at 289°C
23
d
c
a b
Figure 23. Micrograph showing (a) a slice of the fracture surface that was perpendicular to the stress axis, and (b), (c), and (d) high–magnification micrographs of the fracture surface at locations 1, 2, and 3, respectively.
The specimen was cleaned chemically to remove the surface oxide film before micrographic examination. Figure 23 presents micrographs of a slice of the fracture surface that is normal to the stress axis and shows typical fracture morphologies at select locations on the surface. The fracture surface exhibits a predominantly TG fracture morphology, and most of the TG facets show a well–defined river pattern (Fig. 23c, d). A narrow region of IG fracture appears before the fracture plane orientation changes along the plane 45° to the stress axis. Typical fracture morphologies along the change in the fracture plane orientation and before and after the change are shown in Fig. 24.
24
(a) (b)
(c) (d)
(e) (f)
Figure 24. Typical fracture morphologies (a, b) along the change in the fracture plane direction and (c, d) before and (e, f) after the change in direction
25
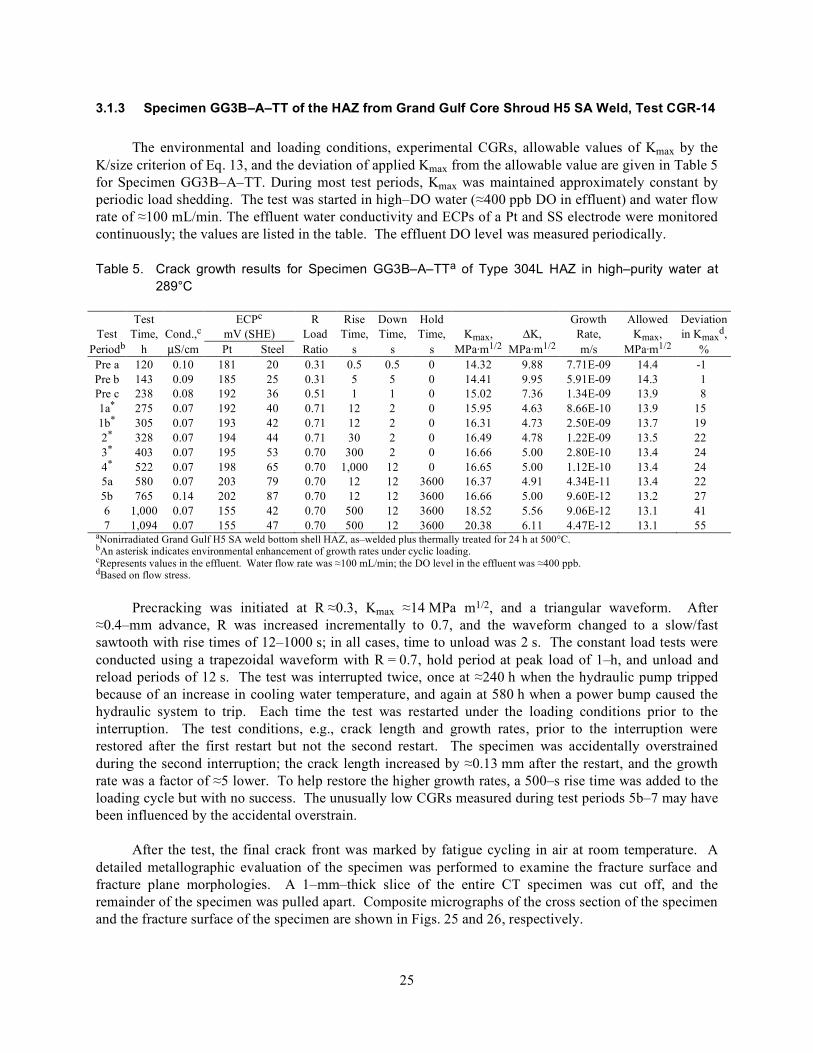
3.1.3 Specimen GG3B–A–TT of the HAZ from Grand Gulf Core Shroud H5 SA Weld, Test CGR-14
The environmental and loading conditions, experimental CGRs, allowable values of Kmax by the K/size criterion of Eq. 13, and the deviation of applied Kmax from the allowable value are given in Table 5 for Specimen GG3B–A–TT. During most test periods, Kmax was maintained approximately constant by periodic load shedding. The test was started in high–DO water (≈400 ppb DO in effluent) and water flow rate of ≈100 mL/min. The effluent water conductivity and ECPs of a Pt and SS electrode were monitored continuously; the values are listed in the table. The effluent DO level was measured periodically.
Table 5. Crack growth results for Specimen GG3B–A–TTa of Type 304L HAZ in high–purity water at 289°C
Test
Test Time,
Cond.,c
ECPc mV (SHE)
R Load
Rise Time,
Down Time,
Hold Time,
Kmax,
ΔK,
Growth Rate,
Allowed Kmax,
Deviation in Kmax
d, Periodb h µS/cm Pt Steel Ratio s s s MPa·m1/2 MPa·m1/2 m/s MPa·m1/2 % Pre a 120 0.10 181 20 0.31 0.5 0.5 0 14.32 9.88 7.71E-09 14.4 -1 Pre b 143 0.09 185 25 0.31 5 5 0 14.41 9.95 5.91E-09 14.3 1 Pre c 238 0.08 192 36 0.51 1 1 0 15.02 7.36 1.34E-09 13.9 8 1a* 275 0.07 192 40 0.71 12 2 0 15.95 4.63 8.66E-10 13.9 15 1b* 305 0.07 193 42 0.71 12 2 0 16.31 4.73 2.50E-09 13.7 19 2* 328 0.07 194 44 0.71 30 2 0 16.49 4.78 1.22E-09 13.5 22 3* 403 0.07 195 53 0.70 300 2 0 16.66 5.00 2.80E-10 13.4 24 4* 522 0.07 198 65 0.70 1,000 12 0 16.65 5.00 1.12E-10 13.4 24 5a 580 0.07 203 79 0.70 12 12 3600 16.37 4.91 4.34E-11 13.4 22 5b 765 0.14 202 87 0.70 12 12 3600 16.66 5.00 9.60E-12 13.2 27 6 1,000 0.07 155 42 0.70 500 12 3600 18.52 5.56 9.06E-12 13.1 41 7 1,094 0.07 155 47 0.70 500 12 3600 20.38 6.11 4.47E-12 13.1 55
aNonirradiated Grand Gulf H5 SA weld bottom shell HAZ, as–welded plus thermally treated for 24 h at 500°C. bAn asterisk indicates environmental enhancement of growth rates under cyclic loading. cRepresents values in the effluent. Water flow rate was ≈100 mL/min; the DO level in the effluent was ≈400 ppb. dBased on flow stress.
Precracking was initiated at R ≈0.3, Kmax ≈14 MPa m1/2, and a triangular waveform. After ≈0.4–mm advance, R was increased incrementally to 0.7, and the waveform changed to a slow/fast sawtooth with rise times of 12–1000 s; in all cases, time to unload was 2 s. The constant load tests were conducted using a trapezoidal waveform with R = 0.7, hold period at peak load of 1–h, and unload and reload periods of 12 s. The test was interrupted twice, once at ≈240 h when the hydraulic pump tripped because of an increase in cooling water temperature, and again at 580 h when a power bump caused the hydraulic system to trip. Each time the test was restarted under the loading conditions prior to the interruption. The test conditions, e.g., crack length and growth rates, prior to the interruption were restored after the first restart but not the second restart. The specimen was accidentally overstrained during the second interruption; the crack length increased by ≈0.13 mm after the restart, and the growth rate was a factor of ≈5 lower. To help restore the higher growth rates, a 500–s rise time was added to the loading cycle but with no success. The unusually low CGRs measured during test periods 5b–7 may have been influenced by the accidental overstrain.
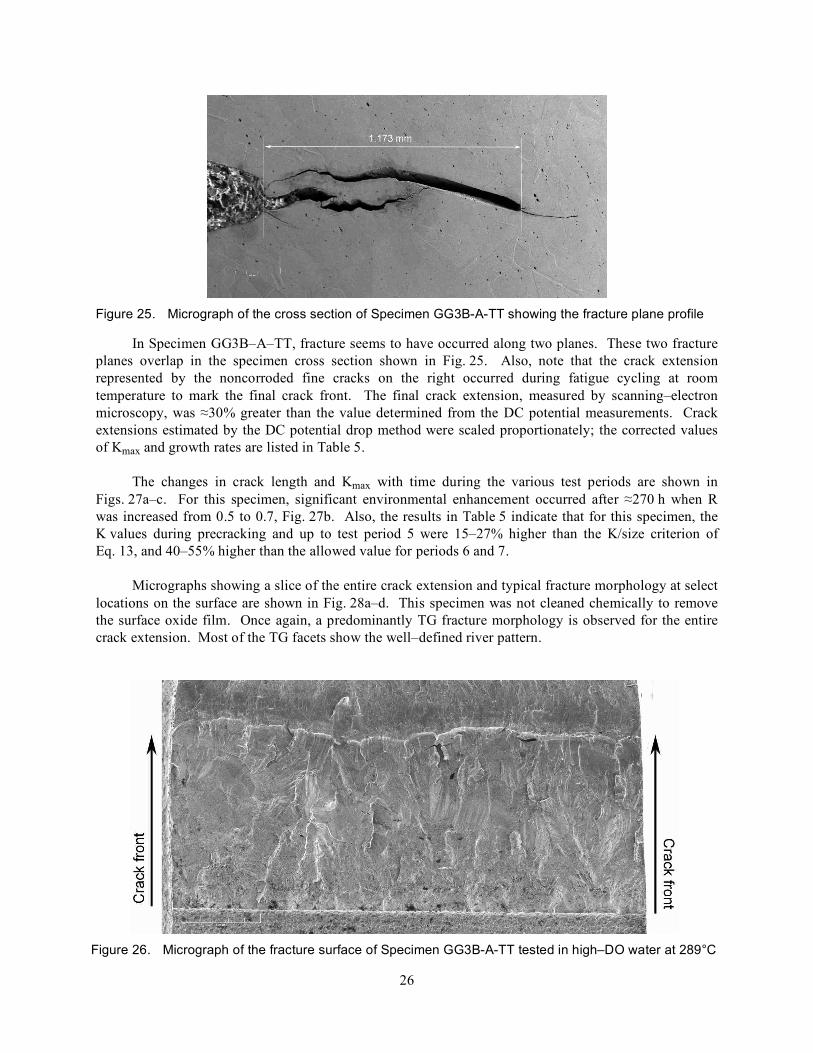
After the test, the final crack front was marked by fatigue cycling in air at room temperature. A detailed metallographic evaluation of the specimen was performed to examine the fracture surface and fracture plane morphologies. A 1–mm–thick slice of the entire CT specimen was cut off, and the remainder of the specimen was pulled apart. Composite micrographs of the cross section of the specimen and the fracture surface of the specimen are shown in Figs. 25 and 26, respectively.
26
In Specimen GG3B–A–TT, fracture seems to have occurred along two planes. These two fracture planes overlap in the specimen cross section shown in Fig. 25. Also, note that the crack extension represented by the noncorroded fine cracks on the right occurred during fatigue cycling at room temperature to mark the final crack front. The final crack extension, measured by scanning–electron microscopy, was ≈30% greater than the value determined from the DC potential measurements. Crack extensions estimated by the DC potential drop method were scaled proportionately; the corrected values of Kmax and growth rates are listed in Table 5.
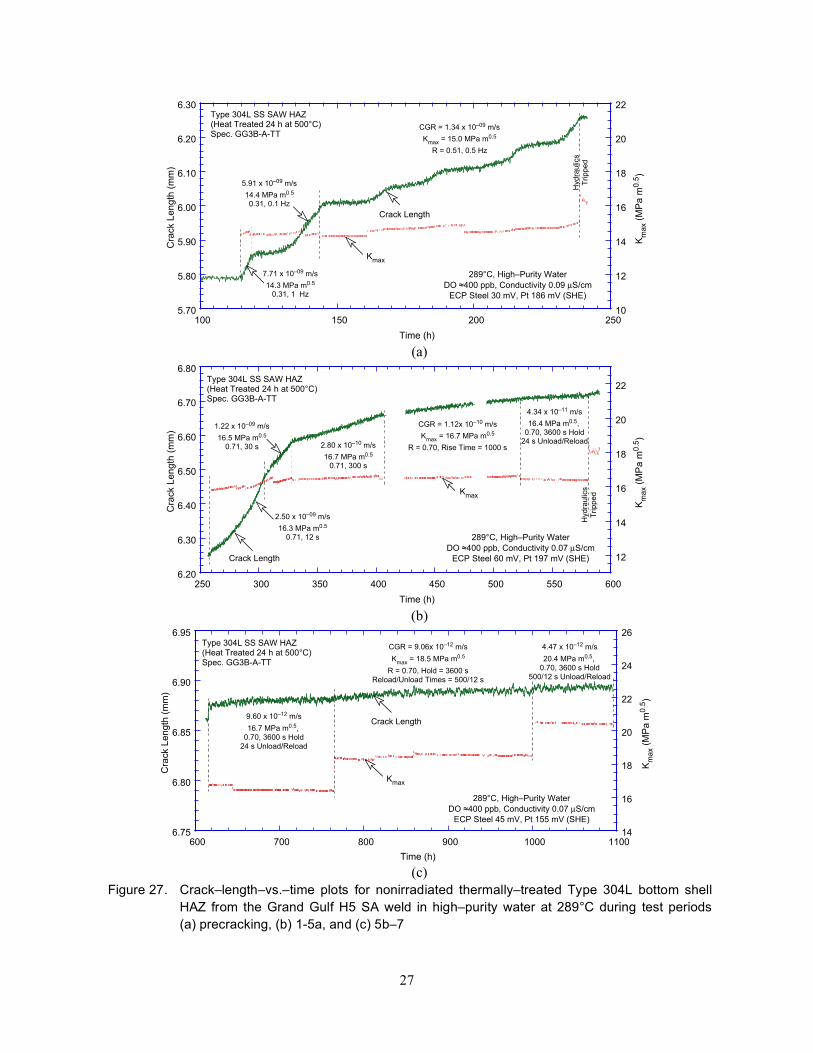
The changes in crack length and Kmax with time during the various test periods are shown in Figs. 27a–c. For this specimen, significant environmental enhancement occurred after ≈270 h when R was increased from 0.5 to 0.7, Fig. 27b. Also, the results in Table 5 indicate that for this specimen, the K values during precracking and up to test period 5 were 15–27% higher than the K/size criterion of Eq. 13, and 40–55% higher than the allowed value for periods 6 and 7.
Micrographs showing a slice of the entire crack extension and typical fracture morphology at select locations on the surface are shown in Fig. 28a–d. This specimen was not cleaned chemically to remove the surface oxide film. Once again, a predominantly TG fracture morphology is observed for the entire crack extension. Most of the TG facets show the well–defined river pattern.
Figure 25. Micrograph of the cross section of Specimen GG3B-A-TT showing the fracture plane profile
Figure 26. Micrograph of the fracture surface of Specimen GG3B-A-TT tested in high–DO water at 289°C
27
5.70
5.80
5.90
6.00
6.10
6.20
6.30
10
12
14
16
18
20
22
100 150 200 250
Cra
ck L
ength
(m
m)
Km
ax (
MP
a m
0.5
)
Time (h)
Type 304L SS SAW HAZ (Heat Treated 24 h at 500°C)Spec. GG3B-A-TT
289°C, High–Purity Water
DO !400 ppb, Conductivity 0.09 µS/cm
ECP Steel 30 mV, Pt 186 mV (SHE)
Kmax
Crack Length
CGR = 1.34 x 10–09 m/s
Kmax
= 15.0 MPa m0.5
R = 0.51, 0.5 Hz
7.71 x 10–09 m/s
14.3 MPa m0.5
0.31, 1 Hz
5.91 x 10–09 m/s
14.4 MPa m0.5
0.31, 0.1 Hz
Hyd
rau
lics
Trip
pe
d
(a)
6.20
6.30
6.40
6.50
6.60
6.70
6.80
12
14
16
18
20
22
250 300 350 400 450 500 550 600
Cra
ck L
ength
(m
m)
Km
ax (
MP
a m
0.5
)
Time (h)
Type 304L SS SAW HAZ (Heat Treated 24 h at 500°C)Spec. GG3B-A-TT
289°C, High–Purity Water
DO !400 ppb, Conductivity 0.07 µS/cm
ECP Steel 60 mV, Pt 197 mV (SHE)
Kmax
Crack Length
CGR = 1.12x 10⁻¹⁰ m/s
Kmax
= 16.7 MPa m0.5
R = 0.70, Rise Time = 1000 s
2.50 x 10–09 m/s
16.3 MPa m0.5
0.71, 12 s
Hyd
rau
lics
Trip
pe
d
4.34 x 10⁻¹¹ m/s
16.4 MPa m0.5, 0.70, 3600 s Hold
24 s Unload/Reload
1.22 x 10–09 m/s
16.5 MPa m0.5
0.71, 30 s 2.80 x 10⁻¹⁰ m/s
16.7 MPa m0.5
0.71, 300 s
(b)
6.75
6.80
6.85
6.90
6.95
14
16
18
20
22
24
26
600 700 800 900 1000 1100
Cra
ck L
ength
(m
m)
Km
ax (
MP
a m
0.5
)
Time (h)
Type 304L SS SAW HAZ (Heat Treated 24 h at 500°C)Spec. GG3B-A-TT
289°C, High–Purity Water
DO !400 ppb, Conductivity 0.07 µS/cm
ECP Steel 45 mV, Pt 155 mV (SHE)
Kmax
Crack Length
CGR = 9.06x 10⁻¹² m/s
Kmax
= 18.5 MPa m0.5
R = 0.70, Hold = 3600 sReload/Unload Times = 500/12 s
4.47 x 10⁻¹² m/s
20.4 MPa m0.5, 0.70, 3600 s Hold
500/12 s Unload/Reload
9.60 x 10⁻¹² m/s
16.7 MPa m0.5, 0.70, 3600 s Hold
24 s Unload/Reload
(c)
Figure 27. Crack–length–vs.–time plots for nonirradiated thermally–treated Type 304L bottom shell HAZ from the Grand Gulf H5 SA weld in high–purity water at 289°C during test periods (a) precracking, (b) 1-5a, and (c) 5b–7
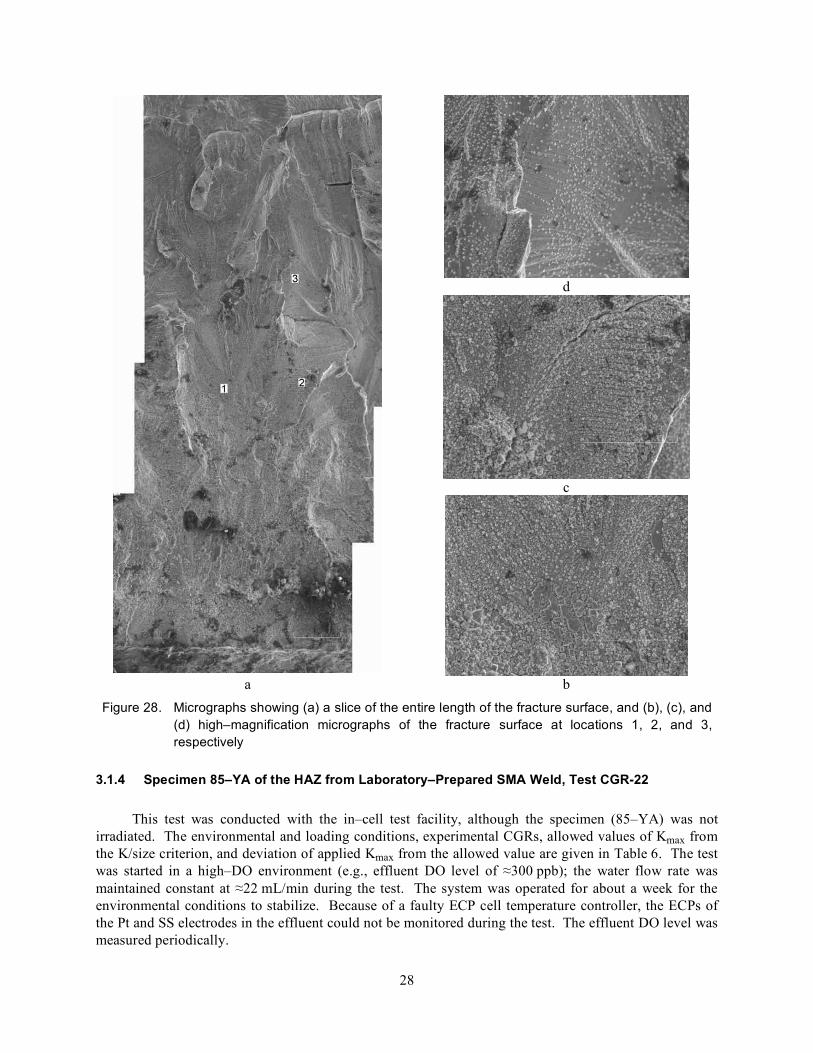
28
d
c
a b
Figure 28. Micrographs showing (a) a slice of the entire length of the fracture surface, and (b), (c), and (d) high–magnification micrographs of the fracture surface at locations 1, 2, and 3, respectively
3.1.4 Specimen 85–YA of the HAZ from Laboratory–Prepared SMA Weld, Test CGR-22
This test was conducted with the in–cell test facility, although the specimen (85–YA) was not irradiated. The environmental and loading conditions, experimental CGRs, allowed values of Kmax from the K/size criterion, and deviation of applied Kmax from the allowed value are given in Table 6. The test was started in a high–DO environment (e.g., effluent DO level of ≈300 ppb); the water flow rate was maintained constant at ≈22 mL/min during the test. The system was operated for about a week for the environmental conditions to stabilize. Because of a faulty ECP cell temperature controller, the ECPs of the Pt and SS electrodes in the effluent could not be monitored during the test. The effluent DO level was measured periodically.
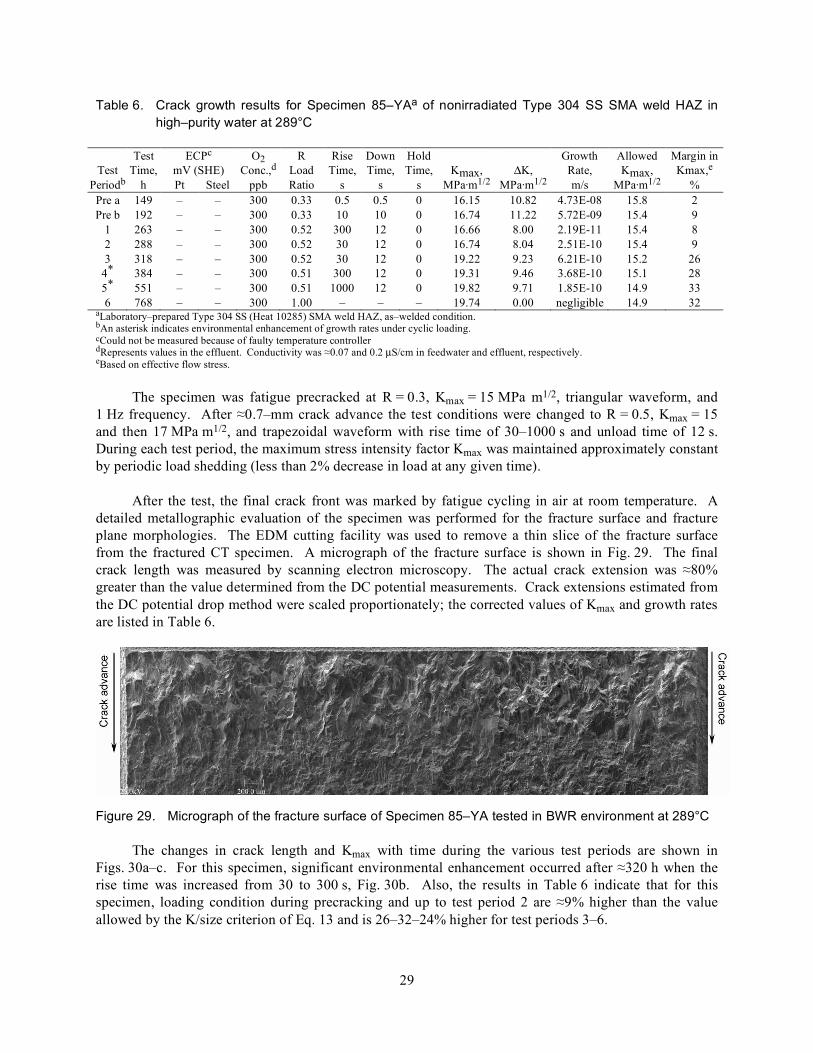
29
Table 6. Crack growth results for Specimen 85–YAa of nonirradiated Type 304 SS SMA weld HAZ in high–purity water at 289°C
Test
Test Time,
ECPc mV (SHE)
O2 Conc.,d
R Load
Rise Time,
Down Time,
Hold Time,
Kmax,
ΔK,
Growth Rate,
Allowed Kmax,
Margin in Kmax,e
Periodb h Pt Steel ppb Ratio s s s MPa·m1/2 MPa·m1/2 m/s MPa·m1/2 % Pre a 149 – – 300 0.33 0.5 0.5 0 16.15 10.82 4.73E-08 15.8 2 Pre b 192 – – 300 0.33 10 10 0 16.74 11.22 5.72E-09 15.4 9
1 263 – – 300 0.52 300 12 0 16.66 8.00 2.19E-11 15.4 8 2 288 – – 300 0.52 30 12 0 16.74 8.04 2.51E-10 15.4 9 3 318 – – 300 0.52 30 12 0 19.22 9.23 6.21E-10 15.2 26
4* 384 – – 300 0.51 300 12 0 19.31 9.46 3.68E-10 15.1 28 5* 551 – – 300 0.51 1000 12 0 19.82 9.71 1.85E-10 14.9 33 6 768 – – 300 1.00 – – – 19.74 0.00 negligible 14.9 32
aLaboratory–prepared Type 304 SS (Heat 10285) SMA weld HAZ, as–welded condition. bAn asterisk indicates environmental enhancement of growth rates under cyclic loading. cCould not be measured because of faulty temperature controller dRepresents values in the effluent. Conductivity was ≈0.07 and 0.2 µS/cm in feedwater and effluent, respectively. eBased on effective flow stress.
The specimen was fatigue precracked at R = 0.3, Kmax = 15 MPa m1/2, triangular waveform, and 1 Hz frequency. After ≈0.7–mm crack advance the test conditions were changed to R = 0.5, Kmax = 15 and then 17 MPa m1/2, and trapezoidal waveform with rise time of 30–1000 s and unload time of 12 s. During each test period, the maximum stress intensity factor Kmax was maintained approximately constant by periodic load shedding (less than 2% decrease in load at any given time).
After the test, the final crack front was marked by fatigue cycling in air at room temperature. A detailed metallographic evaluation of the specimen was performed for the fracture surface and fracture plane morphologies. The EDM cutting facility was used to remove a thin slice of the fracture surface from the fractured CT specimen. A micrograph of the fracture surface is shown in Fig. 29. The final crack length was measured by scanning electron microscopy. The actual crack extension was ≈80% greater than the value determined from the DC potential measurements. Crack extensions estimated from the DC potential drop method were scaled proportionately; the corrected values of Kmax and growth rates are listed in Table 6.
Figure 29. Micrograph of the fracture surface of Specimen 85–YA tested in BWR environment at 289°C
The changes in crack length and Kmax with time during the various test periods are shown in Figs. 30a–c. For this specimen, significant environmental enhancement occurred after ≈320 h when the rise time was increased from 30 to 300 s, Fig. 30b. Also, the results in Table 6 indicate that for this specimen, loading condition during precracking and up to test period 2 are ≈9% higher than the value allowed by the K/size criterion of Eq. 13 and is 26–32–24% higher for test periods 3–6.
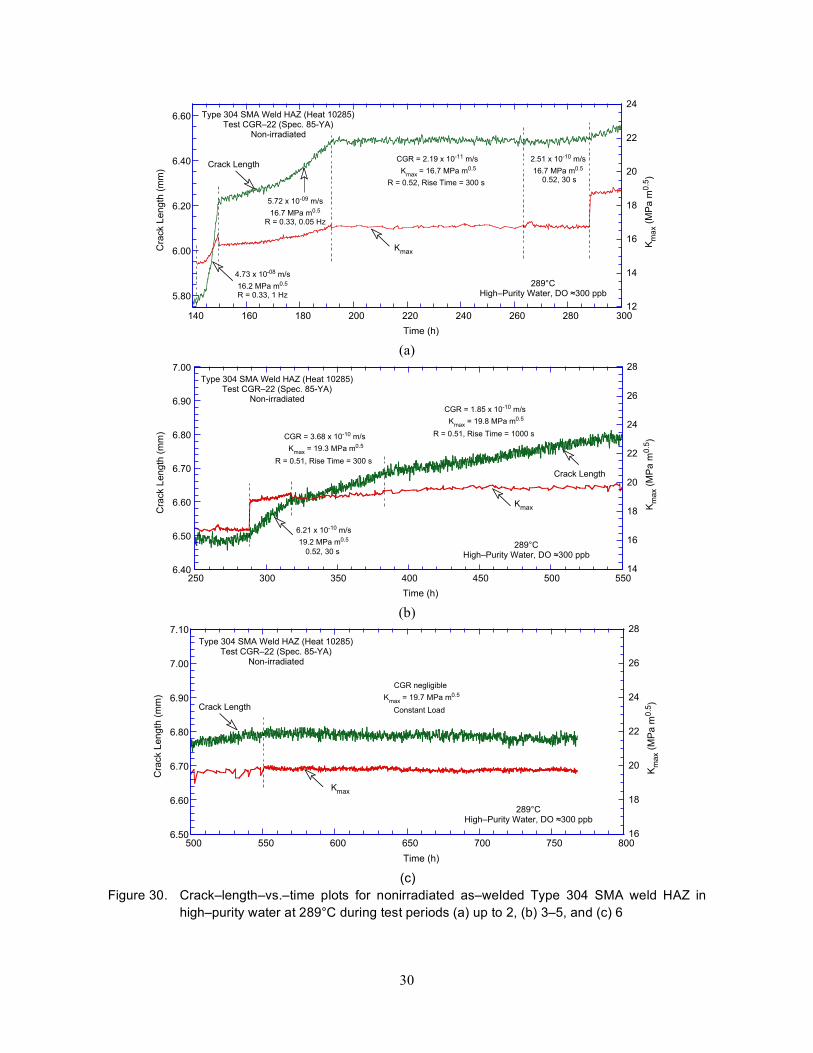
30
5.80
6.00
6.20
6.40
6.60
12
14
16
18
20
22
24
140 160 180 200 220 240 260 280 300
Cra
ck L
ength
(m
m)
Km
ax (
MP
a m
0.5
)
Time (h)
Type 304 SMA Weld HAZ (Heat 10285)Test CGR–22 (Spec. 85-YA)
Non-irradiated
289°CHigh–Purity Water, DO !300 ppb
Kmax
Crack LengthCGR = 2.19 x 10⁻¹¹ m/s
Kmax
= 16.7 MPa m0.5
R = 0.52, Rise Time = 300 s
5.72 x 10-09 m/s
16.7 MPa m0.5
R = 0.33, 0.05 Hz
4.73 x 10-08 m/s
16.2 MPa m0.5
R = 0.33, 1 Hz
2.51 x 10⁻¹⁰ m/s
16.7 MPa m0.5
0.52, 30 s
(a)
6.40
6.50
6.60
6.70
6.80
6.90
7.00
14
16
18
20
22
24
26
28
250 300 350 400 450 500 550
Cra
ck L
ength
(m
m)
Km
ax (
MP
a m
0.5
)
Time (h)
Type 304 SMA Weld HAZ (Heat 10285)Test CGR–22 (Spec. 85-YA)
Non-irradiated
289°CHigh–Purity Water, DO !300 ppb
Kmax
Crack Length
CGR = 3.68 x 10⁻¹⁰ m/s
Kmax
= 19.3 MPa m0.5
R = 0.51, Rise Time = 300 s
6.21 x 10⁻¹⁰ m/s
19.2 MPa m0.5
0.52, 30 s
CGR = 1.85 x 10⁻¹⁰ m/s
Kmax
= 19.8 MPa m0.5
R = 0.51, Rise Time = 1000 s
(b)
6.50
6.60
6.70
6.80
6.90
7.00
7.10
16
18
20
22
24
26
28
500 550 600 650 700 750 800
Cra
ck L
en
gth
(m
m)
Km
ax (
MP
a m
0.5
)
Time (h)
Type 304 SMA Weld HAZ (Heat 10285)Test CGR–22 (Spec. 85-YA)
Non-irradiated
289°CHigh–Purity Water, DO !300 ppb
Kmax
Crack Length
CGR negligible
Kmax
= 19.7 MPa m0.5
Constant Load
(c)
Figure 30. Crack–length–vs.–time plots for nonirradiated as–welded Type 304 SMA weld HAZ in high–purity water at 289°C during test periods (a) up to 2, (b) 3–5, and (c) 6
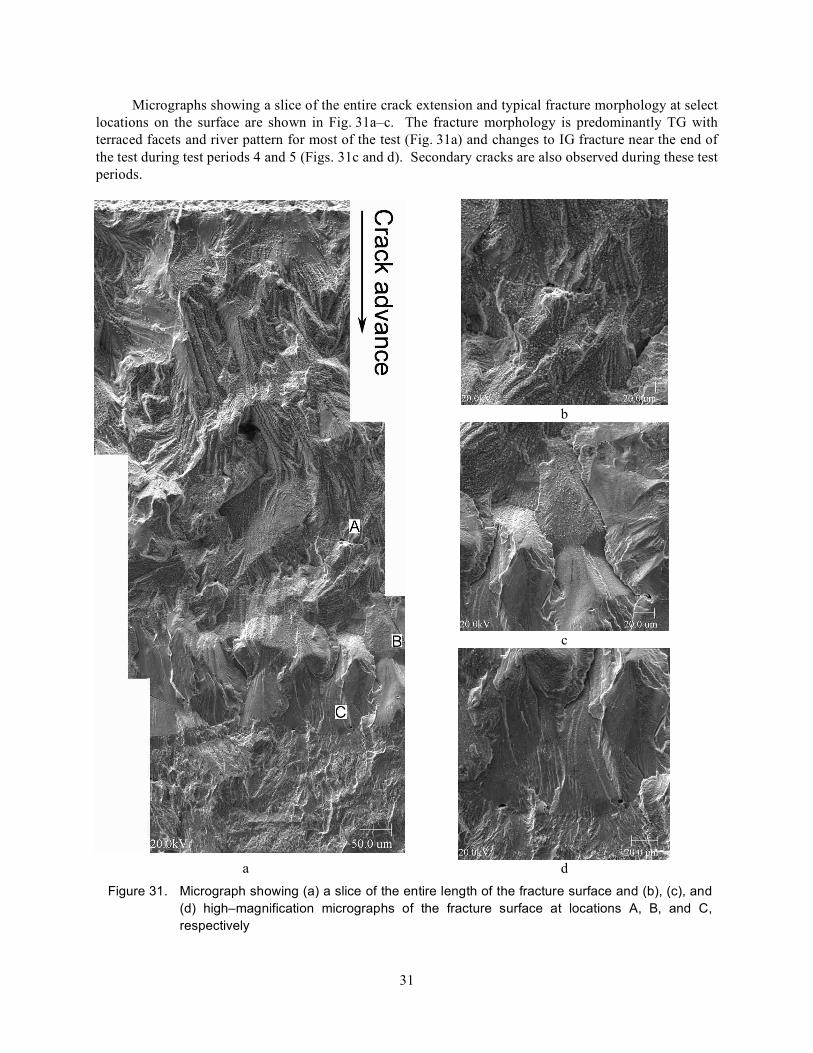
31
Micrographs showing a slice of the entire crack extension and typical fracture morphology at select locations on the surface are shown in Fig. 31a–c. The fracture morphology is predominantly TG with terraced facets and river pattern for most of the test (Fig. 31a) and changes to IG fracture near the end of the test during test periods 4 and 5 (Figs. 31c and d). Secondary cracks are also observed during these test periods.
b
c
a d
Figure 31. Micrograph showing (a) a slice of the entire length of the fracture surface and (b), (c), and (d) high–magnification micrographs of the fracture surface at locations A, B, and C, respectively
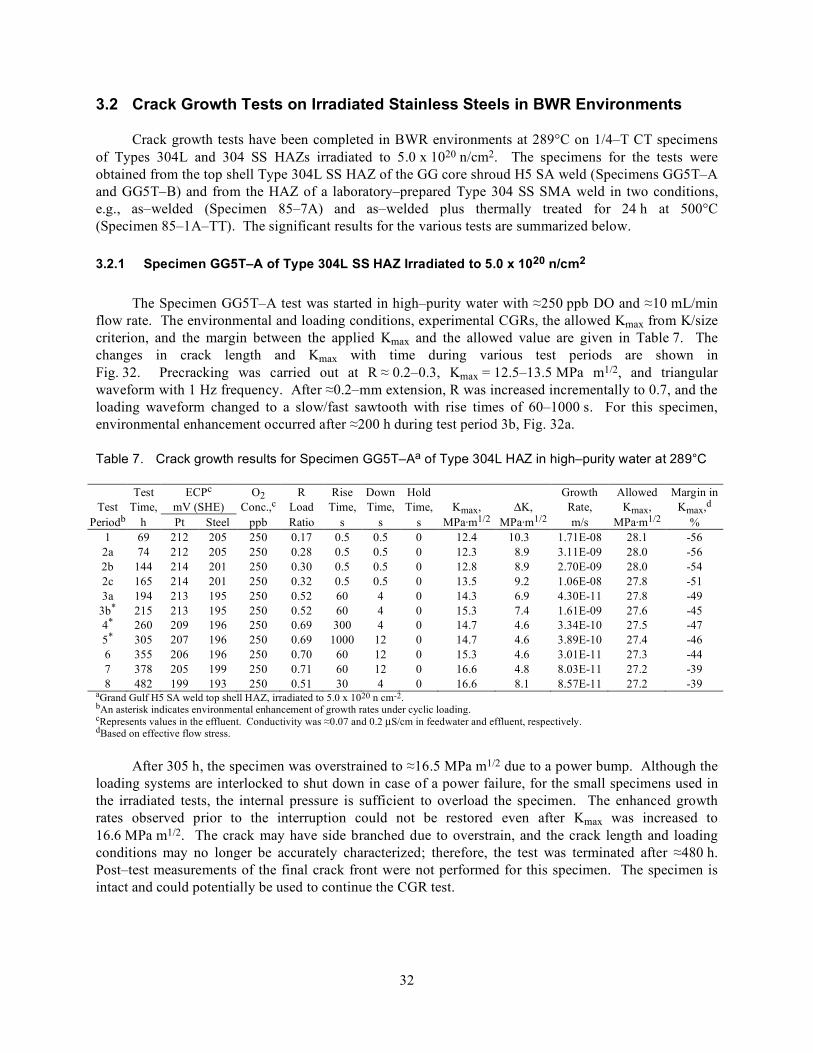
32
3.2 Crack Growth Tests on Irradiated Stainless Steels in BWR Environments
Crack growth tests have been completed in BWR environments at 289°C on 1/4–T CT specimens of Types 304L and 304 SS HAZs irradiated to 5.0 x 10²⁰ n/cm2. The specimens for the tests were obtained from the top shell Type 304L SS HAZ of the GG core shroud H5 SA weld (Specimens GG5T–A and GG5T–B) and from the HAZ of a laboratory–prepared Type 304 SS SMA weld in two conditions, e.g., as–welded (Specimen 85–7A) and as–welded plus thermally treated for 24 h at 500°C (Specimen 85–1A–TT). The significant results for the various tests are summarized below.
3.2.1 Specimen GG5T–A of Type 304L SS HAZ Irradiated to 5.0 x 10²⁰ n/cm2
The Specimen GG5T–A test was started in high–purity water with ≈250 ppb DO and ≈10 mL/min flow rate. The environmental and loading conditions, experimental CGRs, the allowed Kmax from K/size criterion, and the margin between the applied Kmax and the allowed value are given in Table 7. The changes in crack length and Kmax with time during various test periods are shown in Fig. 32. Precracking was carried out at R ≈ 0.2–0.3, Kmax = 12.5–13.5 MPa m1/2, and triangular waveform with 1 Hz frequency. After ≈0.2–mm extension, R was increased incrementally to 0.7, and the loading waveform changed to a slow/fast sawtooth with rise times of 60–1000 s. For this specimen, environmental enhancement occurred after ≈200 h during test period 3b, Fig. 32a.
Table 7. Crack growth results for Specimen GG5T–Aa of Type 304L HAZ in high–purity water at 289°C
Test
Test Time,
ECPc mV (SHE)
O2 Conc.,c
R Load
Rise Time,
Down Time,
Hold Time,
Kmax,
ΔK,
Growth Rate,
Allowed Kmax,
Margin in Kmax,d
Periodb h Pt Steel ppb Ratio s s s MPa·m1/2 MPa·m1/2 m/s MPa·m1/2 % 1 69 212 205 250 0.17 0.5 0.5 0 12.4 10.3 1.71E-08 28.1 -56 2a 74 212 205 250 0.28 0.5 0.5 0 12.3 8.9 3.11E-09 28.0 -56 2b 144 214 201 250 0.30 0.5 0.5 0 12.8 8.9 2.70E-09 28.0 -54 2c 165 214 201 250 0.32 0.5 0.5 0 13.5 9.2 1.06E-08 27.8 -51 3a 194 213 195 250 0.52 60 4 0 14.3 6.9 4.30E-11 27.8 -49
3b* 215 213 195 250 0.52 60 4 0 15.3 7.4 1.61E-09 27.6 -45 4* 260 209 196 250 0.69 300 4 0 14.7 4.6 3.34E-10 27.5 -47 5* 305 207 196 250 0.69 1000 12 0 14.7 4.6 3.89E-10 27.4 -46 6 355 206 196 250 0.70 60 12 0 15.3 4.6 3.01E-11 27.3 -44 7 378 205 199 250 0.71 60 12 0 16.6 4.8 8.03E-11 27.2 -39 8 482 199 193 250 0.51 30 4 0 16.6 8.1 8.57E-11 27.2 -39
aGrand Gulf H5 SA weld top shell HAZ, irradiated to 5.0 x 10²⁰ n cm-2. bAn asterisk indicates environmental enhancement of growth rates under cyclic loading. cRepresents values in the effluent. Conductivity was ≈0.07 and 0.2 µS/cm in feedwater and effluent, respectively. dBased on effective flow stress.
After 305 h, the specimen was overstrained to ≈16.5 MPa m1/2 due to a power bump. Although the loading systems are interlocked to shut down in case of a power failure, for the small specimens used in the irradiated tests, the internal pressure is sufficient to overload the specimen. The enhanced growth rates observed prior to the interruption could not be restored even after Kmax was increased to 16.6 MPa m1/2. The crack may have side branched due to overstrain, and the crack length and loading conditions may no longer be accurately characterized; therefore, the test was terminated after ≈480 h. Post–test measurements of the final crack front were not performed for this specimen. The specimen is intact and could potentially be used to continue the CGR test.
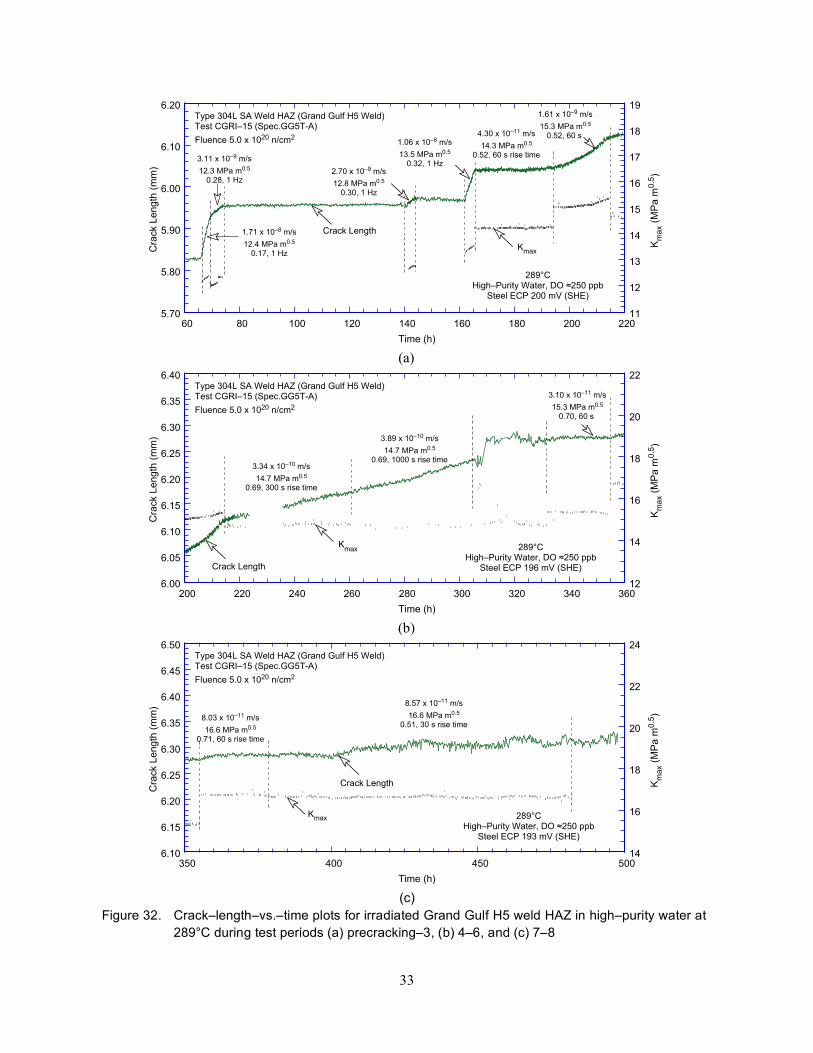
33
5.70
5.80
5.90
6.00
6.10
6.20
11
12
13
14
15
16
17
18
19
60 80 100 120 140 160 180 200 220
Cra
ck L
ength
(m
m)
Km
ax (
MP
a m
0.5
)
Time (h)
Type 304L SA Weld HAZ (Grand Gulf H5 Weld)Test CGRI–15 (Spec.GG5T-A)
Fluence 5.0 x 10²⁰ n/cm2
289°CHigh–Purity Water, DO !250 ppb
Steel ECP 200 mV (SHE)
Kmax
Crack Length
1.06 x 10⁻⁸ m/s
13.5 MPa m0.5
0.32, 1 Hz3.11 x 10–9 m/s
12.3 MPa m0.5
0.28, 1 Hz2.70 x 10–9 m/s
12.8 MPa m0.5
0.30, 1 Hz
1.71 x 10⁻⁸ m/s
12.4 MPa m0.5
0.17, 1 Hz
1.61 x 10⁻⁹ m/s
15.3 MPa m0.5
0.52, 60 s 4.30 x 10⁻¹¹ m/s
14.3 MPa m0.5
0.52, 60 s rise time
(a)
6.00
6.05
6.10
6.15
6.20
6.25
6.30
6.35
6.40
12
14
16
18
20
22
200 220 240 260 280 300 320 340 360
Cra
ck L
ength
(m
m)
Km
ax (
MP
a m
0.5
)
Time (h)
Type 304L SA Weld HAZ (Grand Gulf H5 Weld)Test CGRI–15 (Spec.GG5T-A)
Fluence 5.0 x 10²⁰ n/cm2
289°CHigh–Purity Water, DO !250 ppb
Steel ECP 196 mV (SHE)
Kmax
Crack Length
3.10 x 10⁻¹¹ m/s
15.3 MPa m0.5
0.70, 60 s
3.34 x 10⁻¹⁰ m/s
14.7 MPa m0.5
0.69, 300 s rise time
3.89 x 10⁻¹⁰ m/s
14.7 MPa m0.5
0.69, 1000 s rise time
(b)
6.10
6.15
6.20
6.25
6.30
6.35
6.40
6.45
6.50
14
16
18
20
22
24
350 400 450 500
Cra
ck L
ength
(m
m)
Km
ax (
MP
a m
0.5
)
Time (h)
Type 304L SA Weld HAZ (Grand Gulf H5 Weld)Test CGRI–15 (Spec.GG5T-A)
Fluence 5.0 x 10²⁰ n/cm2
289°CHigh–Purity Water, DO !250 ppb
Steel ECP 193 mV (SHE)
Kmax
Crack Length
8.57 x 10⁻¹¹ m/s
16.6 MPa m0.5
0.51, 30 s rise time8.03 x 10–11 m/s
16.6 MPa m0.5
0.71, 60 s rise time
(c)
Figure 32. Crack–length–vs.–time plots for irradiated Grand Gulf H5 weld HAZ in high–purity water at 289°C during test periods (a) precracking–3, (b) 4–6, and (c) 7–8
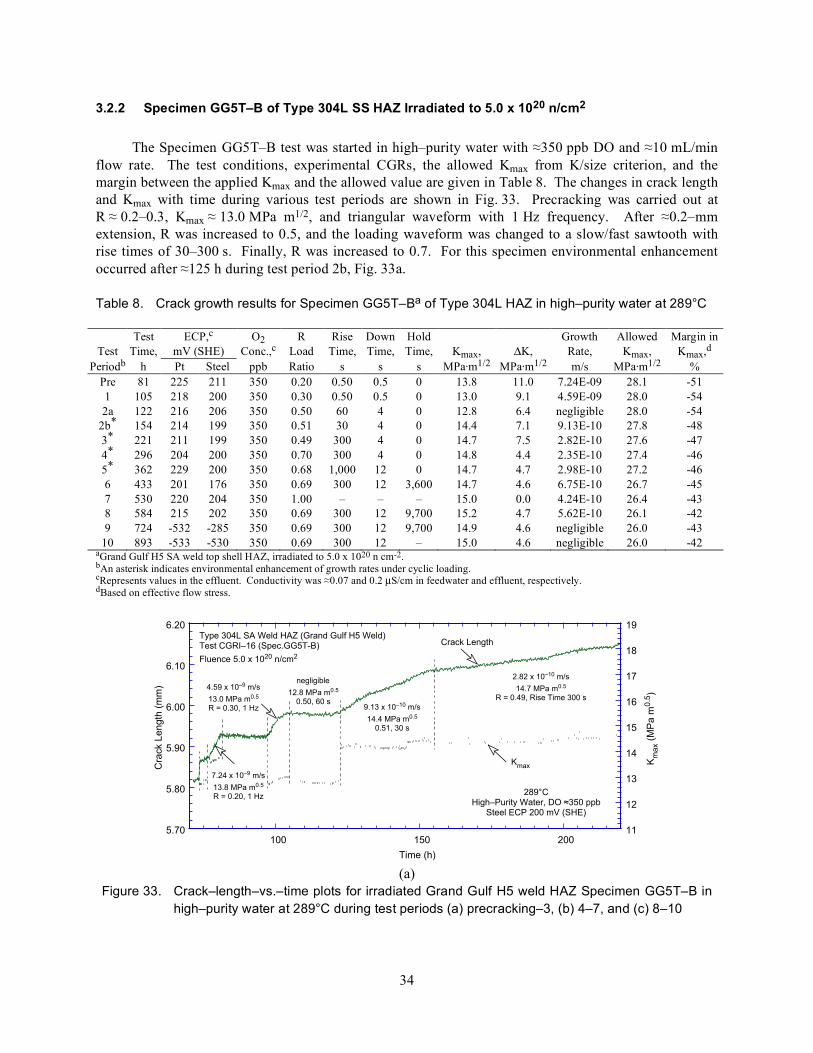
34
3.2.2 Specimen GG5T–B of Type 304L SS HAZ Irradiated to 5.0 x 10²⁰ n/cm2
The Specimen GG5T–B test was started in high–purity water with ≈350 ppb DO and ≈10 mL/min flow rate. The test conditions, experimental CGRs, the allowed Kmax from K/size criterion, and the margin between the applied Kmax and the allowed value are given in Table 8. The changes in crack length and Kmax with time during various test periods are shown in Fig. 33. Precracking was carried out at R ≈ 0.2–0.3, Kmax ≈ 13.0 MPa m1/2, and triangular waveform with 1 Hz frequency. After ≈0.2–mm extension, R was increased to 0.5, and the loading waveform was changed to a slow/fast sawtooth with rise times of 30–300 s. Finally, R was increased to 0.7. For this specimen environmental enhancement occurred after ≈125 h during test period 2b, Fig. 33a.
Table 8. Crack growth results for Specimen GG5T–Ba of Type 304L HAZ in high–purity water at 289°C
Test
Test Time,
ECP,c mV (SHE)
O2 Conc.,c
R Load
Rise Time,
Down Time,
Hold Time,
Kmax,
ΔK,
Growth Rate,
Allowed Kmax,
Margin in Kmax,d
Periodb h Pt Steel ppb Ratio s s s MPa·m1/2 MPa·m1/2 m/s MPa·m1/2 % Pre 81 225 211 350 0.20 0.50 0.5 0 13.8 11.0 7.24E-09 28.1 -51 1 105 218 200 350 0.30 0.50 0.5 0 13.0 9.1 4.59E-09 28.0 -54 2a 122 216 206 350 0.50 60 4 0 12.8 6.4 negligible 28.0 -54
2b* 154 214 199 350 0.51 30 4 0 14.4 7.1 9.13E-10 27.8 -48 3* 221 211 199 350 0.49 300 4 0 14.7 7.5 2.82E-10 27.6 -47 4* 296 204 200 350 0.70 300 4 0 14.8 4.4 2.35E-10 27.4 -46 5* 362 229 200 350 0.68 1,000 12 0 14.7 4.7 2.98E-10 27.2 -46 6 433 201 176 350 0.69 300 12 3,600 14.7 4.6 6.75E-10 26.7 -45 7 530 220 204 350 1.00 – – – 15.0 0.0 4.24E-10 26.4 -43 8 584 215 202 350 0.69 300 12 9,700 15.2 4.7 5.62E-10 26.1 -42 9 724 -532 -285 350 0.69 300 12 9,700 14.9 4.6 negligible 26.0 -43
10 893 -533 -530 350 0.69 300 12 – 15.0 4.6 negligible 26.0 -42 aGrand Gulf H5 SA weld top shell HAZ, irradiated to 5.0 x 10²⁰ n cm-2. bAn asterisk indicates environmental enhancement of growth rates under cyclic loading. cRepresents values in the effluent. Conductivity was ≈0.07 and 0.2 µS/cm in feedwater and effluent, respectively. dBased on effective flow stress.
5.70
5.80
5.90
6.00
6.10
6.20
11
12
13
14
15
16
17
18
19
100 150 200
Cra
ck L
en
gth
(m
m)
Km
ax (
MP
a m
0.5
)
Time (h)
Type 304L SA Weld HAZ (Grand Gulf H5 Weld)Test CGRI–16 (Spec.GG5T-B)
Fluence 5.0 x 10²⁰ n/cm2
289°CHigh–Purity Water, DO !350 ppb
Steel ECP 200 mV (SHE)
Kmax
Crack Length
9.13 x 10⁻¹⁰ m/s
14.4 MPa m0.5
0.51, 30 s
negligible
12.8 MPa m0.5
0.50, 60 s
7.24 x 10⁻⁹ m/s
13.8 MPa m0.5
R = 0.20, 1 Hz
2.82 x 10⁻¹⁰ m/s
14.7 MPa m0.5
R = 0.49, Rise Time 300 s
4.59 x 10⁻⁹ m/s
13.0 MPa m0.5
R = 0.30, 1 Hz
(a)
Figure 33. Crack–length–vs.–time plots for irradiated Grand Gulf H5 weld HAZ Specimen GG5T–B in high–purity water at 289°C during test periods (a) precracking–3, (b) 4–7, and (c) 8–10
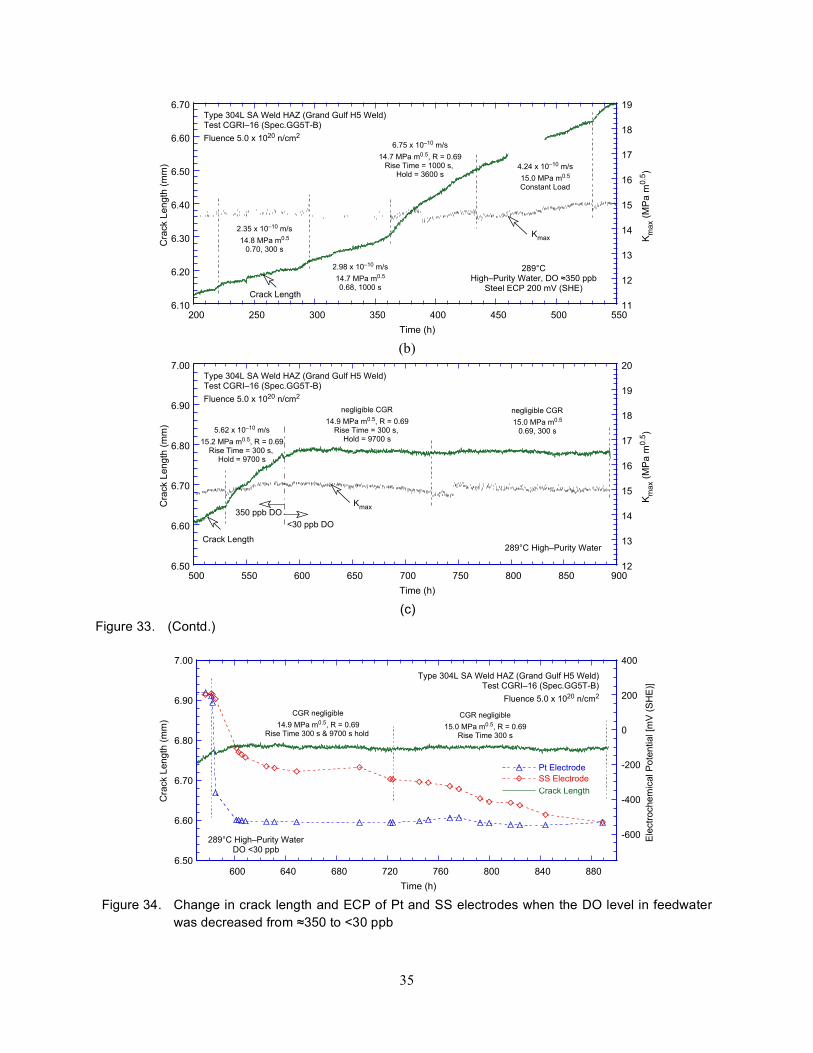
35
6.10
6.20
6.30
6.40
6.50
6.60
6.70
11
12
13
14
15
16
17
18
19
200 250 300 350 400 450 500 550
Cra
ck L
ength
(m
m)
Km
ax (
MP
a m
0.5
)
Time (h)
Type 304L SA Weld HAZ (Grand Gulf H5 Weld)Test CGRI–16 (Spec.GG5T-B)
Fluence 5.0 x 10²⁰ n/cm2
289°CHigh–Purity Water, DO !350 ppb
Steel ECP 200 mV (SHE)
Kmax
Crack Length
4.24 x 10⁻¹⁰ m/s
15.0 MPa m0.5
Constant Load
2.35 x 10⁻¹⁰ m/s
14.8 MPa m0.5
0.70, 300 s
2.98 x 10⁻¹⁰ m/s
14.7 MPa m0.5
0.68, 1000 s
6.75 x 10⁻¹⁰ m/s
14.7 MPa m0.5, R = 0.69Rise Time = 1000 s,
Hold = 3600 s
(b)
6.50
6.60
6.70
6.80
6.90
7.00
12
13
14
15
16
17
18
19
20
500 550 600 650 700 750 800 850 900
Cra
ck L
ength
(m
m)
Km
ax (
MP
a m
0.5
)
Time (h)
Type 304L SA Weld HAZ (Grand Gulf H5 Weld)Test CGRI–16 (Spec.GG5T-B)
Fluence 5.0 x 10²⁰ n/cm2
289°C High–Purity Water
Kmax
Crack Length
negligible CGR
15.0 MPa m0.5
0.69, 300 s5.62 x 10–10 m/s
15.2 MPa m0.5, R = 0.69Rise Time = 300 s,
Hold = 9700 s
negligible CGR
14.9 MPa m0.5, R = 0.69Rise Time = 300 s,
Hold = 9700 s
<30 ppb DO
350 ppb DO
(c)
Figure 33. (Contd.)
6.50
6.60
6.70
6.80
6.90
7.00
-600
-400
-200
0
200
400
600 640 680 720 760 800 840 880
Crack Length
Pt Electrode
SS Electrode
Cra
ck L
en
gth
(m
m)
Ele
ctr
och
em
ica
l P
ote
ntia
l [m
V (
SH
E)]
Time (h)
Type 304L SA Weld HAZ (Grand Gulf H5 Weld)Test CGRI–16 (Spec.GG5T-B)
Fluence 5.0 x 10²⁰ n/cm2
289°C High–Purity WaterDO <30 ppb
CGR negligible
14.9 MPa m0.5, R = 0.69Rise Time 300 s & 9700 s hold
CGR negligible
15.0 MPa m0.5, R = 0.69Rise Time 300 s
Figure 34. Change in crack length and ECP of Pt and SS electrodes when the DO level in feedwater
was decreased from ≈350 to <30 ppb
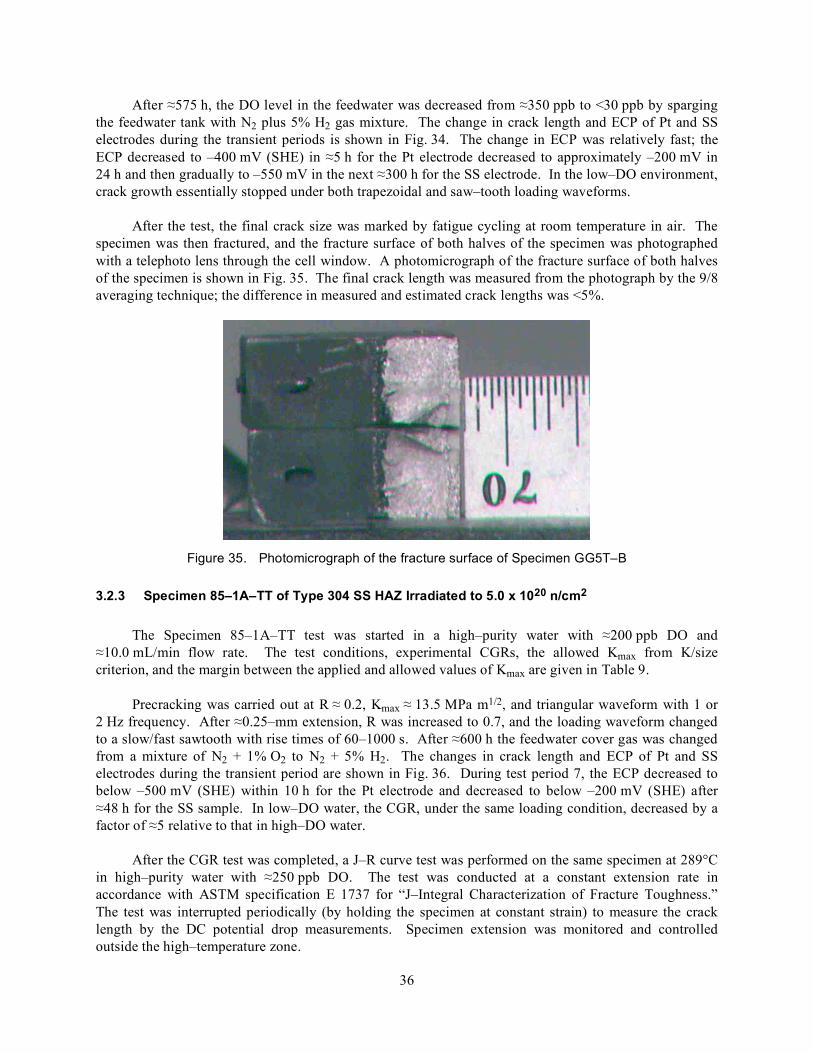
36
After ≈575 h, the DO level in the feedwater was decreased from ≈350 ppb to <30 ppb by sparging the feedwater tank with N2 plus 5% H2 gas mixture. The change in crack length and ECP of Pt and SS electrodes during the transient periods is shown in Fig. 34. The change in ECP was relatively fast; the ECP decreased to –400 mV (SHE) in ≈5 h for the Pt electrode decreased to approximately –200 mV in 24 h and then gradually to –550 mV in the next ≈300 h for the SS electrode. In the low–DO environment, crack growth essentially stopped under both trapezoidal and saw–tooth loading waveforms.
After the test, the final crack size was marked by fatigue cycling at room temperature in air. The specimen was then fractured, and the fracture surface of both halves of the specimen was photographed with a telephoto lens through the cell window. A photomicrograph of the fracture surface of both halves of the specimen is shown in Fig. 35. The final crack length was measured from the photograph by the 9/8 averaging technique; the difference in measured and estimated crack lengths was <5%.
Figure 35. Photomicrograph of the fracture surface of Specimen GG5T–B
3.2.3 Specimen 85–1A–TT of Type 304 SS HAZ Irradiated to 5.0 x 10²⁰ n/cm2
The Specimen 85–1A–TT test was started in a high–purity water with ≈200 ppb DO and ≈10.0 mL/min flow rate. The test conditions, experimental CGRs, the allowed Kmax from K/size criterion, and the margin between the applied and allowed values of Kmax are given in Table 9.
Precracking was carried out at R ≈ 0.2, Kmax ≈ 13.5 MPa m1/2, and triangular waveform with 1 or 2 Hz frequency. After ≈0.25–mm extension, R was increased to 0.7, and the loading waveform changed to a slow/fast sawtooth with rise times of 60–1000 s. After ≈600 h the feedwater cover gas was changed from a mixture of N2 + 1% O2 to N2 + 5% H2. The changes in crack length and ECP of Pt and SS electrodes during the transient period are shown in Fig. 36. During test period 7, the ECP decreased to below –500 mV (SHE) within 10 h for the Pt electrode and decreased to below –200 mV (SHE) after ≈48 h for the SS sample. In low–DO water, the CGR, under the same loading condition, decreased by a factor of ≈5 relative to that in high–DO water.
After the CGR test was completed, a J–R curve test was performed on the same specimen at 289°C in high–purity water with ≈250 ppb DO. The test was conducted at a constant extension rate in accordance with ASTM specification E 1737 for “J–Integral Characterization of Fracture Toughness.” The test was interrupted periodically (by holding the specimen at constant strain) to measure the crack length by the DC potential drop measurements. Specimen extension was monitored and controlled outside the high–temperature zone.
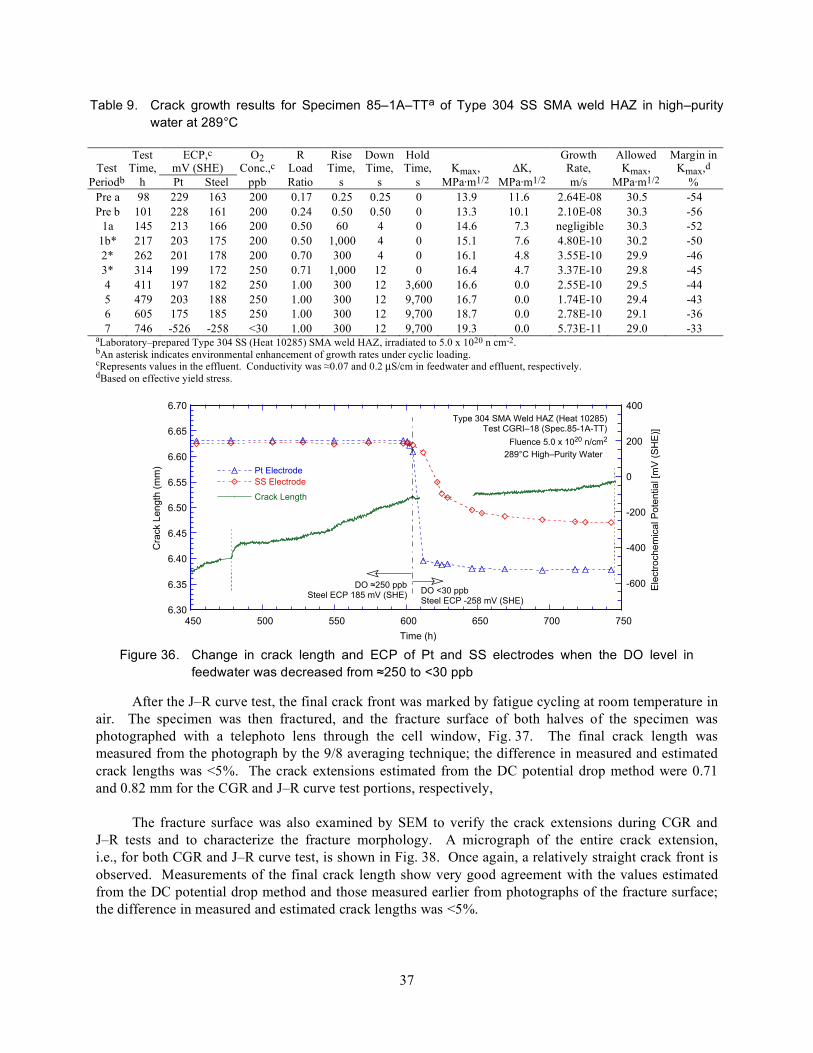
37
After the J–R curve test, the final crack front was marked by fatigue cycling at room temperature in air. The specimen was then fractured, and the fracture surface of both halves of the specimen was photographed with a telephoto lens through the cell window, Fig. 37. The final crack length was measured from the photograph by the 9/8 averaging technique; the difference in measured and estimated crack lengths was <5%. The crack extensions estimated from the DC potential drop method were 0.71 and 0.82 mm for the CGR and J–R curve test portions, respectively,
The fracture surface was also examined by SEM to verify the crack extensions during CGR and J–R tests and to characterize the fracture morphology. A micrograph of the entire crack extension, i.e., for both CGR and J–R curve test, is shown in Fig. 38. Once again, a relatively straight crack front is observed. Measurements of the final crack length show very good agreement with the values estimated from the DC potential drop method and those measured earlier from photographs of the fracture surface; the difference in measured and estimated crack lengths was <5%.
Table 9. Crack growth results for Specimen 85–1A–TTa of Type 304 SS SMA weld HAZ in high–purity water at 289°C
Test
Test Time,
ECP,c mV (SHE)
O2 Conc.,c
R Load
Rise Time,
Down Time,
Hold Time,
Kmax,
ΔK,
Growth Rate,
Allowed Kmax,
Margin in Kmax,d
Periodb h Pt Steel ppb Ratio s s s MPa·m1/2 MPa·m1/2 m/s MPa·m1/2 % Pre a 98 229 163 200 0.17 0.25 0.25 0 13.9 11.6 2.64E-08 30.5 -54 Pre b 101 228 161 200 0.24 0.50 0.50 0 13.3 10.1 2.10E-08 30.3 -56
1a 145 213 166 200 0.50 60 4 0 14.6 7.3 negligible 30.3 -52 1b* 217 203 175 200 0.50 1,000 4 0 15.1 7.6 4.80E-10 30.2 -50 2* 262 201 178 200 0.70 300 4 0 16.1 4.8 3.55E-10 29.9 -46 3* 314 199 172 250 0.71 1,000 12 0 16.4 4.7 3.37E-10 29.8 -45 4 411 197 182 250 1.00 300 12 3,600 16.6 0.0 2.55E-10 29.5 -44 5 479 203 188 250 1.00 300 12 9,700 16.7 0.0 1.74E-10 29.4 -43 6 605 175 185 250 1.00 300 12 9,700 18.7 0.0 2.78E-10 29.1 -36 7 746 -526 -258 <30 1.00 300 12 9,700 19.3 0.0 5.73E-11 29.0 -33
aLaboratory–prepared Type 304 SS (Heat 10285) SMA weld HAZ, irradiated to 5.0 x 10²⁰ n cm-2. bAn asterisk indicates environmental enhancement of growth rates under cyclic loading. cRepresents values in the effluent. Conductivity was ≈0.07 and 0.2 µS/cm in feedwater and effluent, respectively. dBased on effective yield stress.
6.30
6.35
6.40
6.45
6.50
6.55
6.60
6.65
6.70
-600
-400
-200
0
200
400
450 500 550 600 650 700 750
Crack Length
Pt Electrode
SS Electrode
Cra
ck L
en
gth
(m
m)
Ele
ctr
och
em
ica
l P
ote
ntia
l [m
V (
SH
E)]
Time (h)
Type 304 SMA Weld HAZ (Heat 10285)Test CGRI–18 (Spec.85-1A-TT)
Fluence 5.0 x 10²⁰ n/cm2
289°C High–Purity Water
DO <30 ppbSteel ECP -258 mV (SHE)
DO !250 ppbSteel ECP 185 mV (SHE)
Figure 36. Change in crack length and ECP of Pt and SS electrodes when the DO level in
feedwater was decreased from ≈250 to <30 ppb
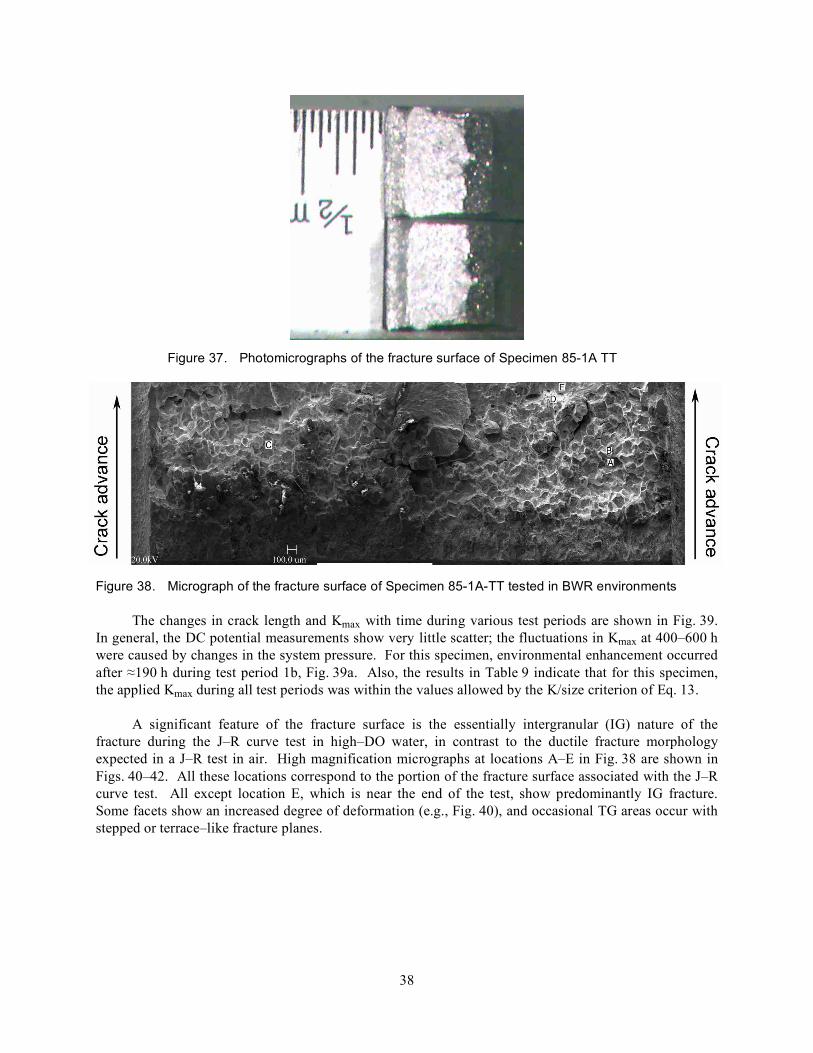
38
Figure 37. Photomicrographs of the fracture surface of Specimen 85-1A TT
Figure 38. Micrograph of the fracture surface of Specimen 85-1A-TT tested in BWR environments
The changes in crack length and Kmax with time during various test periods are shown in Fig. 39. In general, the DC potential measurements show very little scatter; the fluctuations in Kmax at 400–600 h were caused by changes in the system pressure. For this specimen, environmental enhancement occurred after ≈190 h during test period 1b, Fig. 39a. Also, the results in Table 9 indicate that for this specimen, the applied Kmax during all test periods was within the values allowed by the K/size criterion of Eq. 13.
A significant feature of the fracture surface is the essentially intergranular (IG) nature of the fracture during the J–R curve test in high–DO water, in contrast to the ductile fracture morphology expected in a J–R test in air. High magnification micrographs at locations A–E in Fig. 38 are shown in Figs. 40–42. All these locations correspond to the portion of the fracture surface associated with the J–R curve test. All except location E, which is near the end of the test, show predominantly IG fracture. Some facets show an increased degree of deformation (e.g., Fig. 40), and occasional TG areas occur with stepped or terrace–like fracture planes.
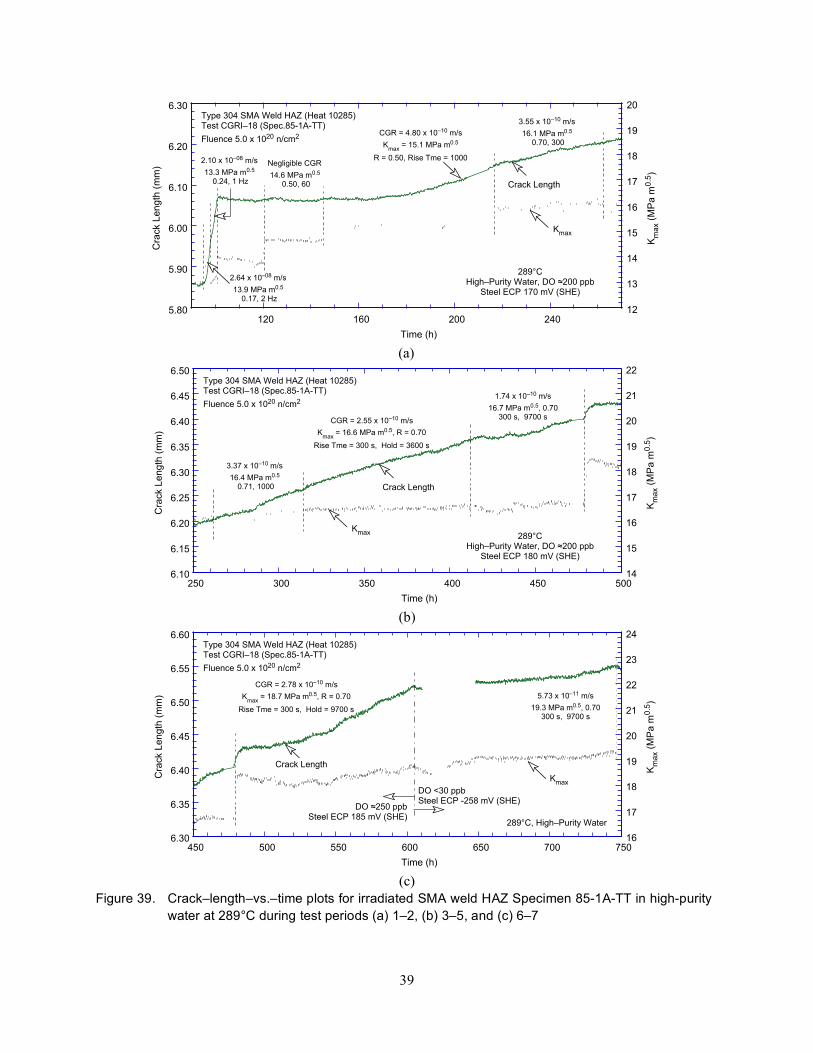
39
5.80
5.90
6.00
6.10
6.20
6.30
12
13
14
15
16
17
18
19
20
120 160 200 240
Cra
ck L
ength
(m
m)
Km
ax (
MP
a m
0.5
)
Time (h)
Type 304 SMA Weld HAZ (Heat 10285)Test CGRI–18 (Spec.85-1A-TT)
Fluence 5.0 x 10²⁰ n/cm2
289°CHigh–Purity Water, DO !200 ppb
Steel ECP 170 mV (SHE)
Kmax
Crack Length
3.55 x 10⁻¹⁰ m/s
16.1 MPa m0.5
0.70, 300
CGR = 4.80 x 10⁻¹⁰ m/s
Kmax
= 15.1 MPa m0.5
R = 0.50, Rise Tme = 1000Negligible CGR
14.6 MPa m0.5
0.50, 60
2.10 x 10–08 m/s
13.3 MPa m0.5
0.24, 1 Hz
2.64 x 10–08 m/s
13.9 MPa m0.5
0.17, 2 Hz
(a)
6.10
6.15
6.20
6.25
6.30
6.35
6.40
6.45
6.50
14
15
16
17
18
19
20
21
22
250 300 350 400 450 500
Cra
ck L
ength
(m
m)
Km
ax (
MP
a m
0.5
)
Time (h)
Type 304 SMA Weld HAZ (Heat 10285)Test CGRI–18 (Spec.85-1A-TT)
Fluence 5.0 x 10²⁰ n/cm2
289°CHigh–Purity Water, DO !200 ppb
Steel ECP 180 mV (SHE)
Kmax
Crack Length
CGR = 2.55 x 10⁻¹⁰ m/s
Kmax
= 16.6 MPa m0.5, R = 0.70
Rise Tme = 300 s, Hold = 3600 s
3.37 x 10⁻¹⁰ m/s
16.4 MPa m0.5
0.71, 1000
1.74 x 10⁻¹⁰ m/s
16.7 MPa m0.5, 0.70300 s, 9700 s
(b)
6.30
6.35
6.40
6.45
6.50
6.55
6.60
16
17
18
19
20
21
22
23
24
450 500 550 600 650 700 750
Cra
ck L
ength
(m
m)
Km
ax (
MP
a m
0.5
)
Time (h)
Type 304 SMA Weld HAZ (Heat 10285)Test CGRI–18 (Spec.85-1A-TT)
Fluence 5.0 x 10²⁰ n/cm2
289°C, High–Purity Water
Kmax
Crack Length
CGR = 2.78 x 10⁻¹⁰ m/s
Kmax
= 18.7 MPa m0.5, R = 0.70
Rise Tme = 300 s, Hold = 9700 s
5.73 x 10⁻¹¹ m/s
19.3 MPa m0.5, 0.70300 s, 9700 s
DO <30 ppbSteel ECP -258 mV (SHE)
DO !250 ppbSteel ECP 185 mV (SHE)
(c)
Figure 39. Crack–length–vs.–time plots for irradiated SMA weld HAZ Specimen 85-1A-TT in high-purity water at 289°C during test periods (a) 1–2, (b) 3–5, and (c) 6–7
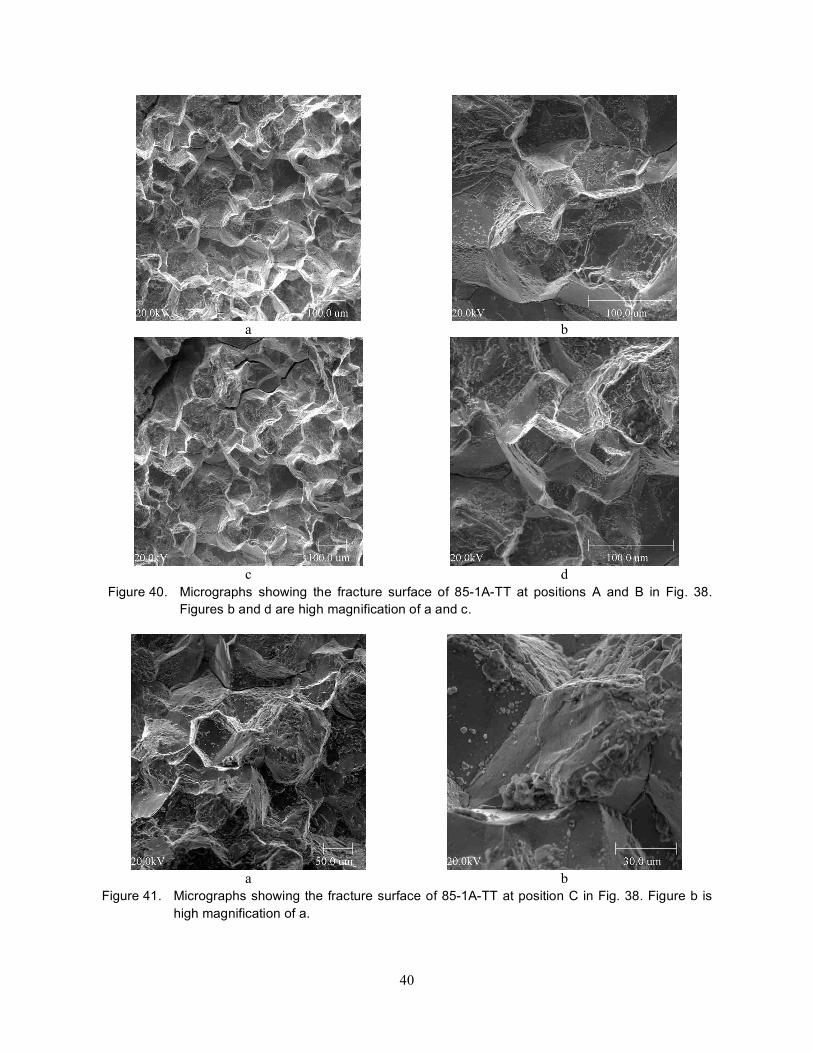
40
a b
c d
Figure 40. Micrographs showing the fracture surface of 85-1A-TT at positions A and B in Fig. 38. Figures b and d are high magnification of a and c.
a b
Figure 41. Micrographs showing the fracture surface of 85-1A-TT at position C in Fig. 38. Figure b is high magnification of a.
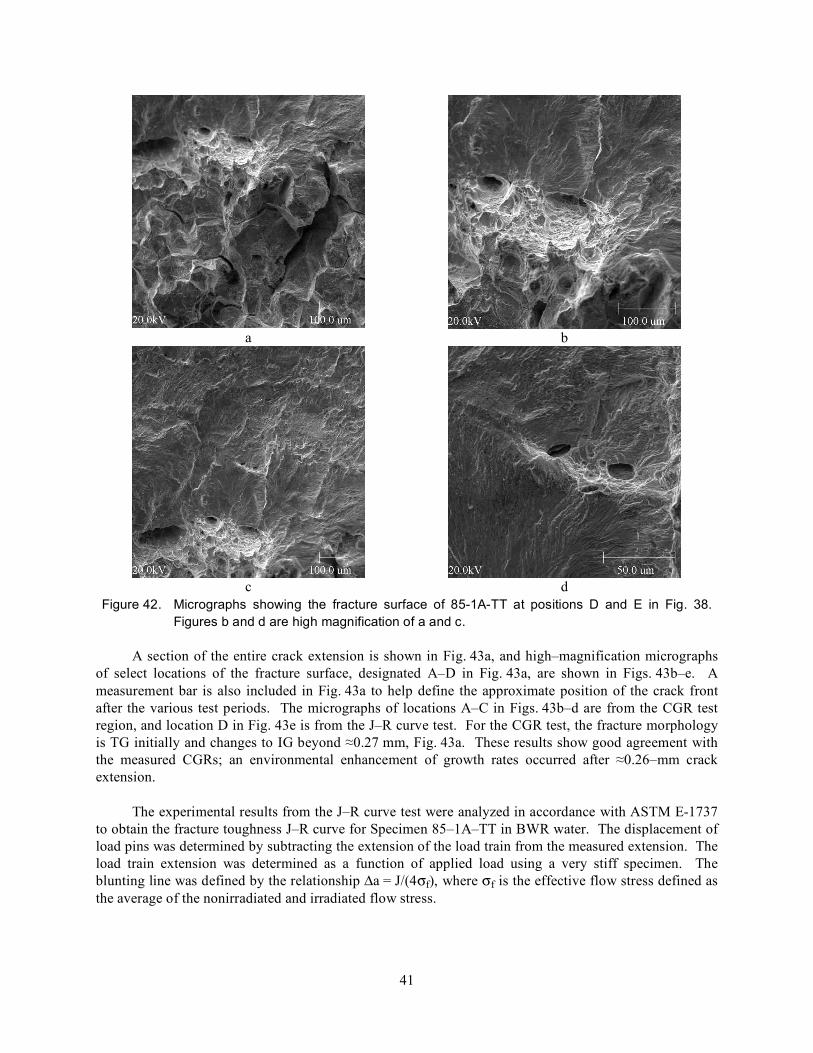
41
a b
c d
Figure 42. Micrographs showing the fracture surface of 85-1A-TT at positions D and E in Fig. 38. Figures b and d are high magnification of a and c.
A section of the entire crack extension is shown in Fig. 43a, and high–magnification micrographs of select locations of the fracture surface, designated A–D in Fig. 43a, are shown in Figs. 43b–e. A measurement bar is also included in Fig. 43a to help define the approximate position of the crack front after the various test periods. The micrographs of locations A–C in Figs. 43b–d are from the CGR test region, and location D in Fig. 43e is from the J–R curve test. For the CGR test, the fracture morphology is TG initially and changes to IG beyond ≈0.27 mm, Fig. 43a. These results show good agreement with the measured CGRs; an environmental enhancement of growth rates occurred after ≈0.26–mm crack extension.
The experimental results from the J–R curve test were analyzed in accordance with ASTM E-1737 to obtain the fracture toughness J–R curve for Specimen 85–1A–TT in BWR water. The displacement of load pins was determined by subtracting the extension of the load train from the measured extension. The load train extension was determined as a function of applied load using a very stiff specimen. The blunting line was defined by the relationship Δa = J/(4σf), where σf is the effective flow stress defined as the average of the nonirradiated and irradiated flow stress.
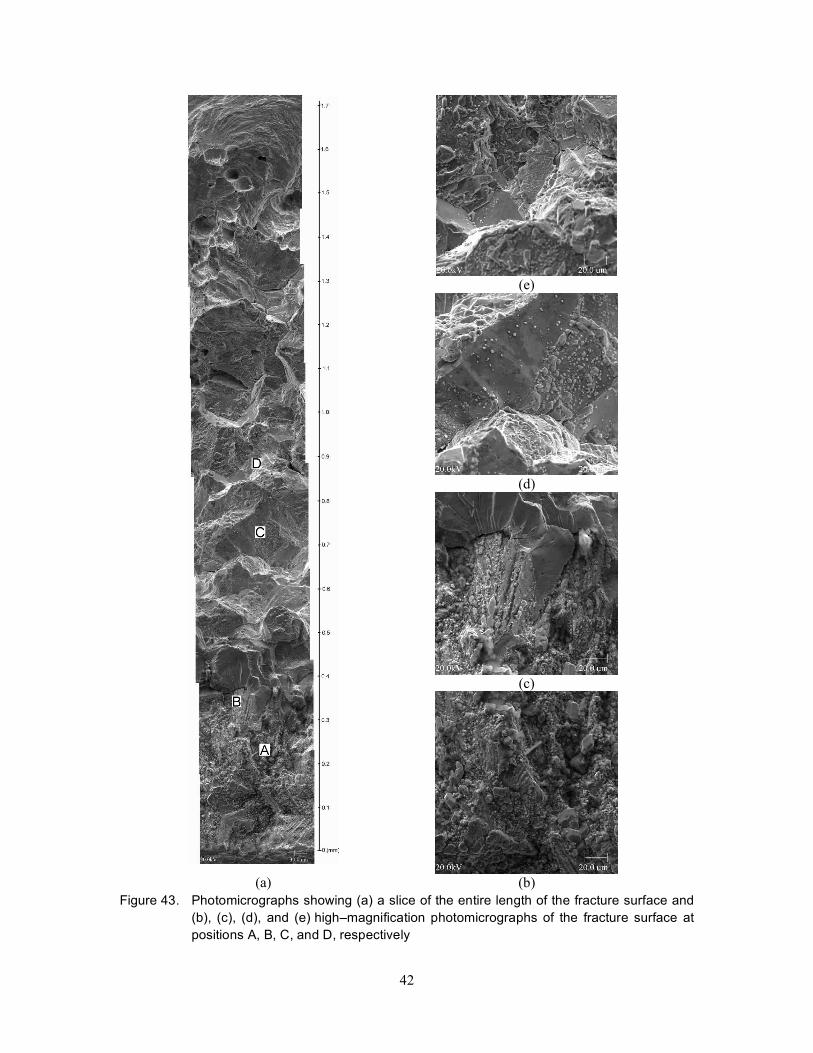
42
(e)
(d)
(c)
(a) (b) Figure 43. Photomicrographs showing (a) a slice of the entire length of the fracture surface and
(b), (c), (d), and (e) high–magnification photomicrographs of the fracture surface at positions A, B, C, and D, respectively
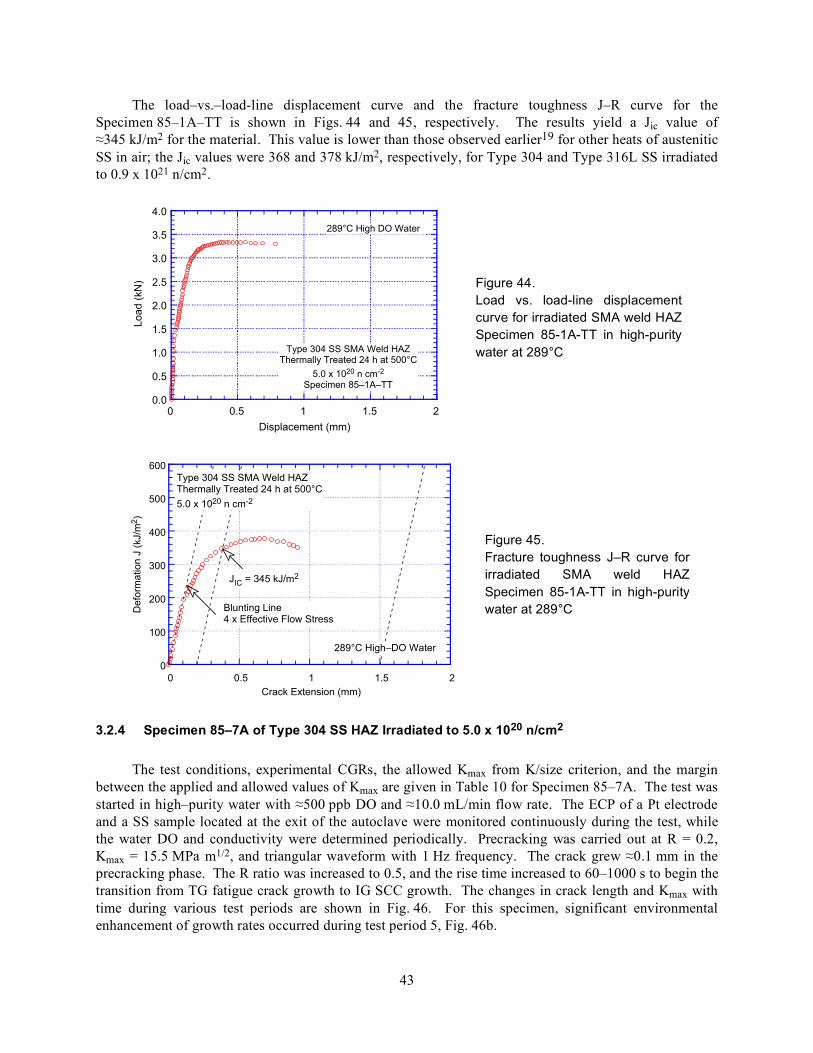
43
The load–vs.–load-line displacement curve and the fracture toughness J–R curve for the Specimen 85–1A–TT is shown in Figs. 44 and 45, respectively. The results yield a Jic value of ≈345 kJ/m2 for the material. This value is lower than those observed earlier19 for other heats of austenitic SS in air; the Jic values were 368 and 378 kJ/m2, respectively, for Type 304 and Type 316L SS irradiated to 0.9 x 10²¹ n/cm2.
0.0
0.5
1.0
1.5
2.0
2.5
3.0
3.5
4.0
0 0.5 1 1.5 2
Load (
kN
)
Displacement (mm)
289°C High DO Water
Type 304 SS SMA Weld HAZThermally Treated 24 h at 500°C
5.0 x 10²⁰ n cm-2
Specimen 85–1A–TT
Figure 44. Load vs. load-line displacement curve for irradiated SMA weld HAZ Specimen 85-1A-TT in high-purity water at 289°C
0
100
200
300
400
500
600
0 0.5 1 1.5 2
De
form
atio
n J
(kJ/m
2)
Crack Extension (mm)
Type 304 SS SMA Weld HAZThermally Treated 24 h at 500°C
5.0 x 10²⁰ n cm-2
JIC = 345 kJ/m2
289°C High–DO Water
Blunting Line4 x Effective Flow Stress
Figure 45. Fracture toughness J–R curve for irradiated SMA weld HAZ Specimen 85-1A-TT in high-purity water at 289°C
3.2.4 Specimen 85–7A of Type 304 SS HAZ Irradiated to 5.0 x 10²⁰ n/cm2
The test conditions, experimental CGRs, the allowed Kmax from K/size criterion, and the margin between the applied and allowed values of Kmax are given in Table 10 for Specimen 85–7A. The test was started in high–purity water with ≈500 ppb DO and ≈10.0 mL/min flow rate. The ECP of a Pt electrode and a SS sample located at the exit of the autoclave were monitored continuously during the test, while the water DO and conductivity were determined periodically. Precracking was carried out at R = 0.2, Kmax = 15.5 MPa m1/2, and triangular waveform with 1 Hz frequency. The crack grew ≈0.1 mm in the precracking phase. The R ratio was increased to 0.5, and the rise time increased to 60–1000 s to begin the transition from TG fatigue crack growth to IG SCC growth. The changes in crack length and Kmax with time during various test periods are shown in Fig. 46. For this specimen, significant environmental enhancement of growth rates occurred during test period 5, Fig. 46b.
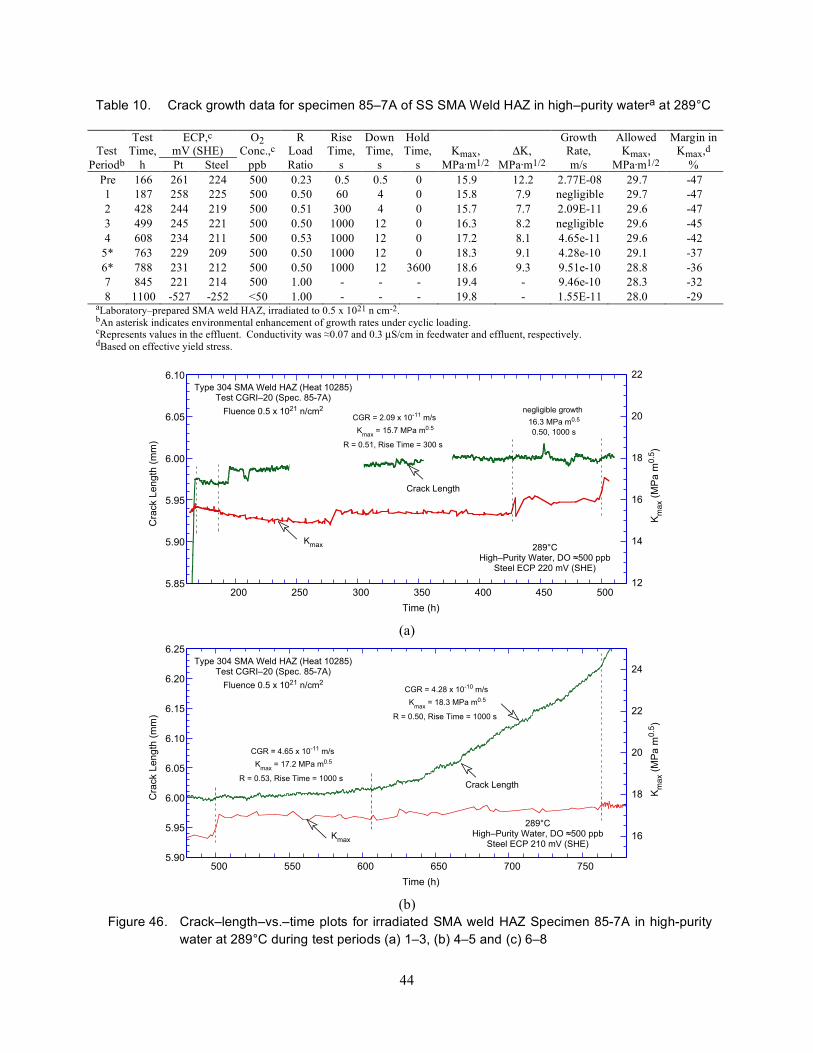
44
Table 10. Crack growth data for specimen 85–7A of SS SMA Weld HAZ in high–purity watera at 289°C
Test
Test Time,
ECP,c mV (SHE)
O2 Conc.,c
R Load
Rise Time,
Down Time,
Hold Time,
Kmax,
ΔK,
Growth Rate,
Allowed Kmax,
Margin in Kmax,d
Periodb h Pt Steel ppb Ratio s s s MPa·m1/2 MPa·m1/2 m/s MPa·m1/2 % Pre 166 261 224 500 0.23 0.5 0.5 0 15.9 12.2 2.77E-08 29.7 -47 1 187 258 225 500 0.50 60 4 0 15.8 7.9 negligible 29.7 -47 2 428 244 219 500 0.51 300 4 0 15.7 7.7 2.09E-11 29.6 -47 3 499 245 221 500 0.50 1000 12 0 16.3 8.2 negligible 29.6 -45 4 608 234 211 500 0.53 1000 12 0 17.2 8.1 4.65e-11 29.6 -42
5* 763 229 209 500 0.50 1000 12 0 18.3 9.1 4.28e-10 29.1 -37 6* 788 231 212 500 0.50 1000 12 3600 18.6 9.3 9.51e-10 28.8 -36 7 845 221 214 500 1.00 - - - 19.4 - 9.46e-10 28.3 -32 8 1100 -527 -252 <50 1.00 - - - 19.8 - 1.55E-11 28.0 -29
aLaboratory–prepared SMA weld HAZ, irradiated to 0.5 x 10²¹ n cm-2. bAn asterisk indicates environmental enhancement of growth rates under cyclic loading. cRepresents values in the effluent. Conductivity was ≈0.07 and 0.3 µS/cm in feedwater and effluent, respectively. dBased on effective yield stress.
5.85
5.90
5.95
6.00
6.05
6.10
12
14
16
18
20
22
200 250 300 350 400 450 500
Cra
ck L
ength
(m
m)
Km
ax (
MP
a m
0.5
)
Time (h)
Type 304 SMA Weld HAZ (Heat 10285)Test CGRI–20 (Spec. 85-7A)
Fluence 0.5 x 10²¹ n/cm2
289°CHigh–Purity Water, DO !500 ppb
Steel ECP 220 mV (SHE)
Kmax
Crack Length
CGR = 2.09 x 10⁻¹¹ m/s
Kmax
= 15.7 MPa m0.5
R = 0.51, Rise Time = 300 s
negligible growth
16.3 MPa m0.5
0.50, 1000 s
(a)
5.90
5.95
6.00
6.05
6.10
6.15
6.20
6.25
16
18
20
22
24
500 550 600 650 700 750
Cra
ck L
ength
(m
m)
Km
ax (
MP
a m
0.5
)
Time (h)
Type 304 SMA Weld HAZ (Heat 10285)Test CGRI–20 (Spec. 85-7A)
Fluence 0.5 x 10²¹ n/cm2
289°CHigh–Purity Water, DO !500 ppb
Steel ECP 210 mV (SHE)K
max
Crack Length
CGR = 4.65 x 10⁻¹¹ m/s
Kmax
= 17.2 MPa m0.5
R = 0.53, Rise Time = 1000 s
CGR = 4.28 x 10⁻¹⁰ m/s
Kmax
= 18.3 MPa m0.5
R = 0.50, Rise Time = 1000 s
(b)
Figure 46. Crack–length–vs.–time plots for irradiated SMA weld HAZ Specimen 85-7A in high-purity water at 289°C during test periods (a) 1–3, (b) 4–5 and (c) 6–8
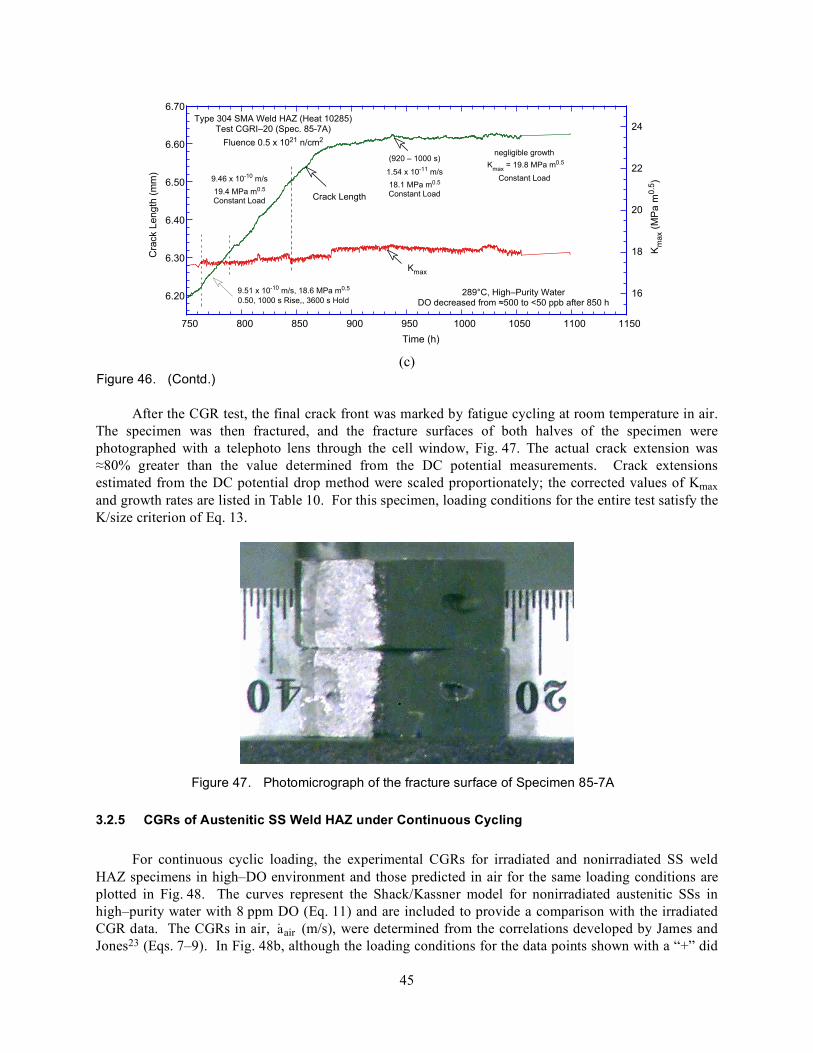
45
6.20
6.30
6.40
6.50
6.60
6.70
16
18
20
22
24
750 800 850 900 950 1000 1050 1100 1150
Cra
ck L
en
gth
(m
m)
Km
ax (
MP
a m
0.5
)
Time (h)
Type 304 SMA Weld HAZ (Heat 10285)Test CGRI–20 (Spec. 85-7A)
Fluence 0.5 x 10²¹ n/cm2
289°C, High–Purity WaterDO decreased from !500 to <50 ppb after 850 h
Kmax
Crack Length
negligible growth
Kmax
= 19.8 MPa m0.5
Constant Load9.46 x 10-10 m/s
19.4 MPa m0.5
Constant Load
9.51 x 10⁻¹⁰ m/s, 18.6 MPa m0.5
0.50, 1000 s Rise,, 3600 s Hold
(920 – 1000 s)
1.54 x 10⁻¹¹ m/s
18.1 MPa m0.5
Constant Load
(c)
Figure 46. (Contd.)
After the CGR test, the final crack front was marked by fatigue cycling at room temperature in air. The specimen was then fractured, and the fracture surfaces of both halves of the specimen were photographed with a telephoto lens through the cell window, Fig. 47. The actual crack extension was ≈80% greater than the value determined from the DC potential measurements. Crack extensions estimated from the DC potential drop method were scaled proportionately; the corrected values of Kmax and growth rates are listed in Table 10. For this specimen, loading conditions for the entire test satisfy the K/size criterion of Eq. 13.
Figure 47. Photomicrograph of the fracture surface of Specimen 85-7A
3.2.5 CGRs of Austenitic SS Weld HAZ under Continuous Cycling
For continuous cyclic loading, the experimental CGRs for irradiated and nonirradiated SS weld HAZ specimens in high–DO environment and those predicted in air for the same loading conditions are plotted in Fig. 48. The curves represent the Shack/Kassner model for nonirradiated austenitic SSs in high–purity water with 8 ppm DO (Eq. 11) and are included to provide a comparison with the irradiated CGR data. The CGRs in air,
˙ a air (m/s), were determined from the correlations developed by James and Jones23 (Eqs. 7–9). In Fig. 48b, although the loading conditions for the data points shown with a “+” did
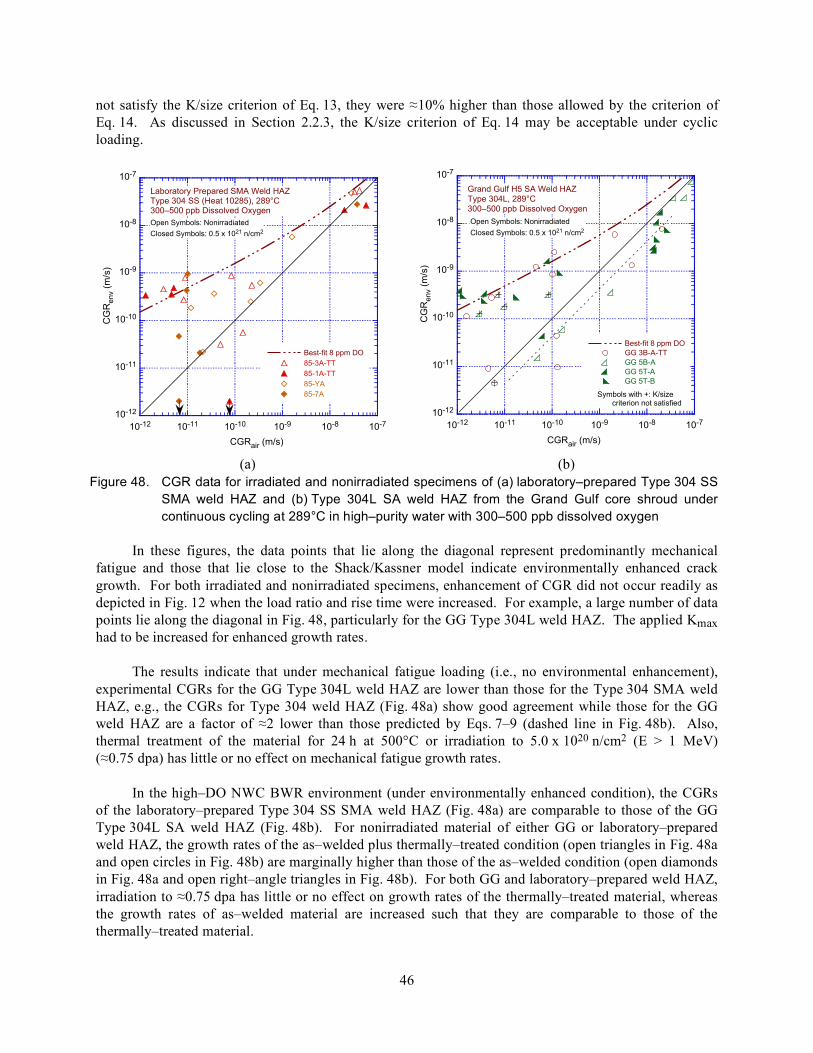
46
not satisfy the K/size criterion of Eq. 13, they were ≈10% higher than those allowed by the criterion of Eq. 14. As discussed in Section 2.2.3, the K/size criterion of Eq. 14 may be acceptable under cyclic loading.
10-12
10-11
10-10
10-9
10-8
10-7
10-12 10-11 10-10 10-9 10-8 10-7
Best-fit 8 ppm DO
85-3A-TT
85-1A-TT
85-YA
85-7A
CG
Renv (
m/s
)
CGRair (m/s)
Laboratory Prepared SMA Weld HAZType 304 SS (Heat 10285), 289°C300–500 ppb Dissolved Oxygen
Open Symbols: Nonirradiated
Closed Symbols: 0.5 x 10²¹ n/cm2
10-12
10-11
10-10
10-9
10-8
10-7
10-12 10-11 10-10 10-9 10-8 10-7
Best-fit 8 ppm DO
GG 3B-A-TT
GG 5B-A
GG 5T-A
GG 5T-B
CG
Re
nv (
m/s
)
CGRair (m/s)
Grand Gulf H5 SA Weld HAZ Type 304L, 289°C300–500 ppb Dissolved Oxygen
Open Symbols: Nonirradiated
Closed Symbols: 0.5 x 10²¹ n/cm2
Symbols with +: K/size criterion not satisfied
(a) (b)
Figure 48. CGR data for irradiated and nonirradiated specimens of (a) laboratory–prepared Type 304 SS SMA weld HAZ and (b) Type 304L SA weld HAZ from the Grand Gulf core shroud under continuous cycling at 289°C in high–purity water with 300–500 ppb dissolved oxygen
In these figures, the data points that lie along the diagonal represent predominantly mechanical fatigue and those that lie close to the Shack/Kassner model indicate environmentally enhanced crack growth. For both irradiated and nonirradiated specimens, enhancement of CGR did not occur readily as depicted in Fig. 12 when the load ratio and rise time were increased. For example, a large number of data points lie along the diagonal in Fig. 48, particularly for the GG Type 304L weld HAZ. The applied Kmax had to be increased for enhanced growth rates.
The results indicate that under mechanical fatigue loading (i.e., no environmental enhancement), experimental CGRs for the GG Type 304L weld HAZ are lower than those for the Type 304 SMA weld HAZ, e.g., the CGRs for Type 304 weld HAZ (Fig. 48a) show good agreement while those for the GG weld HAZ are a factor of ≈2 lower than those predicted by Eqs. 7–9 (dashed line in Fig. 48b). Also, thermal treatment of the material for 24 h at 500°C or irradiation to 5.0 x 10²⁰ n/cm2 (E > 1 MeV) (≈0.75 dpa) has little or no effect on mechanical fatigue growth rates.
In the high–DO NWC BWR environment (under environmentally enhanced condition), the CGRs of the laboratory–prepared Type 304 SS SMA weld HAZ (Fig. 48a) are comparable to those of the GG Type 304L SA weld HAZ (Fig. 48b). For nonirradiated material of either GG or laboratory–prepared weld HAZ, the growth rates of the as–welded plus thermally–treated condition (open triangles in Fig. 48a and open circles in Fig. 48b) are marginally higher than those of the as–welded condition (open diamonds in Fig. 48a and open right–angle triangles in Fig. 48b). For both GG and laboratory–prepared weld HAZ, irradiation to ≈0.75 dpa has little or no effect on growth rates of the thermally–treated material, whereas the growth rates of as–welded material are increased such that they are comparable to those of the thermally–treated material.
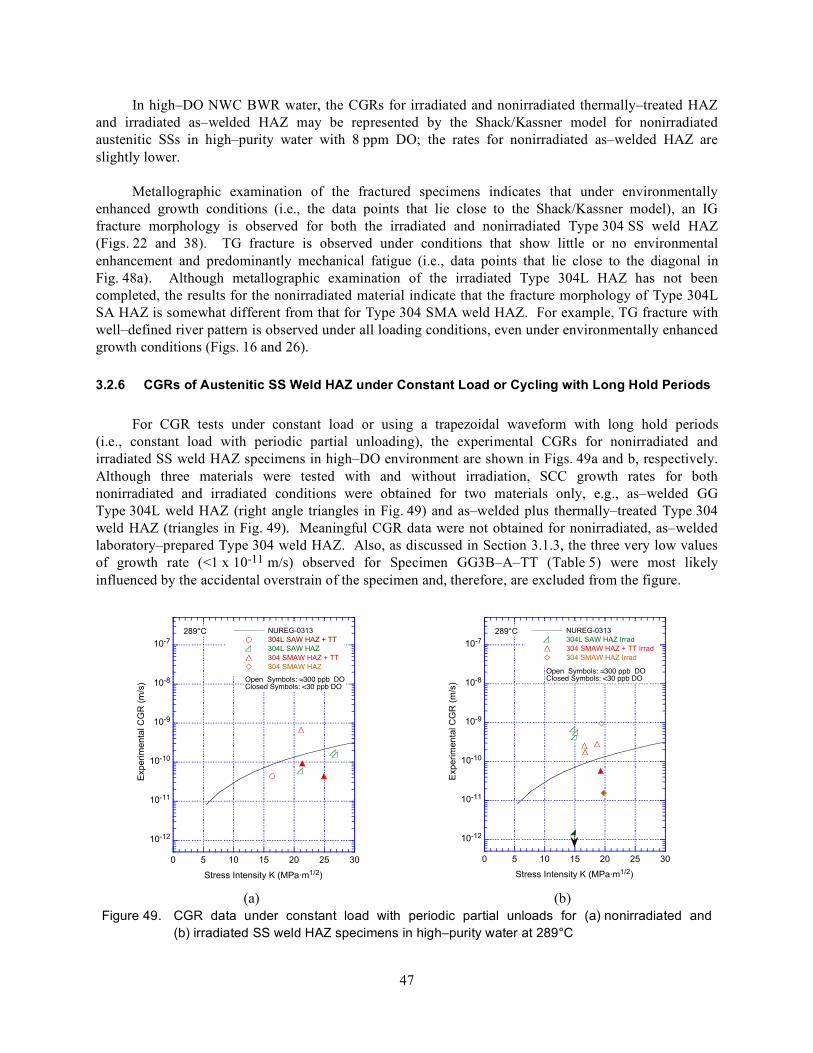
47
In high–DO NWC BWR water, the CGRs for irradiated and nonirradiated thermally–treated HAZ and irradiated as–welded HAZ may be represented by the Shack/Kassner model for nonirradiated austenitic SSs in high–purity water with 8 ppm DO; the rates for nonirradiated as–welded HAZ are slightly lower.
Metallographic examination of the fractured specimens indicates that under environmentally enhanced growth conditions (i.e., the data points that lie close to the Shack/Kassner model), an IG fracture morphology is observed for both the irradiated and nonirradiated Type 304 SS weld HAZ (Figs. 22 and 38). TG fracture is observed under conditions that show little or no environmental enhancement and predominantly mechanical fatigue (i.e., data points that lie close to the diagonal in Fig. 48a). Although metallographic examination of the irradiated Type 304L HAZ has not been completed, the results for the nonirradiated material indicate that the fracture morphology of Type 304L SA HAZ is somewhat different from that for Type 304 SMA weld HAZ. For example, TG fracture with well–defined river pattern is observed under all loading conditions, even under environmentally enhanced growth conditions (Figs. 16 and 26).
3.2.6 CGRs of Austenitic SS Weld HAZ under Constant Load or Cycling with Long Hold Periods
For CGR tests under constant load or using a trapezoidal waveform with long hold periods (i.e., constant load with periodic partial unloading), the experimental CGRs for nonirradiated and irradiated SS weld HAZ specimens in high–DO environment are shown in Figs. 49a and b, respectively. Although three materials were tested with and without irradiation, SCC growth rates for both nonirradiated and irradiated conditions were obtained for two materials only, e.g., as–welded GG Type 304L weld HAZ (right angle triangles in Fig. 49) and as–welded plus thermally–treated Type 304 weld HAZ (triangles in Fig. 49). Meaningful CGR data were not obtained for nonirradiated, as–welded laboratory–prepared Type 304 weld HAZ. Also, as discussed in Section 3.1.3, the three very low values of growth rate (<1 x 10-11 m/s) observed for Specimen GG3B–A–TT (Table 5) were most likely influenced by the accidental overstrain of the specimen and, therefore, are excluded from the figure.
10-12
10-11
10-10
10-9
10-8
10-7
0 5 10 15 20 25 30
NUREG-0313
304L SAW HAZ + TT
304L SAW HAZ
304 SMAW HAZ + TT
304 SMAW HAZ
Exp
erim
en
tal C
GR
(m
/s)
Stress Intensity K (MPa·m1/2)
289°C
Open Symbols: !300 ppb DOClosed Symbols: <30 ppb DO
10-12
10-11
10-10
10-9
10-8
10-7
0 5 10 15 20 25 30
NUREG-0313
304L SAW HAZ Irrad
304 SMAW HAZ + TT Irrad
304 SMAW HAZ Irrad
Experim
enta
l C
GR
(m
/s)
Stress Intensity K (MPa·m1/2)
289°C
Open Symbols: !300 ppb DOClosed Symbols: <30 ppb DO
(a) (b)
Figure 49. CGR data under constant load with periodic partial unloads for (a) nonirradiated and (b) irradiated SS weld HAZ specimens in high–purity water at 289°C
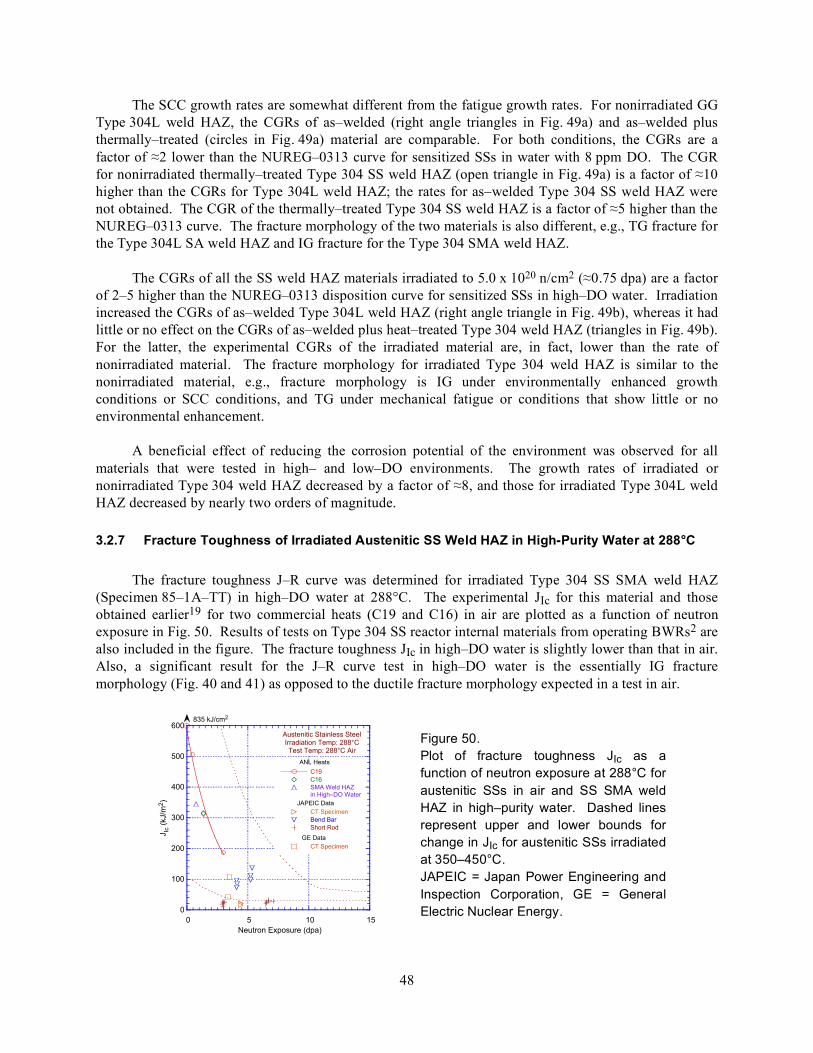
48
The SCC growth rates are somewhat different from the fatigue growth rates. For nonirradiated GG Type 304L weld HAZ, the CGRs of as–welded (right angle triangles in Fig. 49a) and as–welded plus thermally–treated (circles in Fig. 49a) material are comparable. For both conditions, the CGRs are a factor of ≈2 lower than the NUREG–0313 curve for sensitized SSs in water with 8 ppm DO. The CGR for nonirradiated thermally–treated Type 304 SS weld HAZ (open triangle in Fig. 49a) is a factor of ≈10 higher than the CGRs for Type 304L weld HAZ; the rates for as–welded Type 304 SS weld HAZ were not obtained. The CGR of the thermally–treated Type 304 SS weld HAZ is a factor of ≈5 higher than the NUREG–0313 curve. The fracture morphology of the two materials is also different, e.g., TG fracture for the Type 304L SA weld HAZ and IG fracture for the Type 304 SMA weld HAZ.
The CGRs of all the SS weld HAZ materials irradiated to 5.0 x 10²⁰ n/cm2 (≈0.75 dpa) are a factor of 2–5 higher than the NUREG–0313 disposition curve for sensitized SSs in high–DO water. Irradiation increased the CGRs of as–welded Type 304L weld HAZ (right angle triangle in Fig. 49b), whereas it had little or no effect on the CGRs of as–welded plus heat–treated Type 304 weld HAZ (triangles in Fig. 49b). For the latter, the experimental CGRs of the irradiated material are, in fact, lower than the rate of nonirradiated material. The fracture morphology for irradiated Type 304 weld HAZ is similar to the nonirradiated material, e.g., fracture morphology is IG under environmentally enhanced growth conditions or SCC conditions, and TG under mechanical fatigue or conditions that show little or no environmental enhancement.
A beneficial effect of reducing the corrosion potential of the environment was observed for all materials that were tested in high– and low–DO environments. The growth rates of irradiated or nonirradiated Type 304 weld HAZ decreased by a factor of ≈8, and those for irradiated Type 304L weld HAZ decreased by nearly two orders of magnitude.
3.2.7 Fracture Toughness of Irradiated Austenitic SS Weld HAZ in High-Purity Water at 288°C
The fracture toughness J–R curve was determined for irradiated Type 304 SS SMA weld HAZ (Specimen 85–1A–TT) in high–DO water at 288°C. The experimental JIc for this material and those obtained earlier19 for two commercial heats (C19 and C16) in air are plotted as a function of neutron exposure in Fig. 50. Results of tests on Type 304 SS reactor internal materials from operating BWRs2 are also included in the figure. The fracture toughness JIc in high–DO water is slightly lower than that in air. Also, a significant result for the J–R curve test in high–DO water is the essentially IG fracture morphology (Fig. 40 and 41) as opposed to the ductile fracture morphology expected in a test in air.
0
100
200
300
400
500
600
0 5 10 15
C19
C16
SMA Weld HAZin High–DO Water
CT Specimen
Bend Bar
Short Rod
CT Specimen
JIc
(kJ/m
2)
Neutron Exposure (dpa)
Austenitic Stainless SteelIrradiation Temp: 288°CTest Temp: 288°C Air
ANL Heats
JAPEIC Data
GE Data
835 kJ/cm2
Figure 50. Plot of fracture toughness JIc as a function of neutron exposure at 288°C for austenitic SSs in air and SS SMA weld HAZ in high–purity water. Dashed lines represent upper and lower bounds for change in JIc for austenitic SSs irradiated at 350–450°C. JAPEIC = Japan Power Engineering and Inspection Corporation, GE = General Electric Nuclear Energy.
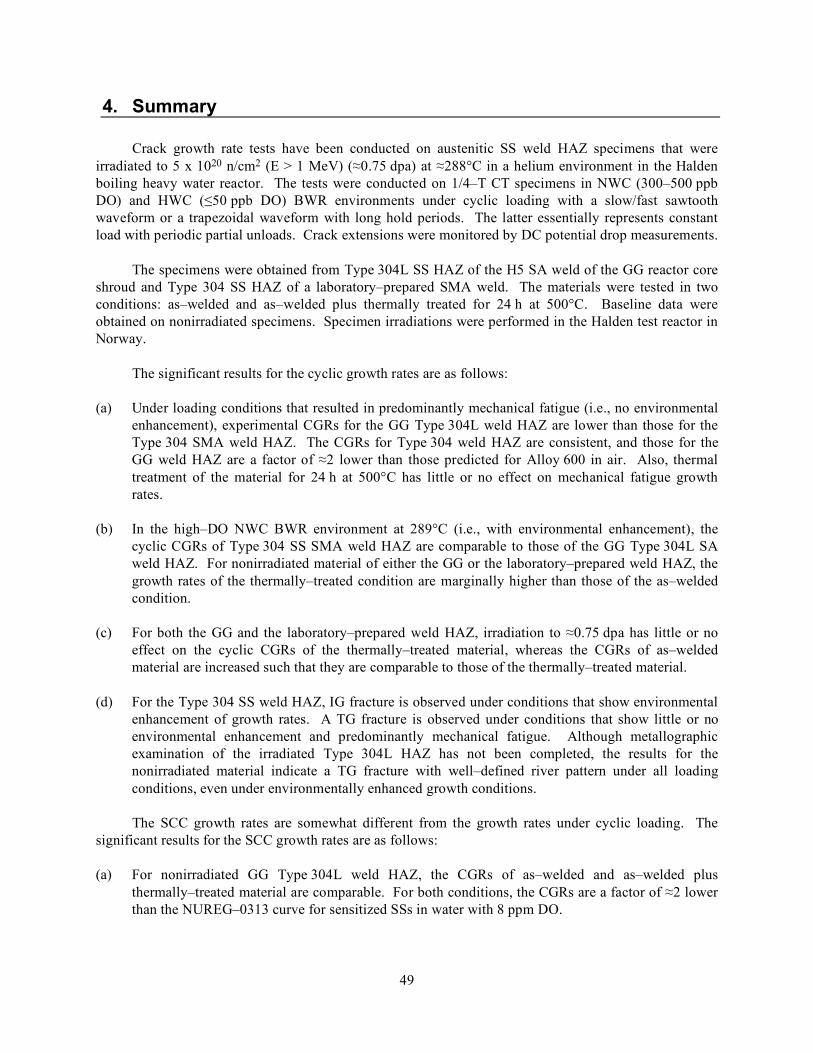
49
4. Summary
Crack growth rate tests have been conducted on austenitic SS weld HAZ specimens that were irradiated to 5 x 10²⁰ n/cm2 (E > 1 MeV) (≈0.75 dpa) at ≈288°C in a helium environment in the Halden boiling heavy water reactor. The tests were conducted on 1/4–T CT specimens in NWC (300–500 ppb DO) and HWC (≤50 ppb DO) BWR environments under cyclic loading with a slow/fast sawtooth waveform or a trapezoidal waveform with long hold periods. The latter essentially represents constant load with periodic partial unloads. Crack extensions were monitored by DC potential drop measurements.
The specimens were obtained from Type 304L SS HAZ of the H5 SA weld of the GG reactor core shroud and Type 304 SS HAZ of a laboratory–prepared SMA weld. The materials were tested in two conditions: as–welded and as–welded plus thermally treated for 24 h at 500°C. Baseline data were obtained on nonirradiated specimens. Specimen irradiations were performed in the Halden test reactor in Norway.
The significant results for the cyclic growth rates are as follows:
(a) Under loading conditions that resulted in predominantly mechanical fatigue (i.e., no environmental enhancement), experimental CGRs for the GG Type 304L weld HAZ are lower than those for the Type 304 SMA weld HAZ. The CGRs for Type 304 weld HAZ are consistent, and those for the GG weld HAZ are a factor of ≈2 lower than those predicted for Alloy 600 in air. Also, thermal treatment of the material for 24 h at 500°C has little or no effect on mechanical fatigue growth rates.
(b) In the high–DO NWC BWR environment at 289°C (i.e., with environmental enhancement), the cyclic CGRs of Type 304 SS SMA weld HAZ are comparable to those of the GG Type 304L SA weld HAZ. For nonirradiated material of either the GG or the laboratory–prepared weld HAZ, the growth rates of the thermally–treated condition are marginally higher than those of the as–welded condition.
(c) For both the GG and the laboratory–prepared weld HAZ, irradiation to ≈0.75 dpa has little or no effect on the cyclic CGRs of the thermally–treated material, whereas the CGRs of as–welded material are increased such that they are comparable to those of the thermally–treated material.
(d) For the Type 304 SS weld HAZ, IG fracture is observed under conditions that show environmental enhancement of growth rates. A TG fracture is observed under conditions that show little or no environmental enhancement and predominantly mechanical fatigue. Although metallographic examination of the irradiated Type 304L HAZ has not been completed, the results for the nonirradiated material indicate a TG fracture with well–defined river pattern under all loading conditions, even under environmentally enhanced growth conditions.
The SCC growth rates are somewhat different from the growth rates under cyclic loading. The significant results for the SCC growth rates are as follows:
(a) For nonirradiated GG Type 304L weld HAZ, the CGRs of as–welded and as–welded plus thermally–treated material are comparable. For both conditions, the CGRs are a factor of ≈2 lower than the NUREG–0313 curve for sensitized SSs in water with 8 ppm DO.
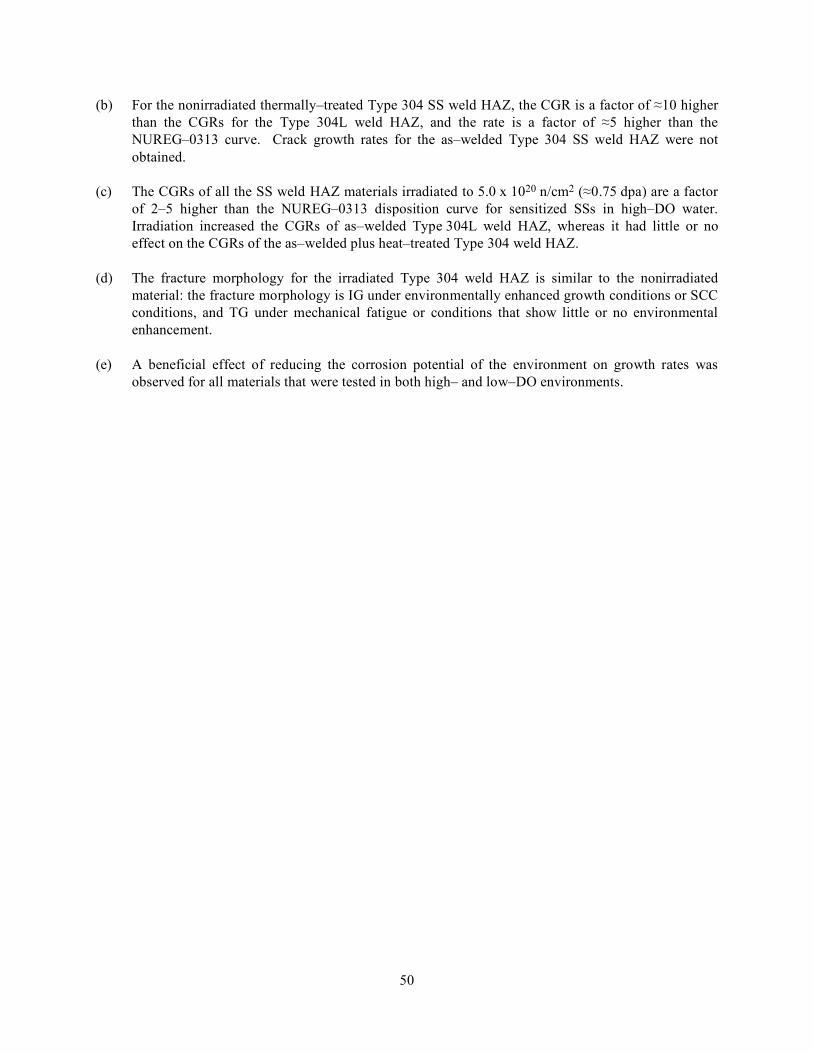
50
(b) For the nonirradiated thermally–treated Type 304 SS weld HAZ, the CGR is a factor of ≈10 higher than the CGRs for the Type 304L weld HAZ, and the rate is a factor of ≈5 higher than the NUREG–0313 curve. Crack growth rates for the as–welded Type 304 SS weld HAZ were not obtained.
(c) The CGRs of all the SS weld HAZ materials irradiated to 5.0 x 10²⁰ n/cm2 (≈0.75 dpa) are a factor of 2–5 higher than the NUREG–0313 disposition curve for sensitized SSs in high–DO water. Irradiation increased the CGRs of as–welded Type 304L weld HAZ, whereas it had little or no effect on the CGRs of the as–welded plus heat–treated Type 304 weld HAZ.
(d) The fracture morphology for the irradiated Type 304 weld HAZ is similar to the nonirradiated material: the fracture morphology is IG under environmentally enhanced growth conditions or SCC conditions, and TG under mechanical fatigue or conditions that show little or no environmental enhancement.
(e) A beneficial effect of reducing the corrosion potential of the environment on growth rates was observed for all materials that were tested in both high– and low–DO environments.
51
References
1. Bruemmer, S. M., et al., “Critical Issue Reviews for the Understanding and Evaluation of Irradiation–Assisted Stress Corrosion Cracking,” EPRI TR–107159, Electric Power Research Institute, Palo Alto, CA, 1996.
2. Herrera, M. L., et al., “Evaluation of the Effects of Irradiation on the Fracture Toughness of BWR Internal Components,” in Proc. ASME/JSME 4th Intl. Conf. on Nucl. Eng. (ICONE–4) Vol. 5, A. S. Rao, R. M. Duffey, and D. Elias, eds., American Society of Mechanical Engineers, New York, pp. 245–251, 1996.
3. Mills, W. J., “Fracture Toughness of Type 304 and 316 Stainless Steels and their Welds,” Intl. Mater. Rev. 42, 45–82, 1997.
4. Kanasaki, H., I. Satoh, M. Koyama, T. Okubo, T. R. Mager, and R. G. Lott, “Fatigue and Stress Corrosion Cracking Behaviors of Irradiated Stainless Steels in PWR Primary Water,” Proc. 5th Intl. Conf. on Nuclear Engineering, ICONE 5-2372, pp. 1–7, 1997.
5. Andresen, P. L., F. P. Ford, S. M. Murphy, and J. M. Perks, “State of Knowledge of Radiation Effects on Environmental Cracking in Light Water Reactor Core Materials,” Proc. 4th Intl. Symp. on Environmental Degradation of Materials in Nuclear Power Systems – Water Reactors, NACE, pp. 1.83–1.121, 1990.
6. Jenssen, A., and L. G. Ljungberg, “Irradiation Assisted Stress Corrosion Cracking of Stainless Alloys in BWR Normal Water Chemistry and Hydrogen Water Chemistry,” Proc. Sixth Intl. Symp. on Environmental Degradation of Materials in Nuclear Power Systems – Water Reactor, R. E. Gold and E. P. Simonen, eds., Minerals, Metals & Materials Society, pp. 547–553, 1993.
7. Brown, K. S., and G. M. Gordon, “Effects of BWR Coolant Chemistry on the Propensity for IGSCC Initiation and Growth in Creviced Reactor Internals Components,” Proc. Third Intl. Symp. on Environmental Degradation of Materials in Nuclear Power Systems – Water Reactor, The Metallurgical Society, Warrendale, PA, pp. 243–248, 1987.
8. Gordon, G. M., and K. S. Brown, “Dependence of Creviced BWR Component IGSCC Behavior on Coolant Chemistry,” Proc. 4th Intl. Symp. on Environmental Degradation of Materials in Nuclear Power Systems – Water Reactor, Daniel Cubicciotti, ed., NACE, pp. 14.46–14.61, 1990.
9. Garzarolli, F., D. Alter, and P. Dewes, “Deformability of Austenitic Stainless Steels and Nickel–Base Alloys in the Core of a Boiling and a Pressurized Water Reactor,” Proc. Intl. Symp. on Environmental Degradation of Materials in Nuclear Power Systems – Water Reactor, ANS, pp. 131–138, 1986.
10. Kodama, M., et al., “IASCC Susceptibility of Austenitic Stainless Steels Irradiated to High Neutron Fluence,” Proc. Sixth Intl. Symp. on Environmental Degradation of Materials in Nuclear Power Systems – Water Reactor, R. E. Gold and E. P. Simonen, eds., Minerals, Metals & Materials Society, pp. 583–588, 1993.
52
11. Kodama, M., et al., “Effects of Fluence and Dissolved Oxygen on IASCC in Austenitic Stainless Steels,” Proc. Fifth Intl. Symp. on Environmental Degradation of Materials in Nuclear Power Systems – Water Reactor, American Nuclear Society, pp. 948–954, 1991.
12. Clark, W. L., and A. J. Jacobs, “Effect of Radiation Environment on SCC of Austenitic Materials,” Proc. First Intl. Symp. on Environmental Degradation of Materials in Nuclear Power Systems – Water Reactor, NACE, p. 451, 1983.
13. Jacobs, A. J., G. P. Wozadlo, K. Nakata, T. Yoshida, and I. Masaoka, “Radiation Effects on the Stress Corrosion and Other Selected Properties of Type-304 and Type-316 Stainless Steels,” Proc. Third Intl. Symp. on Environmental Degradation of Materials in Nuclear Power Systems – Water Reactor, The Metallurgical Society, Warrendale, PA, pp. 673–681, 1987.
14. Chung, H. M., R. V. Strain, and R. W. Clark, “Slow–Strain–Rate–Tensile Test of Model Austenitic Stainless Steels Irradiated in the Halden Reactor,” in Environmentally Assisted Cracking in Light Water Reactors Semiannual Report July 2000 – December 2000, NUREG/CR–4667, Vol. 31, ANL–01/09, pp. 22–32, 2002.
15. Chung, H. M., R. V. Strain, and R. W. Clark, “Slow-Strain-Rate-Tensile Test of Model Austenitic Stainless Steels Irradiated in the Halden Reactor,” in Environmentally Assisted Cracking in Light Water Reactors Semiannual Report January – December 2001, NUREG/CR–4667, Vol. 32, ANL–02/33, pp. 19–28, 2003.
16. Andresen, P. L., and F. P. Ford, “Irradiation Assisted Stress Corrosion Cracking: From Modeling and Prediction of Laboratory & In–Core Response to Component Life Prediction,” Corrosion/95, Paper No. 419, NACE, Houston TX, 1995.
17. Jenssen, A., and L. G. Ljungberg, “Irradiation Assisted Stress Corrosion Cracking of Stainless Alloys in BWR Normal Water Chemistry and Hydrogen Water Chemistry,” Proc. Sixth Intl. Symp. on Environmental Degradation of Materials in Nuclear Power Systems – Water Reactor, R. E. Gold and E. P. Simonen, eds., Minerals, Metals & Materials Society, pp. 547–553, 1993.
18. Jenssen, A., and L. G. Ljungberg, “Irradiation Assisted Stress Corrosion Cracking. Post Irradiation CERT Tests of Stainless Steels in a BWR Test Loop,” Proc. Seventh Intl. Symp. on Environmental Degradation of Materials in Nuclear Power Systems – Water Reactor, G. Airey et al., eds., NACE, pp. 1043–1052, 1995.
19. Chopra, O. K., E. E. Gruber, and W. J. Shack, “Fracture Toughness and Crack Growth Rates of Irradiated Austenitic Stainless Steels,” NUREG/CR–6826, ANL–03/22, 2003.
20. Chopra, O. K., E. E. Gruber, and W. J. Shack, “Crack Growth Behavior of Irradiated Austenitic Stainless Steels in High-Purity Water at 289°C,” Proc. Eleventh Intl. Symp. on Environmental Degradation of Materials in Nuclear Power Systems – Water Reactor, American Nuclear Society, pp. 1027–1035, 2003.
21. Hazelton, W. S., and W. H. Koo, “Technical Report on Material Selection and Processing Guidelines for BWR Coolant Pressure Boundary Piping, Final Report,” NUREG–0313, Rev. 2, 1988.
53
22. Odette, G. R., and G. E. Lucas, “The Effects of Intermediate Temperature Irradiation on the Mechanical Behavior of 300–Series Austenitic Stainless Steels,” J. Nucl. Mater. 179–181, 572–576, 1991.
23. James, L. A., and D. P. Jones, “Fatigue Crack Growth Correlation for Austenitic Stainless Steels in Air,” Proc. Conf. on Predictive Capabilities in Environmentally–Assisted Cracking, PVP Vol. 99, R. Rungta, ed., American Society of Mechanical Engineers, New York, pp. 363–414, 1985.
24. Shack, W. J., and T. F. Kassner, “Review of Environmental Effects on Fatigue Crack Growth of Austenitic Stainless Steels,” NUREG/CR–6176, ANL–94/1, May 1994.
25. Andresen, P. L., “Similarity of Cold Work and Radiation Hardening in Enhancing Yield Strength and SCC Growth of Stainless Steel in Hot Water,” Corrosion/02, Paper 02509, NACE, 2002.

54
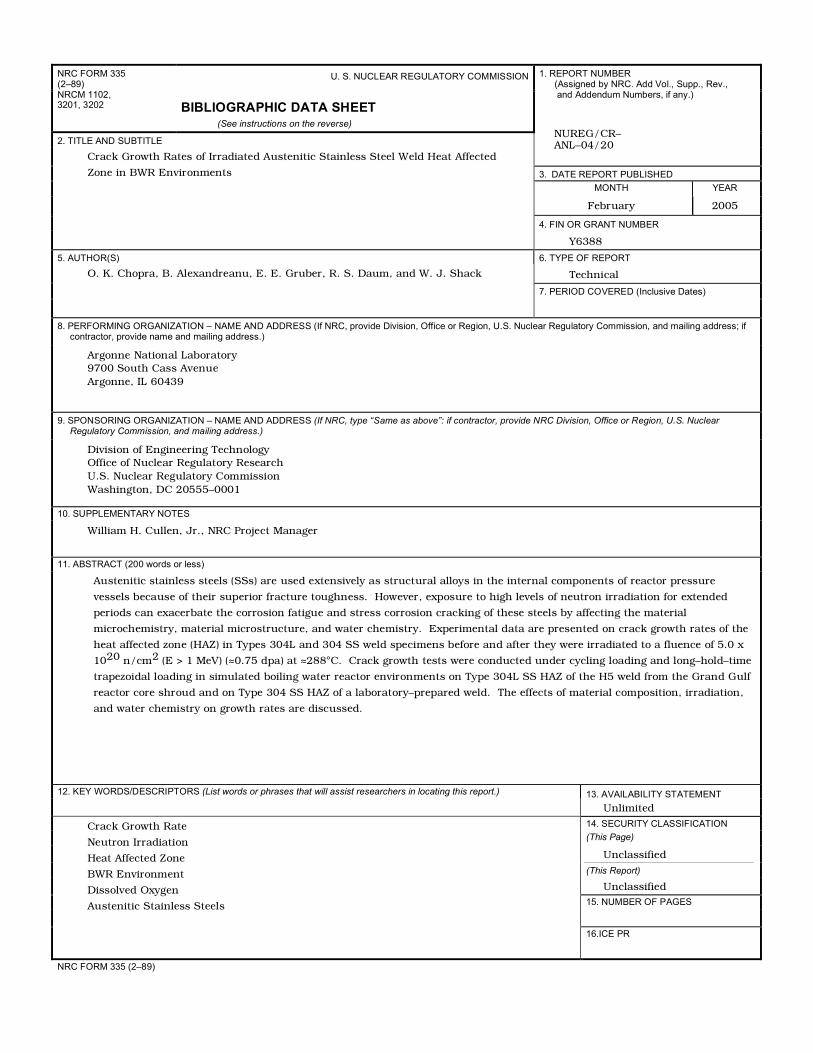
NRC FORM 335 (2–89) NRCM 1102, 3201, 3202
U. S. NUCLEAR REGULATORY COMMISSION
BIBLIOGRAPHIC DATA SHEET (See instructions on the reverse)
2. TITLE AND SUBTITLE
1. REPORT NUMBER (Assigned by NRC. Add Vol., Supp., Rev., and Addendum Numbers, if any.)
NUREG/CR– ANL–04/20
3. DATE REPORT PUBLISHED MONTH YEAR
February 2005
4. FIN OR GRANT NUMBER
Crack Growth Rates of Irradiated Austenitic Stainless Steel Weld Heat Affected
Zone in BWR Environments
Y6388
5. AUTHOR(S) 6. TYPE OF REPORT
Technical
7. PERIOD COVERED (Inclusive Dates)
O. K. Chopra, B. Alexandreanu, E. E. Gruber, R. S. Daum, and W. J. Shack
8. PERFORMING ORGANIZATION – NAME AND ADDRESS (If NRC, provide Division, Office or Region, U.S. Nuclear Regulatory Commission, and mailing address; if contractor, provide name and mailing address.)
Argonne National Laboratory 9700 South Cass Avenue Argonne, IL 60439
9. SPONSORING ORGANIZATION – NAME AND ADDRESS (If NRC, type “Same as above”: if contractor, provide NRC Division, Office or Region, U.S. Nuclear Regulatory Commission, and mailing address.)
Division of Engineering Technology Office of Nuclear Regulatory Research U.S. Nuclear Regulatory Commission Washington, DC 20555–0001
10. SUPPLEMENTARY NOTES
William H. Cullen, Jr., NRC Project Manager
11. ABSTRACT (200 words or less)
Austenitic stainless steels (SSs) are used extensively as structural alloys in the internal components of reactor pressure
vessels because of their superior fracture toughness. However, exposure to high levels of neutron irradiation for extended
periods can exacerbate the corrosion fatigue and stress corrosion cracking of these steels by affecting the material
microchemistry, material microstructure, and water chemistry. Experimental data are presented on crack growth rates of the
heat affected zone (HAZ) in Types 304L and 304 SS weld specimens before and after they were irradiated to a fluence of 5.0 x
1020 n/cm2 (E > 1 MeV) (≈0.75 dpa) at ≈288°C. Crack growth tests were conducted under cycling loading and long–hold–time
trapezoidal loading in simulated boiling water reactor environments on Type 304L SS HAZ of the H5 weld from the Grand Gulf
reactor core shroud and on Type 304 SS HAZ of a laboratory–prepared weld. The effects of material composition, irradiation,
and water chemistry on growth rates are discussed.
12. KEY WORDS/DESCRIPTORS (List words or phrases that will assist researchers in locating this report.) 13. AVAILABILITY STATEMENT Unlimited
14. SECURITY CLASSIFICATION (This Page)
Unclassified (This Report)
Unclassified 15. NUMBER OF PAGES
Crack Growth Rate
Neutron Irradiation
Heat Affected Zone
BWR Environment
Dissolved Oxygen
Austenitic Stainless Steels
16.ICE PR
NRC FORM 335 (2–89)