Embed Size (px)
Citation preview

Economic Assessment of the Euro Area
Winter 2017/2018
February 2018
CPB - Netherlands Bureau for Economic Policy Analysis (The Hague)
DIW Berlin - German Institute for Economic Research (Berlin)
ESRI -The Economic and Social Research Institute (Dublin)
EUROFRAMEEuropean Forecasting Reasearch
Association for the Macro-Economy
ETLA -The Research Institute of the Finnish Economy (Helsinki)
IfW -The Kiel Institute for the World Economy (Kiel)
NIESR -The National Institute for Economic and Social Research (London)
OFCE -Observatoire Français des Conjonctures Economiques (Paris)
PROMETEIA -Associazione per le previsioni econometriche (Bologna)
WIFO - Austrian Institute of Economic Research (Vienna)
CASE -Center for Social and Economic Research (Warsaw)
2
Economic Assessment of the Euro Area: Winter 2017/2018
This Euroframe Report presents an assessment of the economic outlook for 2018 and 2019 focused on the euro area based on a synopsis of the forecasts of Euroframe institutes. It also contains brief country notes summarizing the individual institute’s own country forecasts.
In the Focus section, we discuss a special topic, based on work done in the Euroframe institutes. This time, against the backdrop of the progressing recovery, we discuss the cyclical position of individual countries and the major remaining macroeconomic imbalances. UK prospects in view of Brexit are presented in Box A.
The international outlook: Higher growth and increased financial market volatility
The simultaneous recovery in advanced and emerging markets, matched with favourable economic policy conditions, contributed to the rebound of global economy in 2017. World trade grew by 4.5 per cent year-on-year in 2017, more than double the average annual growth rate between 2012 and 2016, according to CPB World Trade Monitor (Figure 1). Most recent indicators suggest robust growth to continue in 2018.
Nevertheless, financial markets look increasingly nervous, especially with respect to the developments of the US economy. Inflation (2.1 per cent on an annual basis in January 2018) is meeting an upsurge in the economic cycle, where expansionary effects from fiscal reforms will be added, but labour market conditions are tight. The Fed policy will be crucial in accompanying the economy in this phase of cycle. An over-reaction of the Federal Reserve could halt growth and trigger shockwaves in international financial markets, but a too loose monetary stance could feed inflationary pressure that will require tighter action in the future. We expect the Fed to continue the gradual normalization of the federal funds rate with the aim of avoiding to trigger a recession.
3
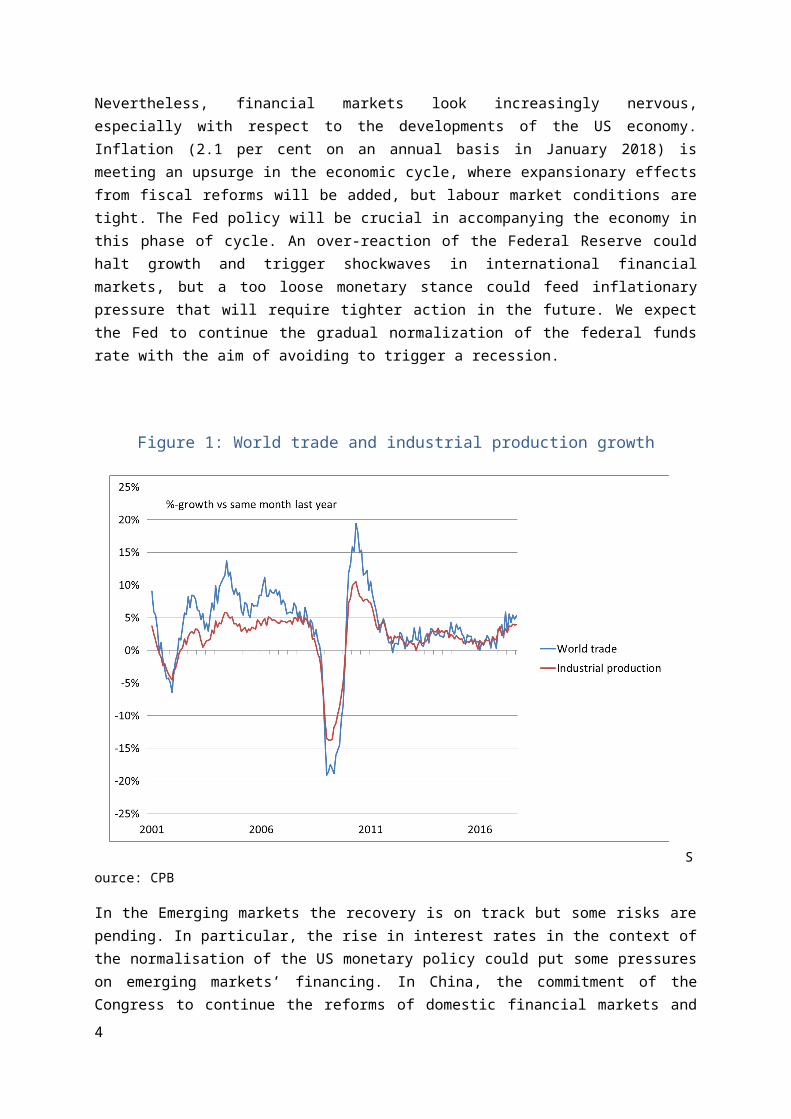
Figure 1: World trade and industrial production growth
Source: CPB
In the Emerging markets the recovery is on track but some risks are pending. In particular, the rise in interest rates in the context of the normalisation of the US monetary policy could put some pressures on emerging markets’ financing. In China, the commitment of the Congress to continue the reforms of domestic financial markets and to reduce State Owned Enterprises debt is likely to translate into lower growth of credit to the economy and less public sector investments, with the effect to decelerate GDP growth. In Brazil, the political uncertainty linked the presidential election due in October is negatively influencing the discussion of crucial reforms necessary to maintain under control public sector budget (pensions and the complete removal of automatic public expenditure increases) but the economy has entered the expansionary phase. In Russia, higher oil price helps public sector budget but OPEC quotas constrain the positive effects. In addition, on top of the expanding mining and oil sectors, economic growth is benefitting from the increased manufacturing activity. In India, growth is expected to accelerate, as the uncertainty linked to demonetization and fiscal reform fades away.
Overall, in 2018 several favourable factors will continue to support the investment cycle world-wide. Nevertheless, the cited fragilities and uncertainties in both US and emerging countries will contribute to maintain high the risk of correction in asset prices.
The Euro Area Outlook: Recovery progresses
The upturn in the euro area economy continued at a robust pace in 2017 despite the political uncertainties associated with events such as the British decision to leave the EU and the new US 4
administration. Growth exceeded expectations of most forecasters, including those underlying last year’s EUROFRAME Economic Assessment of the Euro Area, and came in at 2.5 per cent, the highest rate since 2010. Economic momentum, which has shifted into higher gear towards the end of 2016, remained strong throughout the year. While growth in the fourth quarter of 2017 decelerated slightly from 0.7 per cent to 0.6 per cent according to the preliminary estimate of Eurostat, a quarterly growth rate of 0.6 per cent is still respectable. This growth may be revised upward given the recent record of revisions to quarterly GDP data and bullish signals from sentiment indicators that are reflected in a significantly higher estimate of fourth quarter growth from EUROFRAME’s monthly Euro Growth Indicator.
The Euro Growth Indicator also suggests that the economic upturn will continue in the first few months of 2018, and EUROFRAME institutes on average expect annual GDP growth to decelerate only slightly to 2.3 per cent in 2018. For 2019 the EUROFRAME institutes foresee a more significant moderation of growth to 1.7 percent (on average), implying a pace of growth more in line with what has generally been perceived in recent years to be the growth rate of potential output, than the rates expected for this year and experienced last year.
The variance of the individual forecasts is fairly limited. Important assumptions are generally not substantially different, although there is some disagreement about the expected development of oil prices. The majority of institutes assume a further increase in oil prices in 2018, more or less stable oil prices in 2019 and US growth picking up this year to around 2.5 per cent followed by a deceleration in 2019 to 2 per cent. The average assumption on the exchange rate implies a level of close to 1.20 US-dollar. The institutes expect US monetary policy to gradually tighten further leading the Fed Funds Rate to a level of 2.5 per cent by the end of next year. At the same time, most institutes expect the Main Refinancing Rate in the euro area to remain at zero until the latter half of 2019.
Thus, with robust growth in the world economy, interest rates remaining extremely low and fiscal policy on aggregate maintaining its current mildly expansionary stance, the economic environment for growth in the euro area is projected to remain benign. With sentiment indicators coming close or having reached previous peaks depending on the euro area MSs and capacity utilization rising the outlook for investment has improved. Consumer expenditure is supported by substantial gains in employment and gradually accelerating wages, while consumer price inflation is projected to remain subdued at close to 1.5 per cent. However, risks remain for the euro area outlook, stemming from unexpected external shocks, unresolved structural issues, such as weak banking sectors in a number of countries, and political uncertainty around the European system of political governance, including those associated with Brexit.
Overall, economic activity in the euro area is expected to only slightly lose steam in the coming year and in 2019. While a deceleration is somewhat more visible, growth should remain close to 2 per cent. The labour market situation will continue to improve with the unemployment rate at the euro area level forecast to decline by ½ of a percentage point per year from the 9.1 per cent rate registered in 2017. Consumer price inflation has picked up in 2017, but this was in a large part due to higher energy prices. Underlying inflation, albeit also increasing, has remained low and EUROFRAME institutes do not expect that it will rise to the ECB’s target of close to but below 2 per cent any time soon.
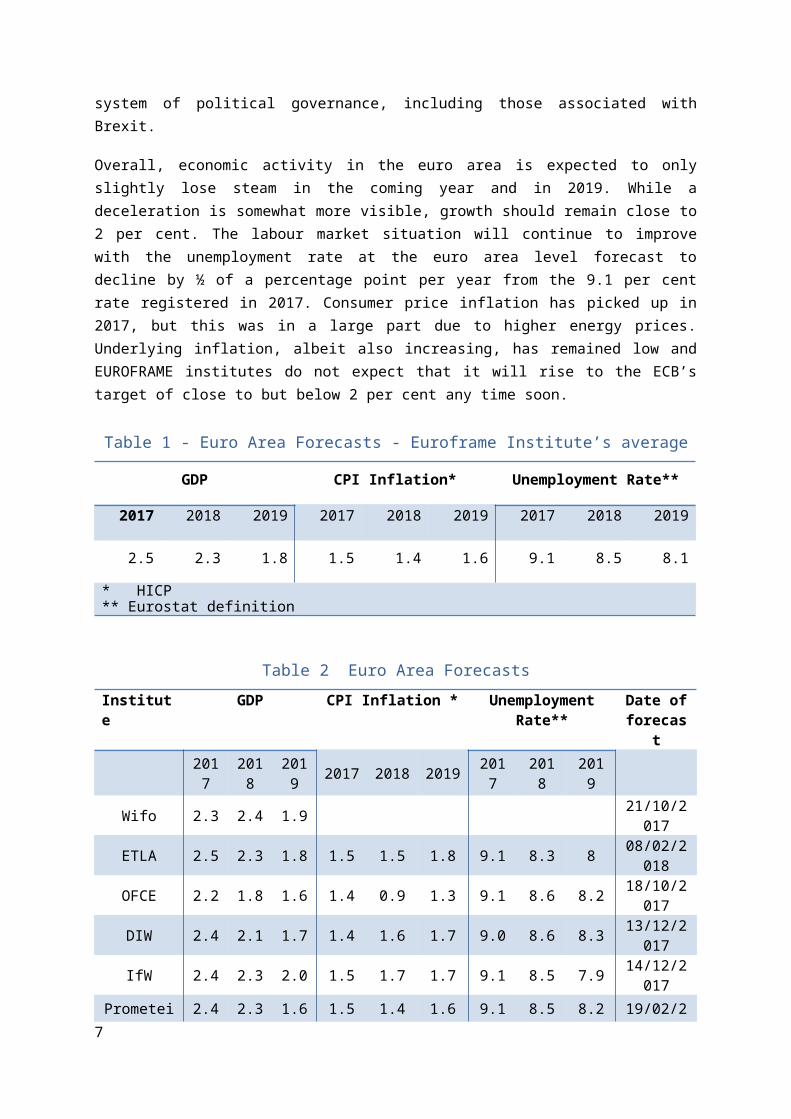
Table 1 - Euro Area Forecasts - Euroframe Institute’s average
GDP CPI Inflation* Unemployment Rate**
5
2017 2018 2019 2017 2018 2019 2017 2018 2019
2.5 2.3 1.8 1.5 1.4 1.6 9.1 8.5 8.1
* HICP ** Eurostat definition
Table 2 Euro Area ForecastsInstitute GDP CPI Inflation * Unemployment
Rate**Date of forecast
2017 2018 2019 2017 2018 2019 2017 2018 2019
Wifo 2.3 2.4 1.9 21/10/2017
ETLA 2.5 2.3 1.8 1.5 1.5 1.8 9.1 8.3 8 08/02/2018
OFCE 2.2 1.8 1.6 1.4 0.9 1.3 9.1 8.6 8.2 18/10/2017
DIW 2.4 2.1 1.7 1.4 1.6 1.7 9.0 8.6 8.3 13/12/2017
IfW 2.4 2.3 2.0 1.5 1.7 1.7 9.1 8.5 7.9 14/12/2017
Prometeia 2.4 2.3 1.6 1.5 1.4 1.6 9.1 8.5 8.2 19/02/2018
CPB 2.4 2.3 1.5 1.5 20/12/2018
NIESR 2.5 2.2 1.8 1.5 1.5 1.6 9.1 8.6 8.1 07/02/2018
* HICP ** Eurostat definition
6
FOCUS: Economic recovery is gaining strength in Europe but cyclical positions of individual countries continue to differ and significant imbalances remain
While the economic recovery is gaining strength in Europe, and monetary policy is set to reduce its expansionary stance and become progressively less supportive, we wonder if different countries show converging paths and if imbalances are reducing.
In its fifth year of expansion, the euro area looks divided into two groups: countries already close to or possibly even above full capacity, i.e. among countries represented within EUROFRAME institutes: Germany, the Netherlands, Finland, Ireland and Austria, and those with still large scars remaining to be addressed, including Spain, and among countries represented within EUROFRAME institutes: Italy, and France.
Ten years after the start of the 2008 crisis, unemployment rates remain above their 2007-2008 annual lower level in many euro area MS: 9 percentage points in Spain, 5 percentage points in Italy; 2.5 percentage points in Finland; 2 percentage points in France and Ireland; 1.4 percentage point in Austria; 1.2 percentage point in the Netherlands. The implications for the corresponding output gaps are, however, not straightforward. In some countries the unemployment rate may have been below the equilibrium unemployment (whatever calculated) before the crisis. In addition, the equilibrium unemployment rate may have changed in the meantime, like in Germany where it has declined or in other countries where it could have increased.
In the following we will present Institutes’ views on the cyclical positions of different countries.
Among the group of countries closer to full capacity, Germany is certainly the clearest example.
The output gap of the German economy has moved into positive territory last year, according to most measures. Surveys at the company level suggest that capacity utilization is even already at historically high levels in many sectors. Unemployment has decreased further to the lowest level in more than 25 years. Inflation has picked up and, while still being relatively moderate, is not in conflict with the diagnosis of the economy operating at above normal capacity. In this situation, a gradual normalization of monetary policy would be appropriate from a domestic point of view. The major remaining imbalance of the economy currently seems to be that a substantial portion of domestic savings is channelled into investment abroad. The root causes for this are difficult to identify and thus there is uncertainty about appropriate policy reaction to reduce the external surplus. The German government has started a number of initiatives to raise investment in infrastructure and education, but implementation is taking time.
In the Netherlands as well the cyclical upturn is strong by historical standards: GDP is expected to increase by 3.1 per cent next year, after a 3.2 per cent increase in 2017; growth above 3 per cent has not occurred since 2007. The economic boom is the result of the favourable international economic climate, low interest rates, a still strong housing market and expansionary fiscal policy from 2018 - with the latter two factors being distinctive from other countries. Unemployment is below the
7

equilibrium level and the output gap becomes positive. Due to the tight labour market, companies pay more wages to attract and to retain staff. Due to higher employment and rising real wages, households have more to spend, reinforcing the domestic demand growth. As a result, inflation is slowly increasing to 1.5 per cent in 2018. In 2019 a VAT-increase puts (temporary) upwards pressure on inflation and wages.
The fiscal balance remains positive despite the expansionary fiscal policy. Policies that have already been implemented, intensified spending in education and defence, and rising health spending, results in higher government spending. The already favourable economy is therefore further stimulated.
In Finland as well the economy is probably close to hit its potential next year. Nevertheless, unemployment is decreasing relatively slowly, as increasing labour supply softens the development. On the other hand, this is good news for a country such as Finland whose economic performance is weighted by an ageing population.
As far as Ireland is concerned, one useful indicator of a positive outlook for 2018 is the steady fall in the unemployment rate that has occurred over the last few years. Since January 2017, for example, the rate fell from 7.4 per cent down to 6.1 per cent as of January 2018. It is our view that this decline in unemployment will continue over the forecast horizon and by the end of 2018 will average 5.6 per cent. As the economy bolstered employment levels however, inflation still remains near-zero, rising by 0.6 per cent in 2017. Inflation is expected to accelerate given the European Central Banks’ monetary policy expected to remain lax in the short run and non-linear effects expected to be triggered as the Irish economy continues to approach ‘full’ employment.
In Austria the economy is still in a phase of a cyclical upturn. The current expansion is broad-based, both among the demand components and across the main economic sectors. Recent business cycle surveys point to a continued buoyant activity in the first half of 2018. Companies are still very optimistic, both regarding their current and their near-term future business situation. With the upturn, labour market conditions improved. Unemployment rate was falling from 6.2 per cent in mid-2016 to 5.3 per cent at the end of 2017 (seasonally adjusted). But some persistence remained and not all parts of the labour force were benefiting from the recent higher growth rates. Driven by higher prices for restaurants and hotels as well as for recreation and culture, inflation in 2017 in Austria was well above that of the euro area average.
On the other spectrum of countries stay Italy, the country who lost the most among the largest European economy, and France.
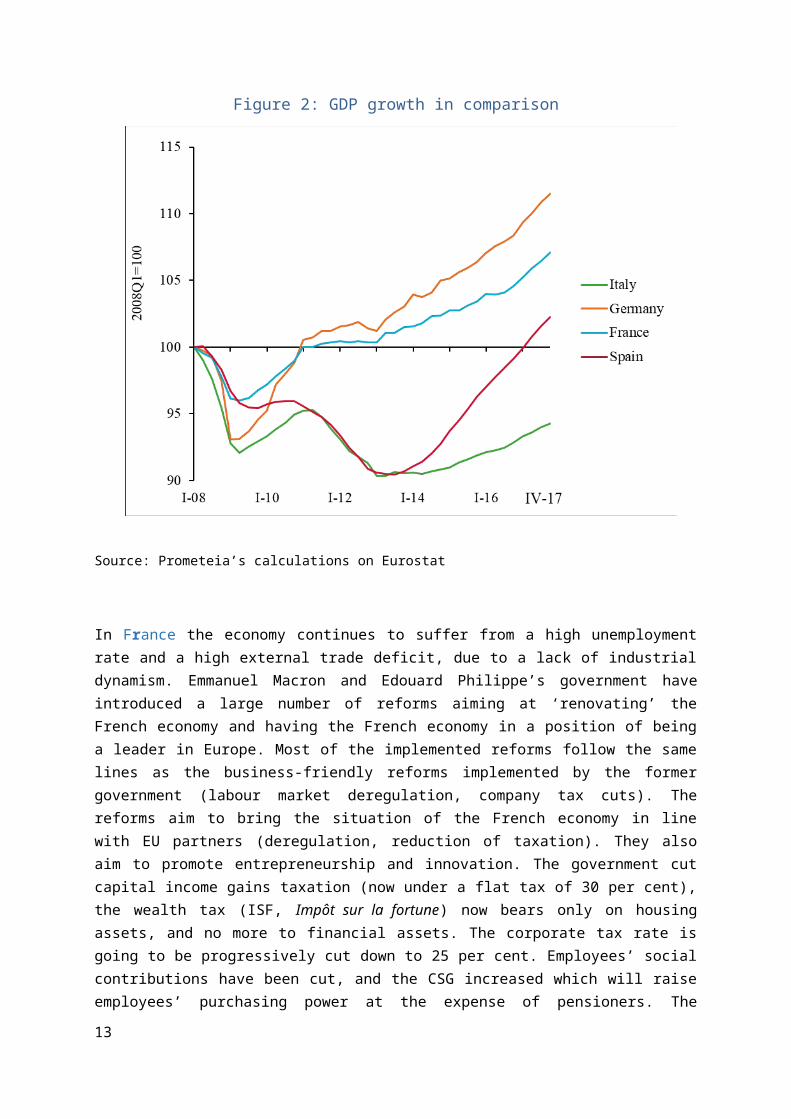
After the double-dip recession experienced in 2008-2009 and in 2012-2013, since 2014 Italy’s eco-nomy is recovering. The recovery started very slowly (GDP increased by 0.2 per cent in 2014) but has gained momentum, and GDP growth reached 1.6 per cent in 2017.
This is a recovery that has two main features. First, because of the labour market reform (the Jobs Act with the social contribution abatement for new employees on a permanent basis), this has been a “job rich” recovery. Since 2014 GDP has grown by 3.8 percentage points while employment (headcount) by 4 per cent. The number of employees has returned to its pre-crisis level, even if working hours are still much lower. Second, a recovery that was driven by external demand and by expansionary eco-nomic policies but that has remained below the euro area average. Among the largest euro area coun -tries, Italy is the only one not having recovered pre-crisis levels (Figure 2). The scars of the great re-cession are still very visible, not only in terms of GDP (-6 per cent compared to 2017) and industrial
8
production (-16 per cent), but also in terms of unemployment rate (+4.7pp), because the participation rate increased as well. Impressive the losses of the per-capita consumption and income (back to the 1999 levels).
Part of the production capacity has been lost, and potential growth decreased as well (-2 per cent in 2017 compared to 2007 according to official estimate). In this respect, looking at the measures of ca -pacity utilisation, the level is already quite high, and this would support the start of an investment cycle. On the other hand, the still high levels of unemployment, inequality and poverty are containing wage growth (0.7 per cent in 2017). Core inflation in fact is still subdued (0.6 per cent in January) and well below the euro area average.
Overall, even if Italy’s recovery is on track, it has still a long way to go. In this view, being so late in the business cycle, the main issue Italy is facing is that economic policies may turn restrictive too early.
Figure 2: GDP growth in comparison
Source: Prometeia’s calculations on Eurostat
In France the economy continues to suffer from a high unemployment rate and a high external trade deficit, due to a lack of industrial dynamism. Emmanuel Macron and Edouard Philippe’s government have introduced a large number of reforms aiming at ‘renovating’ the French economy and having the French economy in a position of being a leader in Europe. Most of the implemented reforms follow the same lines as the business-friendly reforms implemented by the former government (labour market deregulation, company tax cuts). The reforms aim to bring the situation of the French economy in line
9

with EU partners (deregulation, reduction of taxation). They also aim to promote entrepreneurship and innovation. The government cut capital income gains taxation (now under a flat tax of 30 per cent), the wealth tax (ISF, Impôt sur la fortune) now bears only on housing assets, and no more to financial assets. The corporate tax rate is going to be progressively cut down to 25 per cent. Employees’ social contributions have been cut, and the CSG increased which will raise employees’ purchasing power at the expense of pensioners. The housing tax (taxe d’habitation) is going to be abolished for 80 per cent of households, but indirect taxes (tobacco, energy) are going to be raised. The French government aims to cut the public deficit from 3 per cent of GDP in 2017 to 0.5 per cent in 2022, via public spending cuts. Spending cuts would be obtained through reducing the number of civil servants and the areas of public intervention (although this is not clearly set out). The government wishes to reform the unemployment insurance system (through increased monitoring of the unemployed), the pension system (merging the existing pension regimes into a single one), apprenticeship and vocational training (which would be managed by companies). The latest Labour Law (Labour Law II) softened labour rights in moving many areas from the national level to branch or company levels; companies will be entitled to implement jobs/competitiveness agreements; layoffs will be facilitated. A Plan for Growth and transformation of companies (Plan d’action pour la croissance et la transformation des entreprises) is expected to reduce constraints and taxation on companies. Will companies react substantially to these incentives? This is Emmanuel Macron’s bet.
At the end of a prolonged depression, it is difficult to evaluate both potential output and potential growth. Experience shows that low growth reduces production capacity, decreases labor productivity growth, discourages some people from seeking employment, and discourages companies from investing in both machinery and in the training of their workers. These phenomena are reversible. At the end of 2017, France has an unemployment rate of 9 per cent, 2 points above the 2008 level, or an employment deficit of around 3 per cent. Wage increases are moderate; underlying inflation is around 1 per cent per year. The firms’ financial situation is restored. The acceleration of GDP growth induces as usual upswings tensions in production capacities (with a capacity utilisation rate reaching 85.5 per cent), and to a rise in recruitment difficulties These are probably transitory difficulties that should be overcome if the persistence of growth induces companies to invest.
__________________________________________________________________________________
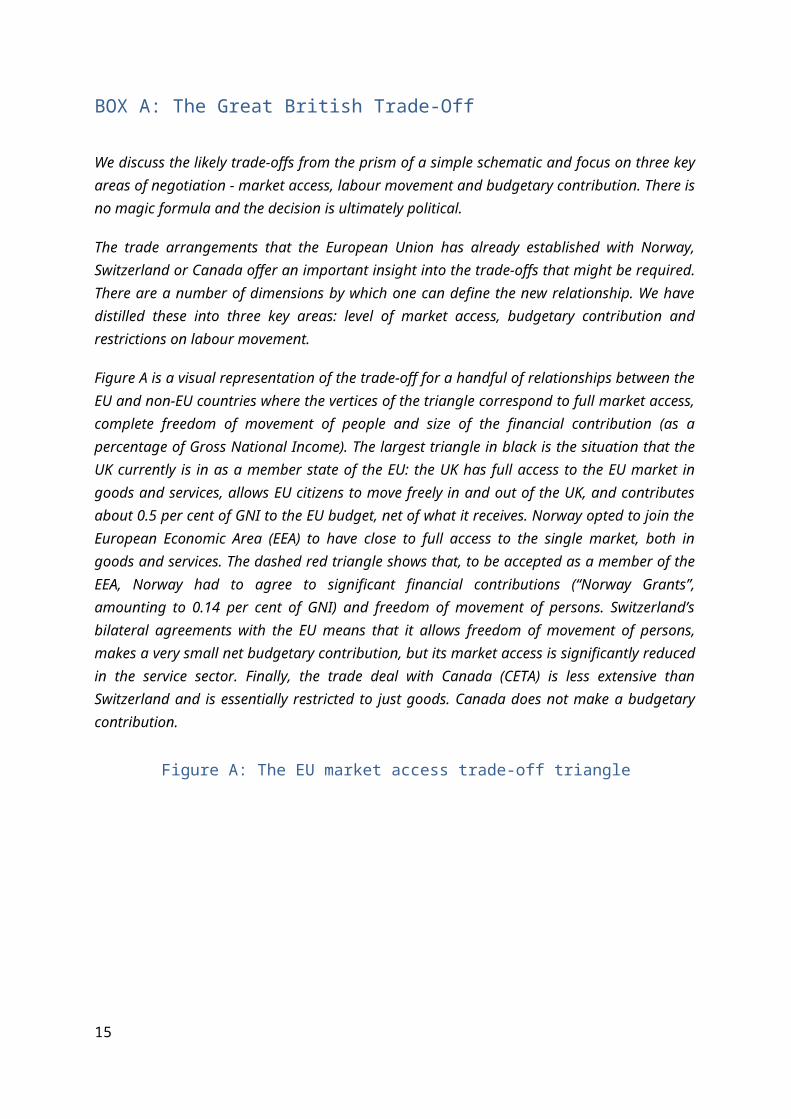
BOX A: The Great British Trade-Off
We discuss the likely trade-offs from the prism of a simple schematic and focus on three key areas of negotiation - market access, labour movement and budgetary contribution. There is no magic formula and the decision is ultimately political.
The trade arrangements that the European Union has already established with Norway, Switzerland or Canada offer an important insight into the trade-offs that might be required. There are a number of dimensions by which one can define the new relationship. We have distilled these into three key areas: level of market access, budgetary contribution and restrictions on labour movement.
10
Figure A is a visual representation of the trade-off for a handful of relationships between the EU and non-EU countries where the vertices of the triangle correspond to full market access, complete freedom of movement of people and size of the financial contribution (as a percentage of Gross National Income). The largest triangle in black is the situation that the UK currently is in as a member state of the EU: the UK has full access to the EU market in goods and services, allows EU citizens to move freely in and out of the UK, and contributes about 0.5 per cent of GNI to the EU budget, net of what it receives. Norway opted to join the European Economic Area (EEA) to have close to full access to the single market, both in goods and services. The dashed red triangle shows that, to be accepted as a member of the EEA, Norway had to agree to significant financial contributions (“Norway Grants”, amounting to 0.14 per cent of GNI) and freedom of movement of persons. Switzerland’s bilateral agreements with the EU means that it allows freedom of movement of persons, makes a very small net budgetary contribution, but its market access is significantly reduced in the service sector. Finally, the trade deal with Canada (CETA) is less extensive than Switzerland and is essentially restricted to just goods. Canada does not make a budgetary contribution.
Figure A: The EU market access trade-off triangle
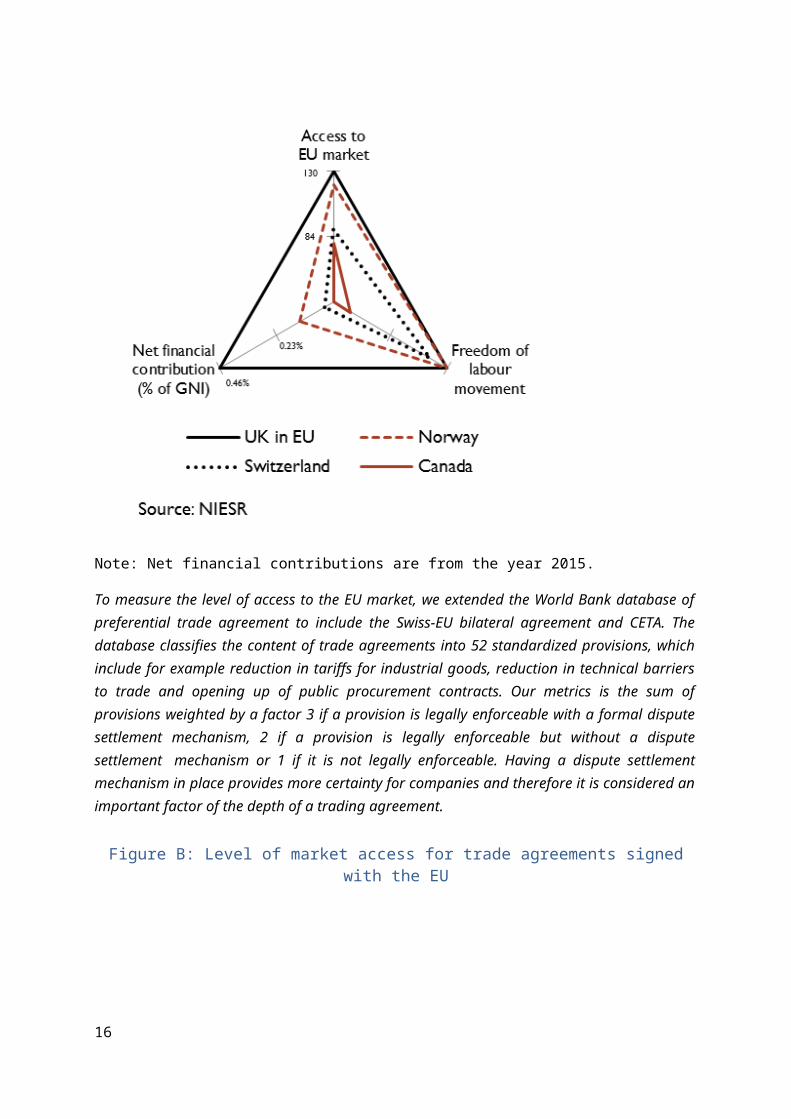
Note: Net financial contributions are from the year 2015.
To measure the level of access to the EU market, we extended the World Bank database of preferential trade agreement to include the Swiss-EU bilateral agreement and CETA. The database classifies the content of trade agreements into 52 standardized provisions, which include for example reduction in tariffs for industrial goods, reduction in technical barriers to trade and opening up of public procurement contracts. Our metrics is the sum of provisions weighted by a factor 3 if a provision is legally enforceable with a formal dispute settlement mechanism, 2 if a provision is legally enforceable
11
but without a dispute settlement mechanism or 1 if it is not legally enforceable. Having a dispute settlement mechanism in place provides more certainty for companies and therefore it is considered an important factor of the depth of a trading agreement.
Figure B: Level of market access for trade agreements signed with the EU
Source: NIESR
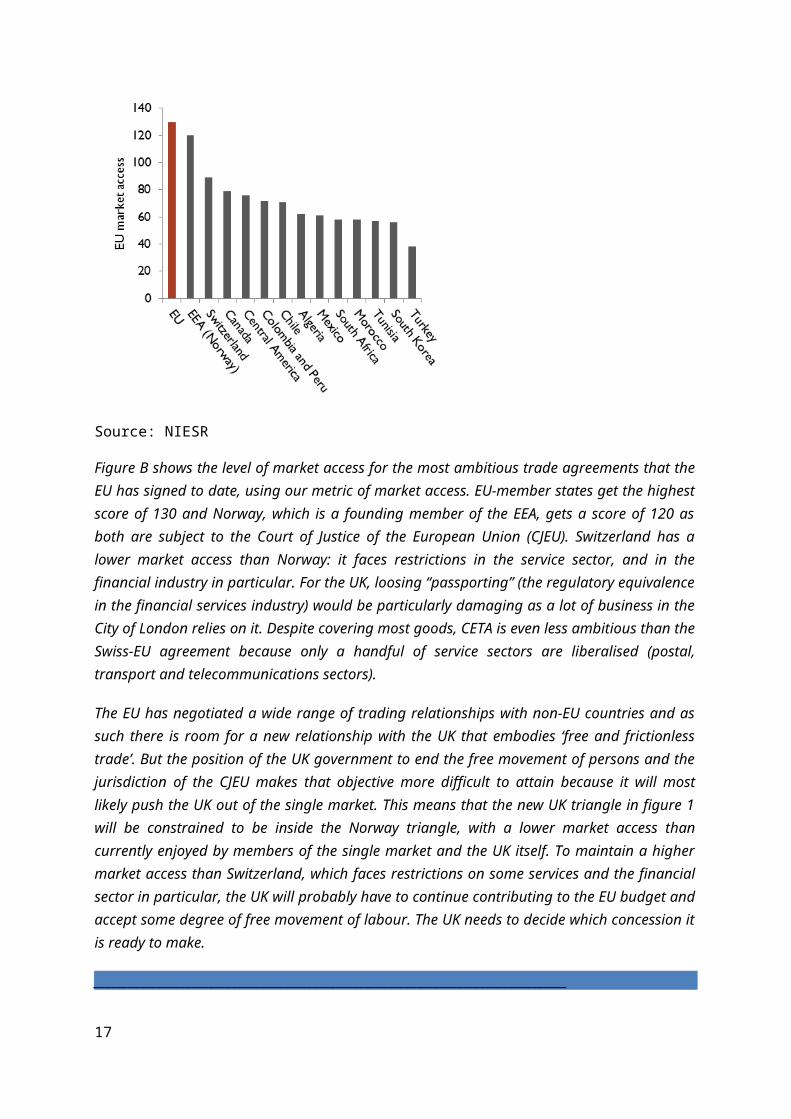
Figure B shows the level of market access for the most ambitious trade agreements that the EU has signed to date, using our metric of market access. EU-member states get the highest score of 130 and Norway, which is a founding member of the EEA, gets a score of 120 as both are subject to the Court of Justice of the European Union (CJEU). Switzerland has a lower market access than Norway: it faces restrictions in the service sector, and in the financial industry in particular. For the UK, loosing “passporting” (the regulatory equivalence in the financial services industry) would be particularly damaging as a lot of business in the City of London relies on it. Despite covering most goods, CETA is even less ambitious than the Swiss-EU agreement because only a handful of service sectors are liberalised (postal, transport and telecommunications sectors).
The EU has negotiated a wide range of trading relationships with non-EU countries and as such there is room for a new relationship with the UK that embodies ‘free and frictionless trade’. But the position of the UK government to end the free movement of persons and the jurisdiction of the CJEU makes that objective more difficult to attain because it will most likely push the UK out of the single market. This means that the new UK triangle in figure 1 will be constrained to be inside the Norway triangle, with a lower market access than currently enjoyed by members of the single market and the UK itself. To maintain a higher market access than Switzerland, which faces restrictions on some services and the financial sector in particular, the UK will probably have to continue contributing to the EU budget and accept some degree of free movement of labour. The UK needs to decide which concession it is ready to make.
__________________________________________________________________________________
12
Country’s details
Germany
The German economy is running at full steam. Economic activity has further accelerated in 2017 and leading indicators suggest that the rapid pace of expansion will continue in the coming months. GDP growth on a calendar-adjusted basis is expected to grow at around the same rate as last year (around 2½ percent in 2018). With capacity utilization already well above normal levels, the German economy is, thus, in a boom period. Tensions are becoming more and more apparent on the labour market. As a result, an acceleration of wages will boost the income gains of private households while employment growth is likely to slow down a bit. Consumer price inflation is expected to remain at around the level seen in 2017 (1.7 per cent), implying a gradual increase of underlying inflation, especially in 2019. The expansion of the German economy is broad-based. Private consumption will continue to expand at a relatively high rate due to high income growth. The boom in the construction sector is ongoing, although capacity constraints will lead to a considerable increase in construction prices. Exports are likely to be further stimulated by the strong upswing in the global economy. Moreover, business investment is becoming an additional pillar of the expansion as firms increasingly move away from their previously observed wait-and-see approach, in view of high capacity utilization and favourable business prospects. Fiscal policy is likely to be increasingly stimulative, given pledges for additional social expenditures and higher public investment. The general government budget balance will nevertheless remain in substantial surplus as the economic upturn leads to strong revenue growth. With respect to 2019, the outlook for growth in Germany differs between the two German Euroframe institutes. While the Kiel Institute expects another year of relatively strong GDP growth (2.3 per cent), DIW Berlin projects a lower rate of 1.6 per cent, which is more in line with the current growth rate of potential output.
France
French GDP growth recovered a satisfactory pace since the last quarter of 2016. French GDP grew by 1.9 per cent in 2017, but was 2.4 per cent higher in the fourth quarter of 2017 than in the same quarter of 2016. The French economy benefited from the acceleration of world growth, especially in the euro area (+2.7 per cent in the fourth quarter of 2017 as compared to the same quarter of 2016) and from the low level of interest rates, although the euro-dollar slightly appreciated and oil prices slightly increased. The French economy benefited both from the restoration of company accounts thanks to Hollande-Valls policy measures which cut corporate taxes by 40 billion euros, through the CICE tax credit (Crédit d’impôt pour la compétitivité des entreprises) and the Responsibility Pact, and from expansionary fiscal measures introduced before the 2017 Presidential campaign (increase in the number -subsidized jobs, over-amortization of investments, bonus for job creation in SMEs). French fiscal policy turned from restrictive to neutral. Emmanuel Macron’s coming into power and the implementation of a business-friendly policy should be incentives for companies to invest and create jobs. On the contrary, households’ purchasing power will be reduced in the first half of 2018 by increases in indirect taxation and an immediate rise in the CSG (Contribution sociale généralisée), at
13
flat tax on all incomes. These tax increases are intended to offset tax cuts on capital income, albeit ensuring that the French public deficit falls below 3 per cent of GDP. In 2018, like in 2017, French GDP growth will be driven by company and housing investment, while consumption will lag behind. Job creation is robust (+250 000 jobs in 2017), but the unemployment rate is only slightly diminishing (9.0 per cent at the end of 2017, 8.5 per cent at the end of 2018), because of demographic effects, of the cut in the number of subsidized jobs, and of the return of discouraged workers in the labour market. Inflation would reach 1.6 per cent in mid-2018, but underlying inflation would remain below 1 per cent and wage increases would remain moderate. Since public sector wages and social benefits are not price-indexed, inflation will reduce households’ purchasing power growth in the first half of 2018, while households’ purchasing power will accelerate in the second half of 2018, under the effects of cuts in employees’ social contributions and in the housing tax). The acceleration of GDP growth induces as usual in upswings tensions in production capacities (with a capacity utilisation rate reaching 85.5 per cent), and to a rise in recruitment difficulties. The main weakness of the French economy remains the current account deficit (at around 1.3 per cent of GDP in 2017 and 2018).
Italy1
For Italy’s economy 2017 was one of the best in the last 20 years, with sustained GDP growth and a decreasing fiscal deficit.
The pace of the recovery strengthened in 2017, while remaining below that of major European partners. According to preliminary flash estimate, GDP grew by 1.5 per cent in 2017 (1.1 per cent in 2016), the best annual performance since 2011. While consumer spending has levelled out and constructions and public spending are still subdued, the upswing has been driven by business investments and exports, which outpaced that of external demand even with an appreciated euro.
Headline inflation (measured by the national NIC) slowed to 0.8 per cent in January (from 0.9 per cent in December), while core inflation was up to 0.6 per cent (from 0.4 per cent). Despite the oil price hike inflation in Italy remains subdued even relative to the euro area average. This somewhat reflects the presence of idiosyncratic factors (such as the sharp reduction in University fees, -16 per cent), but is also the product of continuing weak labour market conditions, with stagnant wage growth (+0.7 per cent on the average of 2017) coupled with persistently high unemployment rate (10.8 per cent in December).
The positive investment cycle is expected to continue in the approaching quarters (+12 per cent in 2017-18) supported by favourable financial conditions, improved demand prospects and firms’ confidence. Additionally, fiscal incentives in ICT investment goods (Industria 4.0) are expected to provide strong support to those firms embarking in a technological upgrade. Consumption growth is expected to grow steadily in 2018.
In contrast to the past few years, in 2018 fiscal policy will shift to a moderately restrictive stance (as the structural balance is expected to improve by 0.1pp) and the high government debt will accelerate the decline, although more gradually than requested by the Stability Pact. The 2018 budget law needs to find a compromise between supporting GDP growth and reducing public debt. To pursue its objective, the budget law allocates more resources to support households and businesses (e.g. strengthening of the new “Inclusion income” scheme and supporting investments in technology) by increasing revenues through the strengthening of measures against tax evasion as well as the revision of government expenditure.
1 Based on Prometeia, Rapporto di Previsione, December 2017 and Prometeia Brief http://www.prometeia.it/brief 14
We expect a further reduction of the general government deficit to 1.8 per cent in 2018 (down from 2.1 per cent of GDP that is expected for 2017). The lower deficit and the economic recovery will allow the debt-to-GDP ratio to fall to 130.5 per cent in 2018 (131.8 the estimate for 2017).
Overall, in 2018 Italy will continue to benefit from low interest rates, global growth, and a supportive fiscal policy, with households enjoying disposable income growth and companies utilising the fiscal incentives for technology investments. The Italian economic outlook remains positive, despite being less than three weeks from very uncertain parliamentary elections. In 2018, we expect the same growth observed last year (1.5 per cent) and a further reduction of public sector deficit and debt, before moderating in 2019.
The Netherlands
The economy continues to grow in The Netherlands. In 2018, GDP will increase by more than 3 per cent, as in the previous year. Such growth rates have not occurred since 2007. Due to the sustained high growth, 2018 is a period of boom. Economic growth is broadly supported. Business investment, household consumption, housing investment and exports all contribute to the growth of GDP. This is due to a favorable international business climate, expansionary fiscal policy and a strong housing market. In addition, there is a positive domestic dynamic between rising employment, higher disposable income, higher consumption and more investments. GDP growth is based largely on domestic spending, with an important role for government spending contributing 0.8 per cent point to growth.
A striking role is reserved for government spending. The government conducts a pro-cyclical fiscal policy and thus further boosts economic growth. In 2017, government spending growth is still 0.4 per cent; in 2018 it will be 3.5 per cent. The measures in the coalition government agreement - including intensification in education and defence – as well as the rising health expenditure are the most important determinants. The expansionary fiscal policy largely explains the higher GDP growth than that in the neighbouring countries. Despite rising government spending, there is still a surplus on the government budget, partly because spending on unemployment benefits is falling and tax revenues are rising.
In 2018 employment will rise by 2 per cent. Because labour supply is growing less rapidly, unemployment will drop further in 2018 to 3.9 per cent of the labour force, the lowest level in ten years.
Finland
The GDP growth for Finland in 2017 - forecasted to reach 3.1 per cent -, outpaced expectations. The growth was based on surging exports amid rapidly increasing investments and private consumption. Net exports developed especially well while imports grew only modestly last year. Increasing global activity was of course the most important factor contributing to Finnish net exports but some merits must be given to the competitiveness pact too, a deal settled between the Finnish trade unions and employer organizations which came into effect last year.
The outlook for 2018 looks bright too. Rising investment demand in the euro area is forecasted to contribute positively to the development of the Finnish export industries that have specialized in producing investment goods. Exports are also helped with relatively moderate wage increases 15
negotiated for next two years by the Finnish trade unions and employer organizations. Private consumption is forecasted to get a boost from increasing employment this year. Overall, GDP is expected to grow by 2.8 per cent this year.
The growth in 2019 can be explained by the same factors as this year: rising export demand, especially from the euro area, amid still increasing private consumption which benefits from improving labour markets and moderate inflation expected for the next year too. As the Finnish economy is close to its potential, and at the same time, investment growth is expected to get slower, growth is forecasted to adjust to a more moderate pace with the GDP improving by 2.0 per cent next year.
Ireland
The Irish economy is forecasted to grow at a rate of 4.1 per cent in 2018. Our assessment that output is likely to increase by 4 per cent next year would again see Ireland outperform all European and most OECD countries in that regard. In 2017, the consistently robust performance of the Irish economy is illustrated by two key economic indicators; taxation revenues and labour market performance continue to register substantial increases. Building and construction has been steadily rising in 2017 and latest estimates suggests that we can expect somewhere in the region of 24,000 housing completions in 2018. One aspect of economic performance which is subdued is the traded sector of the economy. Both exports and imports registered much more muted levels of activity in 2017. Due to the approximately 17 per cent appreciation of the euro against the pound sterling since January 2016, we envisage falling demand for Irish exports from the UK. We do, however, still believe export growth will be positive over the year largely due to positive expected growth in the US and the EU.
As a result of this improvement in the domestic sources of growth, it is our view that the general government balance will also improve in 2018 with a surplus likely to be observed. The overall recent budgetary package was limited somewhat by the available fiscal space. The package of approximately €400 million in additional spending was in line with our recommendation for a neutral budget. In many respects, however, the real test for fiscal discipline will arise in the near future. Due to the rules governing the Stability and Growth Pact, the degree of fiscal space available to the Irish Government is set to increase significantly in the coming years. With the economy expected to continue to grow at robust rates, the Government will have to avoid the temptation to increase economic activity above that which is sustainable.
Austria2
In 2017, the Austrian economy enjoyed strong GDP growth, driven by lively activity abroad and the implicit stimulus to foreign trade. This boosted manufacturing industry, with output picking up markedly in the second half of 2017 and capacity utilization rising to a high level. As a consequence, firms increasingly step up investment in machinery and equipment to create new production facilities. Private consumption also provides continued support to GDP growth. According to the first estimates, GDP growth was 0.8 percent in Q4 2017 (qoq, trend-cycle component). This is approximately the same pace as in the previous quarters of the year.
2 With a few changes, the text is taken from Ederer, St. „Economic Outlook for 2017 to 2019: Strong Growth Prospects for Austria's Economy“, WIFO, 21.12.2017.
16
Lively business activity extends into early 2018, given the strong confidence prevailing in the corporate sector as well as with private households, underpinned by a steady improvement in labour market conditions. A retarding element is the persistently high, albeit declining, unemployment rate. Wage gains are therefore likely to remain moderate. Inflation is nevertheless higher in Austria than on average in the euro area. The lately observed unexpected hike in the prices of non-energy industrial goods and the unabated upward pressure from housing rents, food and catering services will still feed into headline inflation in 2018. In all, Austria's economy is projected to grow by 3 percent in 2018, roughly the same rate as in 2017, and by 2.2 percent in 2019.
UK
The economy has strengthened in the second half of 2017. Activity has been supported by the weaker exchange rate and by a buoyant global economy. These two factors have helped rebalance the UK economy away from domestic growth and towards net trade.
We have raised our forecast for real GDP growth for this year and next year from around 1.7 per cent to 1.9 per cent mainly because of a more positive outlook for global growth and to a lesser degree is also a response to the progress in Brexit negotiations.
The central forecast has been conditioned on a ‘soft’ Brexit assumption where the UK achieves close to full access to the EU market. That high level of market access will, in our view, come at a cost. We assume that the UK continues to make a budgetary contribution to the EU as before and net migration remains unaffected.
There is a risk that talks between the UK and the EU fail and the UK ends up trading under WTO rules. We estimate that a scenario where the UK is unable to replace the existing trade deals will lead to a long term annual loss in GDP of around 7 per cent relative to the baseline which is conditioned on a soft Brexit assumption. A large part of this loss is driven by the reduction in trade but there is also collateral damage to productivity growth.
Inflation on the CPI measure peaked at 3 per cent in the final quarter of 2017. Our forecast is broadly unchanged from November. We expect the MPC to continue with policy normalisation by raising Bank Rate every 6 months until the policy rate reaches 2 per cent in the middle of 2021.
17

Table 3 - Individual Country Forecasts
Country GDP growth (%)a CPI Inflation (HICP) (%)
Unemployment Rate (Eurostat definition, %)
Date of forecast
2017 2018 2019 2017 2018 2019 2017 2018 2019Austria (WIFO)** 3.0 3.0 2.2 2.2 2.0 1.9 5.6 5.4 5.3 21/10/2017Finland (ETLA) 3.1 2.8 2 0.7 1.2 1.6 8.6 8.1 7.7 08/02/2018France (OFCE) 1.8 1.7 1.9 1.2 1.1 1.5 9.5 9.3 9.0 18/10/2017Germany (DIW) 2.5 2.3 1.6 1.7 1.6 1.7 3.7 3.5 3.2 13/12/2017Germany (IfW) 2.6 2.6 2.3 1.7 1.7 1.8 3.8 3.4 3.0 14/12/2017Italy (Prometeia) 1.6 1.5 0.9 1.2 1.0 1.2 11.3 10.9 10.6 19/02/2018Ireland (ESRI) 5.0 4.7 3.9 0.3 0.7 1.1 6.9 5.5 4.8 20/02/2018Netherlands (CPB) 3.2 3.1 1.3 1.5 4.9 3.9 20/12/2018Poland (Case) 4.6 3.4 3.5 2.0 2.5 2.3 4.9 4.0 3.0 08/02/2018United Kingdom (NIESR) 1.8 1.9 1.9 2.7 2.7 2.1 4.4 4.3 4.3 07/02/2018
a working day adjusted** not working day adjusted
18