Embed Size (px)
Citation preview
American Journal of Tourism Management 2014, 3(1): 32-43 DOI: 10.5923/j.tourism.20140301.04
Measuring Tourist Service Satisfaction at Destination: A Case Study of Cox’s Bazar Sea Beach, Bangladesh
Mohammad Mehedy Hassan1,*, Md. Shahnewaz2
1Researcher, b-planning, 35/F/7, Road No-2, Shyamoly, Dhaka, Bangladesh 2College of Hotel & Catering Management, Flamingo International College, Malaysia
Abstract This study examines existing tourism services of the highly trafficked destination of Cox’s Bazar Sea beach in Bangladesh using a tourist satisfaction analysis. Using observation and self-determined questionnaire survey, the study classified tourist to their demographic and socioeconomic characteristics and measured satisfaction level using five point Likert-scales against seventeen selected variables. The findings of this study suggest that tourists were mostly satisfied with amenities related to destination management, with a natural attraction to the beach and relaxation facilities provided by the destination. In contrast, tourists were disappointed with facilities such as health and emergency services, transportation services, tour guides, information services and night life. The outcome of this empirical research will enable planners, investors, destination mangers and other vested interest groups to better understand tourist expectations and formulate improved strategies, regional policy and a balanced approach toward sustainable tourism development in the region. Keywords Cox’s Bazar, Tourist Satisfaction, Likert Scale, Tourist Expectations, Sustainable Tourism Development
1. Introduction Tourism is the single fourth largest and fastest growing
industry (Davenport & Davenport 2006; Hemmati & Koehler 2000) of the world in terms of employment generation and contribution to national GDP (WTTC 2013). Currently, travel and tourism share 9% of global GDP and have generated over 260 million jobs in 2012(WTTC 2013). As challenges from global climate change and economic recession pose a potential threat to the current global financial system, resulting in slowing down of national growth of many countries, tourism and travel industries still maintained growth as high as 3.1% in 2013. THE Tourism industry may become a tool for Third World countries to combat poverty by generating income and employment (Tooman, 1997), as well diversifying the economy (Emaad, 2007), given that the Third World countries often possess unparalleled natural beauty.
Bangladesh is a small deltaic riverine country located in South Asia and bordered by India (West, North and north east), Myanmar (South East), and Bay of Bengal (on the South). To many, Bangladesh possesses tremendous natural
* Corresponding author: [email protected] (Mohammad Mehedy Hassan) Published online at http://journal.sapub.org/tourism Copyright © 2014 Scientific & Academic Publishing. All Rights Reserved
and cultural resource for the development of tourism industries. In particular, the country has two undisputed heritages, the Sundarbans (Natural mangrove forest) and Cox’s Bazaar sea beach, the world’s longest unbroken sea beach. Both treasures are blessed by the Bay of Bengal and situated to the south along the blue water line of Bengal Bay. Apart from these, other historical, cultural and archeological tourist sites have been developed in certain pocket throughout the country.
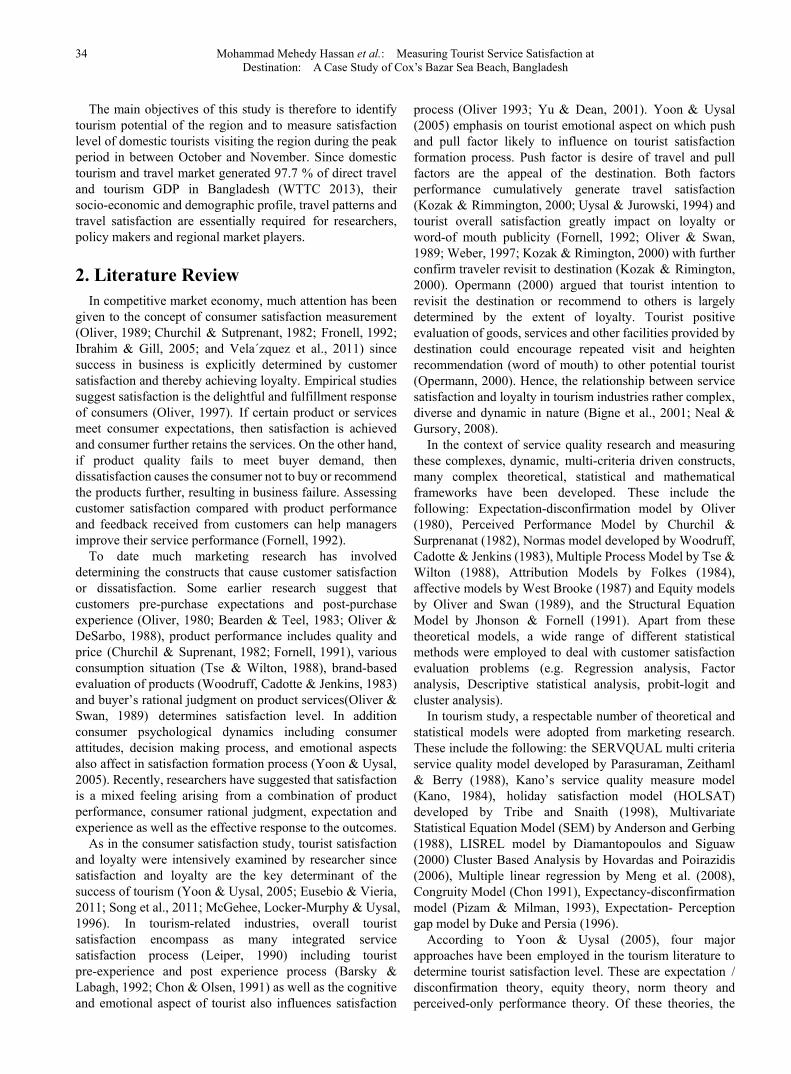
Although the country has huge potential for economic growth using tourism, the contribution from tourism sector to GDP and employment is only 2.1% and 1.9%, respectively (World Economic Forum, 2013). In comparison with neighbor countries, Bangladesh is the lowest recipient of international tourist and the size of both international and domestic tourism market is very insignificants (See table 1). Bangladesh is not well known to foreigners as a tourist destination; rather, it has been portrayed as a country stricken with poverty, climatic disasters and other poor images in the international environment. But the country has all the potential to be an attractive tourist destination in Asia pacific region. Moreover, the people themselves are hospitable, which is essential for the tourism industry. The present study area is a unique scenic beauty spot on the southernmost tip of Bangladesh under the district of Cox’s Bazar (Figure-1) and which is claimed as the world's longest unbroken natural sandy sea beach at120 km.
American Journal of Tourism Management 2014, 3(1): 32-43 33
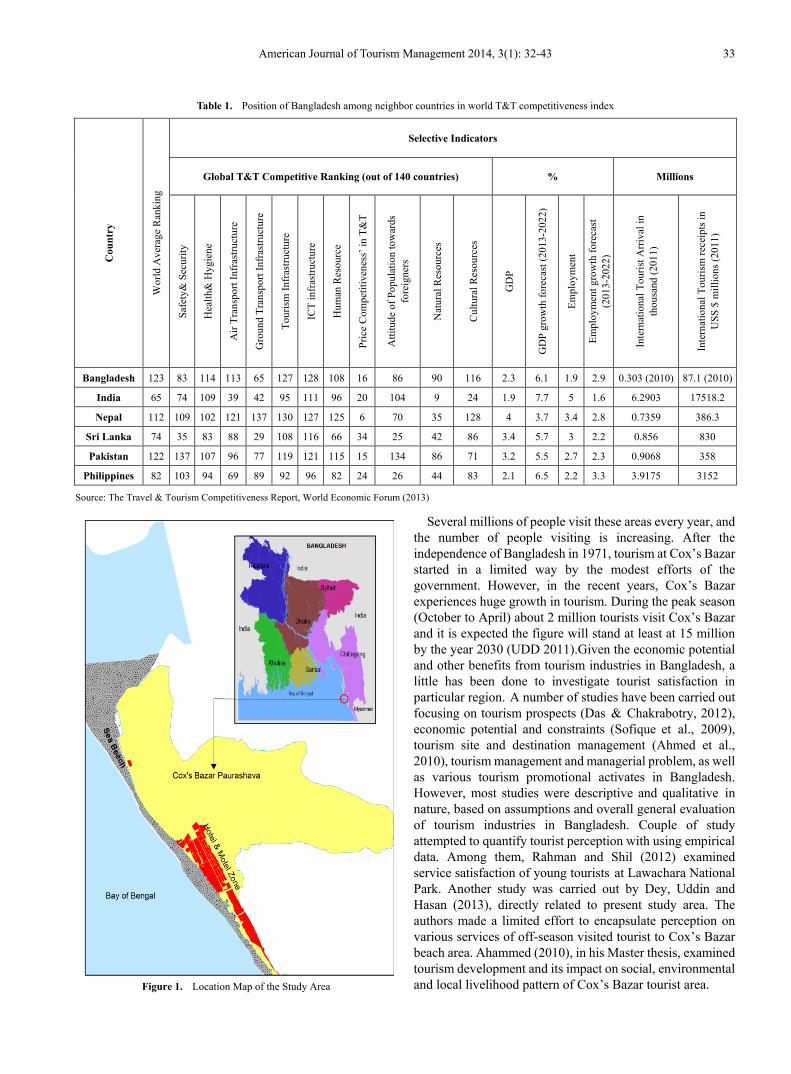
Table 1. Position of Bangladesh among neighbor countries in world T&T competitiveness index C
ount
ry
Wor
ld A
vera
ge R
anki
ng
Selective Indicators
Global T&T Competitive Ranking (out of 140 countries) % Millions Sa
fety
& S
ecur
ity
Hea
lth&
Hyg
iene
Air
Tran
spor
t Inf
rast
ruct
ure
Gro
und
Tran
spor
t Inf
rast
ruct
ure
Tour
ism
Infr
astru
ctur
e
ICT
infr
astru
ctur
e
Hum
an R
esou
rce
Pric
e C
ompe
titiv
enes
s’ in
T&
T
Atti
tude
of P
opul
atio
n to
war
ds
fore
igne
rs
Nat
ural
Res
ourc
es
Cul
tura
l Res
ourc
es
GD
P
GD
P gr
owth
fore
cast
(201
3-20
22)
Empl
oym
ent
Empl
oym
ent g
row
th fo
reca
st
(201
3-20
22)
Inte
rnat
iona
l Tou
rist A
rriv
al in
thou
sand
(201
1)
Inte
rnat
iona
l Tou
rism
rece
ipts
in
U
SS $
mill
ions
(201
1)
Bangladesh 123 83 114 113 65 127 128 108 16 86 90 116 2.3 6.1 1.9 2.9 0.303 (2010) 87.1 (2010)
India 65 74 109 39 42 95 111 96 20 104 9 24 1.9 7.7 5 1.6 6.2903 17518.2
Nepal 112 109 102 121 137 130 127 125 6 70 35 128 4 3.7 3.4 2.8 0.7359 386.3
Sri Lanka 74 35 83 88 29 108 116 66 34 25 42 86 3.4 5.7 3 2.2 0.856 830
Pakistan 122 137 107 96 77 119 121 115 15 134 86 71 3.2 5.5 2.7 2.3 0.9068 358
Philippines 82 103 94 69 89 92 96 82 24 26 44 83 2.1 6.5 2.2 3.3 3.9175 3152
Source: The Travel & Tourism Competitiveness Report, World Economic Forum (2013)
Figure 1. Location Map of the Study Area
Several millions of people visit these areas every year, and the number of people visiting is increasing. After the independence of Bangladesh in 1971, tourism at Cox’s Bazar started in a limited way by the modest efforts of the government. However, in the recent years, Cox’s Bazar experiences huge growth in tourism. During the peak season (October to April) about 2 million tourists visit Cox’s Bazar and it is expected the figure will stand at least at 15 million by the year 2030 (UDD 2011).Given the economic potential and other benefits from tourism industries in Bangladesh, a little has been done to investigate tourist satisfaction in particular region. A number of studies have been carried out focusing on tourism prospects (Das & Chakrabotry, 2012), economic potential and constraints (Sofique et al., 2009), tourism site and destination management (Ahmed et al., 2010), tourism management and managerial problem, as well as various tourism promotional activates in Bangladesh. However, most studies were descriptive and qualitative in nature, based on assumptions and overall general evaluation of tourism industries in Bangladesh. Couple of study attempted to quantify tourist perception with using empirical data. Among them, Rahman and Shil (2012) examined service satisfaction of young tourists at Lawachara National Park. Another study was carried out by Dey, Uddin and Hasan (2013), directly related to present study area. The authors made a limited effort to encapsulate perception on various services of off-season visited tourist to Cox’s Bazar beach area. Ahammed (2010), in his Master thesis, examined tourism development and its impact on social, environmental and local livelihood pattern of Cox’s Bazar tourist area.
34 Mohammad Mehedy Hassan et al.: Measuring Tourist Service Satisfaction at Destination: A Case Study of Cox’s Bazar Sea Beach, Bangladesh
The main objectives of this study is therefore to identify tourism potential of the region and to measure satisfaction level of domestic tourists visiting the region during the peak period in between October and November. Since domestic tourism and travel market generated 97.7 % of direct travel and tourism GDP in Bangladesh (WTTC 2013), their socio-economic and demographic profile, travel patterns and travel satisfaction are essentially required for researchers, policy makers and regional market players.
2. Literature Review In competitive market economy, much attention has been
given to the concept of consumer satisfaction measurement (Oliver, 1989; Churchil & Sutprenant, 1982; Fronell, 1992; Ibrahim & Gill, 2005; and Vela´zquez et al., 2011) since success in business is explicitly determined by customer satisfaction and thereby achieving loyalty. Empirical studies suggest satisfaction is the delightful and fulfillment response of consumers (Oliver, 1997). If certain product or services meet consumer expectations, then satisfaction is achieved and consumer further retains the services. On the other hand, if product quality fails to meet buyer demand, then dissatisfaction causes the consumer not to buy or recommend the products further, resulting in business failure. Assessing customer satisfaction compared with product performance and feedback received from customers can help managers improve their service performance (Fornell, 1992).
To date much marketing research has involved determining the constructs that cause customer satisfaction or dissatisfaction. Some earlier research suggest that customers pre-purchase expectations and post-purchase experience (Oliver, 1980; Bearden & Teel, 1983; Oliver & DeSarbo, 1988), product performance includes quality and price (Churchil & Suprenant, 1982; Fornell, 1991), various consumption situation (Tse & Wilton, 1988), brand-based evaluation of products (Woodruff, Cadotte & Jenkins, 1983) and buyer’s rational judgment on product services(Oliver & Swan, 1989) determines satisfaction level. In addition consumer psychological dynamics including consumer attitudes, decision making process, and emotional aspects also affect in satisfaction formation process (Yoon & Uysal, 2005). Recently, researchers have suggested that satisfaction is a mixed feeling arising from a combination of product performance, consumer rational judgment, expectation and experience as well as the effective response to the outcomes.
As in the consumer satisfaction study, tourist satisfaction and loyalty were intensively examined by researcher since satisfaction and loyalty are the key determinant of the success of tourism (Yoon & Uysal, 2005; Eusebio & Vieria, 2011; Song et al., 2011; McGehee, Locker-Murphy & Uysal, 1996). In tourism-related industries, overall tourist satisfaction encompass as many integrated service satisfaction process (Leiper, 1990) including tourist pre-experience and post experience process (Barsky & Labagh, 1992; Chon & Olsen, 1991) as well as the cognitive and emotional aspect of tourist also influences satisfaction
process (Oliver 1993; Yu & Dean, 2001). Yoon & Uysal (2005) emphasis on tourist emotional aspect on which push and pull factor likely to influence on tourist satisfaction formation process. Push factor is desire of travel and pull factors are the appeal of the destination. Both factors performance cumulatively generate travel satisfaction (Kozak & Rimmington, 2000; Uysal & Jurowski, 1994) and tourist overall satisfaction greatly impact on loyalty or word-of mouth publicity (Fornell, 1992; Oliver & Swan, 1989; Weber, 1997; Kozak & Rimington, 2000) with further confirm traveler revisit to destination (Kozak & Rimington, 2000). Opermann (2000) argued that tourist intention to revisit the destination or recommend to others is largely determined by the extent of loyalty. Tourist positive evaluation of goods, services and other facilities provided by destination could encourage repeated visit and heighten recommendation (word of mouth) to other potential tourist (Opermann, 2000). Hence, the relationship between service satisfaction and loyalty in tourism industries rather complex, diverse and dynamic in nature (Bigne et al., 2001; Neal & Gursory, 2008).
In the context of service quality research and measuring these complexes, dynamic, multi-criteria driven constructs, many complex theoretical, statistical and mathematical frameworks have been developed. These include the following: Expectation-disconfirmation model by Oliver (1980), Perceived Performance Model by Churchil & Surprenanat (1982), Normas model developed by Woodruff, Cadotte & Jenkins (1983), Multiple Process Model by Tse & Wilton (1988), Attribution Models by Folkes (1984), affective models by West Brooke (1987) and Equity models by Oliver and Swan (1989), and the Structural Equation Model by Jhonson & Fornell (1991). Apart from these theoretical models, a wide range of different statistical methods were employed to deal with customer satisfaction evaluation problems (e.g. Regression analysis, Factor analysis, Descriptive statistical analysis, probit-logit and cluster analysis).
In tourism study, a respectable number of theoretical and statistical models were adopted from marketing research. These include the following: the SERVQUAL multi criteria service quality model developed by Parasuraman, Zeithaml & Berry (1988), Kano’s service quality measure model (Kano, 1984), holiday satisfaction model (HOLSAT) developed by Tribe and Snaith (1998), Multivariate Statistical Equation Model (SEM) by Anderson and Gerbing (1988), LISREL model by Diamantopoulos and Siguaw (2000) Cluster Based Analysis by Hovardas and Poirazidis (2006), Multiple linear regression by Meng et al. (2008), Congruity Model (Chon 1991), Expectancy-disconfirmation model (Pizam & Milman, 1993), Expectation- Perception gap model by Duke and Persia (1996).
According to Yoon & Uysal (2005), four major approaches have been employed in the tourism literature to determine tourist satisfaction level. These are expectation / disconfirmation theory, equity theory, norm theory and perceived-only performance theory. Of these theories, the
American Journal of Tourism Management 2014, 3(1): 32-43 35
expectation/disconfirmation theory and perceived performance theory are most frequently used. The expectation/disconfirmation theory is based on the post-purchase concept. In this approach, tourist satisfaction is measured by a gap analysis between tourist expectation and travel perception of various services offered by the destination. In contrast, the perceived-only performance approach measures tourist satisfaction with the actual performance of the products, regardless of the existence of any previous expectations (Kozak, 2001; Um et al., 2006; Hui et al., 2007; Eusebio & Vieira, 2011).
Using perceived-performance approach, various destination variables were identified and satisfactions measured with a positive and negative evaluation of tourist over these attributes at the destination. For example, Wang and Qu (2006) investigated tourist satisfaction using twelve variables such as accommodations, shopping facilities, restaurant facilities, quality of accommodation, personal safety, tourist information, beach cleanness, and state of the roads, beach promenades, drinkable water, and traffic flow and parking facilities. Alegre and Garau (2010) examined dissatisfaction at a sun and sand tourist destination, namely the island of Majorca in the Balearic Islands. The following attributes were rated in terms of satisfaction; climate, cleanliness and hygiene, scenery, peace and quiet, accommodation, safety, historic sites or places, presence of friends and family, interaction with other tourist, night life, sports activities, tourist attractions, prior visits to the destination, ease of access, facilities for children, easy access to information, local cuisine, local lifestyle, and affordable prices.
Based on the aforementioned, this study measured satisfaction level of tourists to Cox’s Bazar using seventeen selected variables, as described in study method section.
3. Methodology In tourism studies, measuring tourist overall satisfaction
with particular destinations has become the key interest of many researchers (Yu & Goulden, 2006; Kozak, 2001; Meng, Tepanon & Uysal, 2008; Hui, Wan & Who, 2007; Neal & Gursory, 2008). Overall tourist satisfaction can be measured in terms of perceived performance of the distinct services which tourists encounter in different phases throughout the travel period (Geva & Goldman, 1991) such as that in the transportation sectors, accommodation, restaurants, travel agencies, shopping places, and spot environment as well. Thus, evaluating tourist satisfaction would likely be more complex for business success in tourism management (Alegre & Garau, 2009; Yoon & Uysal, 2005) than simply identifying each construct of customer satisfaction (Chang, 2008).In service satisfaction measurement, scale based evaluation methods (e.g. Likert type) on various service attributes of destination are commonly used (e.g. Hui, Wan and Who, 2007; Neal & Gursory, 2008; Eusebio & Vieira, 2011), in which respondents are asked to rate their satisfaction and dissatisfaction level on a scale. Finally,
various simple and complex statistical methods such as descriptive statistics (Huang & Hsu, 2009; Yu & Goulden, 2006), ANOVA test(Vogt & Andereck, 2003; Yu & Goulden, 2006), Factor Analysis (Eusebio & Vieira, 2011; Meng, Tepanon & Uysal, 2008; O’Neill et al., 2010; Yuksel 2000), Principal Component analysis(Huang & Hsu, 2009) and regression analysis (Meng, Tepanon & Uysal, 2008; O’Neill et al., 2010; Yuksel, 2000) are applied in order to establish a relationship between the construct and reliability of the outcome.
The data for the study were collected by means of a questionnaire survey using self-administrated questionnaires (Song et al., 2011; Yu & Goulden, 2006) distributed to over 350 tourists at tourist locations (from Laboni to Kolatoli sea beach area) in Cox’s Bazar during the peak time in October and November 2013. Before the final questionnaire, a pilot test was carried out (Chi, 2012; Yu & Goulden, 2006) on 20 visitors to evaluate questionnaire format and to avoid ambiguity of chosen variables for the survey. The pre-test questionnaires included 27 variables adopted from related tourism literature (Eusebio & Vieira, 2011; Heung & Qu, 2000; Song et.al. 2011). After getting feedback from pilot survey, the questionnaire was revised and a final questionnaire was created using the seventeen most important variables matching destination facilities (Eusebio & Vieira, 2011), excluding those variables not fitting with actual fact or those about which respondents were not knowledgeable about during the travel periods. These questions aimed to obtain respondents tour satisfaction experience and opinion of each travel attributes namely; Health Service Facilities, Transportation & Communication Service, Accommodation Service, Safety & Security, Food Services, Beauty, Cleanness, Hygiene & Sanitation, People’s Attitude, Tour Guides and Entertainment Facilities.
Beginning with the questionnaire, respondents were asked about their socio-economic and demographic characteristics including gender, age, occupation, monthly income, district of origin and other travel-related facts. Tourist satisfaction was quantified using a 5 point Likert-type scale. Respondents were asked to rate their satisfactions and dissatisfaction level for seventeen selected attributes on five point Likert-type ordinal scale, where midpoint refers to modestly satisfied and 1 and 5 indicate highest dissatisfaction and greatest satisfaction, respectively (Eusebio & Vieira, 2011; Meng, Tepanon & Uysal, 2008; Neal & Gursory, 2008; Yu & Goulden, 2006; O’Neill et al., 2010). To test reliability and internal consistency of satisfaction score, a Cronbach alpha was calculated (Yuksel, 2000). Again, principal factors analysis with VARIMAX rotation was performed on satisfaction attributes to identify latent variables associated with tourist satisfaction (McMullan & O’Neill, 2010; Meng, Tepanon & Uysal, 2008; O’Neill et al., 2010; Yuksel, 2000). The objective of principal factor analysis was to determine key constructs and obtain new variables that would prevent problems of multicollinearity effects in the model estimations. Finally, a multiple linear regression analysis was conducted to explain
36 Mohammad Mehedy Hassan et al.: Measuring Tourist Service Satisfaction at Destination: A Case Study of Cox’s Bazar Sea Beach, Bangladesh
the causal relationship between the factor coefficient and overall satisfaction scores. The aim of the regression analysis was to provide future interpretation of the independent variables and to assess whether the independent variables had a significant influence on the Overall Tourist Satisfaction Level (Blumberg et al., 2005; Meng, Tepanon & Uysal, 2008; Yuksel, 2000). In this study, factor coefficient scores were used as independent variables and Tourist Overall Satisfaction Scores were used as dependent variables. To measure the goodness-of-fit of the regression model, the correlation coefficient (R), coefficient of determination (R2) and “t” ratio were examined.
4. Findings and Analysis In tourism literature, tourist demographic patterns such as
age, gender, socio-economic background (income, marital status, occupation, education) and travel behavioral patterns were examined during the satisfaction based evaluation process (Yavuz, 1994). Font (2000) confirmed in his study that age, educational level, nationality and occupation are the determinant variables in the travel decision process. The tourist demographic and socioeconomic survey result (Table 2) of this study shows that an overwhelming number of tourists in the region are young, with a range between 18 to 34 years making up 69.33% of the respondents. These groups were either students or young professionals. The survey found that 22% were student and 27.33% were in business. Male tourist levels were significantly higher than female tourists. Of the total respondents, 76.27% were male and 23.73% female. It is worth mentioning that education level of tourists was relatively high, with 25% having university degrees and 9.33% having a post-graduation degree. The survey revealed that the largest proportion (39.73%) of the tourists reported a monthly income lower or equal to BDT 10000 and 29.87% of the respondents indicated monthly income between BDT 10000-20000. A significant number of tourists (24.40 %) reported monthly gross income between BDT 20000-50000, whereas 2.80 % of respondent reported incomes in excess of BDT 50000 monthly. The survey identified that family and friends were common groups during a tour. Among the respondents, 38.13 % were accompanied by family members and many (46%) also came with friends. Only a very small percentage of tourists were travelling to the resort alone, accounting for 6.27%.
A vast majority of the survey participants (64.27%) were informed about the location through word of mouth from either by friends or relatives. Newspapers and magazines also contributed to 17.87% of tourists as sources of information about the destination. Guide books, advertisement, television and other information sources were reported at less than 20%. Nearly 73% of tourists used busses as a medium of transportation. A large number of tourists used a bus because it was more economical. Some tourists sought safe, secure and protected journeys in both public and private sectors as 16% of the tourists used cars
and another 10 % took taxis or motorcycles to travel to Cox’s Bazar. Only a few (0.40%) used airways. Tourist’s travel cost to the resort area varied, ranging from BDT 500 – 10000>. It was found that 20.13% of tourists paid less than or equal to BDT500, one third of tourists spent BDT 500-1500, and 25.47% of the tourist paid BDT 1501-3000. The remainder at 20.67 % spent greater than BDT 3000 on travel to the tourist area. Duration of staying at the tourist spots largely varied. People were mainly travelling for a short break in the region. The majority of visitors stayed in Cox’s Bazar for less than two days, accounting for 62.80 % of the respondent. Tourists staying for 2-3 days were 22.67% and 13.07% stayed for 4-5 days. A few tourists (1.47 %) stayed for more than 5 days.
During the travel period, 89% of tourists stayed at a hotel or other locations such as motel (1.87%), rest house (1.07%) and the home or relatives (4.27%). 3.47% of tourist did not intend to stay overnight in the area. Respondents who stayed at hotel in the resort areas spent from less than BDT 1000 to more than BDT 3000 daily for accommodation. It was observed that 47.73% and 31.2% of tourists spent on accommodation less than BDT 1000 and BDT 1000-2000 respectively. 10.67% of tourists had a daily hotel cost of BDT 2001-3000 and 10.47% of tourists spent more than BDT 3000 daily for hotel expenditure. It is evident that most of the tourists selected hotels according to their affordability (cheap to moderate rate). The middle and low income group showed a higher number of tourists. The range of daily cost or expenditure of respondents varied greatly. According to survey results, 41% of tourists spent less than BDT 500, while 20% expended BDT 500-1500 and 27% spent BDT 1501-3000. 6% and 5% of tourists, respectively, spent 3001-5000 or more than BDT 5000. The survey results revealed that a large number of tourists paid multiple visits to the travel areas. This ranged from fewer than 3 times (36.67 %) to more than 8 times (10%). This signified that the travel area is a very popular resort and tourist destination. Tourists also narrated their feelings and described multiple reasons for visits to the travel areas. A large number of tourists (54.75%) visited the study area to satisfy their inherent thirst for natural beauty and a happy journey (30.71%). Some 9 % of tourists came to the resort to spend retired time and other for business and service purposes. Tourists who visited the Cox’s Bazar were mainly domestic tourists from different regions of Bangladesh. It has been observed that many tourists arrived from two major cities of Bangladesh; Dhaka and Chittagong reported as 51.71 % and 35.54% respectively. Other division such as Rajshahi, Khulna, Sylhet, Barisal and Ranjpur collectively contributed to 25 % of the arrivals. The findings of satisfaction survey indicated that tourists were not completely satisfied with the selected service indicators provided by the tourist destination. The descriptive statistics presented in table-3 show that out of seventeen satisfactions attributes, tourists positively evaluated only six attributes (Accommodation, Security and Safety, Beauty and Pleasing, People attitude, Shopping Facilities and Beach Cleanness) which also had the highest
American Journal of Tourism Management 2014, 3(1): 32-43 37
mean scores (3~4.7). In contrast, attributes such as health and emergency services, wash room and toilet facilities, artificial recreational facilities and tour information had the lowest mean values (below an average 2.5) and were negatively marked by the tourist.
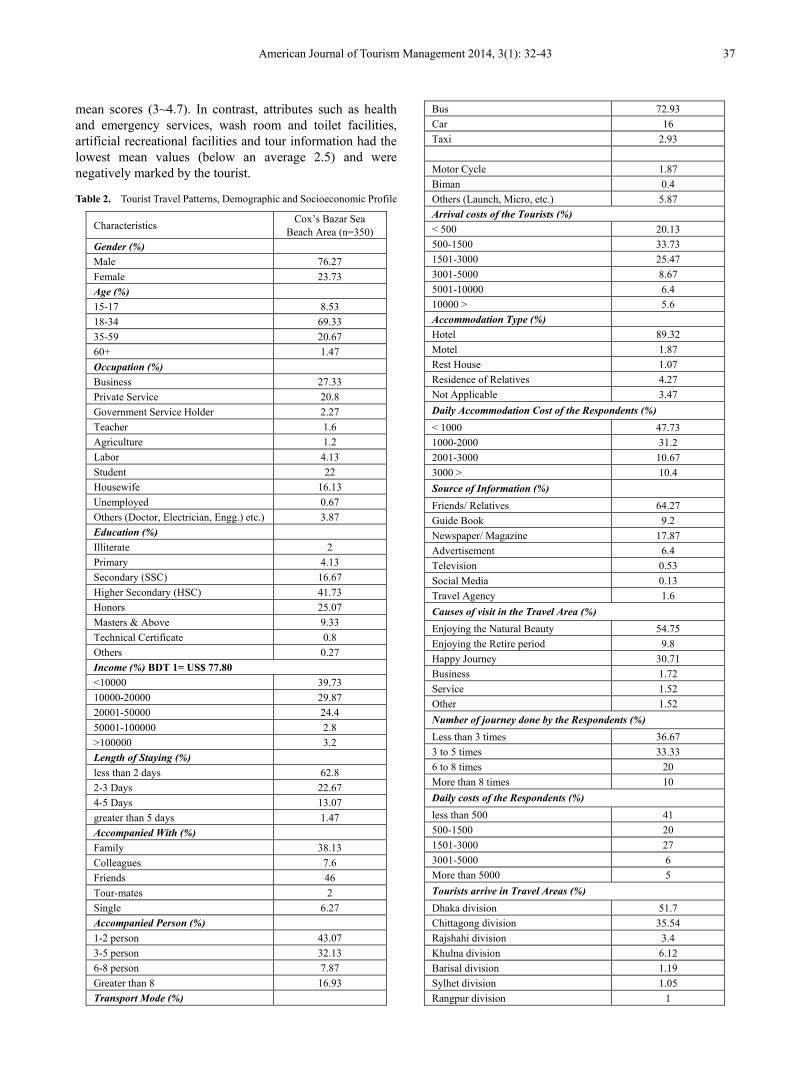
Table 2. Tourist Travel Patterns, Demographic and Socioeconomic Profile
Characteristics Cox’s Bazar Sea Beach Area (n=350)
Gender (%) Male 76.27 Female 23.73 Age (%) 15-17 8.53 18-34 69.33 35-59 20.67 60+ 1.47 Occupation (%) Business 27.33 Private Service 20.8 Government Service Holder 2.27 Teacher 1.6 Agriculture 1.2 Labor 4.13 Student 22 Housewife 16.13 Unemployed 0.67 Others (Doctor, Electrician, Engg.) etc.) 3.87 Education (%) Illiterate 2 Primary 4.13 Secondary (SSC) 16.67 Higher Secondary (HSC) 41.73 Honors 25.07 Masters & Above 9.33 Technical Certificate 0.8 Others 0.27 Income (%) BDT 1= US$ 77.80 <10000 39.73 10000-20000 29.87 20001-50000 24.4 50001-100000 2.8 >100000 3.2 Length of Staying (%) less than 2 days 62.8 2-3 Days 22.67 4-5 Days 13.07 greater than 5 days 1.47 Accompanied With (%) Family 38.13 Colleagues 7.6 Friends 46 Tour-mates 2 Single 6.27 Accompanied Person (%) 1-2 person 43.07 3-5 person 32.13 6-8 person 7.87 Greater than 8 16.93 Transport Mode (%)
Bus 72.93 Car 16 Taxi 2.93 Motor Cycle 1.87 Biman 0.4 Others (Launch, Micro, etc.) 5.87 Arrival costs of the Tourists (%) < 500 20.13 500-1500 33.73 1501-3000 25.47 3001-5000 8.67 5001-10000 6.4 10000 > 5.6 Accommodation Type (%) Hotel 89.32 Motel 1.87 Rest House 1.07 Residence of Relatives 4.27 Not Applicable 3.47 Daily Accommodation Cost of the Respondents (%) < 1000 47.73 1000-2000 31.2 2001-3000 10.67 3000 > 10.4 Source of Information (%)
Friends/ Relatives 64.27 Guide Book 9.2 Newspaper/ Magazine 17.87 Advertisement 6.4 Television 0.53 Social Media 0.13 Travel Agency 1.6 Causes of visit in the Travel Area (%) Enjoying the Natural Beauty 54.75 Enjoying the Retire period 9.8 Happy Journey 30.71 Business 1.72 Service 1.52 Other 1.52 Number of journey done by the Respondents (%) Less than 3 times 36.67 3 to 5 times 33.33 6 to 8 times 20 More than 8 times 10 Daily costs of the Respondents (%) less than 500 41 500-1500 20 1501-3000 27 3001-5000 6 More than 5000 5 Tourists arrive in Travel Areas (%) Dhaka division 51.7 Chittagong division 35.54 Rajshahi division 3.4 Khulna division 6.12 Barisal division 1.19 Sylhet division 1.05 Rangpur division 1
38 Mohammad Mehedy Hassan et al.: Measuring Tourist Service Satisfaction at Destination: A Case Study of Cox’s Bazar Sea Beach, Bangladesh
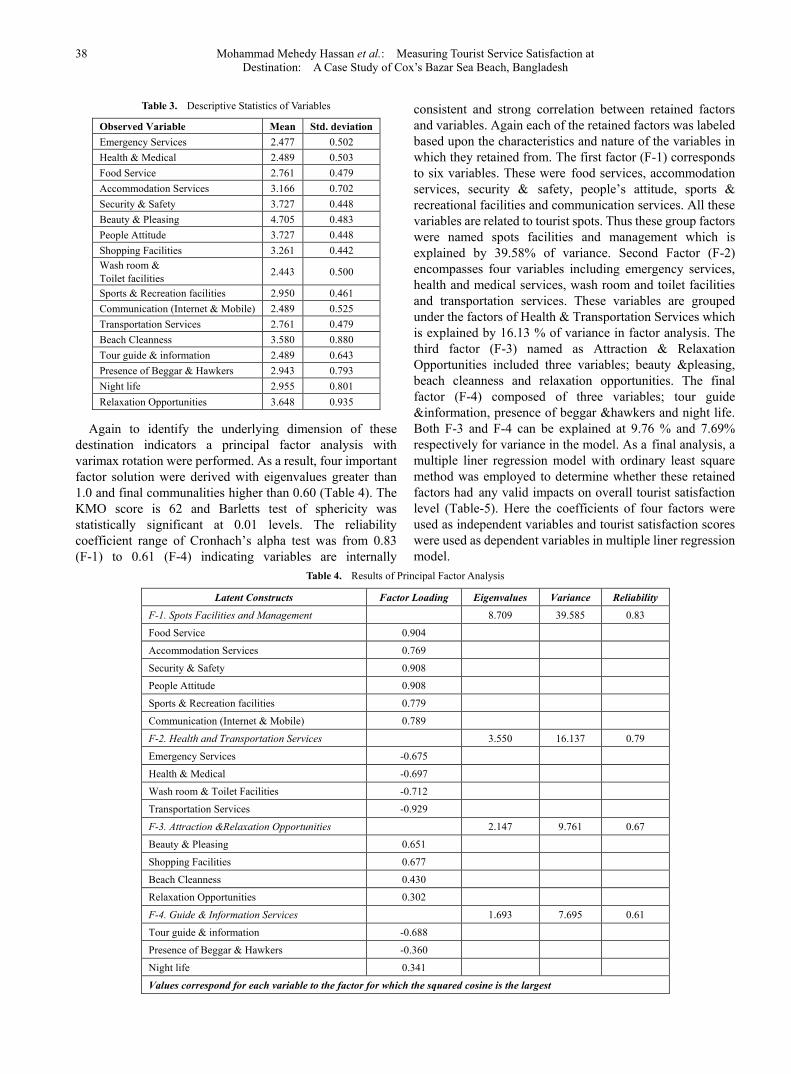
Table 3. Descriptive Statistics of Variables
Observed Variable Mean Std. deviation Emergency Services 2.477 0.502 Health & Medical 2.489 0.503 Food Service 2.761 0.479 Accommodation Services 3.166 0.702 Security & Safety 3.727 0.448 Beauty & Pleasing 4.705 0.483 People Attitude 3.727 0.448 Shopping Facilities 3.261 0.442 Wash room & Toilet facilities 2.443 0.500
Sports & Recreation facilities 2.950 0.461 Communication (Internet & Mobile) 2.489 0.525 Transportation Services 2.761 0.479 Beach Cleanness 3.580 0.880 Tour guide & information 2.489 0.643 Presence of Beggar & Hawkers 2.943 0.793 Night life 2.955 0.801 Relaxation Opportunities 3.648 0.935
Again to identify the underlying dimension of these destination indicators a principal factor analysis with varimax rotation were performed. As a result, four important factor solution were derived with eigenvalues greater than 1.0 and final communalities higher than 0.60 (Table 4). The KMO score is 62 and Barletts test of sphericity was statistically significant at 0.01 levels. The reliability coefficient range of Cronhach’s alpha test was from 0.83 (F-1) to 0.61 (F-4) indicating variables are internally
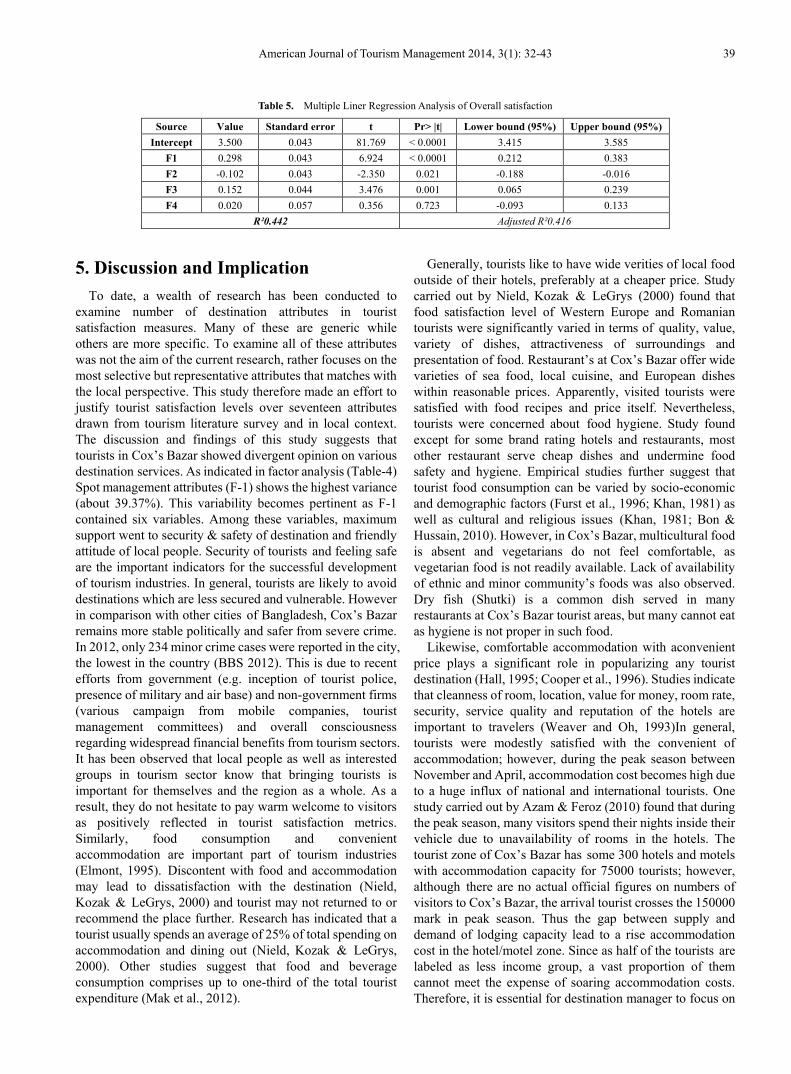
consistent and strong correlation between retained factors and variables. Again each of the retained factors was labeled based upon the characteristics and nature of the variables in which they retained from. The first factor (F-1) corresponds to six variables. These were food services, accommodation services, security & safety, people’s attitude, sports & recreational facilities and communication services. All these variables are related to tourist spots. Thus these group factors were named spots facilities and management which is explained by 39.58% of variance. Second Factor (F-2) encompasses four variables including emergency services, health and medical services, wash room and toilet facilities and transportation services. These variables are grouped under the factors of Health & Transportation Services which is explained by 16.13 % of variance in factor analysis. The third factor (F-3) named as Attraction & Relaxation Opportunities included three variables; beauty &pleasing, beach cleanness and relaxation opportunities. The final factor (F-4) composed of three variables; tour guide &information, presence of beggar &hawkers and night life. Both F-3 and F-4 can be explained at 9.76 % and 7.69% respectively for variance in the model. As a final analysis, a multiple liner regression model with ordinary least square method was employed to determine whether these retained factors had any valid impacts on overall tourist satisfaction level (Table-5). Here the coefficients of four factors were used as independent variables and tourist satisfaction scores were used as dependent variables in multiple liner regression model.
Table 4. Results of Principal Factor Analysis
Latent Constructs Factor Loading Eigenvalues Variance Reliability
F-1. Spots Facilities and Management 8.709 39.585 0.83
Food Service 0.904 Accommodation Services 0.769 Security & Safety 0.908 People Attitude 0.908 Sports & Recreation facilities 0.779 Communication (Internet & Mobile) 0.789 F-2. Health and Transportation Services 3.550 16.137 0.79
Emergency Services -0.675 Health & Medical -0.697
Wash room & Toilet Facilities -0.712 Transportation Services -0.929
F-3. Attraction &Relaxation Opportunities 2.147 9.761 0.67
Beauty & Pleasing 0.651
Shopping Facilities 0.677
Beach Cleanness 0.430
Relaxation Opportunities 0.302
F-4. Guide & Information Services 1.693 7.695 0.61
Tour guide & information -0.688
Presence of Beggar & Hawkers -0.360
Night life 0.341
Values correspond for each variable to the factor for which the squared cosine is the largest
American Journal of Tourism Management 2014, 3(1): 32-43 39
Table 5. Multiple Liner Regression Analysis of Overall satisfaction
Source Value Standard error t Pr> |t| Lower bound (95%) Upper bound (95%) Intercept 3.500 0.043 81.769 < 0.0001 3.415 3.585
F1 0.298 0.043 6.924 < 0.0001 0.212 0.383 F2 -0.102 0.043 -2.350 0.021 -0.188 -0.016 F3 0.152 0.044 3.476 0.001 0.065 0.239 F4 0.020 0.057 0.356 0.723 -0.093 0.133
R²0.442 Adjusted R²0.416
5. Discussion and Implication To date, a wealth of research has been conducted to
examine number of destination attributes in tourist satisfaction measures. Many of these are generic while others are more specific. To examine all of these attributes was not the aim of the current research, rather focuses on the most selective but representative attributes that matches with the local perspective. This study therefore made an effort to justify tourist satisfaction levels over seventeen attributes drawn from tourism literature survey and in local context. The discussion and findings of this study suggests that tourists in Cox’s Bazar showed divergent opinion on various destination services. As indicated in factor analysis (Table-4) Spot management attributes (F-1) shows the highest variance (about 39.37%). This variability becomes pertinent as F-1 contained six variables. Among these variables, maximum support went to security & safety of destination and friendly attitude of local people. Security of tourists and feeling safe are the important indicators for the successful development of tourism industries. In general, tourists are likely to avoid destinations which are less secured and vulnerable. However in comparison with other cities of Bangladesh, Cox’s Bazar remains more stable politically and safer from severe crime. In 2012, only 234 minor crime cases were reported in the city, the lowest in the country (BBS 2012). This is due to recent efforts from government (e.g. inception of tourist police, presence of military and air base) and non-government firms (various campaign from mobile companies, tourist management committees) and overall consciousness regarding widespread financial benefits from tourism sectors. It has been observed that local people as well as interested groups in tourism sector know that bringing tourists is important for themselves and the region as a whole. As a result, they do not hesitate to pay warm welcome to visitors as positively reflected in tourist satisfaction metrics. Similarly, food consumption and convenient accommodation are important part of tourism industries (Elmont, 1995). Discontent with food and accommodation may lead to dissatisfaction with the destination (Nield, Kozak & LeGrys, 2000) and tourist may not returned to or recommend the place further. Research has indicated that a tourist usually spends an average of 25% of total spending on accommodation and dining out (Nield, Kozak & LeGrys, 2000). Other studies suggest that food and beverage consumption comprises up to one-third of the total tourist expenditure (Mak et al., 2012).
Generally, tourists like to have wide verities of local food outside of their hotels, preferably at a cheaper price. Study carried out by Nield, Kozak & LeGrys (2000) found that food satisfaction level of Western Europe and Romanian tourists were significantly varied in terms of quality, value, variety of dishes, attractiveness of surroundings and presentation of food. Restaurant’s at Cox’s Bazar offer wide varieties of sea food, local cuisine, and European dishes within reasonable prices. Apparently, visited tourists were satisfied with food recipes and price itself. Nevertheless, tourists were concerned about food hygiene. Study found except for some brand rating hotels and restaurants, most other restaurant serve cheap dishes and undermine food safety and hygiene. Empirical studies further suggest that tourist food consumption can be varied by socio-economic and demographic factors (Furst et al., 1996; Khan, 1981) as well as cultural and religious issues (Khan, 1981; Bon & Hussain, 2010). However, in Cox’s Bazar, multicultural food is absent and vegetarians do not feel comfortable, as vegetarian food is not readily available. Lack of availability of ethnic and minor community’s foods was also observed. Dry fish (Shutki) is a common dish served in many restaurants at Cox’s Bazar tourist areas, but many cannot eat as hygiene is not proper in such food.
Likewise, comfortable accommodation with aconvenient price plays a significant role in popularizing any tourist destination (Hall, 1995; Cooper et al., 1996). Studies indicate that cleanness of room, location, value for money, room rate, security, service quality and reputation of the hotels are important to travelers (Weaver and Oh, 1993)In general, tourists were modestly satisfied with the convenient of accommodation; however, during the peak season between November and April, accommodation cost becomes high due to a huge influx of national and international tourists. One study carried out by Azam & Feroz (2010) found that during the peak season, many visitors spend their nights inside their vehicle due to unavailability of rooms in the hotels. The tourist zone of Cox’s Bazar has some 300 hotels and motels with accommodation capacity for 75000 tourists; however, although there are no actual official figures on numbers of visitors to Cox’s Bazar, the arrival tourist crosses the 150000 mark in peak season. Thus the gap between supply and demand of lodging capacity lead to a rise accommodation cost in the hotel/motel zone. Since as half of the tourists are labeled as less income group, a vast proportion of them cannot meet the expense of soaring accommodation costs. Therefore, it is essential for destination manager to focus on
40 Mohammad Mehedy Hassan et al.: Measuring Tourist Service Satisfaction at Destination: A Case Study of Cox’s Bazar Sea Beach, Bangladesh
providing wide varieties of foods and sufficient lodging facilities with maximum hygiene and comfort to tourist at reasonable rate and also for people from a diverse socio-economic background.
Again a large portion of tourists were satisfied with strong mobile network coverage; nonetheless, they were disappointed with slow internet services. A huge number of tourists were from different professional groups like businessmen, technocrats, public servants, private service holders, teacher and students who require communication services for urgent business and most importantly required access to social media (e.g. Facebook, twitter, YouTube) for instantly sharing travel experience to their friends and others.
Moreover, tourists also expressed divergent feelings on recreational facilities. In fact, tourists were delighted with beach recreational facilities and some other recreational facilities in hotel compounds (e.g. spa, bar, barbecue, water sports, swimming pool, children amusement, restaurant, coffee shop, gymnasium, and indoor games), nevertheless general recreational facilities for mass tourists are virtually absentor not adequate; as a result, tourists show less interest in staying longer. Hence, it is necessary to keep a tourist for at least a week and expansion of existing recreational facilities and the development of various artificial recreational facilities to be must so that the visitors can stay longer. Such facilities include various sports, theatre, dance and music, various destinations with diversified attractions, good shopping facilities and so on. Natural parks, water parks and museums are also important for attracting and keeping tourists.
It has been observed both health and emergency service such as life boat, firstaid, ambulance and other emergency services are insufficient. Among the survey respondents, some 35% did not find health and emergency facilities in the tourist area. Another 20% opined that health service is very bad. Also, wash room facilities and public toilet services are very sporadic. Separate wash room facilities for women are largely absent in the beach area. Consequently, tourists were dissatisfied with health, emergency and wash room services.
Visited tourist also disappointed with local transportation services and road infrastructure. Despite good bus linkages between Cox’s Bazar and other parts of the country, the local transport for movement is not suitable. Damaged and dilapidated roads network with traffic congestion is also observed in tourist area. At present, rickshaws and easy bikes are common and available everywhere, but the fare is not regulated by an appropriate authority. This gives an opportunity to exploit passengers; particularly those are first-time visitors. On the other hand, air traffic is highly infrequent, a railway is totally absent and there exists hardly any means to visit the area rapidly.
100% of tourists were highly satisfied with natural bounty, vast sandy beach, cleanness environment, relaxation opportunities and Burmese fashion market for excellent shopping facilities. Nonetheless, tourists were not pleased with guide and information services. Apart from Cox’s Bazaar Sea beach, there some proven sites where the tourists
are usually attracted in and around Cox’s Bazar. These are Inani Beach, Himchari waterfall and Eco-park, Aggmeda Khyang, Maheshkhali Adinath Mandir, Ramu, Sonadia Island, Kutubdia Sea beach, Mankhali, Teknaf Game Forest and Beach, Shahparir Dwip, and St. Martin’s Island. These places are equivalently important and offer huge adventure and lifetime experience for the tourist. Despite, almost every respondent of this study stated that they knew these areas but did not have enough information to go there after the sea beaches. It has been observed that virtually there is no tourist information center in common places for tourists. Even trained tourist guide, city guide map, tourist maps and signposts werealmost absent. Local people, beach camera men, hawkers and rickshaws puller willingly provide information for the tourist and sometimes act as tour guide but these services do not come often without trouble. Tourists also did not see night life in Cox’s Bazar as enjoyable due to lack of sufficient artificial recreational facilities. Presences of beggar and hawkers were satisfactory. However, these variables do not affect satisfaction level.
6. Conclusions The findings of this research indicate that tourist
evaluation of destination attributes is still the most important indicator of overall tourist satisfaction. Tourist at Cox’s Bazaar had divergent opinions on various service indicators selected for this study. Tourists were overwhelmed by the natural beauty of the spots. However, the lowest level of satisfactions was observed with respect to attributes such as city transportation services, destination information services, health and emergency services and artificial recreational services. As deduced from the tourist survey, a majority of tourists stay less than two days. Prevalence of short duration of staying of tourists at the resorts indicated that staying was costly and somewhat unaffordable. Amenities also were scarce.
Hence, artificial recreational facilities and number of destination with diverse attraction should be developed for mass tourist so that tourists stay for at least a week. In addition, low cost accommodations such as hostels and bed and breakfast can be made for the backpacker tourist, youth tourist, non-institutionalized tourist or budget preference/ economy tourist. Although development of various multi-storied hotel projects has been observed in the resort area, it seems that development of tourism does not only mean developing hotels or tourist accommodation, but rather requires total development of the region as well as enhance competitiveness of those sectors that directly or indirectly involved in tourism. As global competitiveness in tourism industries increases and the challenges will be faced in the years to come, destination managers and other market players should pay close attention to enhancing their existing services and expansion of other facilities that were negatively evaluated by the tourists in this study. As resource constraints by the government have been observed, investors, market players and beneficiaries from this sector should
American Journal of Tourism Management 2014, 3(1): 32-43 41
come forward to advance all-round development of the tourism sector particularly in the region and the country as a whole. This study has generated a wealth of information on aspect of service provisions available in the region. Nevertheless, the current research does have some limitations especially about the small sample size. This small sample size might have an effect on overall generalization of the findings. However, the results should not consider to be generalized rather to be taken as impression where potential problem arise and how to probably deal with these problem. Thus, further studies in this field are required with robust data collection and specific case analysis between the domestic and international samples.
REFERENCES [1] Alegre, J., & Garau, J. (2009). Tourist Satisfaction Indices: A
critical approach. Investigaciones Regionales, 14, 5-26.
[2] Ahamed, F., Azam, M.S.,& Bose, T.K. (2010). Factor affecting the selection of tour destination in Bangladesh: an Empirical Analysis. International Journal of Business and Management, 5,(3).
[3] Ahammed, S.S. (2010). Impact to Tourism in Cox’s Bazar. Bangladesh, Master’s thesis in Public Policy and Governance Program. Dept. of General and Continuing Education, North South University, Bangladesh.
[4] Anderson, J.C., & Gerbing, D.W. (1988). Structural equation modeling in practice: a review and recommended two-step approach. Psychological Bulletin, 103 (3), 411– 423.
[5] Azam, S., & Feroj, A. (2010). Factors Affecting the Selection of Tour Destination in Bangladesh: An Empirical Analysis. International journal of Business and Management, 5(3).
[6] Barsky, J., & Labagh, R. (1992). A strategy for customer satisfaction. Cornell Hotel and Restaurant Administration Quarterly. 32-40.
[7] BBS. (2012). Statistical Yearbook of Bangladesh Bangladesh, Bureau of Statistics, Planning Division, Ministry of Planning, GoB, Dhaka, Bangladesh.
[8] Bearden, W. O., & Jesse, E. T. (1983). Selected Determinants of Consumer Satisfaction and Complaint Reports. Journal of Marketing Research, 20(1),21-28.
[9] Bon, M., & Hussain, M. (2010). Halah Food and Tourism: Prospects and Challenges. In N. Scott & J. Jafari (Eds.), Tourism in the Muslim World: Bridging Tourism Theory and Practice (Vol. 2, pp. 47-59).Bingley: Emerald Group Publishing.
[10] Bigné, J.E., Sánchez, M.I., & Sánchez, J. (2001). Tourism image, evaluation variables and after purchase behavior: inter-relationship. Tourism Management, 22, 607– 616.
[11] Blumberg, B., Cooper, D.R., & Schindler, P.S. (2005). Business research methods. London: McGraw-Hill.
[12] Chang, J. C. (2008). Tourist’s Satisfaction Judgments: An Investigation of Emotion, Equity and Attribution. Journal of
Hospitality & Tourism Research, 32(1), 104-134.
[13] Chi, C.G. (2012). An examination of destination loyalty: Differences between first-time and repeat visitors. Journal of Hospitality & Tourism Research, 36(1) 3-24.
[14] Chon, K.S., & Olsen, M.D. (1991). Functional and Symbolic Approaches to Consumer Satisfaction/Dissatisfaction. Journal of the international Academy of Hospitality Research, 28(1), 1-20.
[15] Churchill, G. A. & Surprenant, C. (1982). An investigation into the determinants of customer satisfaction. Journal of Marketing Research, 19(3), 491-504.
[16] Cooper, C., Fletcher, J., Gilbert, D., & Wanhill, S. (1996). Tourism Principles and Practice, London: Longman.
[17] Das, R.K., & Chakrabotry, J. (2012). An evaluation study on tourism in Bangladesh. Research Journal of Finance and Accounting, 3,(1).
[18] Dey, P., Uddin, S., & Hassan, M.K. (2013). Tourist Precipitation towards Cox’s Bazar Sea Beach in Bangladesh as a Tourist Destination. Asian Business Review, 2.
[19] Davenport, J., & Davenport, J.L. (2006). The impact of tourism and personal leisure transport on coastal environments: a review. Estuar. Coast. Shelf Sci. 67, 280 e292.
[20] Diamantopoulos, A., & Siguaw, J.A. (2000). Introducing LISREL. SAGE: London.
[21] Duke, C. R., & Persia, M. A. (1996). Consumer-Defined Dimensions for the Escorted Tour Industry Segment: Expectations, Satisf action and Importance. Journal of Travel and Tourism Marketing, 5 (1-2)77-99.
[22] Elmont, S. (1995). Tourism and food service. Cornell Hotel and Restaurant Administration Quarterly,57-63.
[23] Emaad, M. (2007). Tourism Development Strategies and Poverty Elimination. Problem and Perspectives in Management, 5, (1).
[24] Eusebio C., & Vieira A.L. (2011). Destination Attributes’ Evaluation, Satisfaction and Behavioral Intentions: a Structural Modeling Approach. International Journal of Tourism Research.
[25] Folkes, V.S. (1984). Consumer Reaction to Product Failure: An attributional approach. Journal of Consumer Research, 398-409.
[26] Font, A. R. (2000). Mass tourism and the demand for protected natural areas: a travel cost approach. Journal of Environmental Economics and Management, 39(1), 97-116.
[27] Fornell, C. (1992). A National Customer Satisfaction Barometer: The Swedish Experience. Journal of Marketing, 56(1), 6–21.
[28] Furst, T., Connors, M., Bisogni, C. A., Sobal, J., & Falk, L. W. (1996). Food choice: A conceptual model of the process. Appetite, 26, 247-266.
[29] Geva, A., & Goldman, A. (1991). Duality in Consumer Post-Purchase Attitude. Journal of Economic Psychology, 12,141-164.
[30] Hall, C. (1995). Introduction to Tourism: Development. (2nd

42 Mohammad Mehedy Hassan et al.: Measuring Tourist Service Satisfaction at Destination: A Case Study of Cox’s Bazar Sea Beach, Bangladesh
ed.). Melbourne: Longman Cheshire.
[31] Hemmati, M., & Koehler, N. (2000). Financial Leakages in Tourism. Sustainable Travel and Tourism, 25-29.
[32] Hovardas, T., & Poirazidis, K. (2006). Evaluation of the environmentalist dimension of ecotourism at the Dadia Forest Reserve (Greece). Environmental Management, 38, 810–822.
[33] Hui,T., Wan, D., & Ho, A. (2007). Tourists' satisfaction, recommendation and revisiting Singapore. Tourism Management, 28, 965-75.
[34] Huang,S., & Hsu, C.H.C., (2009). Effects of travel motivation, past experience, perceived constraint, and attitude on revisit intention. Journal of Travel Research, 48 (1), 29-44.
[35] Ibrahim, E. E. & Gill, J. (2005). A positioning strategy for a tourist destination, based on analysis of customers’ perceptions and satisfactions. Marketing Intelligence and Planning, 23(2), 172–188.
[36] Johnson, M. D., & Fornell, C. (1991), A Framework for Comparing Customer Satisfaction Across Individuals and Product Categories. Journal of Economic Psychology, 12(2), 267-286.
[37] Kano, N. (1984). Attractive quality and must-be quality. Journal of the Japanese Society for Quality Control, 1 (4), 39–48.
[38] Khan, M. A. (1981). Evaluation of food selection patterns and preferences. CRC Critical Reviews in Food Science and Nutrition, 15, 129-153.
[39] Kozak, M., & Rimmington, M. (2000). Tourist satisfaction with Mallorca, Spain, as an off-season holiday destination. Journal of Travel Research , 38(3), 260–269.
[40] Kozak, M. (2001). A critical review of approaches to measure satisfaction with tourist destinations. Tourism Analysis, 5(2),191-196.
[41] Leiper, N. (1990). Tourist Attraction Systems. Annals of Tourism Research, 17 (3), 367-384.
[42] Mak, A.H.N., Lumbers, M., Eves, A., & Chang, R.C.Y. (2012). Factors influencing tourist food consumption. International Journal of Hospitality Management, 31, 928-936.
[43] McGhee, N.G., Loker-Murphy, L., & Uysal, M. (1996). The international pleasure travel market: Motivations from a gendered perspective. The Journal of Tourism Studies, 7 (1), 45-57.
[44] McMullan, R. & O’Neill, M. (2010). Towards a valid and reliable measure of visitor satisfaction. Journal of Vacation Marketing,16 (1) 29-44.
[45] Meng, F., Tepanon, Y., & Uysal, M. (2008). Measuring tourist satisfaction by attribute and motivation: The case of nature-based resort. Journal of Vacation Marketing, 14(1), 41–56.
[46] Neal, D.J & Gursory, D. (2008). A Multifaceted Analysis of Tourism Satisfaction. Journal of Travel Research, 47, 53-63.
[47] Nield, K., Kozak, M., & LeGrys, G. (2000). The role of food services in tourist satisfaction. Hospitality Management, 19, 375-384.
[48] O’Neill, M. A., Riscinto-Kozub, K.A., & Hyfte, M.V. (2010). Defining visitor satisfaction in the context of camping oriented nature-based tourism-the driving force of quality. Journal of Vacation Marketing, 16 (2), 141-156.
[49] Oliver, R. L. (1980). A Cognitive Model of the Antecedents and Conse-quences of Satisfaction Decisions. Journal of Marketing Research, 17,460-69.
[50] Oliver, R.L. (1993). A Conceptual Model of Service Quality and Service Satisfaction: Compatible Goals, Different Concepts. Adv Service Marketing Management, 2, 65-85.
[51] Oliver, R.L. & Swan, J.E. (1989). Consumer Perceptions of Interpersonal Equity and Satisfaction in Transactions: A Field Survey Approach. Journal of Marketing, 53,21-35.
[52] Oliver, R. (1997). Satisfaction: A behavioural perspective on the consumer. New York: McGraw Hill.
[53] Oliver, R.L., & De Sarbo, W.S. (1988). Response Determinants in Satisfaction Judgments. Journal of Consumer Research, 14, 495-507.
[54] Oppermann, M. (2000). Tourism destination loyalty. Journal of Travel Research, 39, 78-84.
[55] Parasuraman, A., Zeithaml, V. A., & Berry, L. L. (1988). SERVQUAL: Amultiple-item scale for measuring consumer perceptions of service quality. Journal of Retailing, 64,12–40.
[56] Pizam, K.B., & Milman,A. (1993). Social impacts of tourism: Host perceptions. Annals of Tourism Research, 20, 650–655.
[57] Rahman, H.M.T., & Shil, S. R. (2012). Measuring service satisfaction of young tourists: a case study of Lawachara National Park, Bangladesh. Anatolia: An International Journal of Tourism and Hospitality Research, 1-11.
[58] Song, H., Li, G., Veen, R., & Chen, J. L. (2010). Assessing Mainland Chinese Tourist Satisfaction with Hong Kong Using Tourist Satisfaction Index. International Journal of Tourism Research, 13,82-96.
[59] Sofique, M.A., & Parveen, J.A. (2009). Economic Prospects and Constraints of Cox’s Bazar Bangladesh-A Study. South Asian Journal of Tourism and Heritage, 2(1).
[60] Tooman. A.L. (1997). Tourism and Development. Journal of Travel Research, 35,33-40.
[61] Tribe, J., & Snaith, T. (1998). From SERVQUAL to HOLSAT: holiday satisfaction in Varadero, Cuba. Tourism Management, 19(1), 25 - 34.
[62] Tse, D.K., Wilton, P.C. (1988). Models of Consumer Satisfaction Formation: An Extension. Journal of Marketing Research, 25(2), 204–12.
[63] UDD (2011). Preparation of Development Plan of Cox’s Bazar Town and Sea Beach up to Teknaf, Ministry of Housing and Public Works, Government of the People’s Republic of Bangladesh.
[64] Um, S., Chon, K., & Ro, Y. (2006). Antecedents of revisit intention. Annals of Tourism Research, 33(4), 1141-1158.
[65] Uysal, M., & Jurowski, C. (1994). Testing the push and pull factors. Annals of Tourism Research, 21(4), 844 – 846.
[66] Vela´zquez, M.B., Saura, I.G., & Molina, M.E.R. (2011).
American Journal of Tourism Management 2014, 3(1): 32-43 43
Conceptualizing and measuring loyalty: Towards a conceptual model of tourist loyalty antecedents. Journal of Vacation Marketing, 17(1), 65-81.
[67] Vogt, C.A., & Andereck K. L. (2003). Destination perceptions across a vacation. Journal of Travel Research, 41, 348-354.
[68] Wang, S. & Qu, H. (2006). A Study of Tourist Satisfaction Determinants in the Context of the Pearl River Delta Sub-Regional Destinations. Journal of Hospitality and Leisure Marketing, 14 (3), 49-63.
[69] Weaver, P. A., & Oh, H. C. (1993). Do American business travelers have different hotel service requirements?. International Journal of Contemporary Hospitality Management, 5(3),16–21.
[70] Weber, K. (1997). The assessment of tourist satisfaction using the expectancy disconfirmation theory: A study of the German travel market in Australia. Pacific Tourism Review, 1, 35–45.
[71] Woodruff, R. B., Ernest, R.C., & Jenkins, R.L. (1983). Modeling Consumer Satisfaction Processes Using Experience-Based Norms. Journal of Marketing Research, 20,296-304.
[72] World Economic Forum (2013), Travel & Tourism Competitiveness Report 2013http://www.weforum.org/reports/travel-tourism-competitiveness-report-2013]
[73] World Travel & Tourism Council Bangladesh (2013) ‘Travel & Tourism Economic Impact’ [on line at http://www.wttc.travel, accessed on 20 October, 2013]
[74] Yavuz, N. F.(1994). A market segmentation study of visitors to North Cyprus through importance-performance analysis of destination attributes. Virginia Polytechnic Institute and State University.
[75] Yu, Y. T., & Dean, A. (2001). The contribution of emotional satisfaction to consumer loyalty. International Journal of Service Industry Management, 12(3), 234-250.
[76] Yu, L., & Goulden, M. (2006). A comparative analysis of international tourists satisfaction in Mongolia. Tourism Management, 27, 1331-1342.
[77] Yoon, Y., & Uysal, M. (2005). An examination of the effects of motivation and satisfaction on destination loyalty: a structural model. Tourism Management, 26, 45-56.
[78] Yuksel, A. (2000). Managing customer satisfaction and retention: A case of tourist destinations, Turkey. Journal of Vacation Marketing, 7 (2), 153-168.