Embed Size (px)
Citation preview
8/2/2019 Cowan TelecomServices10292010
http://slidepdf.com/reader/full/cowan-telecomservices10292010 1/34
Telecom and Data Services
Industry Overview
October 29, 2010 Fiber: A Sector Evolves
AnalystsColby Synesael
(646) 562-1355
Jonathan Charbonneau
(646) 562-1356
jonathan.charbonneau
@cowen.com
Please see addendumof this report forimportant disclosures.
www.cowen.com
Conclusion: We believe increasing utilization of private WANs (wide areanetworks) and the public Internet will increase demand for fiber-basednetworks over the next several years and that this will create significantinvestment opportunities. After nearly ten years of 1) market consolidation, 2)increasing utilization, and 3) improving pricing, we believe we have reached aninflection point. Specifically, we believe the network has become an essentialcomponent of everyday life in both personal and business environments andthat this trend will accelerate in coming years. This in turn should drive double-digit revenue growth and increasing ROIC for the next few years for pure playbandwidth infrastructure providers focused on providing data-orientedservices to wholesale and enterprise customers.
■ A Reintroduction to the Revitalized Bandwidth InfrastructureIndustry. Over the next few years we expect bandwidth infrastructure toevolve into a sizable standalone segment of the telecom services industry.While there will continue to be demand for voice-oriented services (even if itis primarily VoIP), we believe fiber companies that focus on providing asimplified/focused set of data services will generate the most growth andhighest margin. Although telecom networks were originally designed to helptransport voice, it is clear today that voice is only an application and thatcompanies focused on delivering all content over a horizontally alignednetwork are best positioned. Where we believe companies will be able todifferentiate is on 1) network density, 2) on-net locations, and 3) uniquenessof route.
■ Relevant public companies. AboveNet (ABVT); Alaska (ALSK), AT&T (T),Cablevision (CVC), CenturyLink (CTL), Cogent (CCOI), Comcast (CMCSA),FiberTower (FTWR), Global Crossing (GLBC), Knology (KNOL), Level 3 (LVLT),Hickory Tech (HTCO), PAETEC (PAET), Sprint (S), TowerStream (TWSR), twtelecom (TWTC), Verizon (VZ), XO (XOHO).

8/2/2019 Cowan TelecomServices10292010
http://slidepdf.com/reader/full/cowan-telecomservices10292010 2/34
Telecom and Data Services
October 29, 20102
Sections
Introduction………….………………………………………………………………………………………………………………………………………..5
Market Consolidation…………………………………………………………………………………………………………………………………5
Increasing Utilization...………………………………………………………………………………………………………………………………7
Improving Pricing………………...…………………………………………..………………………………………………………………………10
Copper Will No Longer Do……..………………………………………………………………………………………………………………11
Another Large Buildout is Unlikely…………………..…………………………………………………………….………………..11
Service Offerings…………………………………………………………………………………………..............................................13
Customers………….………………………………………………………………………………………………………………………………………….16
Ethernet Exchanges…………………………………………………………………………………………………………………………………..17
Wireless Backhaul………………………………………………………………………………………………………………………………………18
Conclusion……………………..…………………………………………………………………………………………………………………………….20
Company Example…………………………………………………………………………………………………………………………………….22
Definitions…………….………………………………………………………………………………………………………………………………………24
M&A Transactions 2006-Present…………………………………………………………………………………………………………25
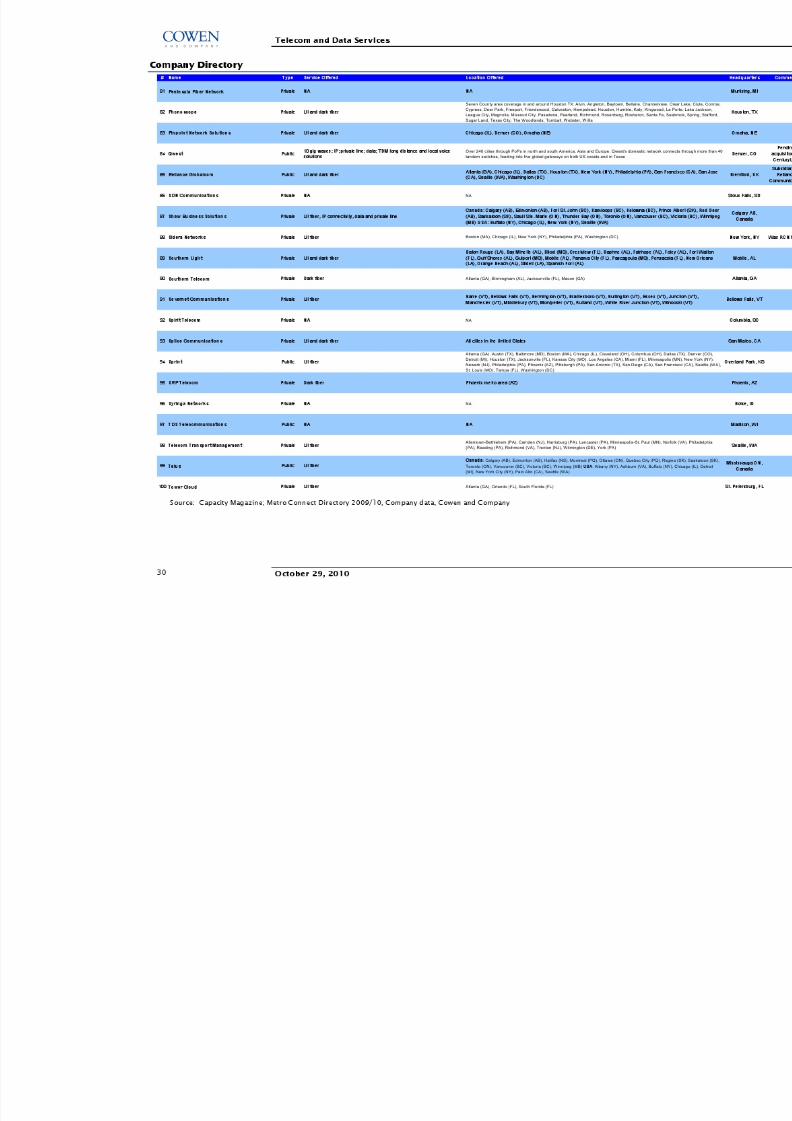
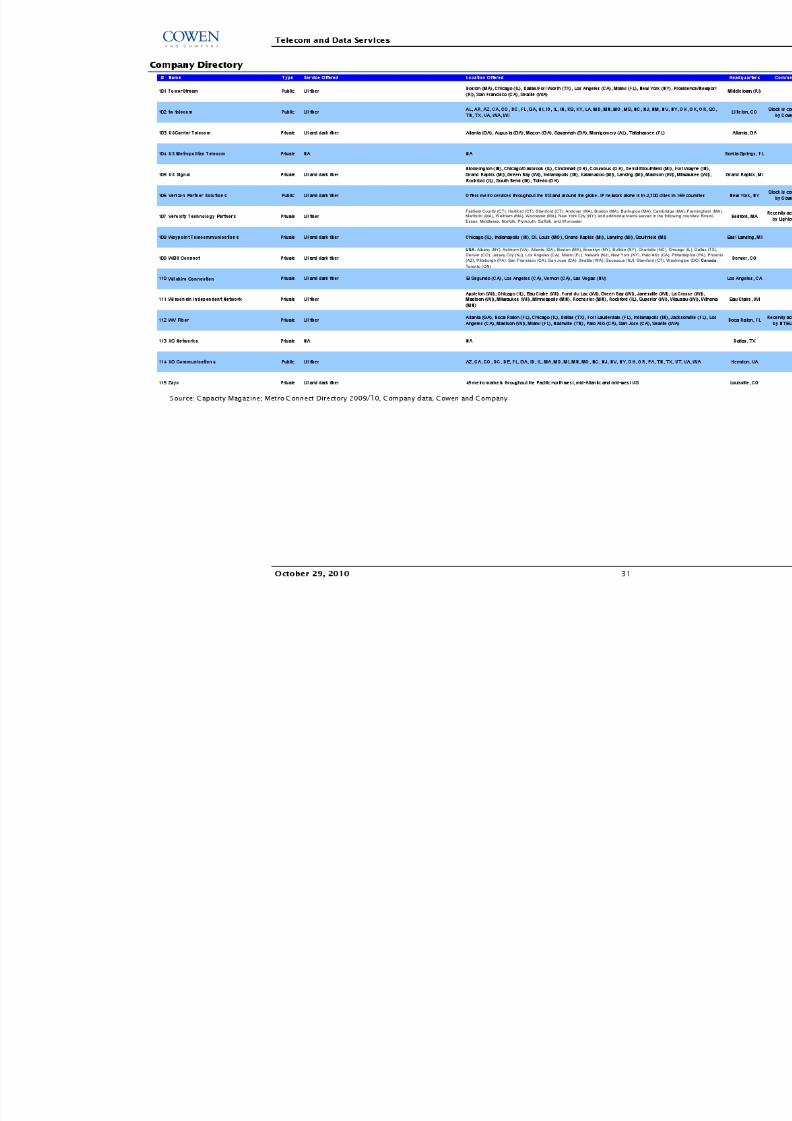
Company Directory….……………………………………………………………………………………………………………………………….26
Charts
Chart 1: U.S. Wireline Capex……….…………………………………………………………………………………………………………...5
Chart 2: CLEC Industry circa 2001…………………………………….………………………………………………………………...6
Chart 3: Notable 2010 Fiber Acquisitions..……………………………………………………..………………………………..7
Chart 4: Global IP Traffic...……………………………………………………………………………………….……………………………...8
Chart 5: Broadband Subscriber Growth..…………………………………………………………………………………………...8
Chart 6: Average Consumer Broadband Speed………………………………………….…………………………………...9
Chart 7: Elasticity of Price vs. Demand..…………………………………………………………….……………………………10
Chart 8: Max Speed and Distance for Various Copper-Based Solutions …………..…..…………11
Chart 9: Typical Capex Allocation………………………………………………………………………..…………………………...12
Chart 10: OSI Model……………………………………………………………………………………………………………………..…………..13

8/2/2019 Cowan TelecomServices10292010
http://slidepdf.com/reader/full/cowan-telecomservices10292010 3/34
Telecom and Data Services
October 29, 2010 3
Chart 11: U.S. Ethernet Market Forecast……………………………………………………………………………………….….15
Chart 12: U.S. IP MPLS VPN Market Forecast………………………………………………………………………………..…16
Chart 13: Customer Examples……………………………………………………………………………….…………………….……...17
Chart 14: Ethernet Exchange Providers………………………………………………………………..………………………...17
Chart 15: Example IRR for Fiber Backhaul..………………………………………………………………………………..….18
Chart 16: Wireless Backhaul Network..…………………………………………….………………………..…………………….19
Chart 17: North American Mobile Backhaul Connections Forecast………….………………………..20

8/2/2019 Cowan TelecomServices10292010
http://slidepdf.com/reader/full/cowan-telecomservices10292010 4/34
Telecom and Data Services
October 29, 20104
Forward
While the opportunity to invest in specific companies is obviously important, this
report primarily focuses on investment trends. However, we do mention various
companies in the report that we believe exemplify some of the opportunities that we
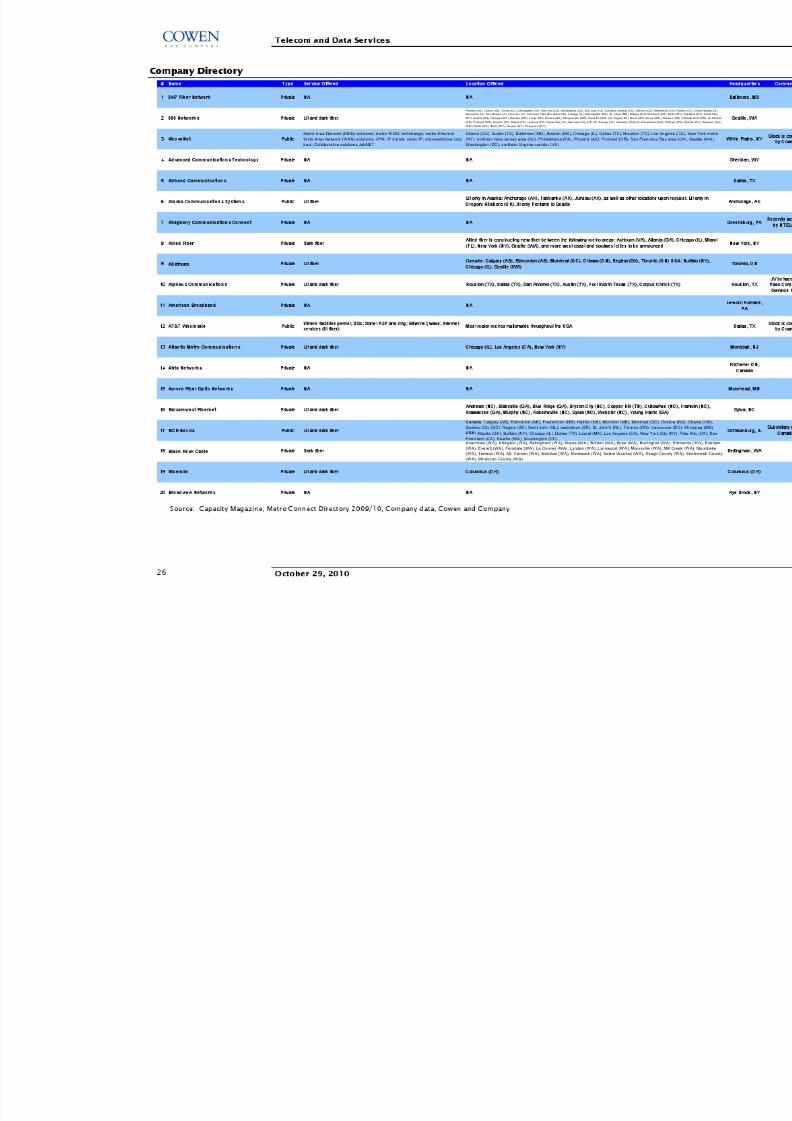
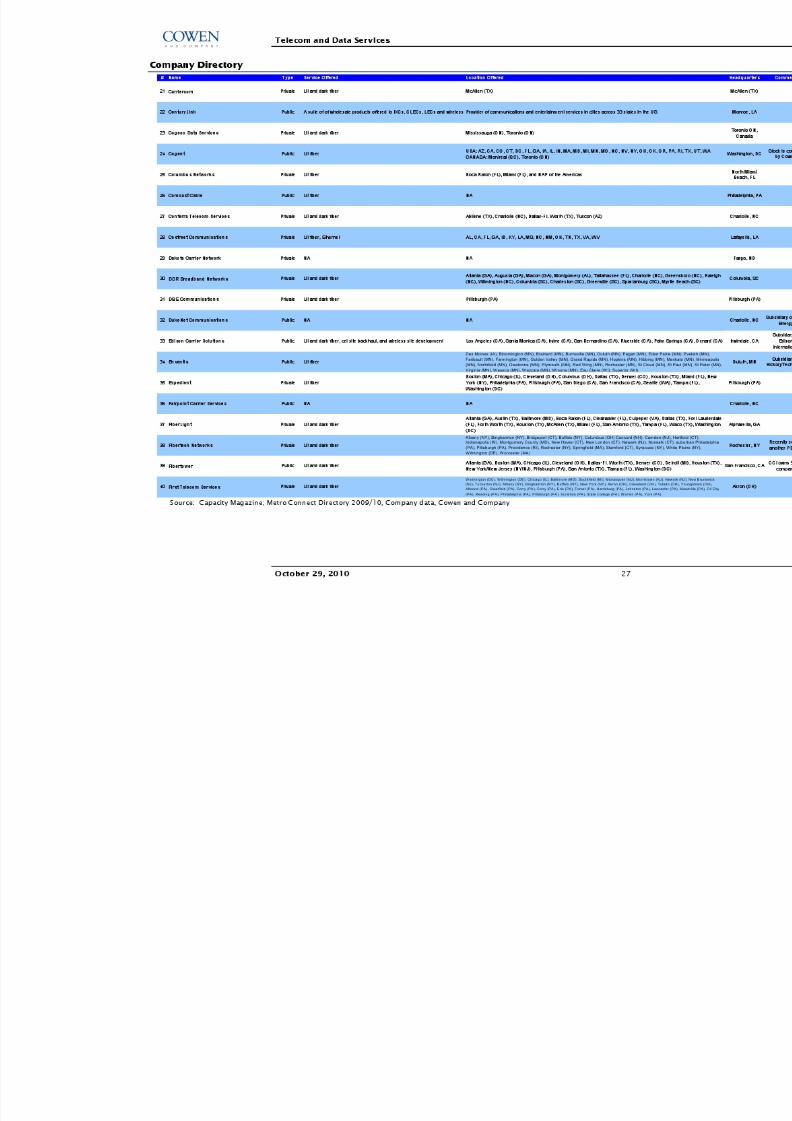
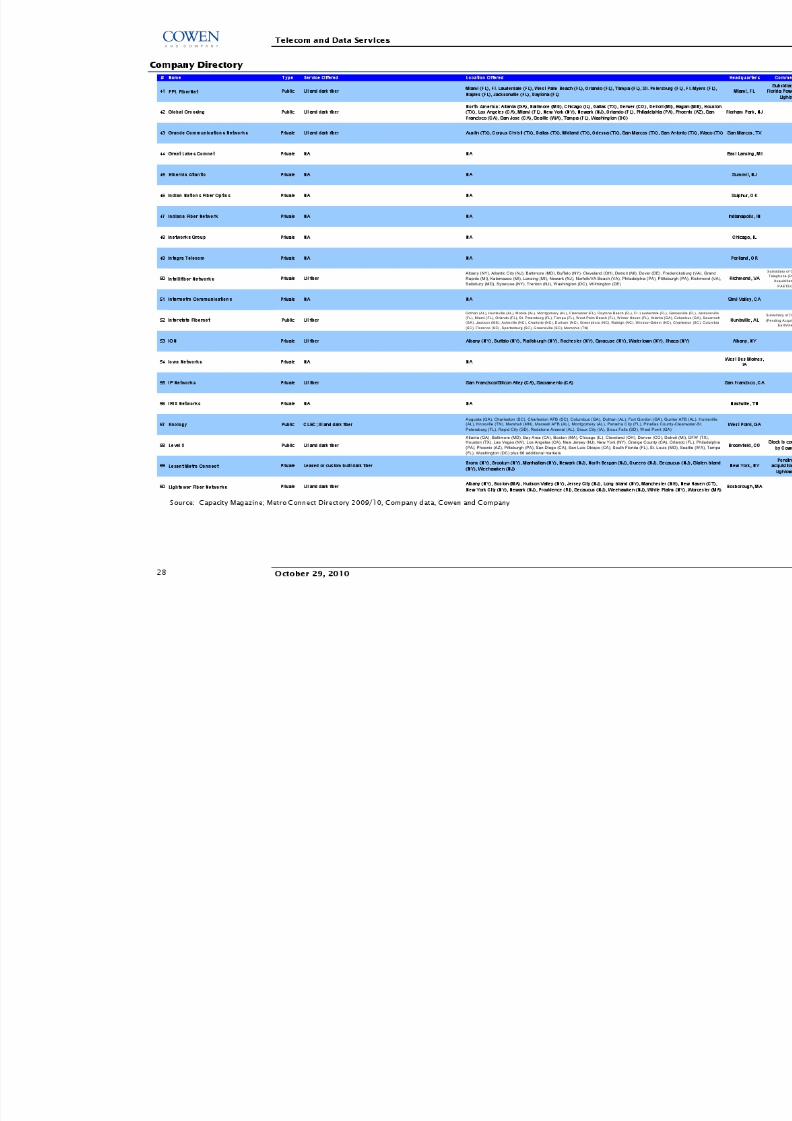
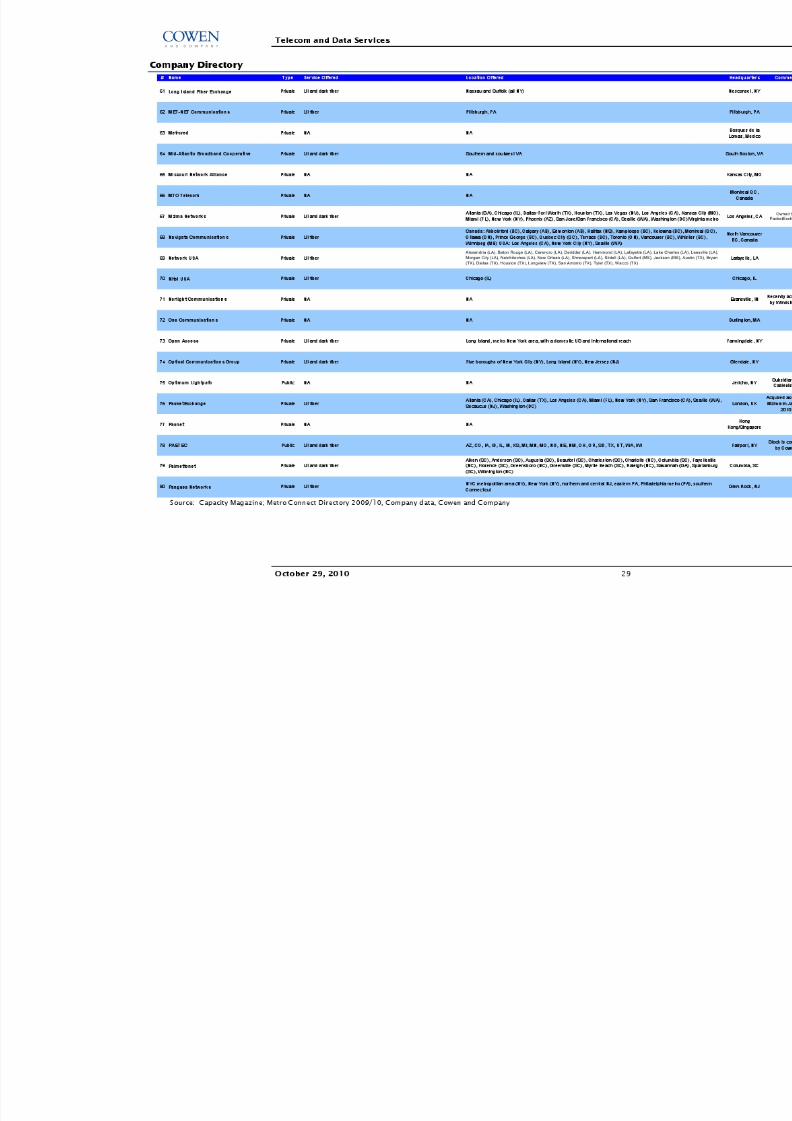
discuss. In addition, at the end of the report (see page 26) we provide a list of public
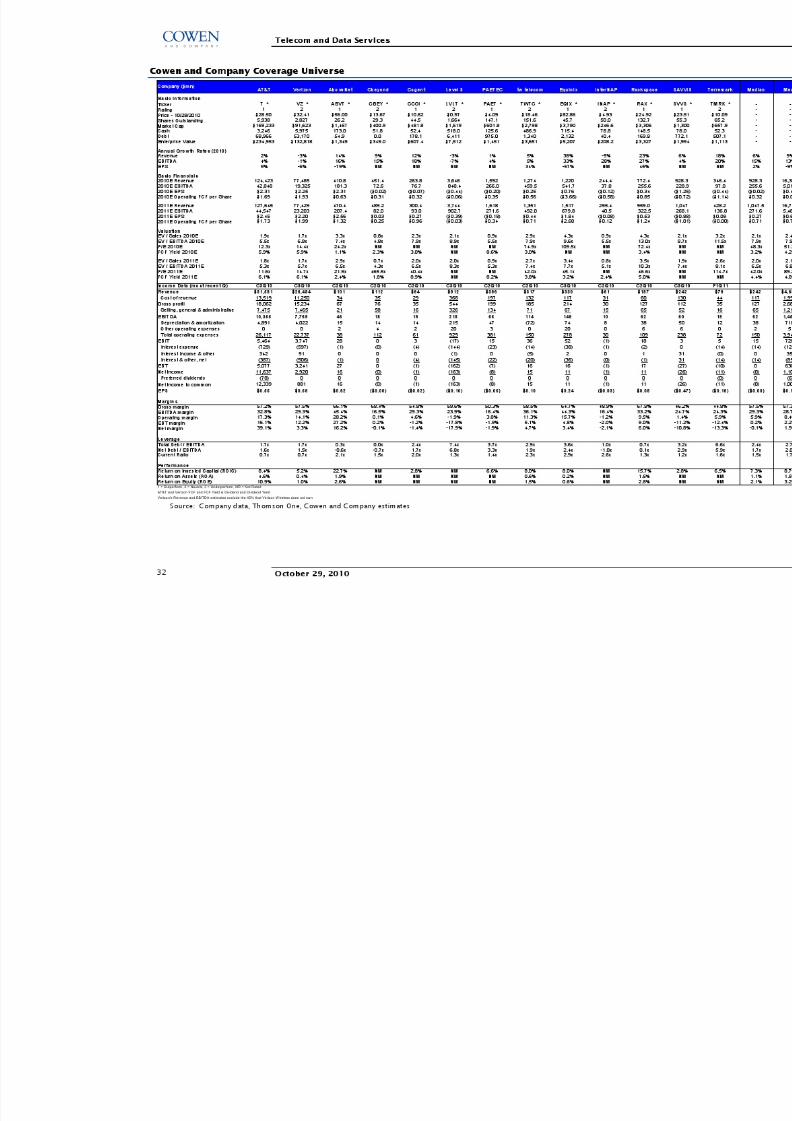
and private companies that provide bandwidth infrastructure solutions. For a morein-depth analysis of the public companies we cover (see page 32), please contact
your sales representative to receive our individual company reports.
8/2/2019 Cowan TelecomServices10292010
http://slidepdf.com/reader/full/cowan-telecomservices10292010 5/34
Telecom and Data Services
October 29, 2010 5
Introduction
We believe increasing utilization of private WANs (wide area networks) and the
public Internet will increase demand for fiber-based networks over the next several
years and that this will create significant investment opportunities. After nearly ten
years of 1) market consolidation, 2) increasing utilization, and 3) improving pricing,
we believe we have reached an inflection point. Specifically, we believe the networkhas become an essential component of everyday life in both personal and business
environments and that this trend will accelerate in coming years. This in turn should
drive double-digit revenue growth and increasing ROIC for the next few years for
pure play bandwidth infrastructure providers focused on providing data-oriented
services to wholesale and enterprise customers.
Although the first fiber optic cables were deployed in the late 1970s to help improve
the delivery of voice traffic, the benefits were focused on reducing cost in the core
where large volumes could be aggregated and transported over long distances more
economically than copper. While this helped open up a new wave of competition
that led to reduced long distance pricing, the value proposition of fiber outside the
core remained limited. It was only in the mid-1990s with the commercial adoption of
the Internet and the passing of the 1996 Telecom Act that it became apparent thatbuilding a last mile fiber network that extended to the end user premise and
replaced the copper network would represent a new sector and have significant
value.
Market Consolidation
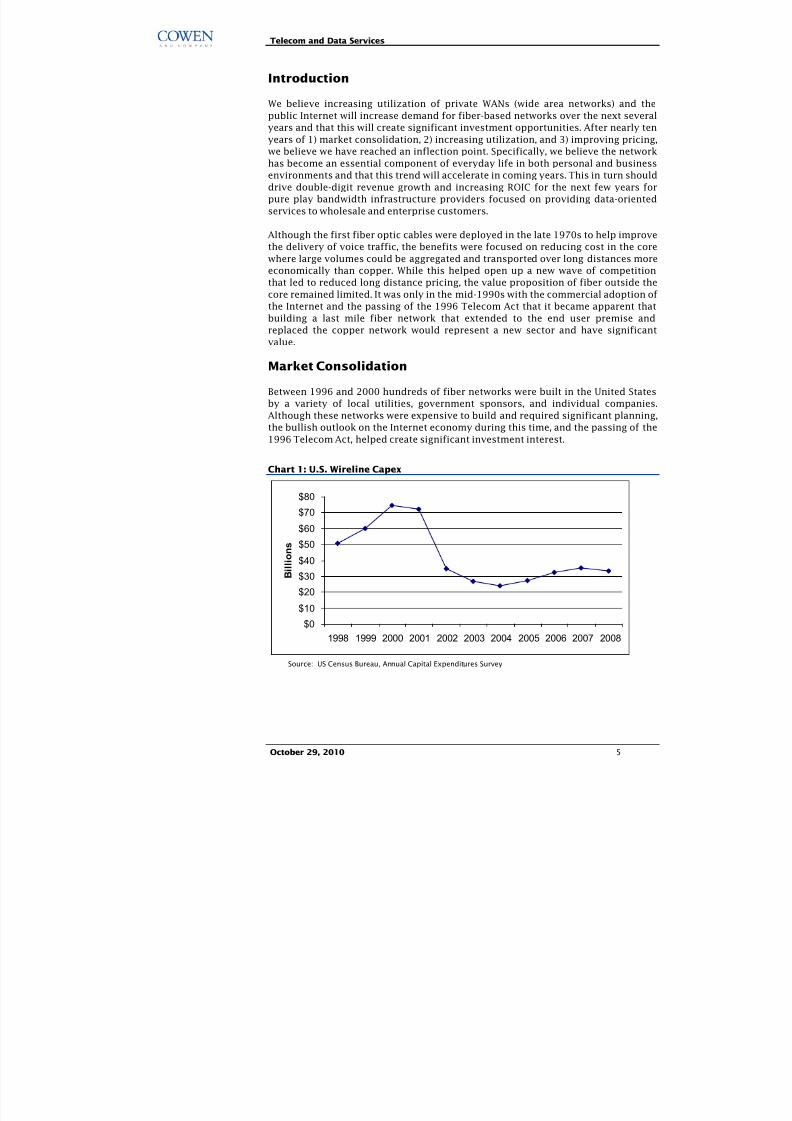
Between 1996 and 2000 hundreds of fiber networks were built in the United States
by a variety of local utilities, government sponsors, and individual companies.
Although these networks were expensive to build and required significant planning,
the bullish outlook on the Internet economy during this time, and the passing of the
1996 Telecom Act, helped create significant investment interest.
Chart 1: U.S. Wireline Capex
$0
$10
$20
$30
$40
$50
$60
$70
$80
1998 1999 2000 2001 2002 2003 2004 2005 2006 2007 2008
B i l l i o n s
Source: US Census Bureau, Annual Capital Expenditures Survey
8/2/2019 Cowan TelecomServices10292010
http://slidepdf.com/reader/full/cowan-telecomservices10292010 6/34
Telecom and Data Services
October 29, 20106
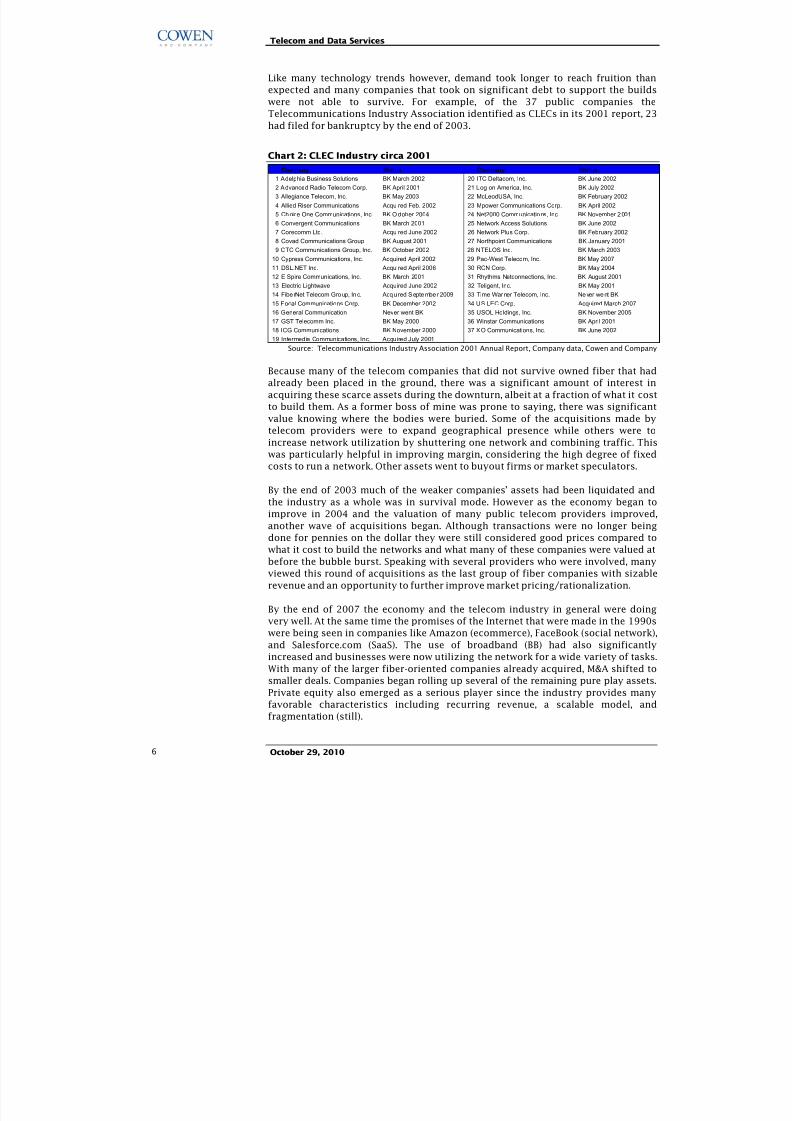
Like many technology trends however, demand took longer to reach fruition than
expected and many companies that took on significant debt to support the builds
were not able to survive. For example, of the 37 public companies the
Telecommunications Industry Association identified as CLECs in its 2001 report, 23
had filed for bankruptcy by the end of 2003.
Chart 2: CLEC Industry circa 2001
Company Status Company Status
1 Adelphia Business Solutions BK March 2002 20 ITC Deltacom, Inc. BK June 2002
2 Advanced Radio Telecom Corp. BK April 2001 21 Log on America, Inc. BK July 2002
3 Allegiance Telecom, Inc. BK May 2003 22 McLeodUSA, Inc. BK February 2002
4 Allied Riser Communications Acquired Feb. 2002 23 Mpower Communications Corp. BK April 2002
5 Choice One Communications, Inc. BK October 2004 24 Net2000 Communications, Inc. BK November 2001
6 Convergent Communications BK March 2001 25 Network Access Solutions BK June 2002
7 Corecomm Ltd. Acquired June 2002 26 Network Plus Corp. BK February 2002
8 Covad Communications Group BK August 2001 27 Northpoint Communications BK January 2001
9 CTC Communications Group, Inc. BK October 2002 28 NTELOS Inc. BK March 2003
10 Cypress Communications, Inc. Acquired April 2002 29 Pac-West Telecom, Inc. BK May 2007
11 DSL.NET Inc. Acquired April 2006 30 RCN Corp. BK May 2004
12 E Spire Communications, Inc. BK March 2001 31 Rhythms Netconnections, Inc. BK August 2001
13 Electric Lightwave Acquired June 2002 32 Teligent, Inc. BK May 2001
14 Fibe rNet Telecom Group, Inc. Acquired September 2009 33 Time Warner Telecom, Inc. Never went BK
15 Focal Communications Corp. BK December 2002 34 US LEC Corp. Acquired March 200716 General Communication Never went BK 35 USOL Holdings, Inc. BK November 2005
17 GST Telecomm Inc. BK May 2000 36 Winstar Communications BK April 2001
18 ICG Communications BK November 2000 37 XO Communications, Inc. BK June 2002
19 Intermedia Communications, Inc. Acquired July 2001 Source: Telecommunications Industry Association 2001 Annual Report, Company data, Cowen and Company
Because many of the telecom companies that did not survive owned fiber that had
already been placed in the ground, there was a significant amount of interest in
acquiring these scarce assets during the downturn, albeit at a fraction of what it cost
to build them. As a former boss of mine was prone to saying, there was significant
value knowing where the bodies were buried. Some of the acquisitions made by
telecom providers were to expand geographical presence while others were to
increase network utilization by shuttering one network and combining traffic. This
was particularly helpful in improving margin, considering the high degree of fixedcosts to run a network. Other assets went to buyout firms or market speculators.
By the end of 2003 much of the weaker companies’ assets had been liquidated and
the industry as a whole was in survival mode. However as the economy began to
improve in 2004 and the valuation of many public telecom providers improved,
another wave of acquisitions began. Although transactions were no longer being
done for pennies on the dollar they were still considered good prices compared to
what it cost to build the networks and what many of these companies were valued at
before the bubble burst. Speaking with several providers who were involved, many
viewed this round of acquisitions as the last group of fiber companies with sizable
revenue and an opportunity to further improve market pricing/rationalization.
By the end of 2007 the economy and the telecom industry in general were doingvery well. At the same time the promises of the Internet that were made in the 1990s
were being seen in companies like Amazon (ecommerce), FaceBook (social network),
and Salesforce.com (SaaS). The use of broadband (BB) had also significantly
increased and businesses were now utilizing the network for a wide variety of tasks.
With many of the larger fiber-oriented companies already acquired, M&A shifted to
smaller deals. Companies began rolling up several of the remaining pure play assets.
Private equity also emerged as a serious player since the industry provides many
favorable characteristics including recurring revenue, a scalable model, and
fragmentation (still).
8/2/2019 Cowan TelecomServices10292010
http://slidepdf.com/reader/full/cowan-telecomservices10292010 7/34
Telecom and Data Services
October 29, 2010 7
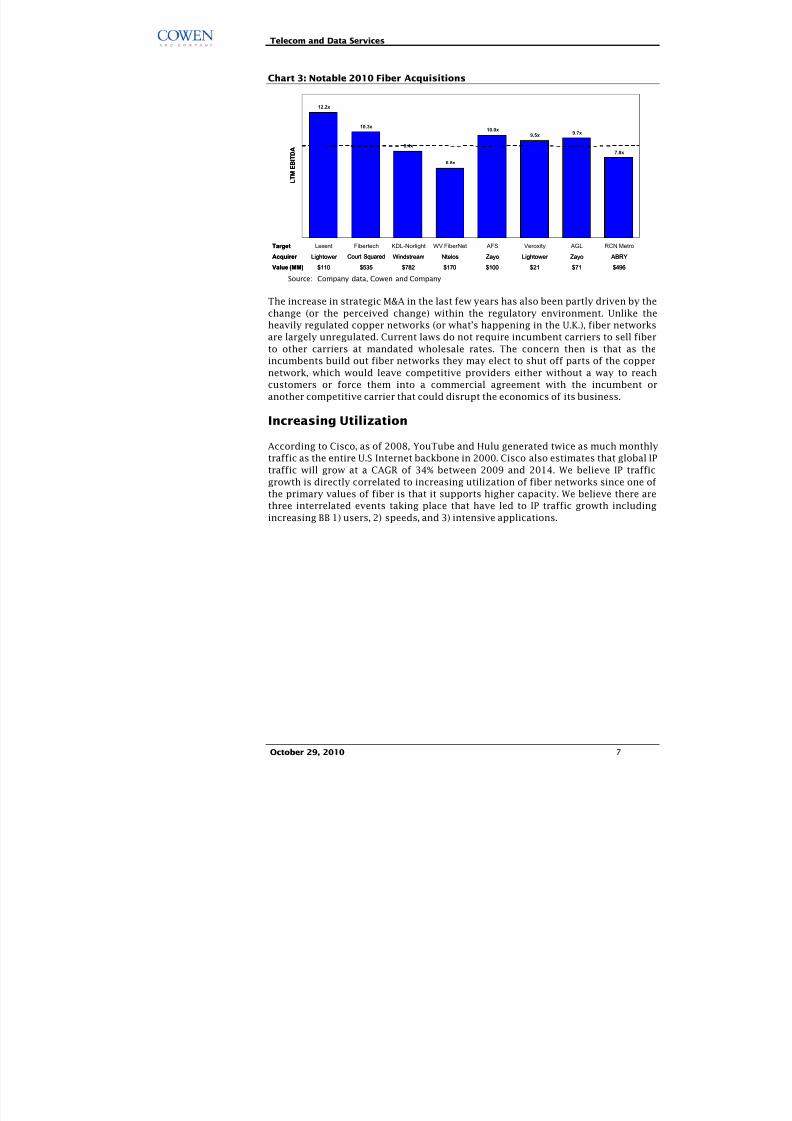
Chart 3: Notable 2010 Fiber Acquisitions
12.2x
10.3x
8.4x
6.8x
10.0x9.5x 9.7x
7.8x
Lexent
Lightower
$110
Fibertech
Court Squared
$535
KDL-Norlight
Windstream
$782
WV FiberNet
Ntelos
$170
AFS
Zayo
$100
Veroxity
Lightower
$21
AGL
Zayo
$71
RCN Metro
ABRY
$496
Target
Acquirer
Value (MM)
L T M E
B I T D A
12.2x
10.3x
8.4x
6.8x
10.0x9.5x 9.7x
7.8x
Lexent
Lightower
$110
Fibertech
Court Squared
$535
KDL-Norlight
Windstream
$782
WV FiberNet
Ntelos
$170
AFS
Zayo
$100
Veroxity
Lightower
$21
AGL
Zayo
$71
RCN Metro
ABRY
$496
Target
Acquirer
Value (MM)
L T M E
B I T D A
Source: Company data, Cowen and Company
The increase in strategic M&A in the last few years has also been partly driven by thechange (or the perceived change) within the regulatory environment. Unlike the
heavily regulated copper networks (or what’s happening in the U.K.), fiber networks
are largely unregulated. Current laws do not require incumbent carriers to sell fiber
to other carriers at mandated wholesale rates. The concern then is that as the
incumbents build out fiber networks they may elect to shut off parts of the copper
network, which would leave competitive providers either without a way to reach
customers or force them into a commercial agreement with the incumbent or
another competitive carrier that could disrupt the economics of its business.
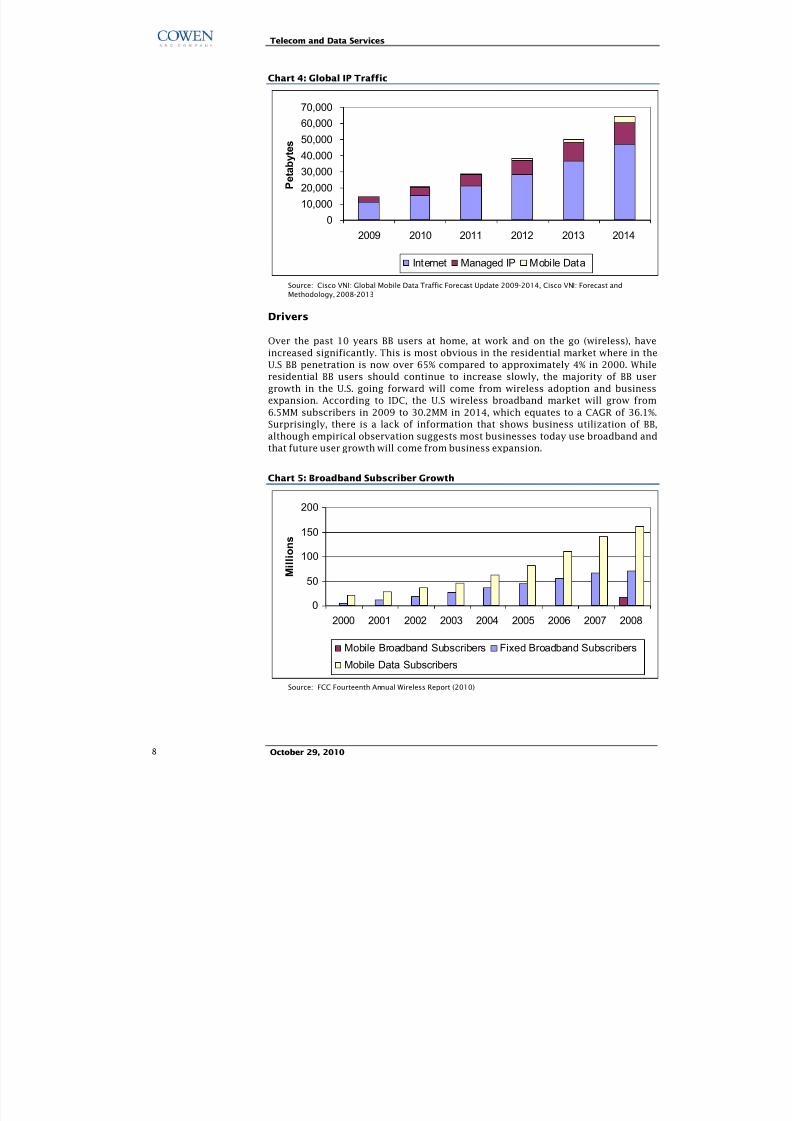
Increasing Utilization
According to Cisco, as of 2008, YouTube and Hulu generated twice as much monthly
traffic as the entire U.S Internet backbone in 2000. Cisco also estimates that global IPtraffic will grow at a CAGR of 34% between 2009 and 2014. We believe IP traffic
growth is directly correlated to increasing utilization of fiber networks since one of
the primary values of fiber is that it supports higher capacity. We believe there are
three interrelated events taking place that have led to IP traffic growth including
increasing BB 1) users, 2) speeds, and 3) intensive applications.
8/2/2019 Cowan TelecomServices10292010
http://slidepdf.com/reader/full/cowan-telecomservices10292010 8/34
Telecom and Data Services
October 29, 20108
Chart 4: Global IP Traffic
0
10,000
20,000
30,000
40,000
50,000
60,000
70,000
2009 2010 2011 2012 2013 2014
P e t a b y t e
s
Internet Managed IP Mobile Data
Source: Cisco VNI: Global Mobile Data Traffic Forecast Update 2009-2014, Cisco VNI: Forecast and
Methodology, 2008-2013
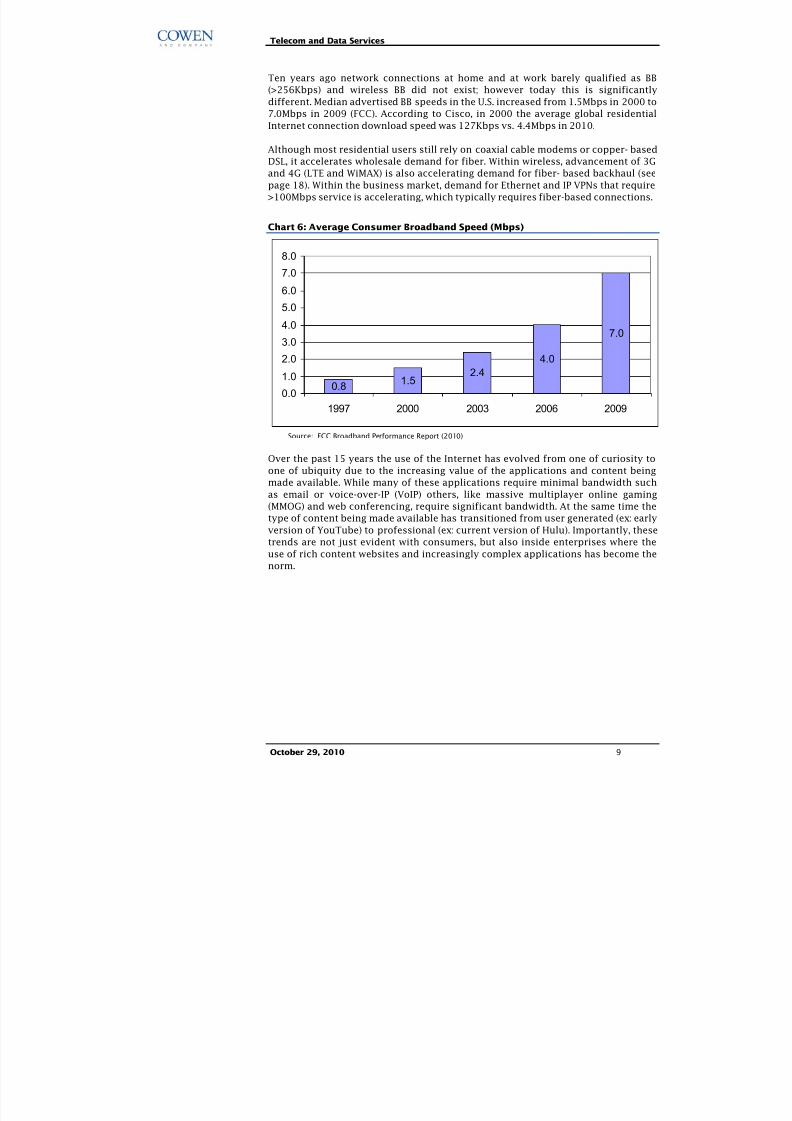
Drivers
Over the past 10 years BB users at home, at work and on the go (wireless), have
increased significantly. This is most obvious in the residential market where in the
U.S BB penetration is now over 65% compared to approximately 4% in 2000. While
residential BB users should continue to increase slowly, the majority of BB user
growth in the U.S. going forward will come from wireless adoption and business
expansion. According to IDC, the U.S wireless broadband market will grow from
6.5MM subscribers in 2009 to 30.2MM in 2014, which equates to a CAGR of 36.1%.
Surprisingly, there is a lack of information that shows business utilization of BB,
although empirical observation suggests most businesses today use broadband and
that future user growth will come from business expansion.
Chart 5: Broadband Subscriber Growth
0
50
100
150
200
2000 2001 2002 2003 2004 2005 2006 2007 2008
M i l l i o n s
Mobile Broadband Subscribers Fixed Broadband Subscribers
Mobile Data Subscribers
Source: FCC Fourteenth Annual Wireless Report (2010)
8/2/2019 Cowan TelecomServices10292010
http://slidepdf.com/reader/full/cowan-telecomservices10292010 9/34
Telecom and Data Services
October 29, 2010 9
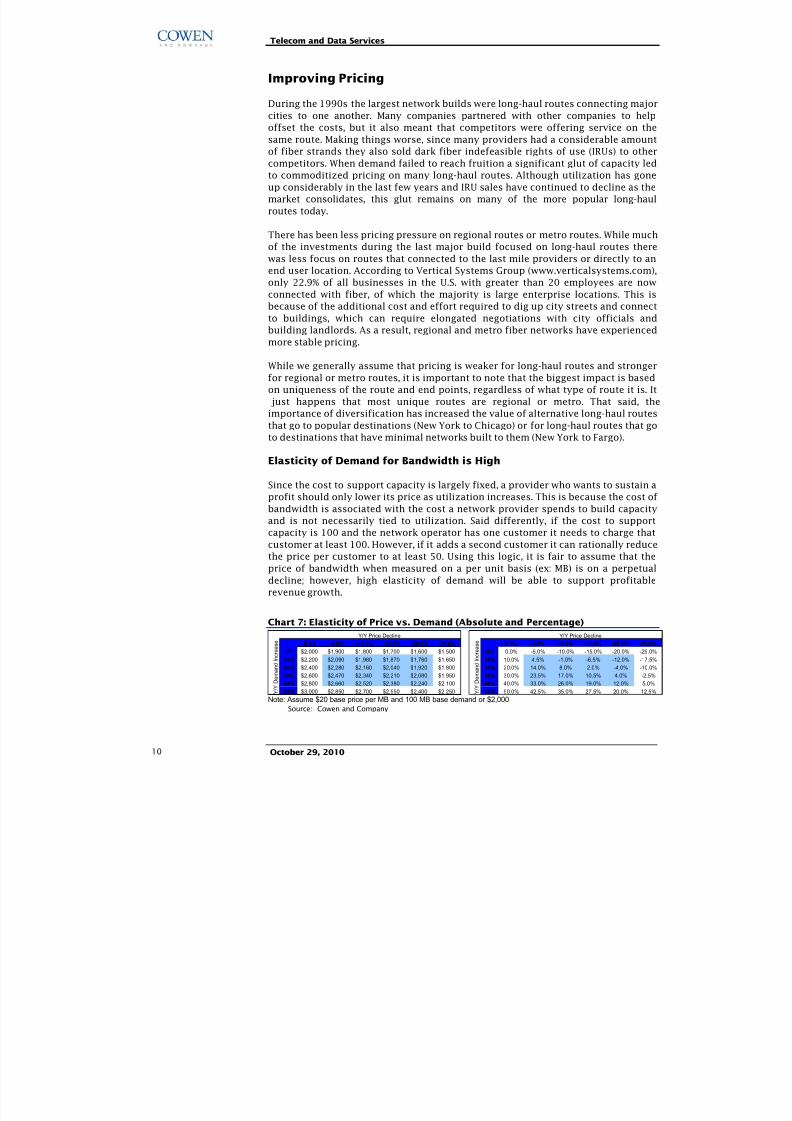
Ten years ago network connections at home and at work barely qualified as BB
(>256Kbps) and wireless BB did not exist; however today this is significantly
different. Median advertised BB speeds in the U.S. increased from 1.5Mbps in 2000 to
7.0Mbps in 2009 (FCC). According to Cisco, in 2000 the average global residential
Internet connection download speed was 127Kbps vs. 4.4Mbps in 2010.
Although most residential users still rely on coaxial cable modems or copper- basedDSL, it accelerates wholesale demand for fiber. Within wireless, advancement of 3G
and 4G (LTE and WiMAX) is also accelerating demand for fiber- based backhaul (see
page 18). Within the business market, demand for Ethernet and IP VPNs that require
>100Mbps service is accelerating, which typically requires fiber-based connections.
Chart 6: Average Consumer Broadband Speed (Mbps)
0.81.5
2.4
4.0
7.0
0.0
1.0
2.0
3.0
4.0
5.0
6.0
7.0
8.0
1997 2000 2003 2006 2009
Source: FCC Broadband Performance Report (2010)
Over the past 15 years the use of the Internet has evolved from one of curiosity to
one of ubiquity due to the increasing value of the applications and content being
made available. While many of these applications require minimal bandwidth such
as email or voice-over-IP (VoIP) others, like massive multiplayer online gaming
(MMOG) and web conferencing, require significant bandwidth. At the same time the
type of content being made available has transitioned from user generated (ex: early
version of YouTube) to professional (ex: current version of Hulu). Importantly, these
trends are not just evident with consumers, but also inside enterprises where the
use of rich content websites and increasingly complex applications has become the
norm.
8/2/2019 Cowan TelecomServices10292010
http://slidepdf.com/reader/full/cowan-telecomservices10292010 10/34
Telecom and Data Services
October 29, 201010
Improving Pricing
During the 1990s the largest network builds were long-haul routes connecting major
cities to one another. Many companies partnered with other companies to help
offset the costs, but it also meant that competitors were offering service on the
same route. Making things worse, since many providers had a considerable amount
of fiber strands they also sold dark fiber indefeasible rights of use (IRUs) to othercompetitors. When demand failed to reach fruition a significant glut of capacity led
to commoditized pricing on many long-haul routes. Although utilization has gone
up considerably in the last few years and IRU sales have continued to decline as the
market consolidates, this glut remains on many of the more popular long-haul
routes today.
There has been less pricing pressure on regional routes or metro routes. While much
of the investments during the last major build focused on long-haul routes there
was less focus on routes that connected to the last mile providers or directly to an
end user location. According to Vertical Systems Group (www.verticalsystems.com),
only 22.9% of all businesses in the U.S. with greater than 20 employees are now
connected with fiber, of which the majority is large enterprise locations. This is
because of the additional cost and effort required to dig up city streets and connectto buildings, which can require elongated negotiations with city officials and
building landlords. As a result, regional and metro fiber networks have experienced
more stable pricing.
While we generally assume that pricing is weaker for long-haul routes and stronger
for regional or metro routes, it is important to note that the biggest impact is based
on uniqueness of the route and end points, regardless of what type of route it is. It
just happens that most unique routes are regional or metro. That said, the
importance of diversification has increased the value of alternative long-haul routes
that go to popular destinations (New York to Chicago) or for long-haul routes that go
to destinations that have minimal networks built to them (New York to Fargo).
Elasticity of Demand for Bandwidth is High
Since the cost to support capacity is largely fixed, a provider who wants to sustain a
profit should only lower its price as utilization increases. This is because the cost of
bandwidth is associated with the cost a network provider spends to build capacity
and is not necessarily tied to utilization. Said differently, if the cost to support
capacity is 100 and the network operator has one customer it needs to charge that
customer at least 100. However, if it adds a second customer it can rationally reduce
the price per customer to at least 50. Using this logic, it is fair to assume that the
price of bandwidth when measured on a per unit basis (ex: MB) is on a perpetual
decline; however, high elasticity of demand will be able to support profitable
revenue growth.
Chart 7: Elasticity of Price vs. Demand (Absolute and Percentage)
0.0% -5.0% -10.0% -15.0% -20.0% -25.0% 0.0% -5.0% -10.0% -15.0% -20.0% -25.0%
0% $2,000 $1,900 $1,800 $1,700 $1,600 $1,500 0% 0.0% -5.0% -10.0% -15.0% -20.0% -25.0%
10% $2,200 $2,090 $1,980 $1,870 $1,760 $1,650 10% 10.0% 4.5% -1.0% -6.5% -12.0% -17.5%
20% $2,400 $2,280 $2,160 $2,040 $1,920 $1,800 20% 20.0% 14.0% 8.0% 2.0% -4.0% -10.0%
30% $2,600 $2,470 $2,340 $2,210 $2,080 $1,950 30% 30.0% 23.5% 17.0% 10.5% 4.0% -2.5%
40% $2,800 $2,660 $2,520 $2,380 $2,240 $2,100 40% 40.0% 33.0% 26.0% 19.0% 12.0% 5.0%
50% $3,000 $2,850 $2,700 $2,550 $2,400 $2,250 50% 50.0% 42.5% 35.0% 27.5% 20.0% 12.5% Y / Y D e m a n d I n c r e a s e
Y/Y Price Decline Y/Y Price Decline
Y / Y D e m a n d I n c r e a s e
Note: Assume $20 base price per MB and 100 MB base demand or $2,000
Source: Cowen and Company
8/2/2019 Cowan TelecomServices10292010
http://slidepdf.com/reader/full/cowan-telecomservices10292010 11/34
Telecom and Data Services
October 29, 2010 11
In the immediate years following the bubble, the price of bandwidth decreased
irrationally (i.e. below cost) as competition first accelerated and then companies
fought to survive. As the market consolidated, pricing declines returned to historical
patterns. Today, although bandwidth pricing continues to decline, lower equipment
costs and growing bandwidth demand are enabling profitable double digit growth
for providers of bandwidth infrastructure solutions. Thus, when we describe pricing
trends as improving, we are in part referring to the total revenue a provider isgenerating from a customer location/route. Importantly, this excludes when a
customer adds additional locations or services, which would be upside.
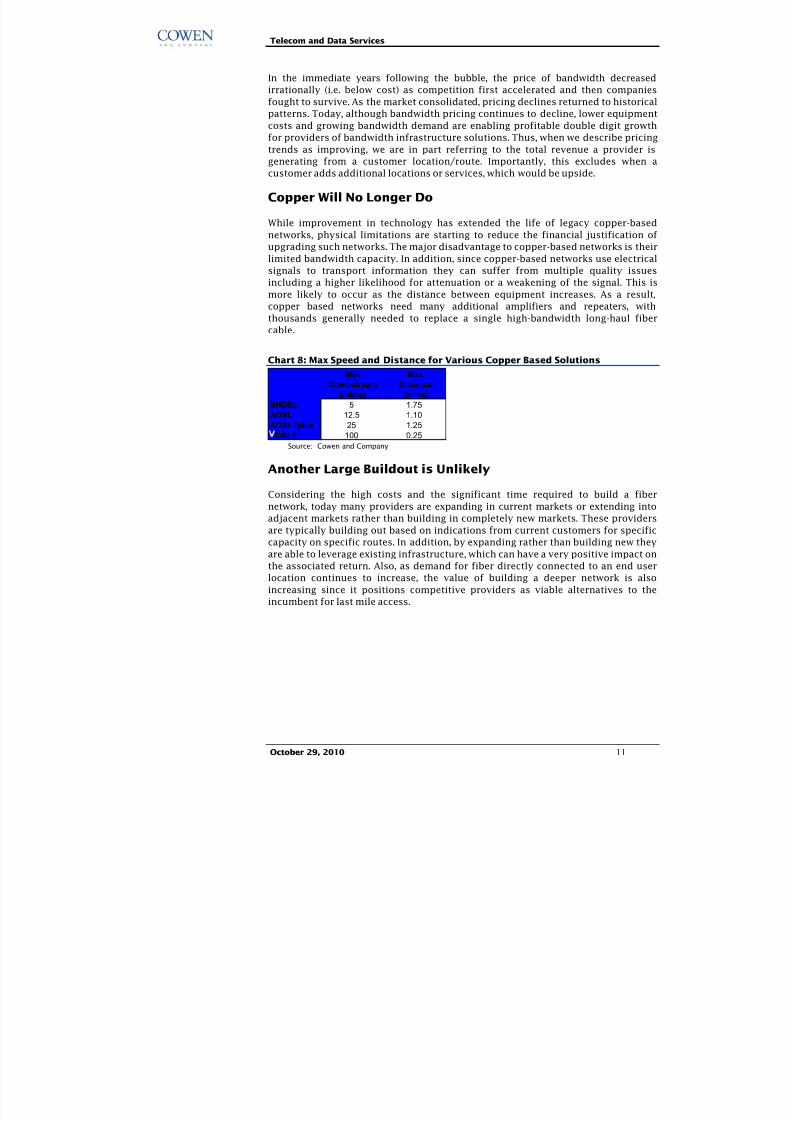
Copper Will No Longer Do
While improvement in technology has extended the life of legacy copper-based
networks, physical limitations are starting to reduce the financial justification of
upgrading such networks. The major disadvantage to copper-based networks is their
limited bandwidth capacity. In addition, since copper-based networks use electrical
signals to transport information they can suffer from multiple quality issues
including a higher likelihood for attenuation or a weakening of the signal. This is
more likely to occur as the distance between equipment increases. As a result,
copper based networks need many additional amplifiers and repeaters, withthousands generally needed to replace a single high-bandwidth long-haul fiber
cable.
Chart 8: Max Speed and Distance for Various Copper Based Solutions
Max Max
Downstream Distance
(mbps) (miles)
SHDSL 5 1.75ADSL 12.5 1.10ADSL2plus 25 1.25
DSL2 100 0.25 Source: Cowen and Company
Another Large Buildout is Unlikely
Considering the high costs and the significant time required to build a fiber
network, today many providers are expanding in current markets or extending into
adjacent markets rather than building in completely new markets. These providers
are typically building out based on indications from current customers for specific
capacity on specific routes. In addition, by expanding rather than building new they
are able to leverage existing infrastructure, which can have a very positive impact on
the associated return. Also, as demand for fiber directly connected to an end user
location continues to increase, the value of building a deeper network is also
increasing since it positions competitive providers as viable alternatives to the
incumbent for last mile access.
8/2/2019 Cowan TelecomServices10292010
http://slidepdf.com/reader/full/cowan-telecomservices10292010 12/34
Telecom and Data Services
October 29, 201012
When a provider does expand in a completely new market it typically leases out dark
fiber from another provider versus building a new network. By doing so it can
significantly reduce the cost associated with a build as well as time to market. If it is
successful growing the customer base, the provider eventually could increase its
margin by building its own network, although this would occur over an extended
time period. As a result of the 1) high cost, 2) time required, and 3) unknown
demand, to build a new network, we believe the risk of additional companiesentering the fiber industry is small. To our knowledge, Allied Fiber and Spread
Networks are the only new companies that are building entirely new (long-haul) fiber
networks in the U.S.
Build versus Buy Logic
We estimate that in 2010 the average EBITDA multiple (LTM) paid for a fiber
company was 9.3x. While each deal is unique and it is difficult to quantify exactly
how much it would cost to build a similar network (costs vary widely based on type
of route and location), it is not just the cost to build the physical network that has to
be considered, but also the time it would take to 1) build the network, 2) hire the
employees, and 3) generate similar cash flow. All providers that we spoke with said
they only consider entering a new market if they can do so through acquisition andinstead prefer to focus new builds on current or adjacent markets.
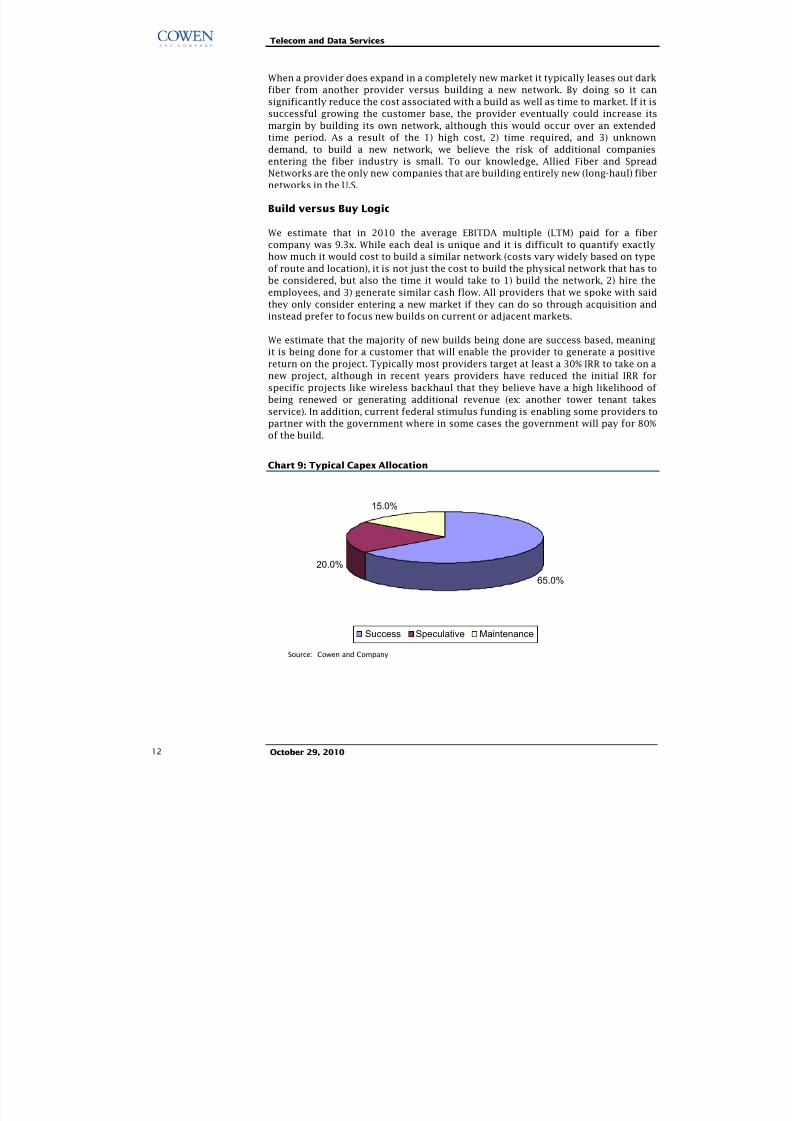
We estimate that the majority of new builds being done are success based, meaning
it is being done for a customer that will enable the provider to generate a positive
return on the project. Typically most providers target at least a 30% IRR to take on a
new project, although in recent years providers have reduced the initial IRR for
specific projects like wireless backhaul that they believe have a high likelihood of
being renewed or generating additional revenue (ex: another tower tenant takes
service). In addition, current federal stimulus funding is enabling some providers to
partner with the government where in some cases the government will pay for 80%
of the build.
Chart 9: Typical Capex Allocation
65.0%
20.0%
15.0%
Success Speculative Maintenance
Source: Cowen and Company
8/2/2019 Cowan TelecomServices10292010
http://slidepdf.com/reader/full/cowan-telecomservices10292010 13/34
Telecom and Data Services
October 29, 2010 13
Potential for High ROIC
While it is important for fiber companies to sign customers to multi-year deals to
offset the large amount of capex that is required to add a customer (ex: building a
fiber lateral to the customer’s location) and generate the proper IRR, the ability for
fiber companies to generate a high ROIC (return on invested capital) is tied to the
ability to maintain and grow that customer. Because the cost to operate a network islargely fixed (i.e. high incremental margin) and because the incremental capex
required to add bandwidth is small (ex: 1GB Ethernet to 10GB Ethernet), when a
customer increases its bandwidth requirements the provider is able to generate a
high ROIC. We estimate that many fiber providers generate north of 20% ROIC.
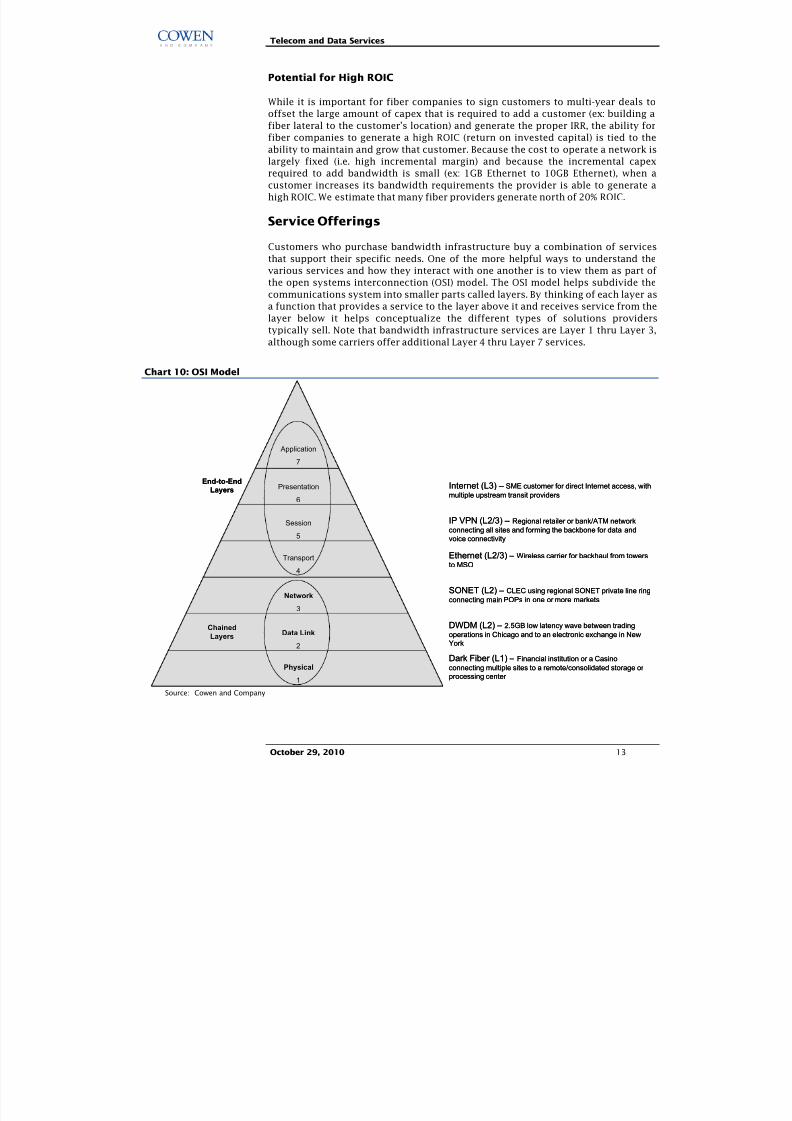
Service Offerings
Customers who purchase bandwidth infrastructure buy a combination of services
that support their specific needs. One of the more helpful ways to understand the
various services and how they interact with one another is to view them as part of
the open systems interconnection (OSI) model. The OSI model helps subdivide the
communications system into smaller parts called layers. By thinking of each layer as
a function that provides a service to the layer above it and receives service from thelayer below it helps conceptualize the different types of solutions providers
typically sell. Note that bandwidth infrastructure services are Layer 1 thru Layer 3,
although some carriers offer additional Layer 4 thru Layer 7 services.
Chart 10: OSI Model
Application
7
Presentation
6
Session
5
Transport
4
Network
3
Data Link
2
Physical
1
ChainedLayers
End-to-EndLayers
Dark Fiber (L1) – Financial institution or a Casinoconnecting multiple sites to a remote/consolidated storage or processing center
DWDM (L2) – 2.5GB low latency wave between tradingoperations in Chicago and to an electronic exchange in NewYork
SONET (L2) – CLEC using regional SONET private line ringconnecting main POPs in one or more markets
Ethernet (L2/3) – Wireless carrier for backhaul from towersto MSO
IP VPN (L2/3) – Regional retailer or bank/ATM networkconnecting all sites and forming the backbone for data andvoice connectivity
Internet (L3) – SME customer for direct Internet access, withmultiple upstream transit providers
Source: Cowen and Company
8/2/2019 Cowan TelecomServices10292010
http://slidepdf.com/reader/full/cowan-telecomservices10292010 14/34
Telecom and Data Services
October 29, 201014
Dark fiber
Dark fiber is optical fiber, dedicated to a single customer, where the customer is
responsible for attaching the necessary equipment and lasers to “light” the fiber.
Although dark fiber can be expensive and fewer providers are now selling it than 10
years ago, there is still demand from customers who prefer to have complete control
over the network. Dark fiber is typically leased under long-term agreements of 10years or more and can be either structured as an operating expense or a capex
expense known as an indefeasible right of use (IRU). Churn is very low. The
throughput of dark fiber is dependent on the equipment the customer attaches.
WDM and DWDM
Wavelength-division-multiplexing (WDM) was created to help mitigate bandwidth
constraint issues by combining multiple optical carrier signals onto one optical fiber
by using different wavelengths or colors of light to carry each signal. Dense
wavelength-division-multiplexing (DWDM) uses tighter channel spacing and can
deliver more throughput over a single fiber. Modern systems can handle up to 160
signals (10 Gbps per signal) for total theoretical capacity of 1.6 Tbps per fiber. This
has reduced much of the need for additional fiber on current routes, although theequipment to light a “wave” or “lambda” or “fractional fiber” can still be expensive.
SONET (similar to Private Line)
Synchronous Optical Network (SONET) was created in the mid-1980’s to help
regional telephone companies exchange various types of data and video traffic more
efficiently and economically than could be done over the public service telephone
network (PSTN). SONET is a legacy solution that some fiber-based providers’
customers use to transport Ethernet. SONET transmits data at speed greater than
155 Mbps and is refereed to as a self healing network because it is typically
deployed using a ring architecture (although not always), which has the capability to
transfer traffic in the opposite direction if a fiber cut occurs.
Ethernet
Ethernet is being adopted as the underlying service transport by enterprises,
consumer triple-play platforms, and more recently, wireless backhaul. Developed by
Xerox in 1973 (IEEE standard 1985), Ethernet is replacing legacy services such as
SONET, Frame Relay and ATM because it provides more flexible bandwidth options
and is highly scalable, which in turn makes it highly cost efficient. Because
transitioning to Ethernet does require new equipment (albeit cheaper than legacy
gear), upgrades typically occur when legacy systems reach the end of life or if the
company or carrier is deploying new systems.
8/2/2019 Cowan TelecomServices10292010
http://slidepdf.com/reader/full/cowan-telecomservices10292010 15/34
Telecom and Data Services
October 29, 2010 15
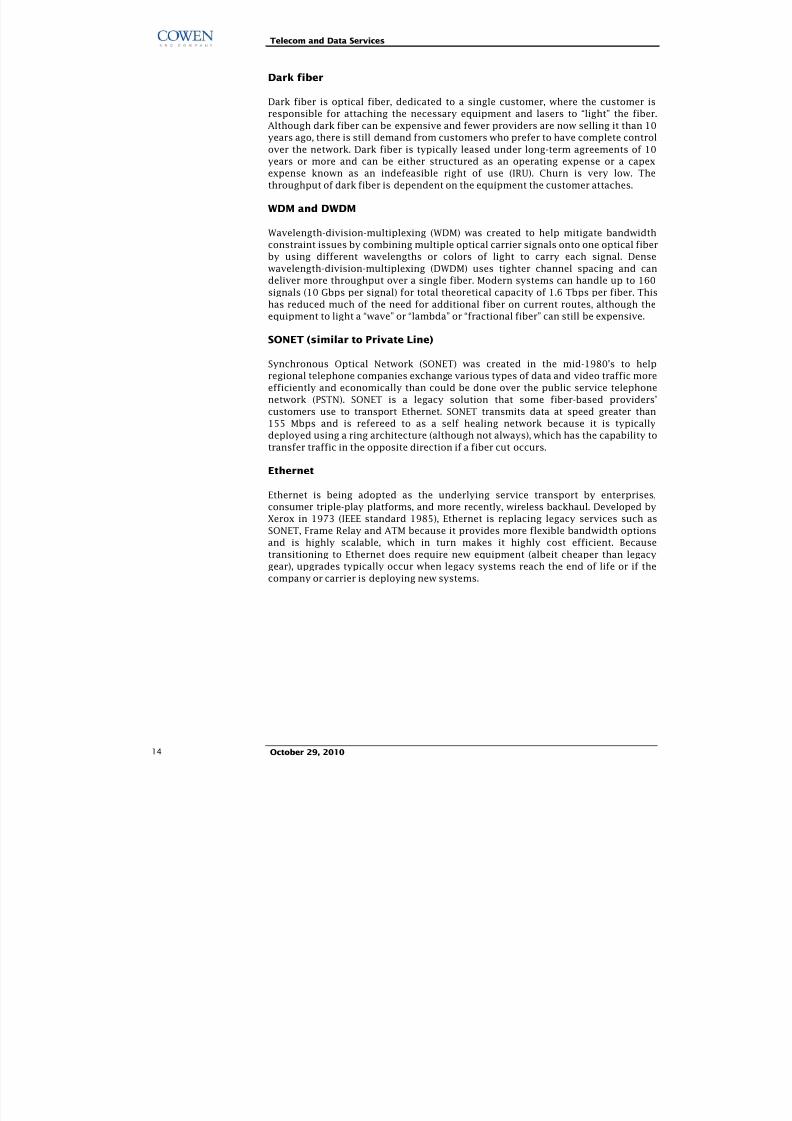
Chart 11: U.S. Ethernet Market Forecast
$0.0
$2.0
$4.0
$6.0
$8.0
$10.0
$12.0
2006 2007 2008 2009 2010 2011 2012 2013 2014
B i l l i o n s
Ethernet
CAGR 2009-2014
16.6%
$0.0
$2.0
$4.0
$6.0
$8.0
$10.0
$12.0
2006 2007 2008 2009 2010 2011 2012 2013 2014
B i l l i o n s
Ethernet
CAGR 2009-2014
16.6%
Source: Infonetics, Cowen and Company
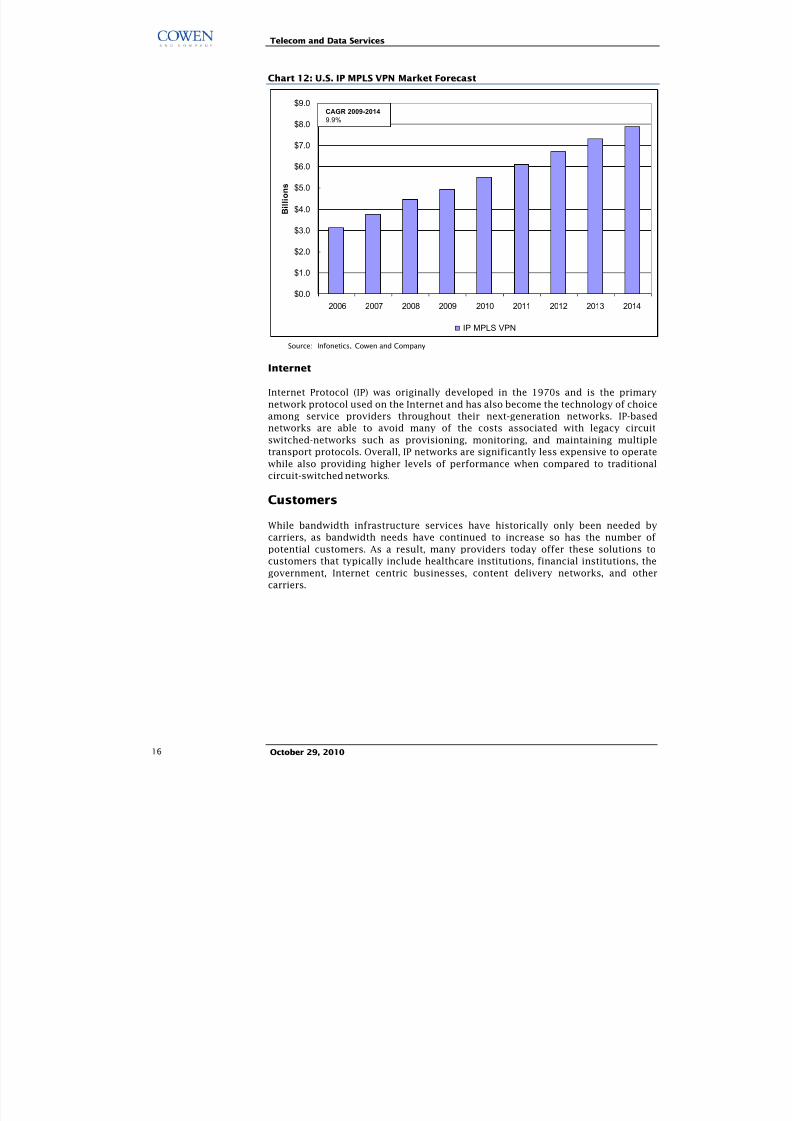
IP VPN
Although Frame Relay made corporate WANs an alternative as early as 1965 its
spoke-and-wheel topology and its proneness to outages made it expensive. However,
the advent of highly cost-effective virtual private networks (VPNs) in the late 1990s
has accelerated the use of private wide area networks (WANs) in the business
environment while the IPSEC protocol has reduced security concerns. In addition,
globalization and the use of remote workers is also increasing demand for IP VPNservices that provide a cost-effective solution for employees working remotely and
across the globe.
8/2/2019 Cowan TelecomServices10292010
http://slidepdf.com/reader/full/cowan-telecomservices10292010 16/34
Telecom and Data Services
October 29, 201016
Chart 12: U.S. IP MPLS VPN Market Forecast
$0.0
$1.0
$2.0
$3.0
$4.0
$5.0
$6.0
$7.0
$8.0
$9.0
2006 2007 2008 2009 2010 2011 2012 2013 2014
B i l l i o n s
IP MPLS VPN
CAGR 2009-20149.9%
$0.0
$1.0
$2.0
$3.0
$4.0
$5.0
$6.0
$7.0
$8.0
$9.0
2006 2007 2008 2009 2010 2011 2012 2013 2014
B i l l i o n s
IP MPLS VPN
CAGR 2009-20149.9%
Source: Infonetics, Cowen and Company
Internet
Internet Protocol (IP) was originally developed in the 1970s and is the primary
network protocol used on the Internet and has also become the technology of choice
among service providers throughout their next-generation networks. IP-based
networks are able to avoid many of the costs associated with legacy circuit
switched-networks such as provisioning, monitoring, and maintaining multiple
transport protocols. Overall, IP networks are significantly less expensive to operatewhile also providing higher levels of performance when compared to traditional
circuit-switched networks.
Customers
While bandwidth infrastructure services have historically only been needed by
carriers, as bandwidth needs have continued to increase so has the number of
potential customers. As a result, many providers today offer these solutions to
customers that typically include healthcare institutions, financial institutions, the
government, Internet centric businesses, content delivery networks, and other
carriers.
8/2/2019 Cowan TelecomServices10292010
http://slidepdf.com/reader/full/cowan-telecomservices10292010 17/34
Telecom and Data Services
October 29, 2010 17
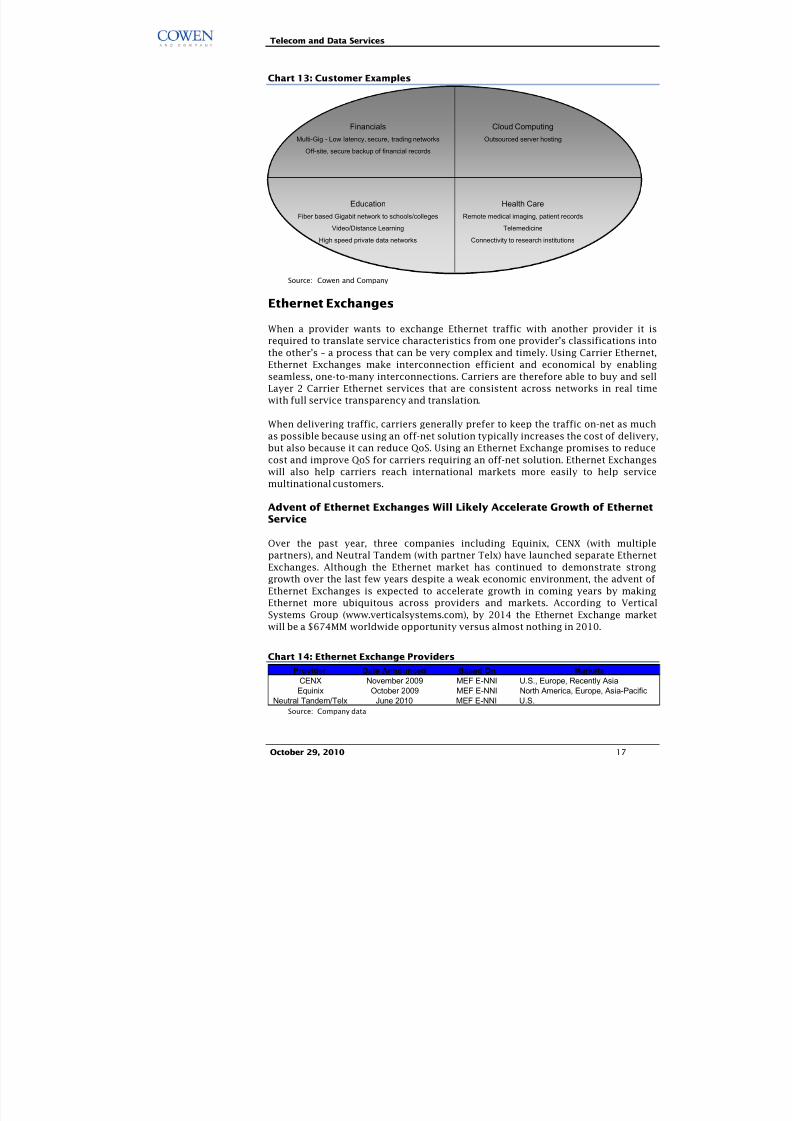
Chart 13: Customer Examples
Financials
Multi-Gig - Low latency, secure, trading networks
Off-site, secure backup of financial records
Education
Fiber based Gigabit network to schools/colleges
Video/Distance Learning
High speed private data networks
Health Care
Remote medical imaging, patient records
Telemedicine
Connectivity to research institutions
Cloud Computing
Outsourced server hosting
Source: Cowen and Company
Ethernet Exchanges
When a provider wants to exchange Ethernet traffic with another provider it is
required to translate service characteristics from one provider’s classifications into
the other’s – a process that can be very complex and timely. Using Carrier Ethernet,
Ethernet Exchanges make interconnection efficient and economical by enabling
seamless, one-to-many interconnections. Carriers are therefore able to buy and sell
Layer 2 Carrier Ethernet services that are consistent across networks in real time
with full service transparency and translation.
When delivering traffic, carriers generally prefer to keep the traffic on-net as much
as possible because using an off-net solution typically increases the cost of delivery,
but also because it can reduce QoS. Using an Ethernet Exchange promises to reduce
cost and improve QoS for carriers requiring an off-net solution. Ethernet Exchanges
will also help carriers reach international markets more easily to help service
multinational customers.
Advent of Ethernet Exchanges Will Likely Accelerate Growth of EthernetService
Over the past year, three companies including Equinix, CENX (with multiple
partners), and Neutral Tandem (with partner Telx) have launched separate Ethernet
Exchanges. Although the Ethernet market has continued to demonstrate strong
growth over the last few years despite a weak economic environment, the advent of
Ethernet Exchanges is expected to accelerate growth in coming years by making
Ethernet more ubiquitous across providers and markets. According to VerticalSystems Group (www.verticalsystems.com), by 2014 the Ethernet Exchange market
will be a $674MM worldwide opportunity versus almost nothing in 2010.
Chart 14: Ethernet Exchange Providers
Provider Date Announced Based On Markets
CENX November 2009 MEF E-NNI U.S., Europe, Recently AsiaEquinix October 2009 MEF E-NNI North America, Europe, Asia-Pacific
Neutral Tandem/Telx June 2010 MEF E-NNI U.S. Source: Company data
8/2/2019 Cowan TelecomServices10292010
http://slidepdf.com/reader/full/cowan-telecomservices10292010 18/34
Telecom and Data Services
October 29, 201018
Largest Beneficiaries of Ethernet Exchanges are Likely to Be Customers– Not Providers
Providing an Ethernet Exchange service is simply an extension of the services that
data center providers – particularly those focused on interconnection like Equinix
and Telx – already provide. Historically, they provide the physical location for
carriers to exchange traffic. By providing a more standardized exchange platformthey are removing the need for each carrier to forge their own separate
arrangements to exchange Ethernet specific traffic with one another.
From our vantage point then an Ethernet Exchange is simply one more type of
service that interconnection providers will offer and will not prove to be a stand-
alone business. As a result, we believe it is likely that CENX at some point is acquired
by one of its data center partners or by one of the other Ethernet Exchange
providers. At some point, we also expect providers to interconnect with one another
to accelerate adoption and because customers will demand it.
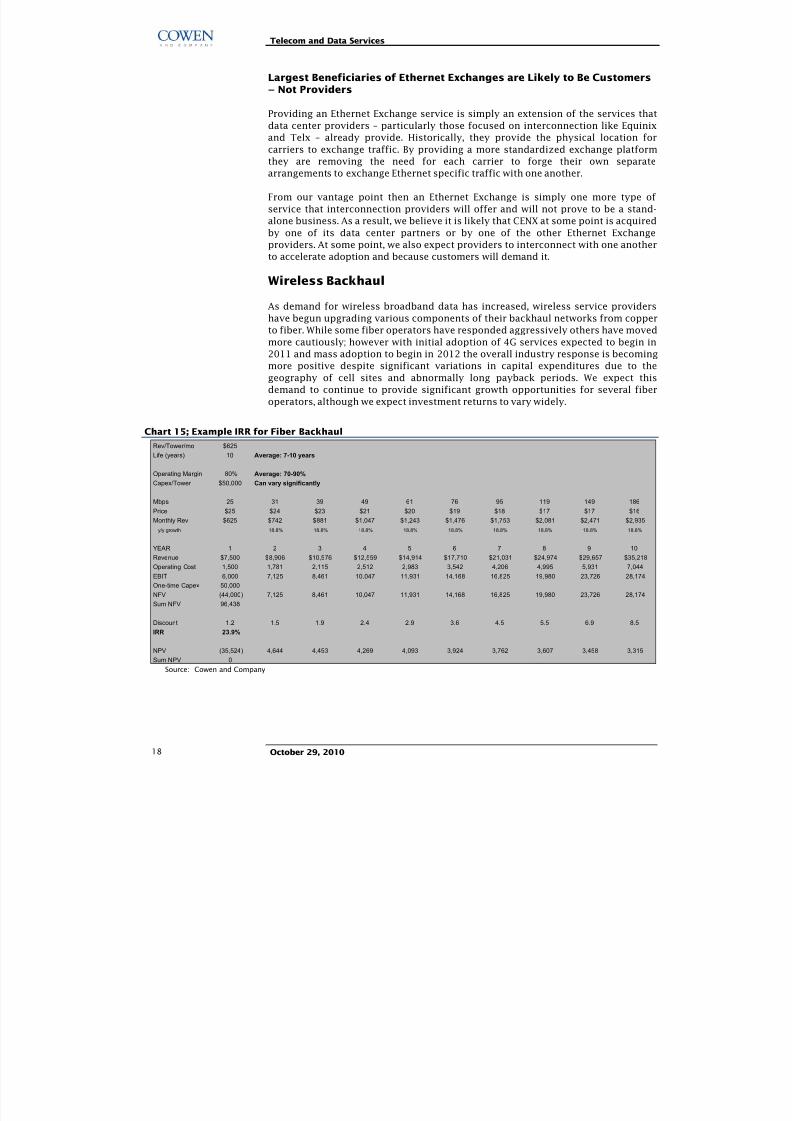
Wireless Backhaul
As demand for wireless broadband data has increased, wireless service providershave begun upgrading various components of their backhaul networks from copper
to fiber. While some fiber operators have responded aggressively others have moved
more cautiously; however with initial adoption of 4G services expected to begin in
2011 and mass adoption to begin in 2012 the overall industry response is becoming
more positive despite significant variations in capital expenditures due to the
geography of cell sites and abnormally long payback periods. We expect this
demand to continue to provide significant growth opportunities for several fiber
operators, although we expect investment returns to vary widely.
Chart 15; Example IRR for Fiber Backhaul
Rev/Tower/mo $625
Life (years) 10 Average: 7-10 years
Operating Margin 80% Average: 70-90%
Capex/Tower $50,000 Can vary significantly
Mbps 25 31 39 49 61 76 95 119 149 186
Price $25 $24 $23 $21 $20 $19 $18 $17 $17 $16
Monthly Rev $625 $742 $881 $1,047 $1,243 $1,476 $1,753 $2,081 $2,471 $2,935
y/y growth 18.8% 18.8% 18.8% 18.8% 18.8% 18.8% 18.8% 18.8% 18.8%
YEAR 1 2 3 4 5 6 7 8 9 10
Revenue $7,500 $8,906 $10,576 $12,559 $14,914 $17,710 $21,031 $24,974 $29,657 $35,218
Operating Cost 1,500 1,781 2,115 2,512 2,983 3,542 4,206 4,995 5,931 7,044
EBIT 6,000 7,125 8,461 10,047 11,931 14,168 16,825 19,980 23,726 28,174
One-time Capex 50,000
NFV (44,000) 7,125 8,461 10,047 11,931 14,168 16,825 19,980 23,726 28,174
Sum NFV 96,438
Discount 1.2 1.5 1.9 2.4 2.9 3.6 4.5 5.5 6.9 8.5
IRR 23.9%
NPV (35,524) 4,644 4,453 4,269 4,093 3,924 3,762 3,607 3,458 3,315
Sum NPV 0 Source: Cowen and Company
8/2/2019 Cowan TelecomServices10292010
http://slidepdf.com/reader/full/cowan-telecomservices10292010 19/34
Telecom and Data Services
October 29, 2010 19
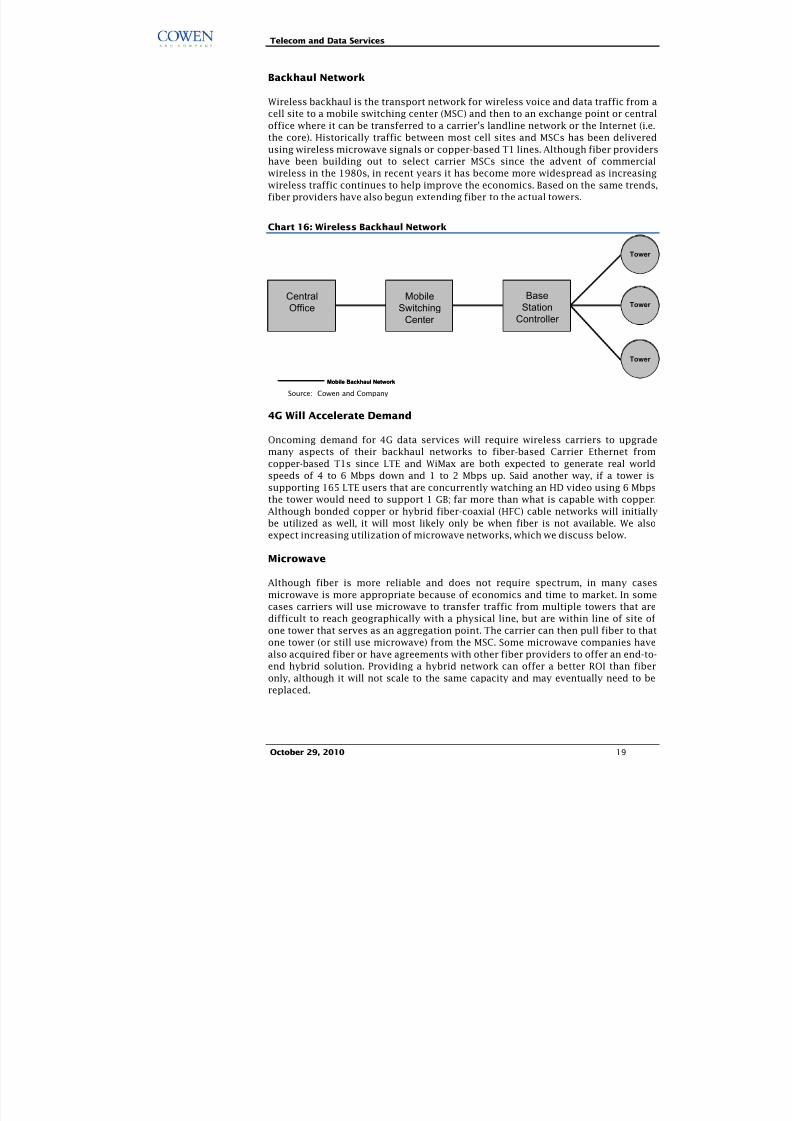
Backhaul Network
Wireless backhaul is the transport network for wireless voice and data traffic from a
cell site to a mobile switching center (MSC) and then to an exchange point or central
office where it can be transferred to a carrier’s landline network or the Internet (i.e.
the core). Historically traffic between most cell sites and MSCs has been delivered
using wireless microwave signals or copper-based T1 lines. Although fiber providershave been building out to select carrier MSCs since the advent of commercial
wireless in the 1980s, in recent years it has become more widespread as increasing
wireless traffic continues to help improve the economics. Based on the same trends,
fiber providers have also begun extending fiber to the actual towers.
Chart 16: Wireless Backhaul Network
CentralOffice
MobileSwitching
Center
BaseStation
Controller
Tower
Tower
Tower
Mobile Backhaul Network
CentralOffice
MobileSwitching
Center
BaseStation
Controller
Tower
Tower
Tower
Mobile Backhaul Network
Source: Cowen and Company
4G Will Accelerate Demand
Oncoming demand for 4G data services will require wireless carriers to upgrade
many aspects of their backhaul networks to fiber-based Carrier Ethernet fromcopper-based T1s since LTE and WiMax are both expected to generate real world
speeds of 4 to 6 Mbps down and 1 to 2 Mbps up. Said another way, if a tower is
supporting 165 LTE users that are concurrently watching an HD video using 6 Mbps
the tower would need to support 1 GB; far more than what is capable with copper.
Although bonded copper or hybrid fiber-coaxial (HFC) cable networks will initially
be utilized as well, it will most likely only be when fiber is not available. We also
expect increasing utilization of microwave networks, which we discuss below.
Microwave
Although fiber is more reliable and does not require spectrum, in many cases
microwave is more appropriate because of economics and time to market. In some
cases carriers will use microwave to transfer traffic from multiple towers that aredifficult to reach geographically with a physical line, but are within line of site of
one tower that serves as an aggregation point. The carrier can then pull fiber to that
one tower (or still use microwave) from the MSC. Some microwave companies have
also acquired fiber or have agreements with other fiber providers to offer an end-to-
end hybrid solution. Providing a hybrid network can offer a better ROI than fiber
only, although it will not scale to the same capacity and may eventually need to be
replaced.
8/2/2019 Cowan TelecomServices10292010
http://slidepdf.com/reader/full/cowan-telecomservices10292010 20/34
Telecom and Data Services
October 29, 201020
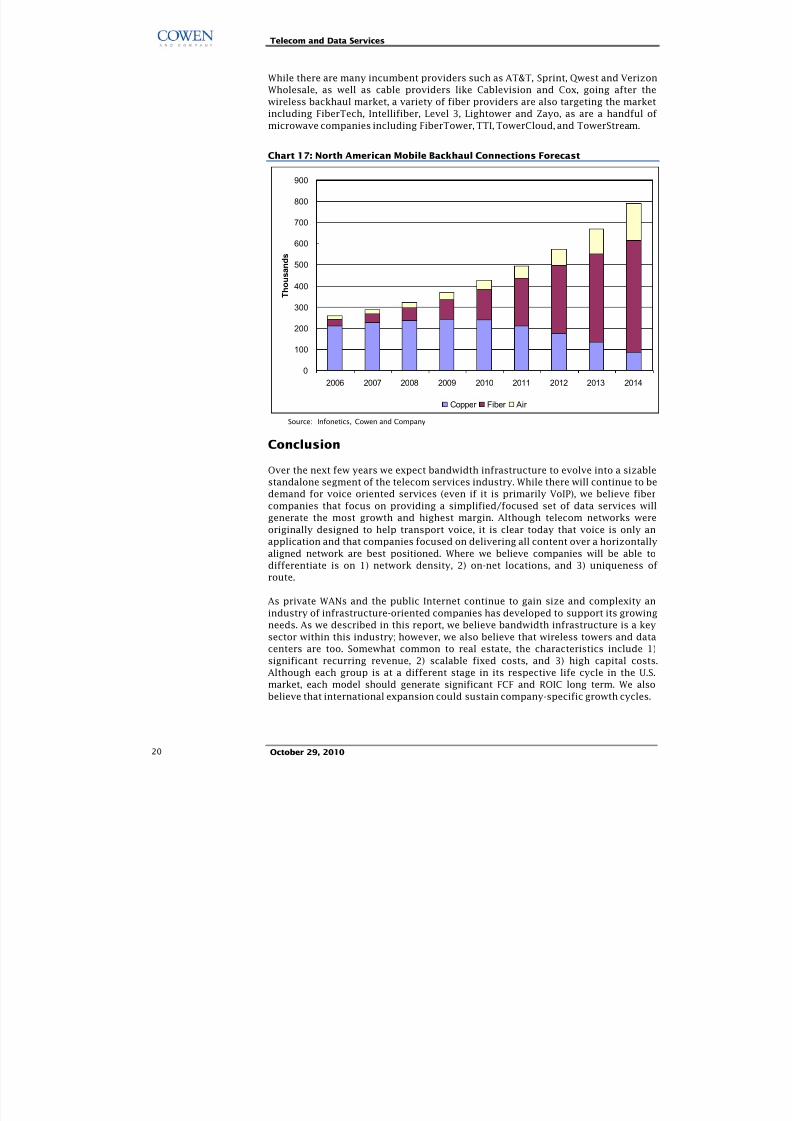
While there are many incumbent providers such as AT&T, Sprint, Qwest and Verizon
Wholesale, as well as cable providers like Cablevision and Cox, going after the
wireless backhaul market, a variety of fiber providers are also targeting the market
including FiberTech, Intellifiber, Level 3, Lightower and Zayo, as are a handful of
microwave companies including FiberTower, TTI, TowerCloud, and TowerStream.
Chart 17: North American Mobile Backhaul Connections Forecast
0
100
200
300
400
500
600
700
800
900
2006 2007 2008 2009 2010 2011 2012 2013 2014
T h o u s a n d s
Copper Fiber Air
Source: Infonetics, Cowen and Company
Conclusion
Over the next few years we expect bandwidth infrastructure to evolve into a sizable
standalone segment of the telecom services industry. While there will continue to be
demand for voice oriented services (even if it is primarily VoIP), we believe fiber
companies that focus on providing a simplified/focused set of data services will
generate the most growth and highest margin. Although telecom networks were
originally designed to help transport voice, it is clear today that voice is only an
application and that companies focused on delivering all content over a horizontally
aligned network are best positioned. Where we believe companies will be able to
differentiate is on 1) network density, 2) on-net locations, and 3) uniqueness of
route.
As private WANs and the public Internet continue to gain size and complexity an
industry of infrastructure-oriented companies has developed to support its growing
needs. As we described in this report, we believe bandwidth infrastructure is a key
sector within this industry; however, we also believe that wireless towers and data
centers are too. Somewhat common to real estate, the characteristics include 1)
significant recurring revenue, 2) scalable fixed costs, and 3) high capital costs.
Although each group is at a different stage in its respective life cycle in the U.S.
market, each model should generate significant FCF and ROIC long term. We also
believe that international expansion could sustain company-specific growth cycles.

8/2/2019 Cowan TelecomServices10292010
http://slidepdf.com/reader/full/cowan-telecomservices10292010 21/34
Telecom and Data Services
October 29, 2010 21
One of the biggest issues with this sector is a lack of public companies that enable
investors to participate in some of these trends. While several existing public
companies are benefiting from the trends outlined in this report it is not clearly
reflected in financial results because they derive revenue from other legacy telecom
segments that dilute growth and/or margin. Based on conversations with various
industry participants we expect some private pure play companies to file for an IPO
in the next 12 months depending on market conditions and that this will increaseinvestment opportunities. That said, for now we believe the best public company
that represents many of the underlying trends outlined in this report is AboveNet
(ABVT, Outperform).
8/2/2019 Cowan TelecomServices10292010
http://slidepdf.com/reader/full/cowan-telecomservices10292010 22/34
Telecom and Data Services
October 29, 201022
Company Example
There are several stories in the telecommunications industry that provide colorful
examples of the market exuberance that initially began to take hold as a result of
deregulation in the 1980s and quickly gathered steam in the 1990s with the Telecom
Act of 1996 and mass market adoption of the Internet, only to end in disarray in the
early 2000s with the crash of the Internet bubble. To help put this in context wehave provided a brief summary of MFS and Level 3. While the story is somewhat
unique considering it involves two separate companies the relationship between the
two is worth noting. In addition, Level 3 is one of the few standalone operators who
remain in business today and has taken part in some of the consolidation post the
Internet bubble.
In 1986 a company called Chicago Fiber Optics (CFO) commissioned Kiewit
Corporation to build a metro fiber network in the business district of Chicago.
However when it was completed CFO could not pay its bill and Kiewit eventually
took ownership of the company. In 1987 Kiewit formed Kiewit Communications
Company and in 1991 renamed it MFS Communications (MFS). After building a
nationwide network, in 1993 MFS did an IPO to help raise additional capital with
Kewitt and its insiders maintaining an approximate 50% stake in the company thatwas valued at approximately $2B. Then in 1996 the company acquired backbone
provider UUNET for $2.0B and later that year was sold to WorldCom for $14.4B or
24x 1995 revenue.
Based largely on the success of MFS and the impact management thought the
Internet would have on the industry, under the direction of Kiewit Chairman Walter
Scott and former MFS CEO Jim Crowe, in mid-1997 Kiewit started up a similar
venture it called Level 3 (a reference to the bottom three layers of the OSI stack that
the company was focused on) with approximately $3B and the help of several former
MFS executives it poached from WorldCom. The following year the company
completed an IPO and by March 2000 the company’s stock was trading at $130 per
share. Its market cap was $44B and its enterprise value was $50B ($7.3B of debt and
$1.3B of cash) and thus was trading at 42x 2000 revenue.
By 2001 Level 3 was trading below $10.00 and it had significantly pulled back its
spending. Capex cost went from $5.6B in 2000 to $2.3B in 2001. Post the crash Level
3 made several financial moves to stave off bankruptcy, although one can argue that
for the company it may have been better for it to go into bankruptcy and start fresh
considering the sizable debt that remains on its balance sheet, which has hindered
growth. The company also acquired some assets at highly discounted prices
including Genuity for $242MM in 2003, which at one point had a market cap of
approximately $5B. The company also sold some of its businesses including its
Software Spectrum segment (acquired in 2002) in 2006.
As the economy started to improve in 2004 it became clear that many of theexpectations Level 3 and other fiber operators had about the Internet would
eventually reach fruition. However, unlike its thinking when the company was first
created it appeared that the higher growth and margin opportunity would be had by
shifting a large part of its focus on enterprise companies over carriers/ISPs and
metro fiber over long-haul. At the same time, to further improve its margins the
company believed it needed to increase its network utilization. As a result, between
December 2005 and October 2006 Level 3 acquired six fiber operators of which the
majority helped expand its presence in the metro and with enterprise customers.

8/2/2019 Cowan TelecomServices10292010
http://slidepdf.com/reader/full/cowan-telecomservices10292010 23/34
Telecom and Data Services
October 29, 2010 23
Today Level 3’s stock trades at $0.97 and it has a $1.6B market cap; however it still
has $5.9B of net debt and it trades at 8.3X EV 2011 revenue. Although the company
today has what we believe are significant fiber infrastructure assets the company
generates a large amount of revenue from voice services and has had a difficult time
integrating the assets it acquired, which in turn has led to execution problems.
Going forward we believe the company is positioned well from an asset perspective
to capture many of the growth opportunities we discussed in this report althoughnegating our excitement is its balance sheet. One of the best opportunities we see
for the company would be to make accretive acquisitions or sell off some of its
assets to pay down debt and simplify the company.
8/2/2019 Cowan TelecomServices10292010
http://slidepdf.com/reader/full/cowan-telecomservices10292010 24/34
Telecom and Data Services
October 29, 201024
DEFINITIONS
Types of Fiber
What is optical fiber? Optical fiber is an extremely thin strand of transparent glass-
like material that carries information in the form of light very long distances at
extremely high speeds. Light travels through fiber by bouncing off the “glass walls”and since no light is absorbed, the wave of light can travel long distances, albeit
such issues like a weakening of the signal might occur due to impurities in the glass.
Fiber-based networks that are being deployed today typically will have several
hundred strands of fiber located within each fiber optic cable. There are primarily
three different types of optical fiber that are being used for fiber networks today;
multi mode, single mode, and non-zero dispersion shifted fiber.
Types of Routes
Long haul routes. Long-haul routes (sometimes refereed to as inter city routes)
connect cities together. Typically terminate at a large POP (point of presence) like 60
Hudson Street in NYC.
Metro routes. Metro routes (sometimes refereed to as intra city routes) are routes
within a specific city that are connected to various office buildings, data centers,
and cell towers.
Regional routes. Regional routes connect cities within a particular region or
smaller distance. They share many of the same characteristics as a metro route.
Undersea routes. Undersea routes are routes under water and are used to connect
various continents and countries. They typically terminate at a large POP.
8/2/2019 Cowan TelecomServices10292010
http://slidepdf.com/reader/full/cowan-telecomservices10292010 25/34
Telecom and Data Services
October 29, 2010 25
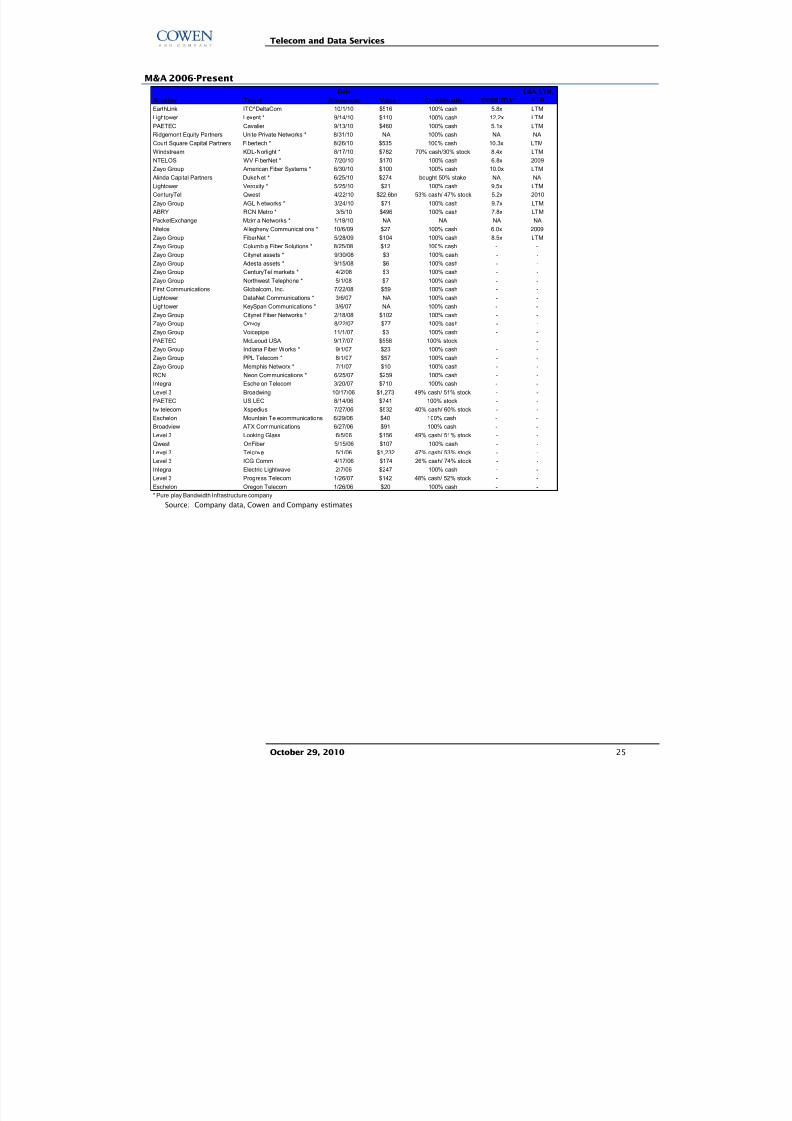
M&A 2006-Present
Date
Acquirer Target Announced Value Consideration EV/EBITDA**
EarthLink ITC^DeltaCom 10/1/10 $516 100% cash 5.8x LTM
Lightower Lexent * 9/14/10 $110 100% cash 12.2x LTM
PAETEC Cavalier 9/13/10 $460 100% cash 5.1x LTM
Ridgemont Equity Partners Unite Private Networks * 8/31/10 NA 100% cash NA NA
Court Square Capital Partners Fibertech * 8/26/10 $535 100% cash 10.3x LTM
Windstream KDL-Norlight * 8/17/10 $782 70% cash/30% stock 8.4x LTMNTELOS WV FiberNet * 7/20/10 $170 100% cash 6.8x 2009
Zayo Group American Fiber Systems * 6/30/10 $100 100% cash 10.0x LTM
Alinda Capital Partners DukeNet * 6/25/10 $274 bought 50% stake NA NA
Lightower Veroxity * 5/25/10 $21 100% cash 9.5x LTM
CenturyTel Qwest 4/22/10 $22.6bn 53% cash/ 47% stock 5.2x 2010
Zayo Group AGL Networks * 3/24/10 $71 100% cash 9.7x LTM
ABRY RCN Metro * 3/5/10 $496 100% cash 7.8x LTM
PacketExchange Mzima Networks * 1/18/10 NA NA NA NA
Ntelos Allegheny Communications * 10/6/09 $27 100% cash 6.0x 2009
Zayo Group FiberNet * 5/28/09 $104 100% cash 8.5x LTM
Zayo Group Columbia Fiber Solutions * 8/25/08 $12 100% cash - -
Zayo Group Citynet assets * 9/30/08 $3 100% cash - -
Zayo Group Adesta assets * 9/15/08 $6 100% cash - -
Zayo Group CenturyTel markets * 4/2/08 $3 100% cash - -
Zayo Group Northwest Telephone * 5/1/08 $7 100% cash - -
First Communications Globalcom, Inc. 7/22/08 $59 100% cash - -
Lightower DataNet Communications * 3/6/07 NA 100% cash - -
Lightower KeySpan Communications * 3/6/07 NA 100% cash - -
Zayo Group Citynet Fiber Networks * 2/18/08 $102 100% cash - -
Zayo Group Onvoy 8/22/07 $77 100% cash - -
Zayo Group Voicepipe 11/1/07 $3 100% cash - -
PAETEC McLeoud USA 9/17/07 $558 100% stock - -
Zayo Group Indiana Fiber Works * 9/1/07 $23 100% cash - -
Zayo Group PPL Telecom * 8/1/07 $57 100% cash - -
Zayo Group Memphis Networx * 7/1/07 $10 100% cash - -
RCN Neon Communications * 6/25/07 $259 100% cash - -
Integra Eschelon Telecom 3/20/07 $710 100% cash - -
Level 3 Broadwing 10/17/06 $1,273 49% cash/ 51% stock - -
PAETEC US LEC 8/14/06 $741 100% stock - -
tw telecom Xspedius 7/27/06 $532 40% cash/ 60% stock - -
Eschelon Mountain Telecommunications 6/29/06 $40 100% cash - -
Broadview ATX Communications 6/27/06 $91 100% cash - -
Level 3 Looking Glass 6/5/06 $156 49% cash/ 51% stock - -
Qwest OnFiber 5/15/06 $107 100% cash - -
Level 3 Telcove 5/1/06 $1,232 47% cash/ 53% stock - -Level 3 ICG Comm 4/17/06 $174 26% cash/ 74% stock - -
Integra Electric Lightwave 2/7/06 $247 100% cash - -
Level 3 Progress Telecom 1/26/07 $142 48% cash/ 52% stock - -
Eschelon Oregon Telecom 1/26/06 $20 100% cash - -
* Pure play Bandwidth Infrastructure company
LQA, LTM,
FTM
Source: Company data, Cowen and Company estimates
8/2/2019 Cowan TelecomServices10292010
http://slidepdf.com/reader/full/cowan-telecomservices10292010 26/34
8/2/2019 Cowan TelecomServices10292010
http://slidepdf.com/reader/full/cowan-telecomservices10292010 27/34
8/2/2019 Cowan TelecomServices10292010
http://slidepdf.com/reader/full/cowan-telecomservices10292010 28/34
8/2/2019 Cowan TelecomServices10292010
http://slidepdf.com/reader/full/cowan-telecomservices10292010 29/34
8/2/2019 Cowan TelecomServices10292010
http://slidepdf.com/reader/full/cowan-telecomservices10292010 30/34
8/2/2019 Cowan TelecomServices10292010
http://slidepdf.com/reader/full/cowan-telecomservices10292010 31/34
8/2/2019 Cowan TelecomServices10292010
http://slidepdf.com/reader/full/cowan-telecomservices10292010 32/34
8/2/2019 Cowan TelecomServices10292010
http://slidepdf.com/reader/full/cowan-telecomservices10292010 33/34
Telecom and Data Services
October 29, 2010 33
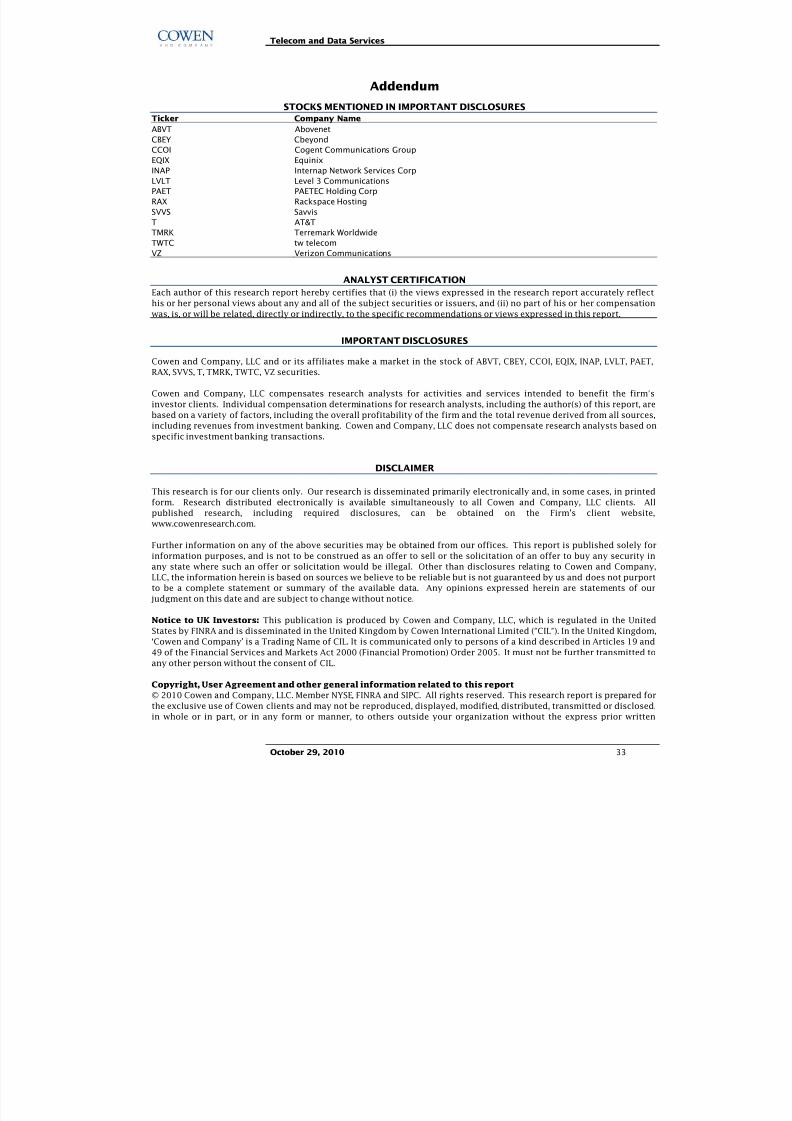
Addendum
STOCKS MENTIONED IN IMPORTANT DISCLOSURES
Ticker Company Name
ABVT Abovenet
CBEY Cbeyond
CCOI Cogent Communications GroupEQIX Equinix
INAP Internap Network Services Corp
LVLT Level 3 Communications
PAET PAETEC Holding Corp
RAX Rackspace Hosting
SVVS Savvis
T AT&T
TMRK Terremark Worldwide
TWTC tw telecom
VZ Verizon Communications
ANALYST CERTIFICATION
Each author of this research report hereby certifies that (i) the views expressed in the research report accurately reflect
his or her personal views about any and all of the subject securities or issuers, and (ii) no part of his or her compensationwas, is, or will be related, directly or indirectly, to the specific recommendations or views expressed in this report.
IMPORTANT DISCLOSURES
Cowen and Company, LLC and or its affiliates make a market in the stock of ABVT, CBEY, CCOI, EQIX, INAP, LVLT, PAET,
RAX, SVVS, T, TMRK, TWTC, VZ securities.
Cowen and Company, LLC compensates research analysts for activities and services intended to benefit the firm's
investor clients. Individual compensation determinations for research analysts, including the author(s) of this report, are
based on a variety of factors, including the overall profitability of the firm and the total revenue derived from all sources,
including revenues from investment banking. Cowen and Company, LLC does not compensate research analysts based on
specific investment banking transactions.
DISCLAIMER
This research is for our clients only. Our research is disseminated primarily electronically and, in some cases, in printed
form. Research distributed electronically is available simultaneously to all Cowen and Company, LLC clients. All
published research, including required disclosures, can be obtained on the Firm’s client website,
www.cowenresearch.com.
Further information on any of the above securities may be obtained from our offices. This report is published solely for
information purposes, and is not to be construed as an offer to sell or the solicitation of an offer to buy any security in
any state where such an offer or solicitation would be illegal. Other than disclosures relating to Cowen and Company,
LLC, the information herein is based on sources we believe to be reliable but is not guaranteed by us and does not purport
to be a complete statement or summary of the available data. Any opinions expressed herein are statements of our
judgment on this date and are subject to change without notice.
Notice to UK Investors: This publication is produced by Cowen and Company, LLC, which is regulated in the United
States by FINRA and is disseminated in the United Kingdom by Cowen International Limited ("CIL"). In the United Kingdom,
‘Cowen and Company’ is a Trading Name of CIL. It is communicated only to persons of a kind described in Articles 19 and
49 of the Financial Services and Markets Act 2000 (Financial Promotion) Order 2005. It must not be further transmitted to
any other person without the consent of CIL.
Copyright, User Agreement and other general information related to this report
© 2010 Cowen and Company, LLC. Member NYSE, FINRA and SIPC. All rights reserved. This research report is prepared for
the exclusive use of Cowen clients and may not be reproduced, displayed, modified, distributed, transmitted or disclosed,
in whole or in part, or in any form or manner, to others outside your organization without the express prior written
8/2/2019 Cowan TelecomServices10292010
http://slidepdf.com/reader/full/cowan-telecomservices10292010 34/34
Telecom and Data Services
consent of Cowen. Cowen research reports are distributed simultaneously to all clients eligible to receive such research
prior to any public dissemination by Cowen of the research report or information or opinion contained therein. Any
unauthorized use or disclosure is prohibited. Receipt and/or review of this research constitutes your agreement not to
reproduce, display, modify, distribute, transmit, or disclose to others outside your organization the contents, opinions,
conclusion, or information contained in this report (including any investment recommendations, estimates or price
targets). All Cowen trademarks displayed in this report are owned by Cowen and may not be used without its prior
written consent.
Cowen and Company, LLC. New York (646) 562-1000 Boston (617) 946-3700 San Francisco (415) 646-7200
Chicago (312) 516-4690 Cleveland (440) 331-3531 Atlanta (866) 544-7009 Dallas (214) 978-0107 London
(affiliate) 44-207-071-7500 Geneva (affiliate) 41-22-707-6900
COWEN AND COMPANY RATING DEFINITIONS (a)
Rating Definition
Outperform (1) Stock expected to outperform the S&P 500
Neutral (2) Stock expected to perform in line with the S&P 500
Underperform (3) Stock expected to underperform the S&P 500(a) Assumptions: Time horizon is 12 months; S&P 500 is flat over forecast period.
COWEN AND COMPANY RATING ALLOCATION (a)
RatingPct of companies under
coverage with this ratingPct for which Investment Banking services
have been provided within the past 12 months
Buy (b) 48.7% 3.8%
Hold (c) 47.7% 1.3%
Sell (d) 3.6% 0.0%(a) As of 09/30/2010. (b) Corresponds to "Outperform" rated stocks as defined in Cowen and Company, LLC's rating definitions (see above). (c)
Corresponds to "Neutral" as defined in Cowen and Company, LLC's ratings definitions (see above). (d) Corresponds to "Underperform" as defined in
Cowen and Company, LLC's ratings definitions (see above). Note: "Buy," "Hold" and "Sell" are not terms that Cowen and Company, LLC uses in its
ratings system and should not be construed as investment options. Rather, these ratings terms are used illustratively to comply with NASD and NYSE
regulations.
To view price charts, please see http://pricecharts.cowen.com/pricechart.asp or call 1-800-221-5616