Embed Size (px)
Citation preview

Handout #6International Parity ConditionsPurchasing Power Parity
Yee-Tien “Ted” Fu
Tuesdays 6:10-9:00 p.m.Commerce 260306
Wednesdays 9:10 a.m.-12 noonCommerce 260508
Course web pages:http://finance2010.pageout.net
ID: California2010 Password: blueskyID: Oregon2010 Password: greenland
4-2
Corporate finance web pages:http://finance2010.pageout.net
ID: Washington2010 Password: blueskyID: Virginia2010 Password: greenland
4-3
Levich
Luenberger
Solnik
Blanchard
Wooldridge
Reading Assignments for This Week
Chaps 3-5
Chap
Chap
Chap 4
Scan Read
Pages
Pages
Pages
Pages
Chap 18 PagesOpenness in Goods and Financial Markets
Multiple Regression Analysis: Inference
4-4
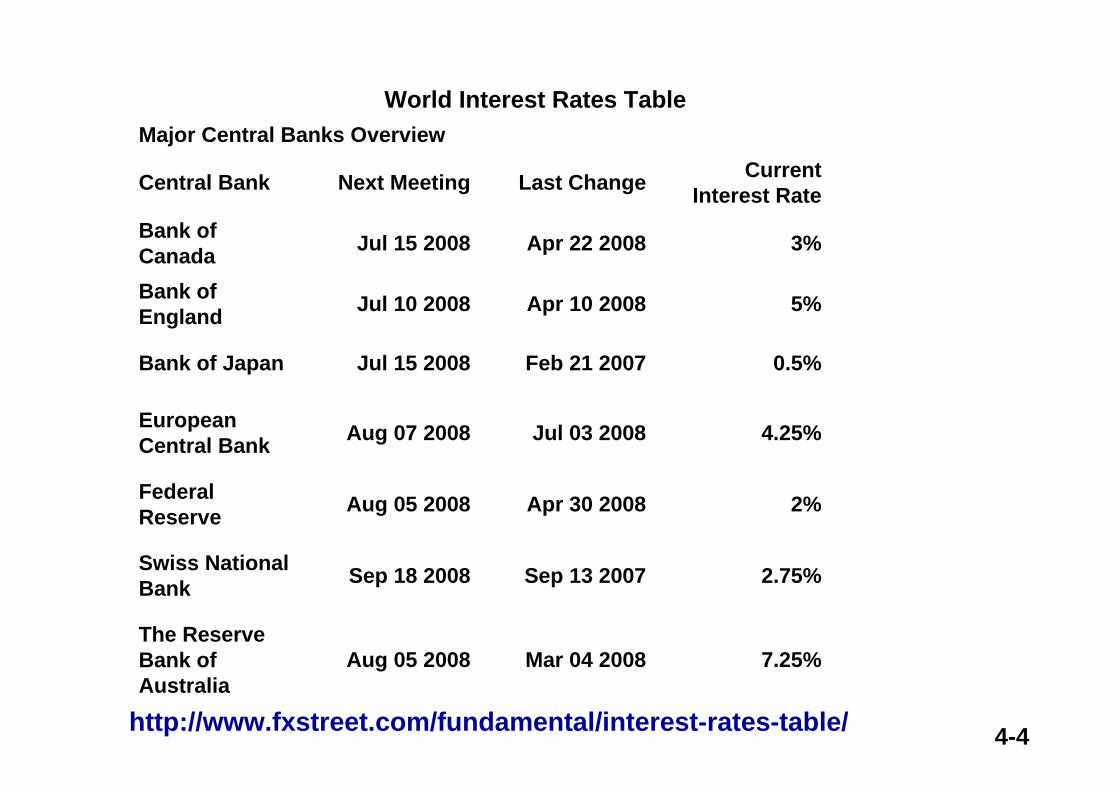
World Interest Rates Table
7.25%Mar 04 2008Aug 05 2008The Reserve Bank of Australia
2.75%Sep 13 2007Sep 18 2008Swiss National Bank
2%Apr 30 2008Aug 05 2008Federal Reserve
4.25%Jul 03 2008Aug 07 2008European Central Bank
0.5%Feb 21 2007Jul 15 2008Bank of Japan
5%Apr 10 2008Jul 10 2008Bank of England
3%Apr 22 2008Jul 15 2008Bank of Canada
Current Interest RateLast ChangeNext MeetingCentral Bank
Major Central Banks Overview
http://www.fxstreet.com/fundamental/interest-rates-table/
4-5
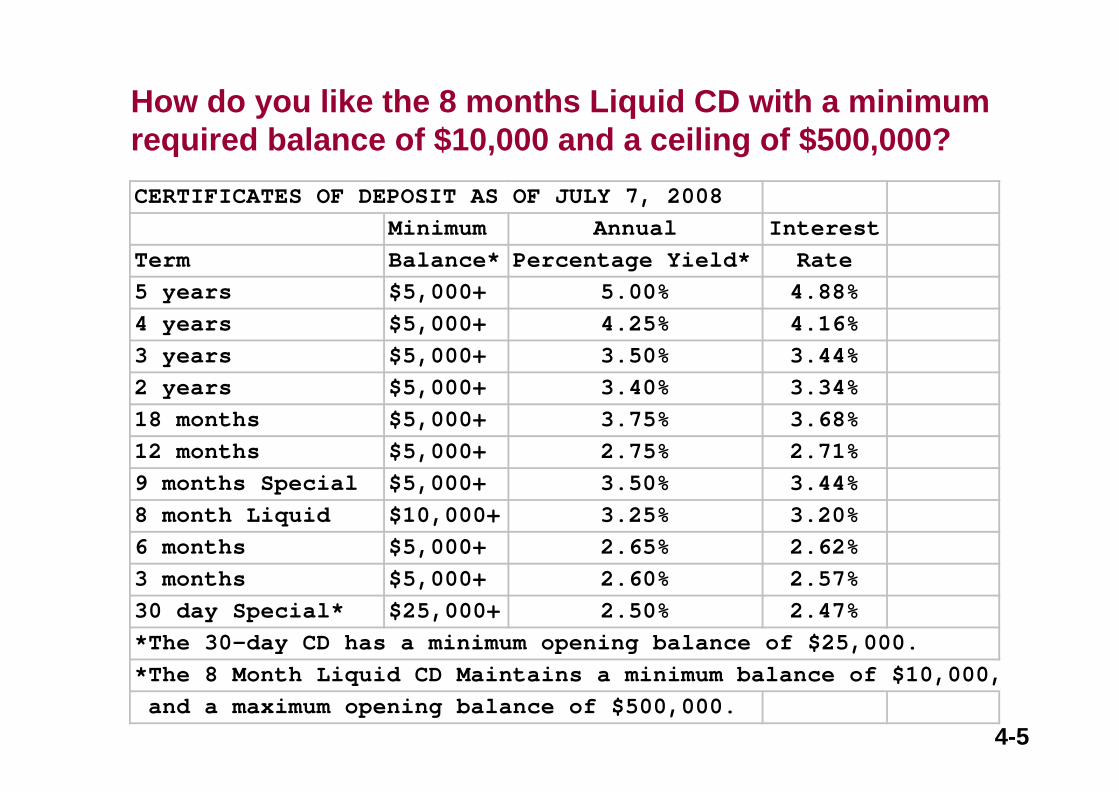
CERTIFICATES OF DEPOSIT AS OF JULY 7, 2008Minimum Annual Interest
Term Balance* Percentage Yield* Rate5 years $5,000+ 5.00% 4.88%4 years $5,000+ 4.25% 4.16%3 years $5,000+ 3.50% 3.44%2 years $5,000+ 3.40% 3.34%18 months $5,000+ 3.75% 3.68%12 months $5,000+ 2.75% 2.71%9 months Special $5,000+ 3.50% 3.44%8 month Liquid $10,000+ 3.25% 3.20%6 months $5,000+ 2.65% 2.62%3 months $5,000+ 2.60% 2.57%30 day Special* $25,000+ 2.50% 2.47%*The 30-day CD has a minimum opening balance of $25,000.*The 8 Month Liquid CD Maintains a minimum balance of $10,000, and a maximum opening balance of $500,000.
How do you like the 8 months Liquid CD with a minimum required balance of $10,000 and a ceiling of $500,000?
4-6
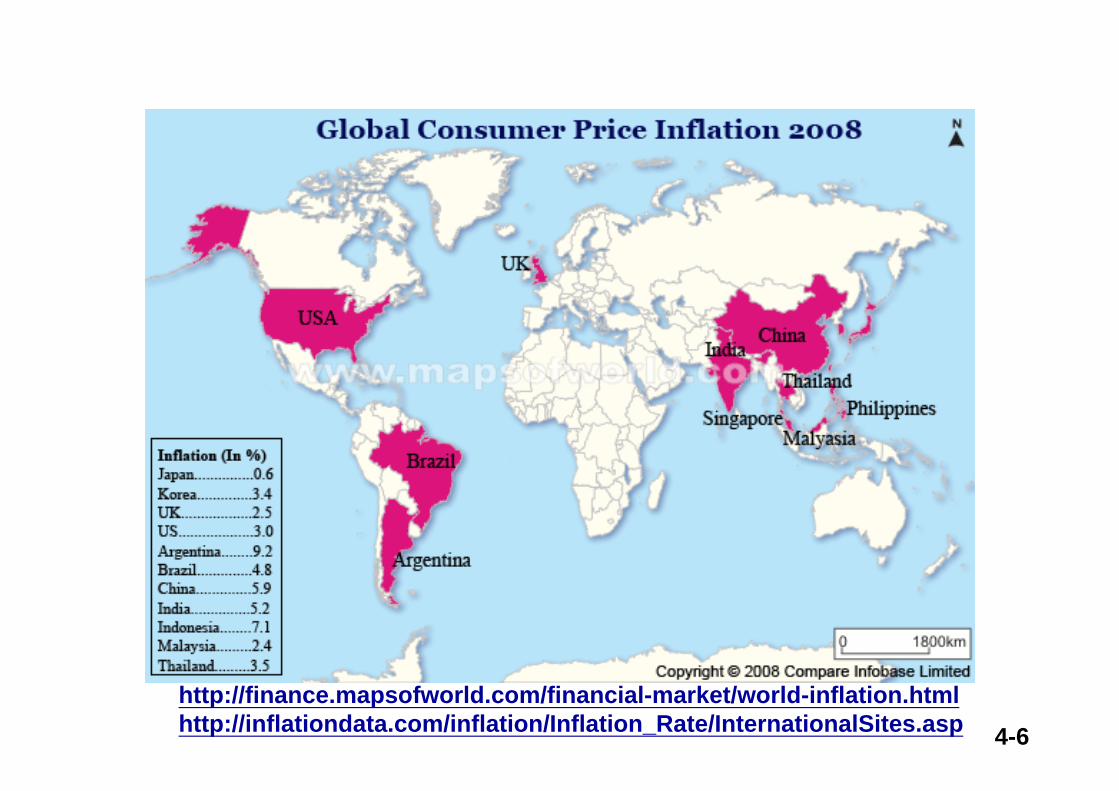
http://finance.mapsofworld.com/financial-market/world-inflation.htmlhttp://inflationdata.com/inflation/Inflation_Rate/InternationalSites.asp
4-7
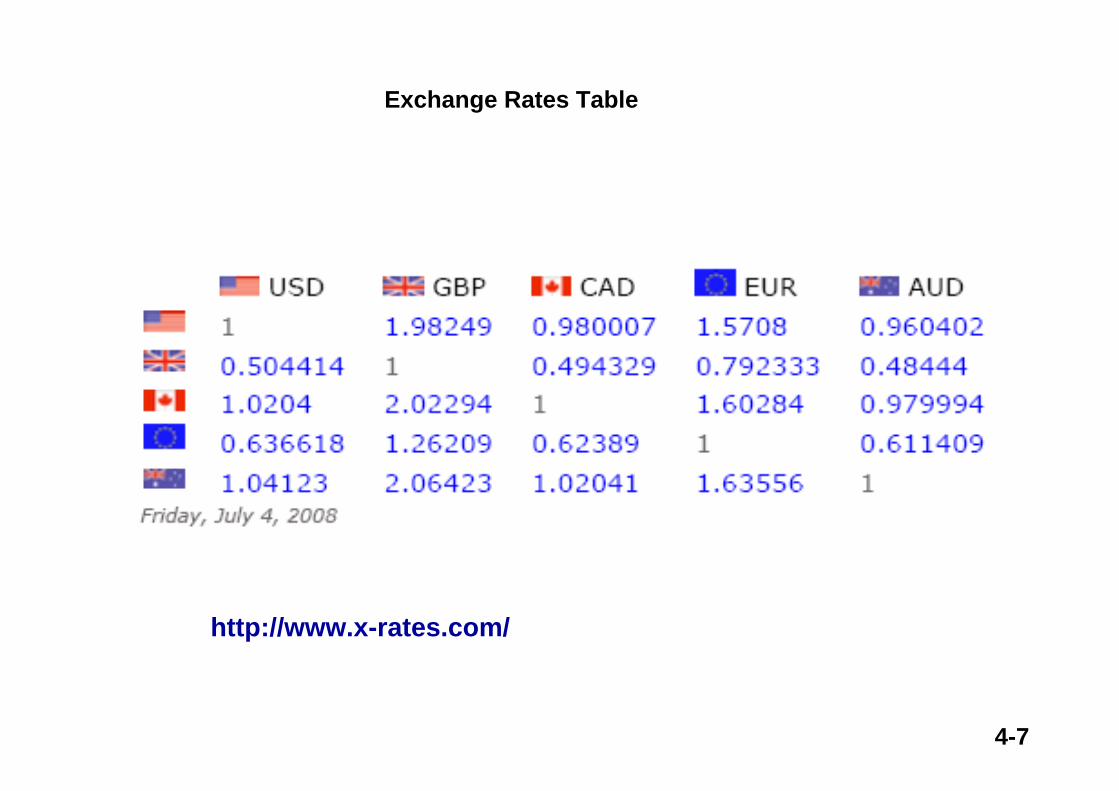
Exchange Rates Table
http://www.x-rates.com/
4-8
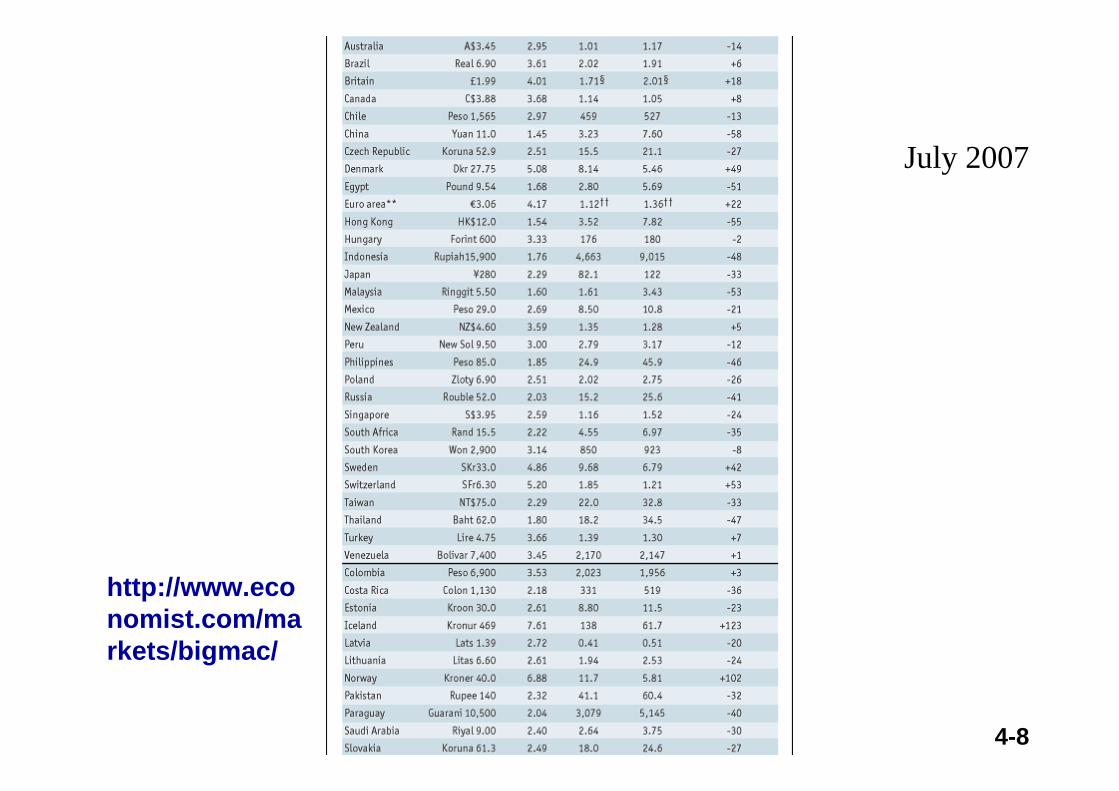
July 2007
http://www.economist.com/markets/bigmac/
4-9
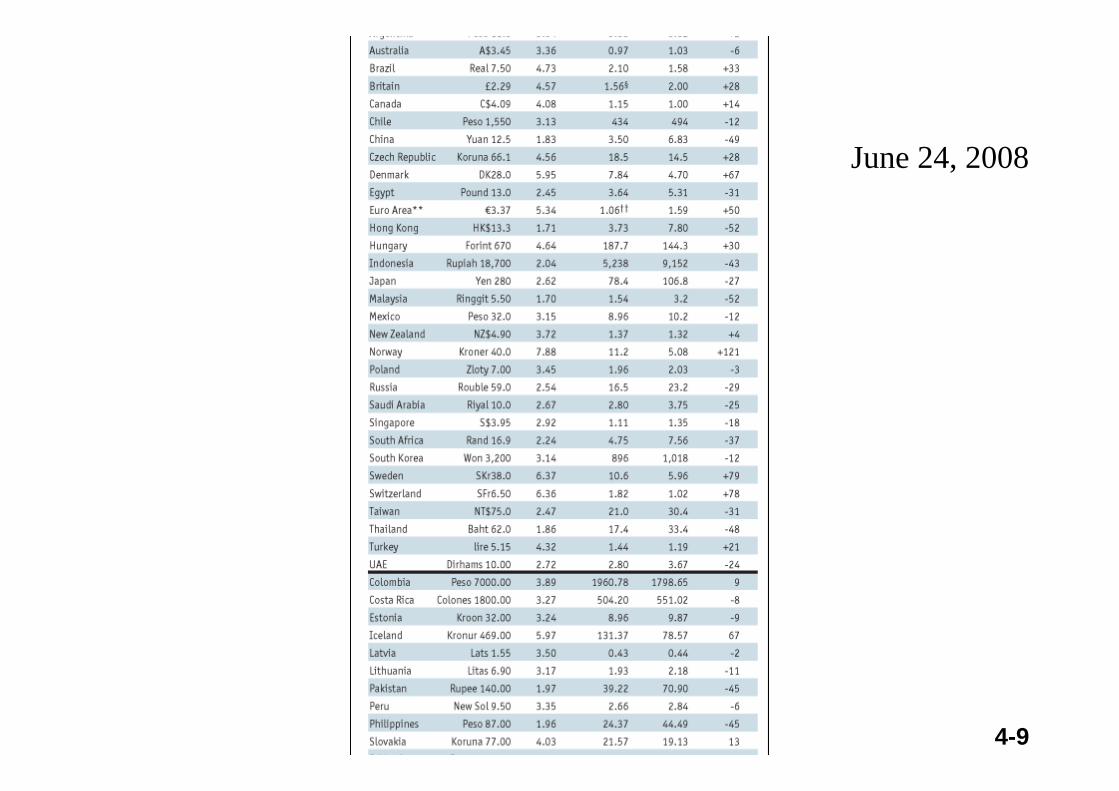
June 24, 2008
4-10
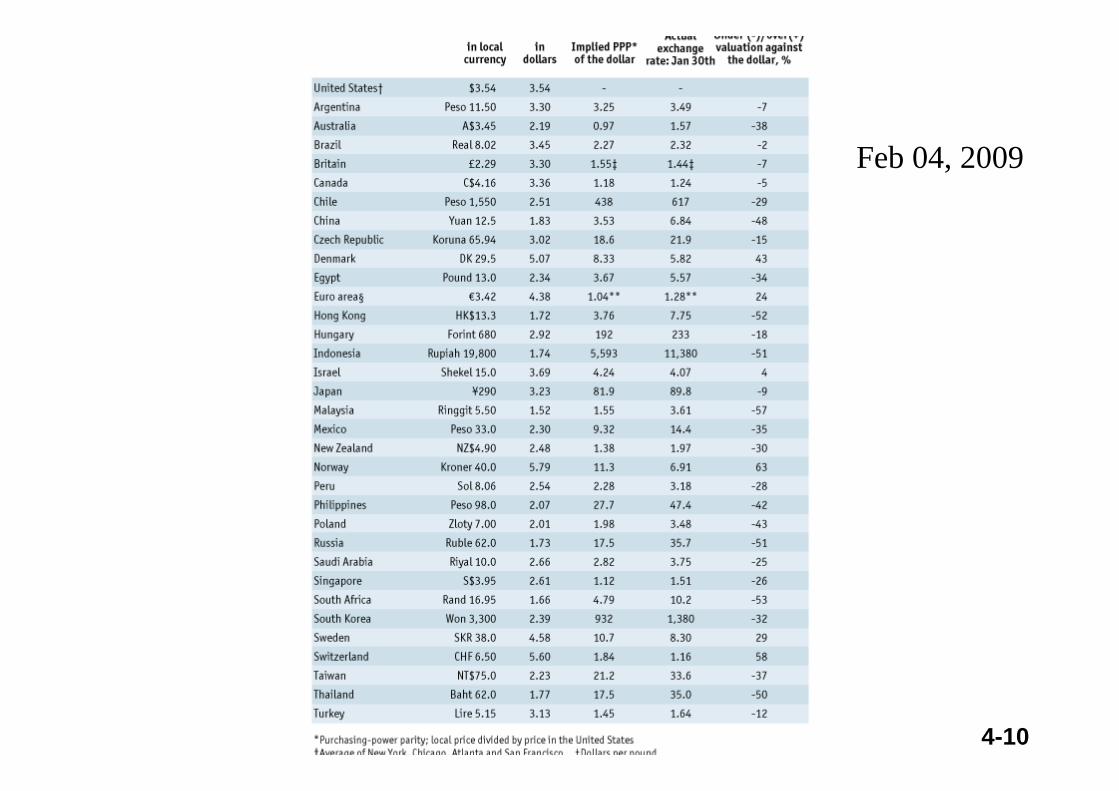
Feb 04, 2009
4-11
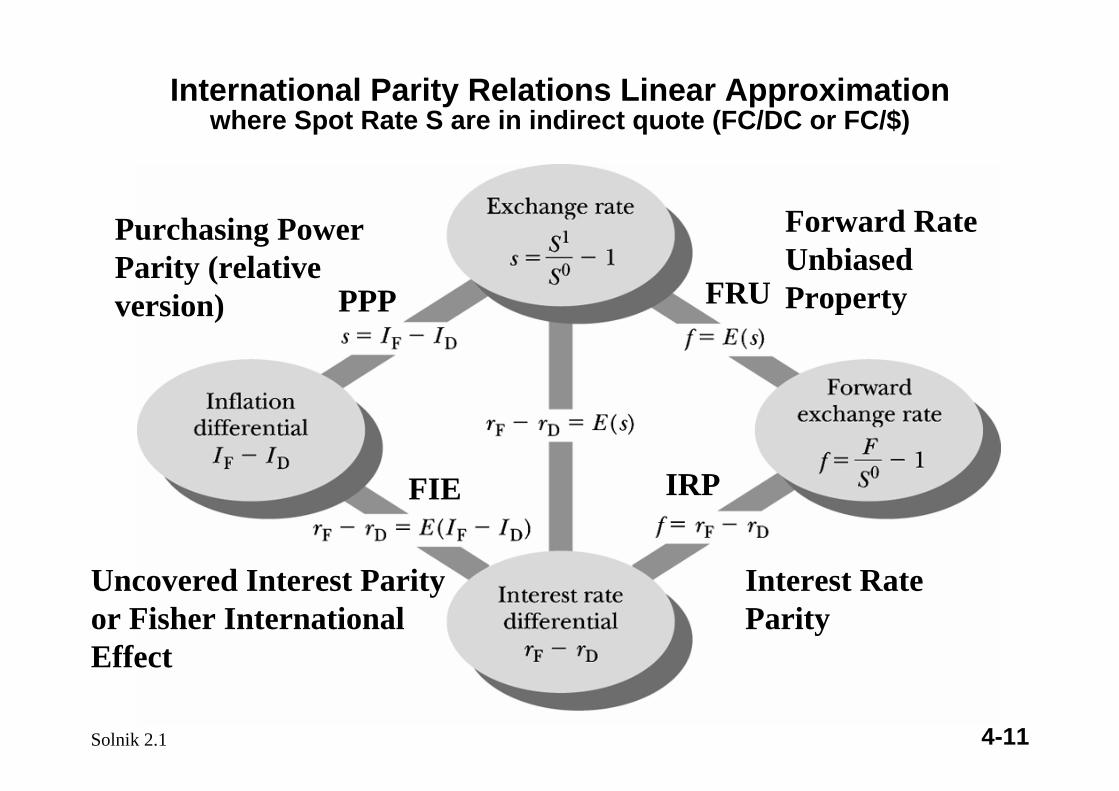
International Parity Relations Linear Approximationwhere Spot Rate S are in indirect quote (FC/DC or FC/$)
Solnik 2.1
Interest Rate Parity
Forward Rate Unbiased Property
Uncovered Interest Parityor Fisher International Effect
Purchasing Power Parity (relative version) PPP
IRPFIE
FRU
4-12
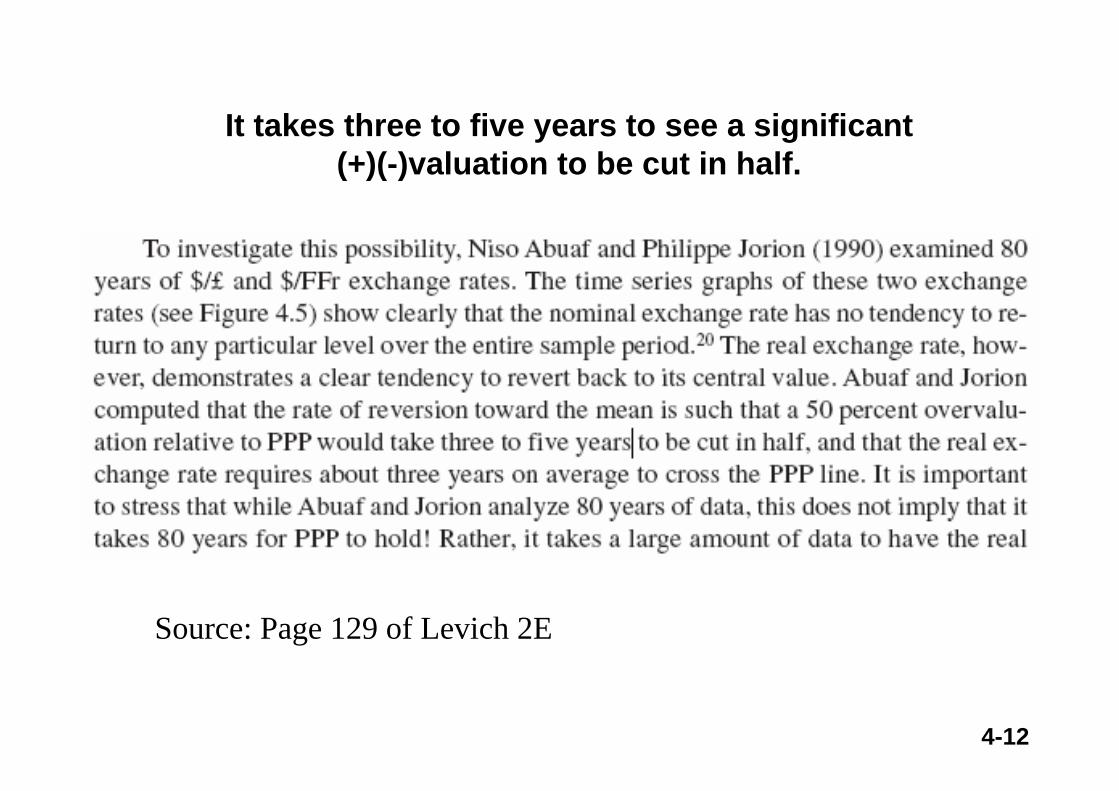
Source: Page 129 of Levich 2E
It takes three to five years to see a significant (+)(-)valuation to be cut in half.
Foreign Exchange MarketsInternational Parity Conditions
Purchasing Power Parity
MS&E 247S International InvestmentsYee-Tien (Ted) Fu
4-14
“Under the skin of any international economist lies a deep-seated belief in some variant of
the PPP theory of the exchange rate.”
- Dornbusch and Krugman (1976)
4-15
Parity Conditions• Parity or equilibrium conditions can be thought
of as international financial “benchmarks” or “break-even values”.¤ They are the defining points where the decision-
maker in a private enterprise is indifferent between the two strategies summarized by the two halves of the parity relation.
¤ Such decisions include :–to borrow in one currency or another?–to locate a plant in one country or another?–to measure exposure to currency risks using one
formula or another?
4-16
Parity Conditions• Parity conditions are the most intriguing when
they are false. Why is this so?¤ Because the parity conditions rely heavily on
arbitrage, a violation of parity often implies that a direct or indirect profit opportunity (or cost advantage) is available to the decision-maker.
¤ These times present the greatest opportunities but not necessarily the greatest risks.
¤ So, the decision-maker should be most interested in knowing the direction and duration of such departures from parity.
4-17
Analysis of Parity ConditionsFor each parity condition :Step 1: Assume a perfect capital market setting.
- no transaction costs- no taxes- complete certainty
Step 2: Relax the key assumptions underlyingthe parity condition.
Step 3: Review the empirical evidence under theparity condition.
We will begin with purchasing power parity (PPP) by developing its theory and reviewing the empirical evidence related to it.
4-18
• When goods become expensive in one country (relatively high inflation rate), exports decrease and imports increase due to arbitrage across the goods markets. So, the demand for foreign currencies increases and the domestic currency value is depressed.
• The result is that currencies will fluctuate until the relative purchasing power of each country is the same, that is, reaches parity.
Purchasing Power Parity
4-19
Purchasing Power Parity
• The theory of purchasing power parity (PPP) focuses on this inflation - exchange rate relationship.
• The absolute form is the “Law of One Price”. It suggests that similar products in different countries should be equally priced when measured in the same currency.
• The relative form of PPP accounts for market imperfections like transportation costs, tariffs, and quotas.
4-20
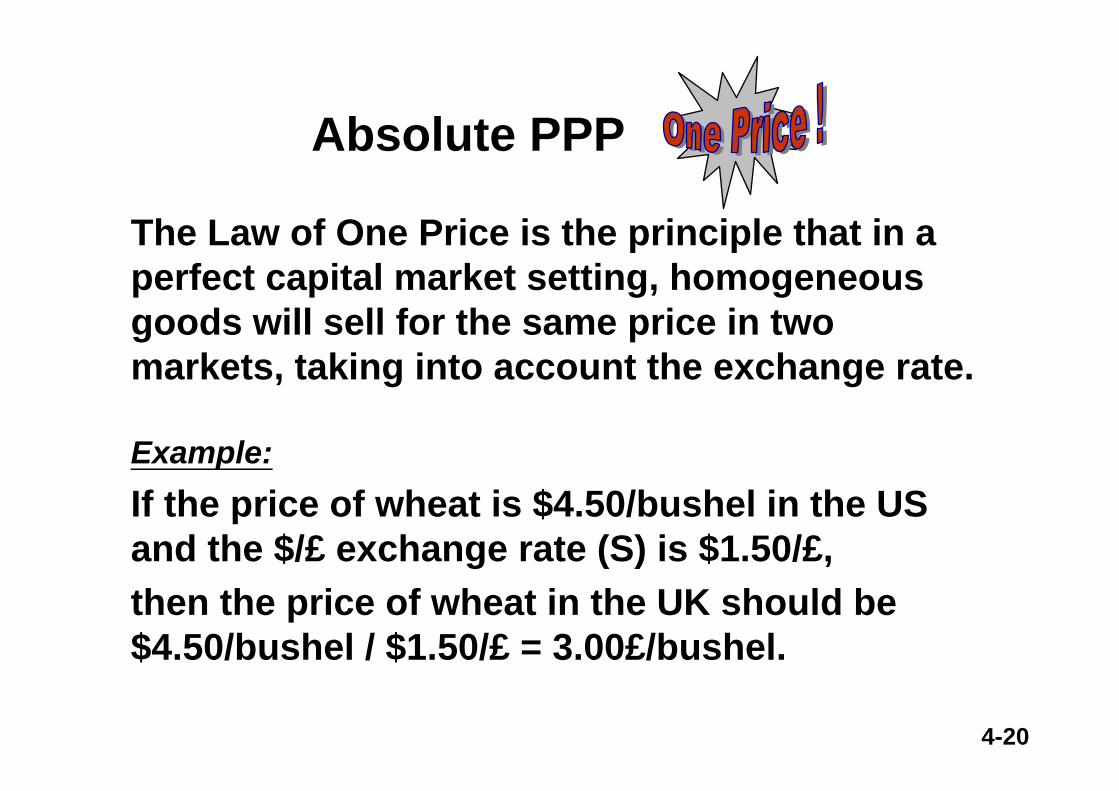
The Law of One Price is the principle that in a perfect capital market setting, homogeneous goods will sell for the same price in two markets, taking into account the exchange rate.
Example:If the price of wheat is $4.50/bushel in the US and the $/£ exchange rate (S) is $1.50/£,then the price of wheat in the UK should be $4.50/bushel / $1.50/£ = 3.00£/bushel.
Absolute PPP
4-21
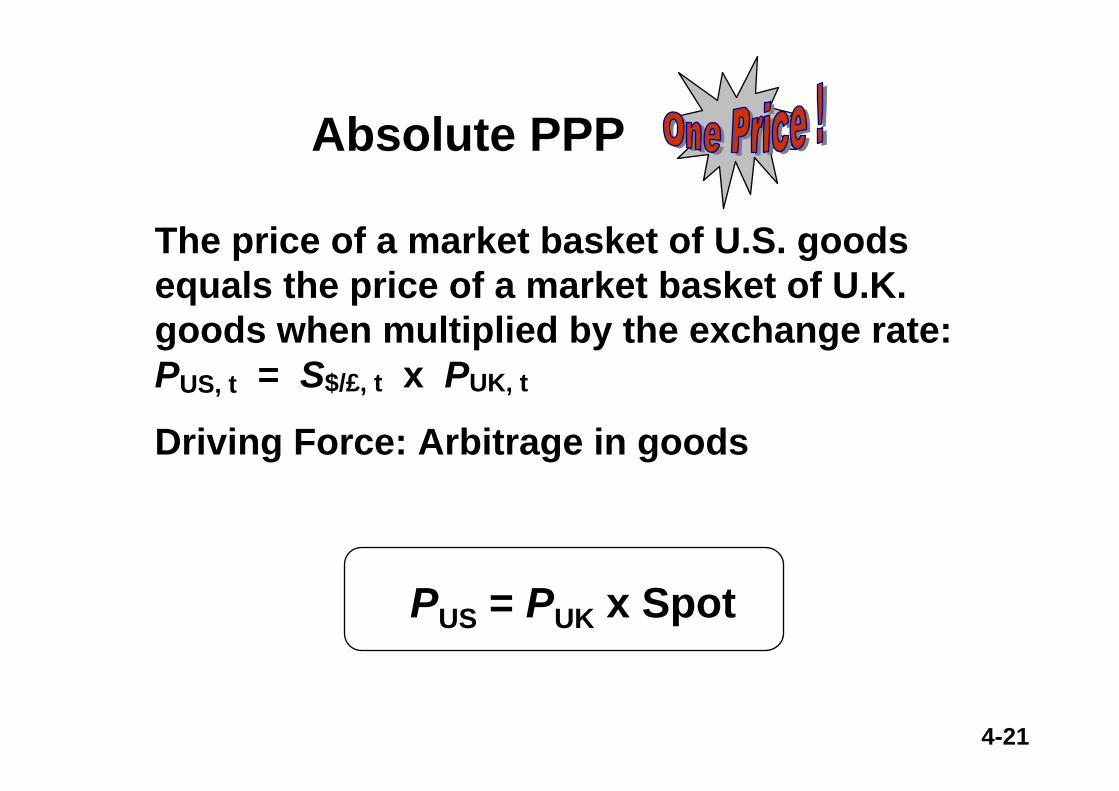
The price of a market basket of U.S. goods equals the price of a market basket of U.K. goods when multiplied by the exchange rate:PUS, t = S$/£, t x PUK, t
Driving Force: Arbitrage in goods
PUS = PUK x Spot
Absolute PPP
4-22
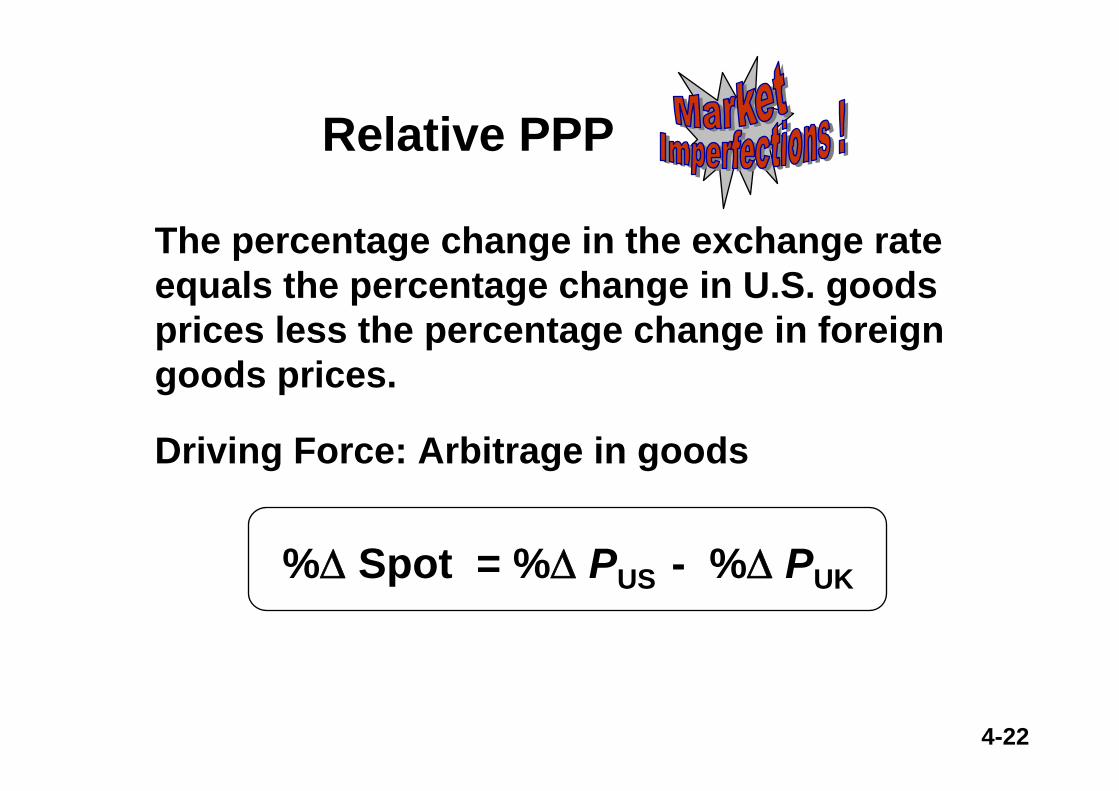
The percentage change in the exchange rate equals the percentage change in U.S. goods prices less the percentage change in foreign goods prices.
Driving Force: Arbitrage in goods
%Δ Spot = %Δ PUS - %Δ PUK
Relative PPP
4-23
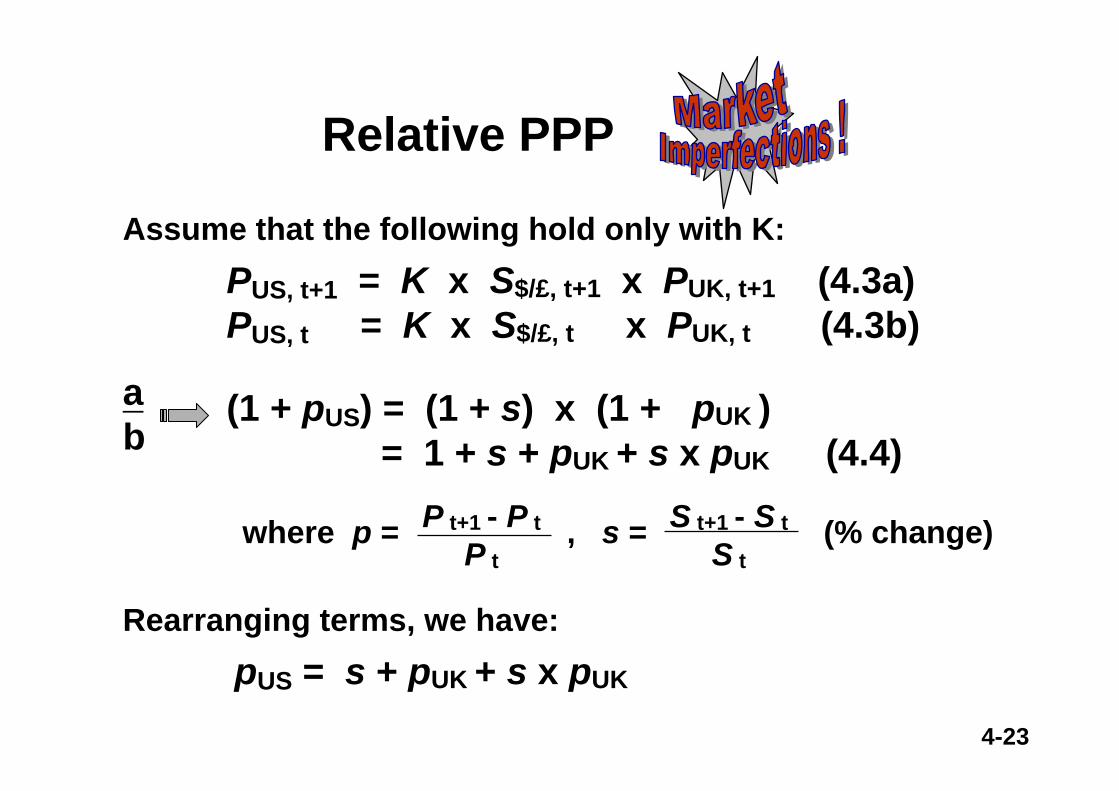
Assume that the following hold only with K:PUS, t+1 = K x S$/£, t+1 x PUK, t+1 (4.3a)PUS, t = K x S$/£, t x PUK, t (4.3b)
ab
(1 + pUS) = (1 + s) x (1 + pUK )= 1 + s + pUK + s x pUK (4.4)
where p = , s = (% change)P t+1 - P tP t
S t+1 - S tS t
Rearranging terms, we have:pUS = s + pUK + s x pUK
Relative PPP
4-24
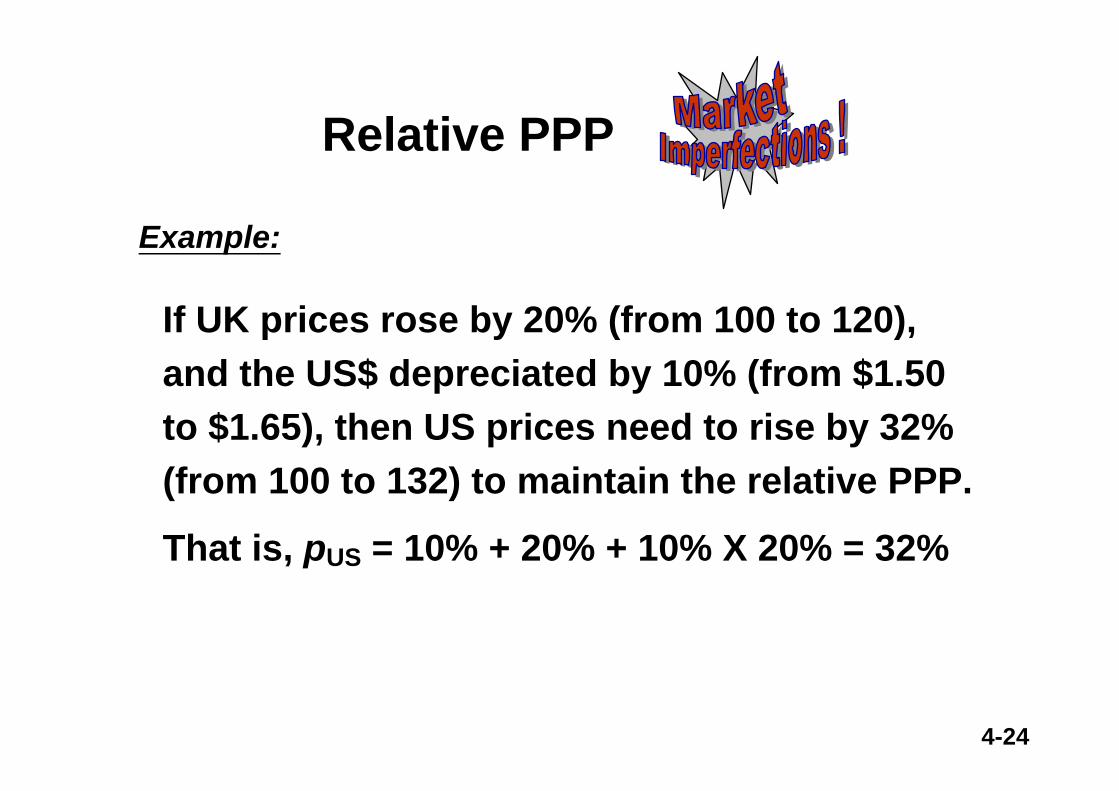
If UK prices rose by 20% (from 100 to 120), and the US$ depreciated by 10% (from $1.50 to $1.65), then US prices need to rise by 32% (from 100 to 132) to maintain the relative PPP.
That is, pUS = 10% + 20% + 10% X 20% = 32%
Example:
Relative PPP
4-25
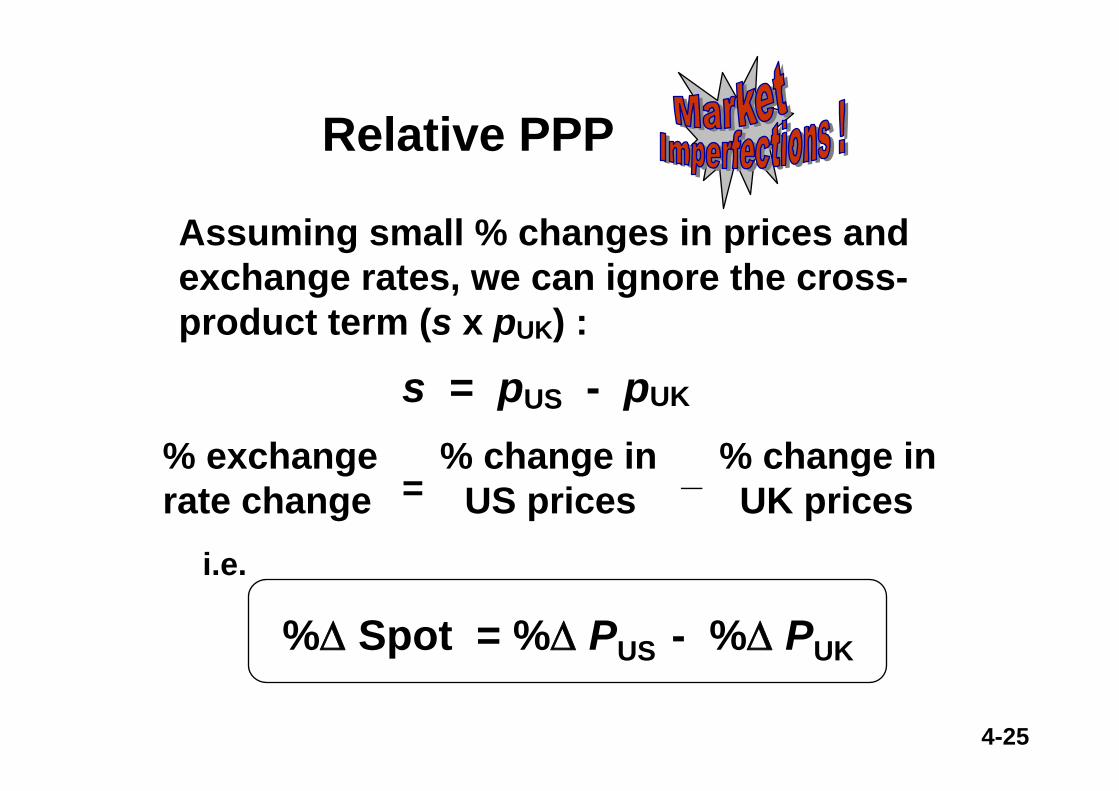
% exchange % change in % change inrate change US prices UK prices
Assuming small % changes in prices and exchange rates, we can ignore the cross-product term (s x pUK) :
s = pUS - pUK
= _
Relative PPP
%Δ Spot = %Δ PUS - %Δ PUK
i.e.
4-26
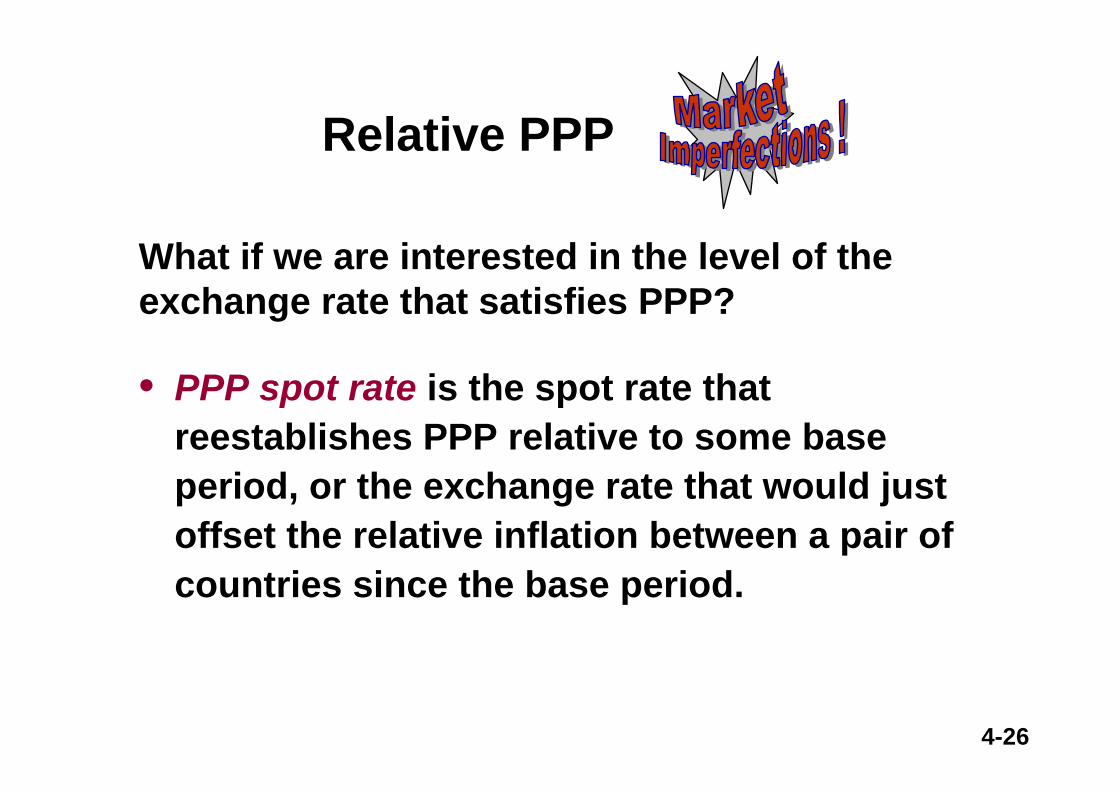
What if we are interested in the level of the exchange rate that satisfies PPP?
Relative PPP
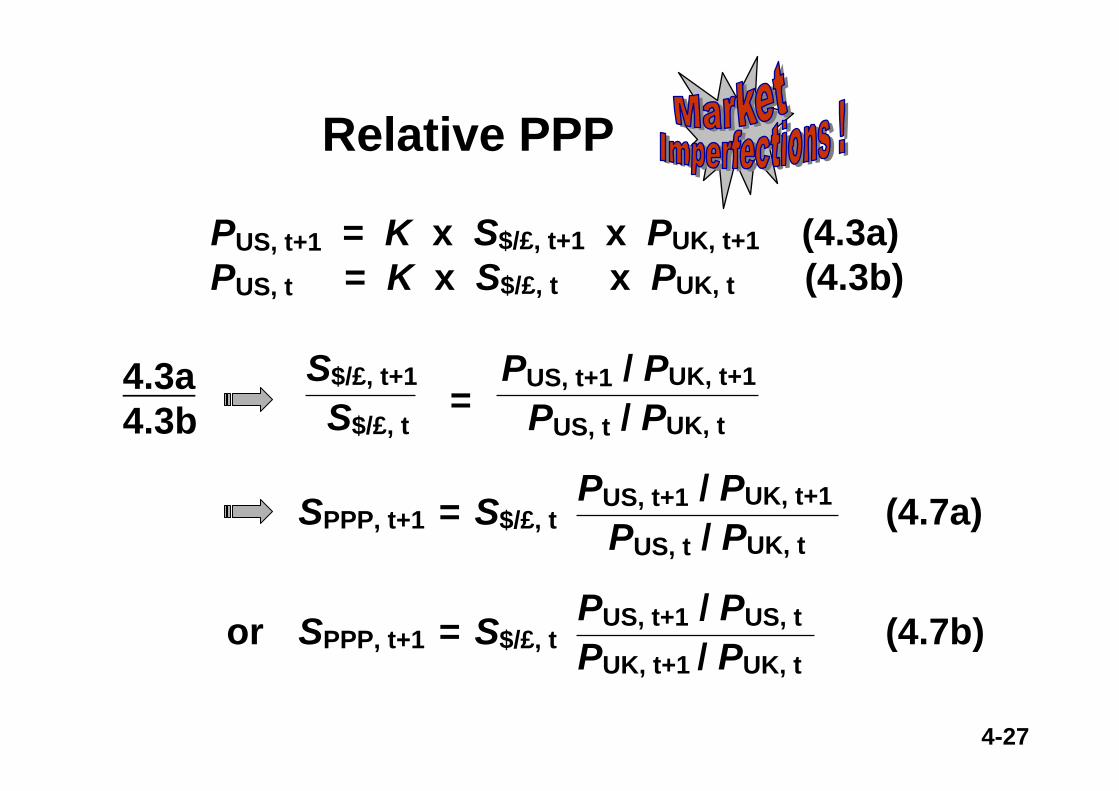
• PPP spot rate is the spot rate that reestablishes PPP relative to some base period, or the exchange rate that would just offset the relative inflation between a pair of countries since the base period.
4-27
PUS, t+1 = K x S$/£, t+1 x PUK, t+1 (4.3a)PUS, t = K x S$/£, t x PUK, t (4.3b)
4.3a4.3b
S$/£, t+1 PUS, t+1 / PUK, t+1
S$/£, t PUS, t / PUK, t =
PUS, t+1 / PUK, t+1
PUS, t / PUK, t SPPP, t+1 = S$/£, t (4.7a)
or PUS, t+1 / PUS, t
PUK, t+1 / PUK, t SPPP, t+1 = S$/£, t (4.7b)
Relative PPP
4-28
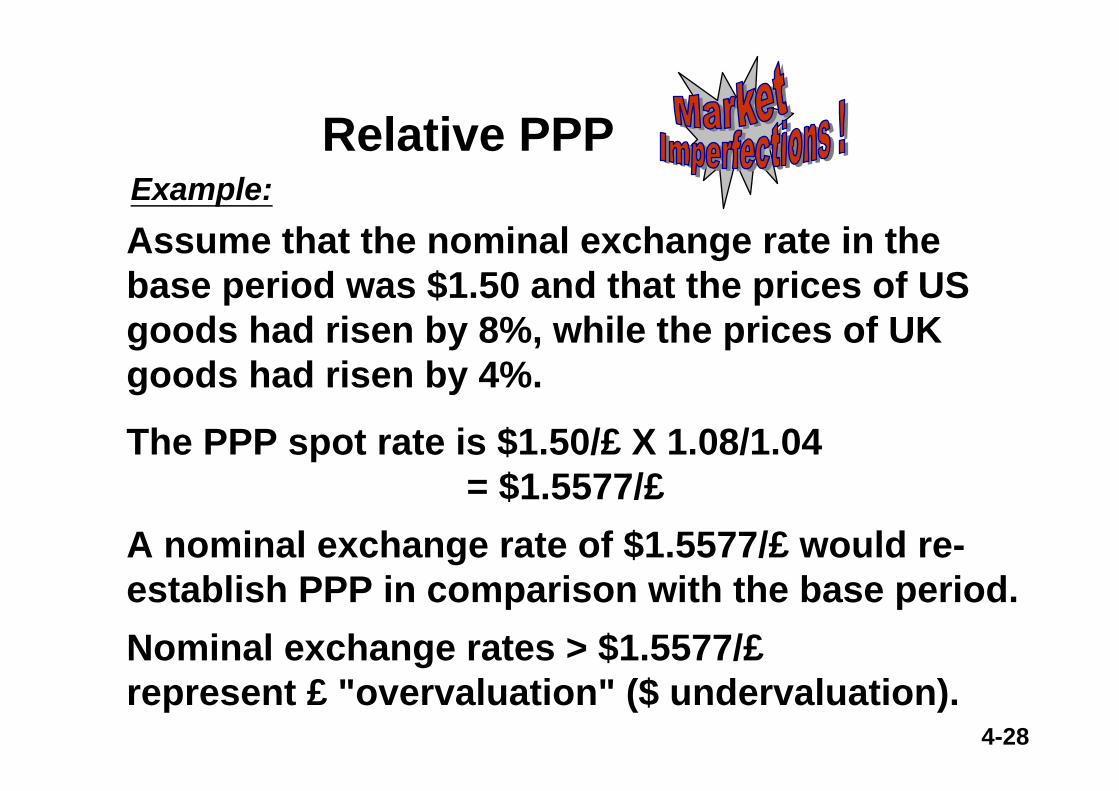
Example:Assume that the nominal exchange rate in the base period was $1.50 and that the prices of US goods had risen by 8%, while the prices of UK goods had risen by 4%.
The PPP spot rate is $1.50/£ X 1.08/1.04 = $1.5577/£
A nominal exchange rate of $1.5577/£ would re-establish PPP in comparison with the base period. Nominal exchange rates > $1.5577/£represent £ "overvaluation" ($ undervaluation).
Relative PPP
4-29
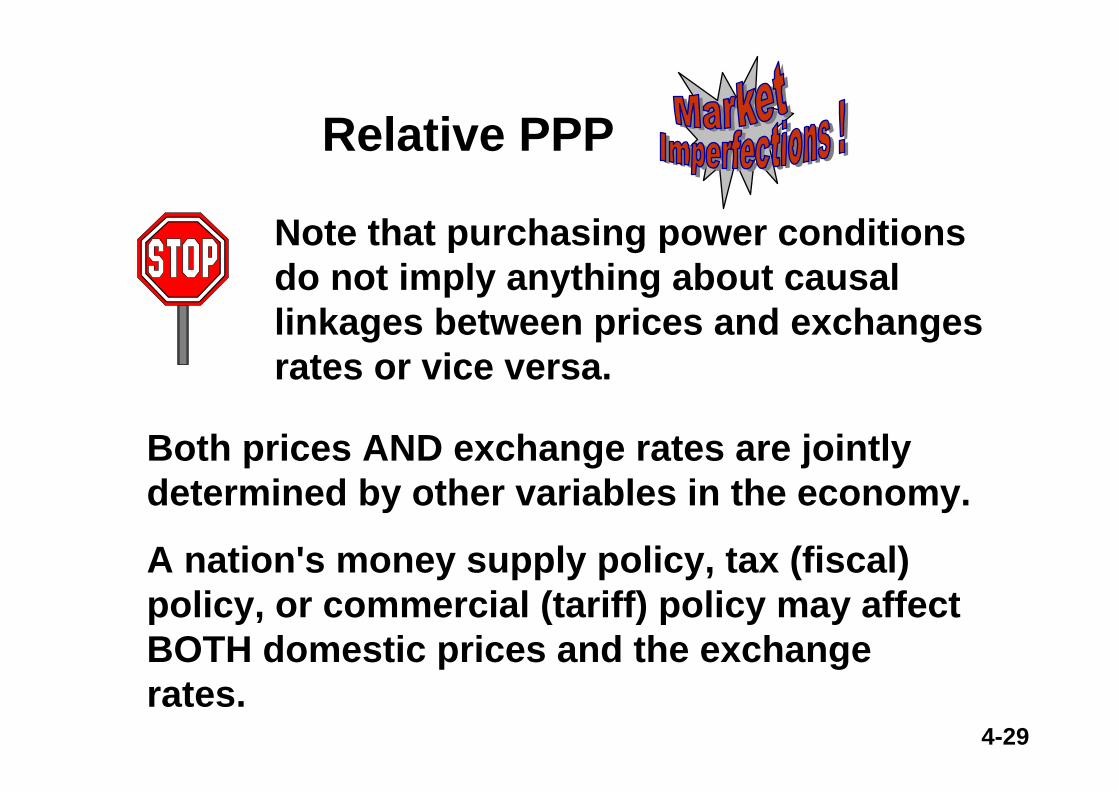
Note that purchasing power conditions do not imply anything about causal linkages between prices and exchanges rates or vice versa.
Both prices AND exchange rates are jointly determined by other variables in the economy.
A nation's money supply policy, tax (fiscal) policy, or commercial (tariff) policy may affect BOTH domestic prices and the exchange rates.
Relative PPP
4-30
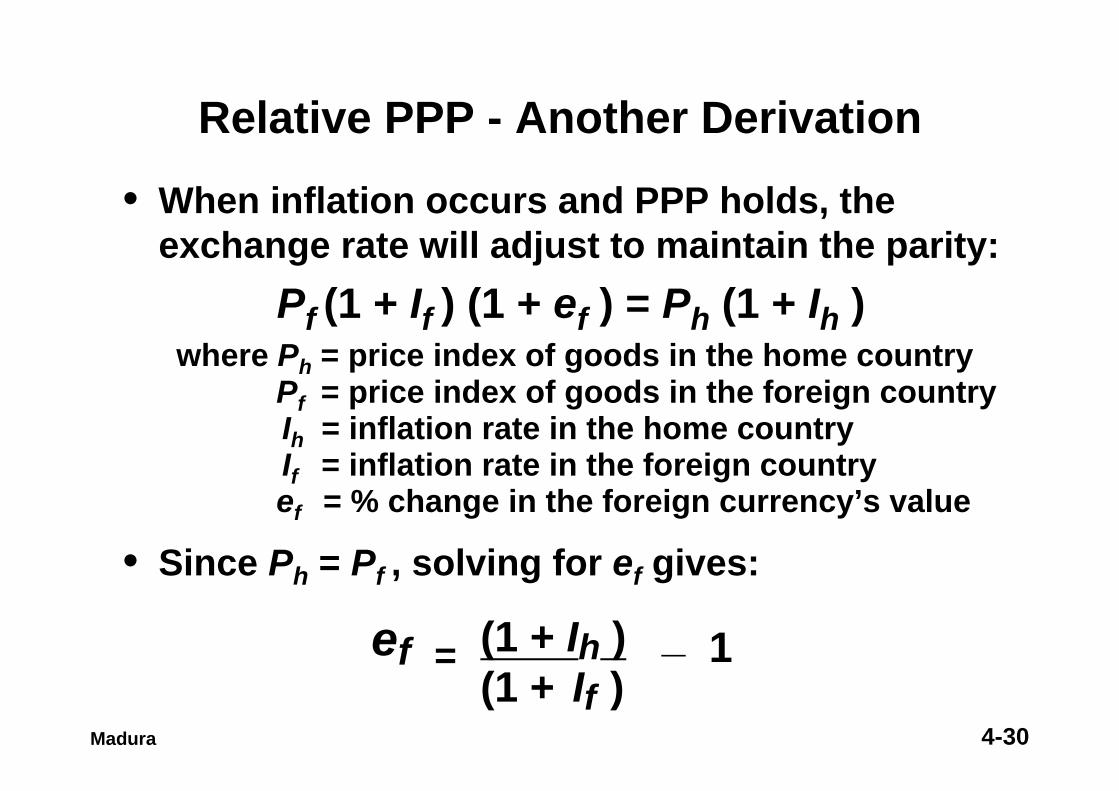
• When inflation occurs and PPP holds, the exchange rate will adjust to maintain the parity:
Pf (1 + If ) (1 + ef ) = Ph (1 + Ih )where Ph = price index of goods in the home country
Pf = price index of goods in the foreign countryIh = inflation rate in the home countryIf = inflation rate in the foreign countryef = % change in the foreign currency’s value
• Since Ph = Pf , solving for ef gives:
ef = (1 + Ih ) _ 1(1 + If )
Relative PPP - Another Derivation
Madura
4-31
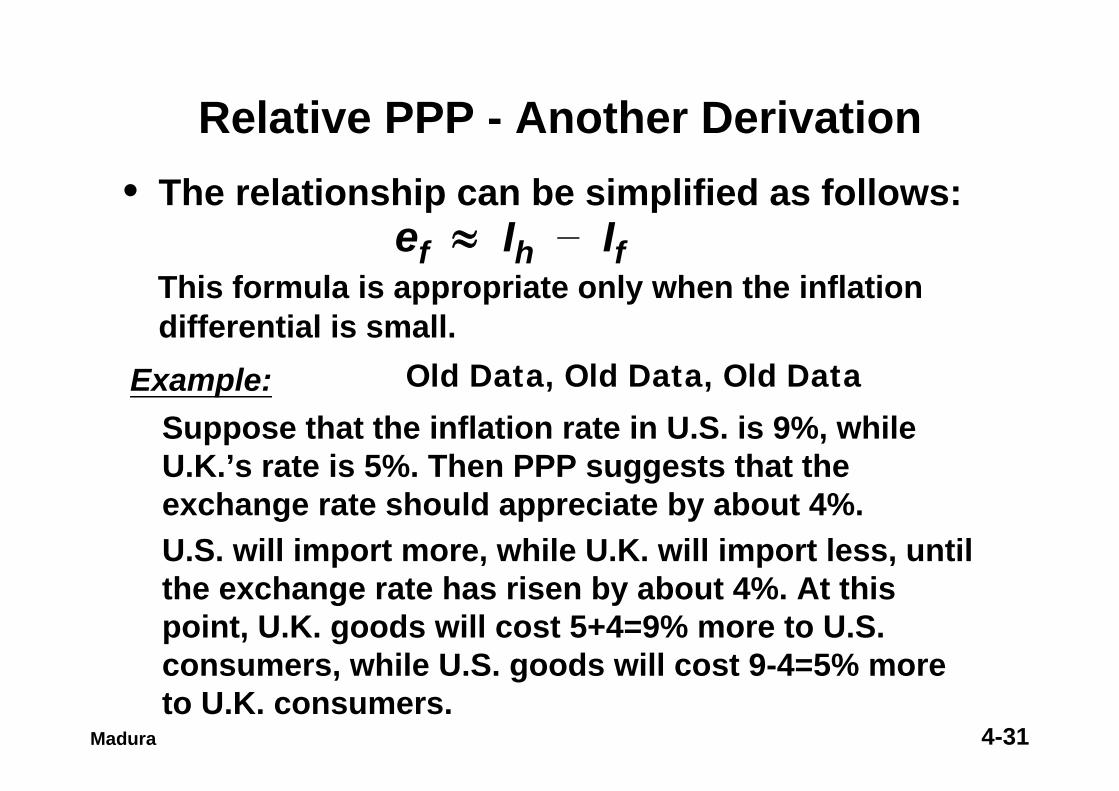
• The relationship can be simplified as follows:ef ≈ Ih
_ IfThis formula is appropriate only when the inflation differential is small.
Example:Suppose that the inflation rate in U.S. is 9%, while U.K.’s rate is 5%. Then PPP suggests that the exchange rate should appreciate by about 4%.U.S. will import more, while U.K. will import less, until the exchange rate has risen by about 4%. At this point, U.K. goods will cost 5+4=9% more to U.S. consumers, while U.S. goods will cost 9-4=5% more to U.K. consumers.
Relative PPP - Another Derivation
Madura
Old Data, Old Data, Old Data
4-32
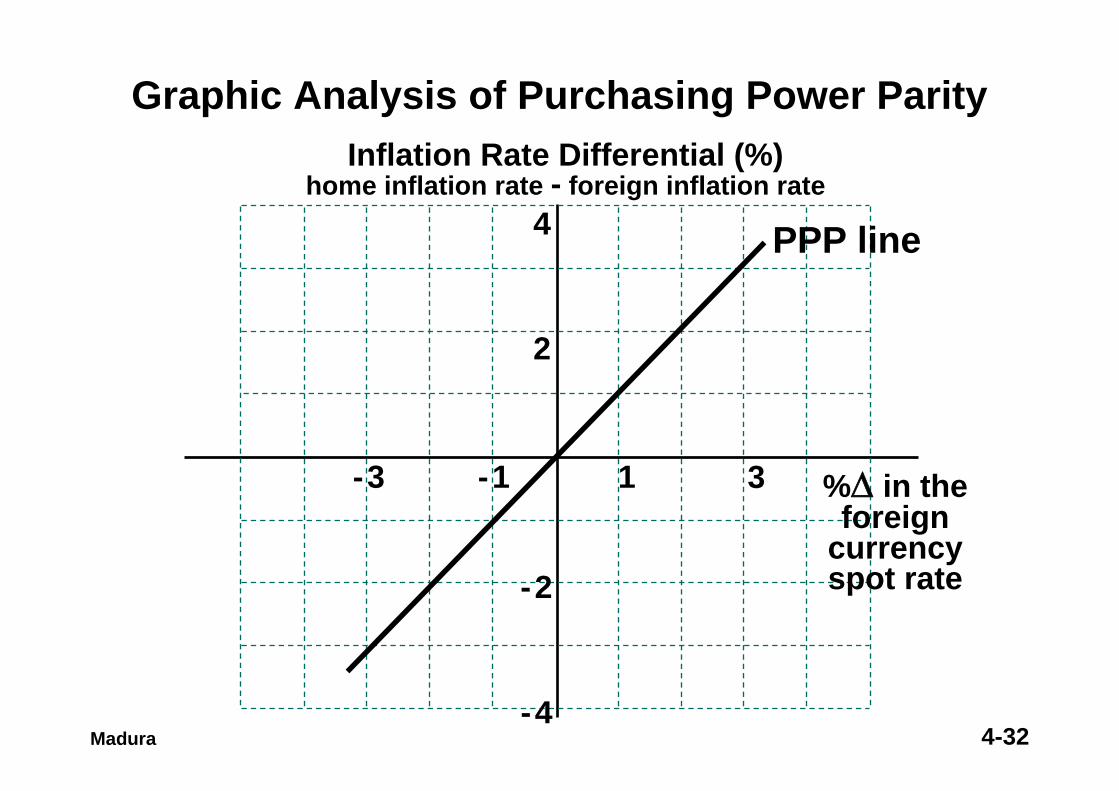
Graphic Analysis of Purchasing Power ParityInflation Rate Differential (%)
home inflation rate - foreign inflation rate
%Δ in the foreign
currencyspot rate-2
-4
2
4
1 3-1-3
PPP line
Madura
4-33
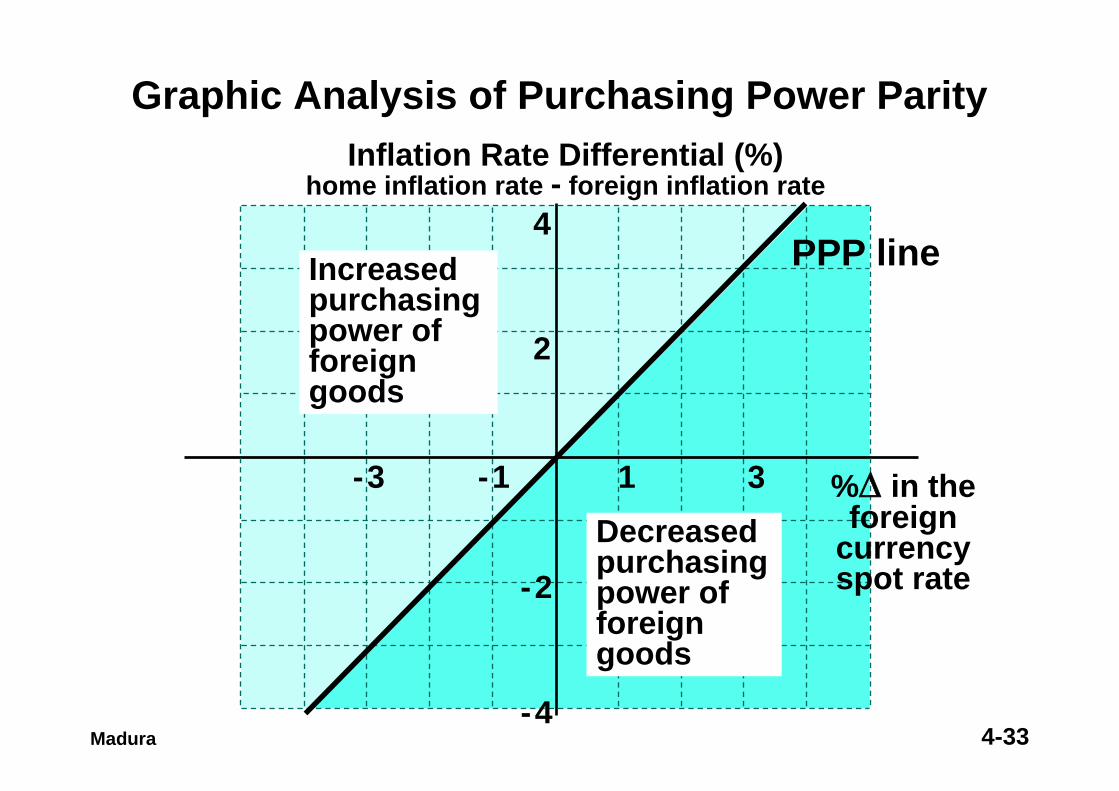
Graphic Analysis of Purchasing Power ParityInflation Rate Differential (%)
home inflation rate - foreign inflation rate
%Δ in the foreign
currencyspot rate-2
-4
2
4
1 3-1-3
PPP lineIncreased purchasing power of foreign goods
Decreased purchasing power of foreign goods
Madura
4-34
• If the actual inflation differential and exchange rate % change for two or more countries deviate significantly from the PPP line over time, then PPP does not hold.
• A statistical test can be developed by applying regression analysis to the historical exchange rates and inflation differentials:
ef = a0 + a1 { (1+Ih)/(1+If) - 1 } + μThe appropriate t-tests are then applied to a0and a1, whose hypothesized values are 0 and 1 respectively.
Madura
Purchasing Power Parity
4-35
• PPP may not occur consistently due to:¤ the existence of other influential factors like
differentials in income levels and risk, as well as government controls; and
¤ the lack of substitutes for traded goods.• A limitation in testing PPP is that the results
may vary according to the base period used.• PPP can also be tested by assessing a “real”
exchange rate over time. If this rate reverts to some mean level over time, this would suggest that it is constant in the long run.
Purchasing Power Parity
Madura
4-36
• For a country which relies heavily on trade to maintain living standards, it is arguable that the exchange rate that is important is not the rate at which the country’s currency exchanges for another, but the rate at which the country’s goods exchange in international trade.
• One such calculation of this is the real exchange rate, which relates the effective exchange rate to the price of domestic goods relative to the price of foreign goods.
The Real Exchange Rate
International Business Economics: Piggott and Cook
4-37
The Effective Exchange Rate
International Business Economics: Piggott and Cook
• Since a currency varies against other currencies, it sometimes makes little sense to refer to one particular bilateral rate intended to represent the foreign exchange value of that currency.
• What is needed is some kind of average foreign currency value, of, say, the pound or Deutsche mark against several other currencies, and indeed this is what is currently computed for all major currencies.
• These “average exchange rates” are termed effective exchange rates and are calculated as an index.
4-38International Business Economics: Piggott and Cook
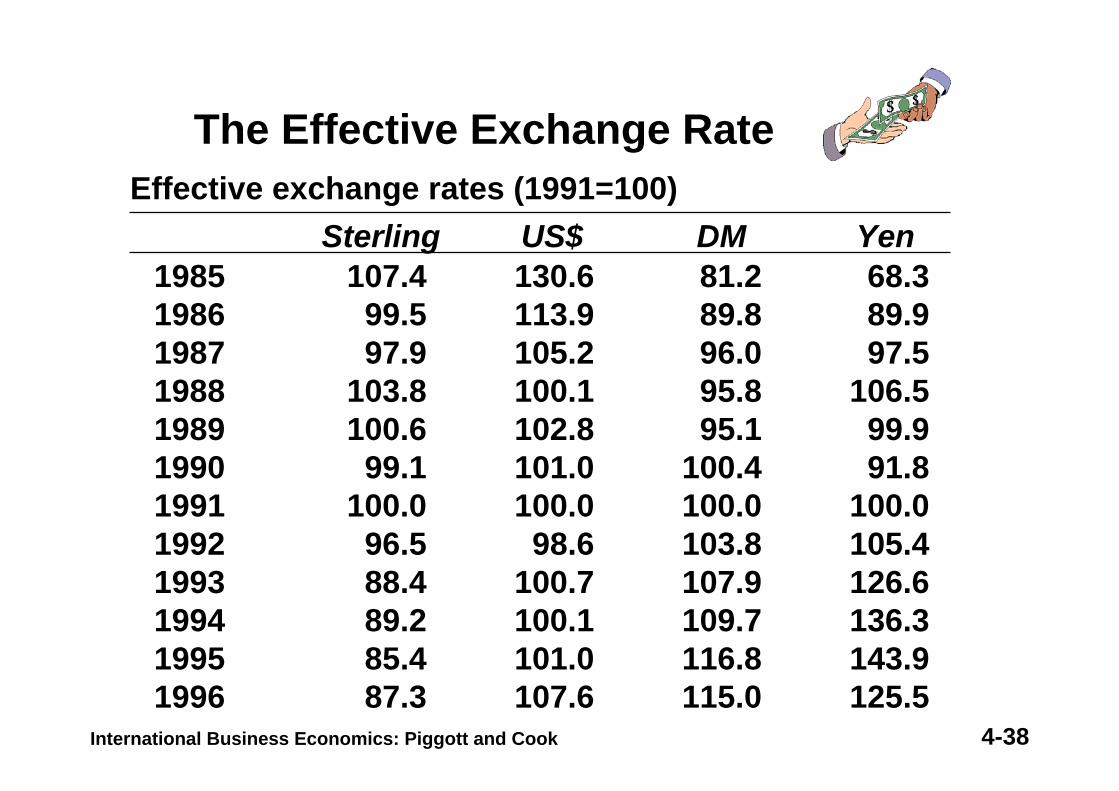
198519861987198819891990199119921993199419951996
107.499.597.9
103.8100.6
99.1100.0
96.588.489.285.487.3
130.6113.9105.2100.1102.8101.0100.0
98.6100.7100.1101.0107.6
81.289.896.095.895.1
100.4100.0103.8107.9109.7116.8115.0
68.389.997.5
106.599.991.8
100.0105.4126.6136.3143.9125.5
Sterling US$ DM Yen Effective exchange rates (1991=100)
The Effective Exchange Rate
4-39
The Effective Exchange Rate
Extra-Man
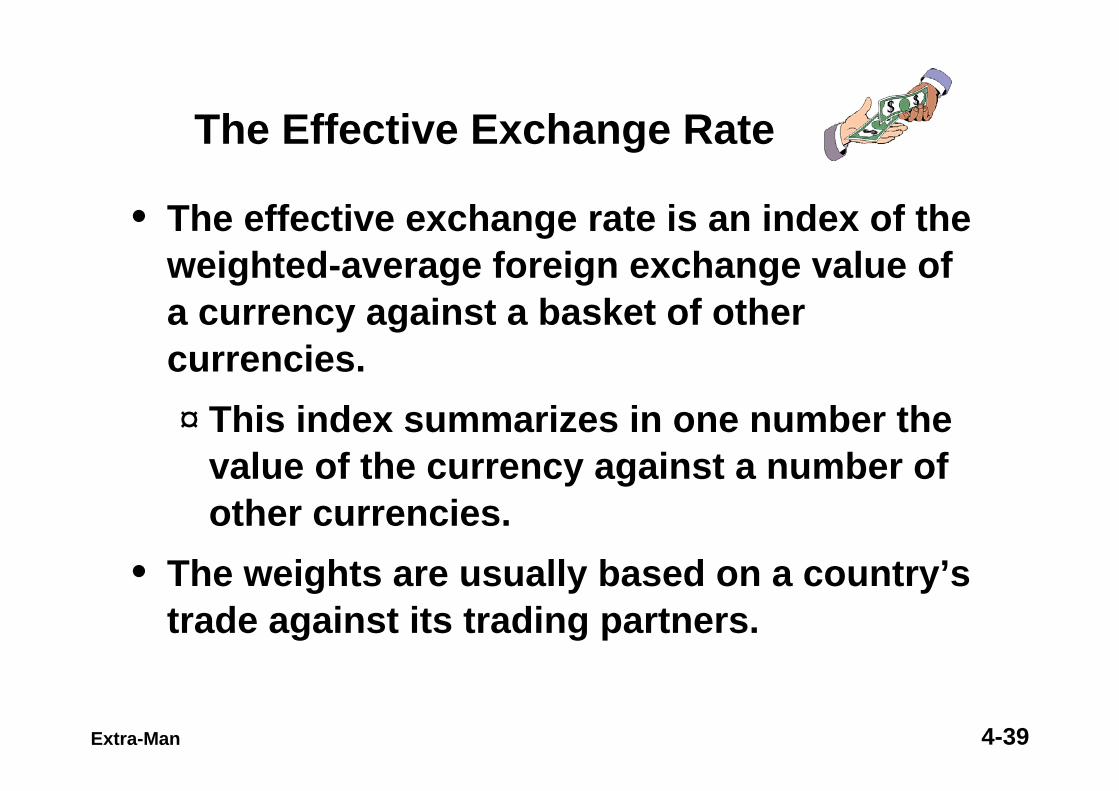
• The effective exchange rate is an index of the weighted-average foreign exchange value of a currency against a basket of other currencies. ¤ This index summarizes in one number the
value of the currency against a number of other currencies.
• The weights are usually based on a country’s trade against its trading partners.
4-40
The Effective Exchange Rate
Extra-Man
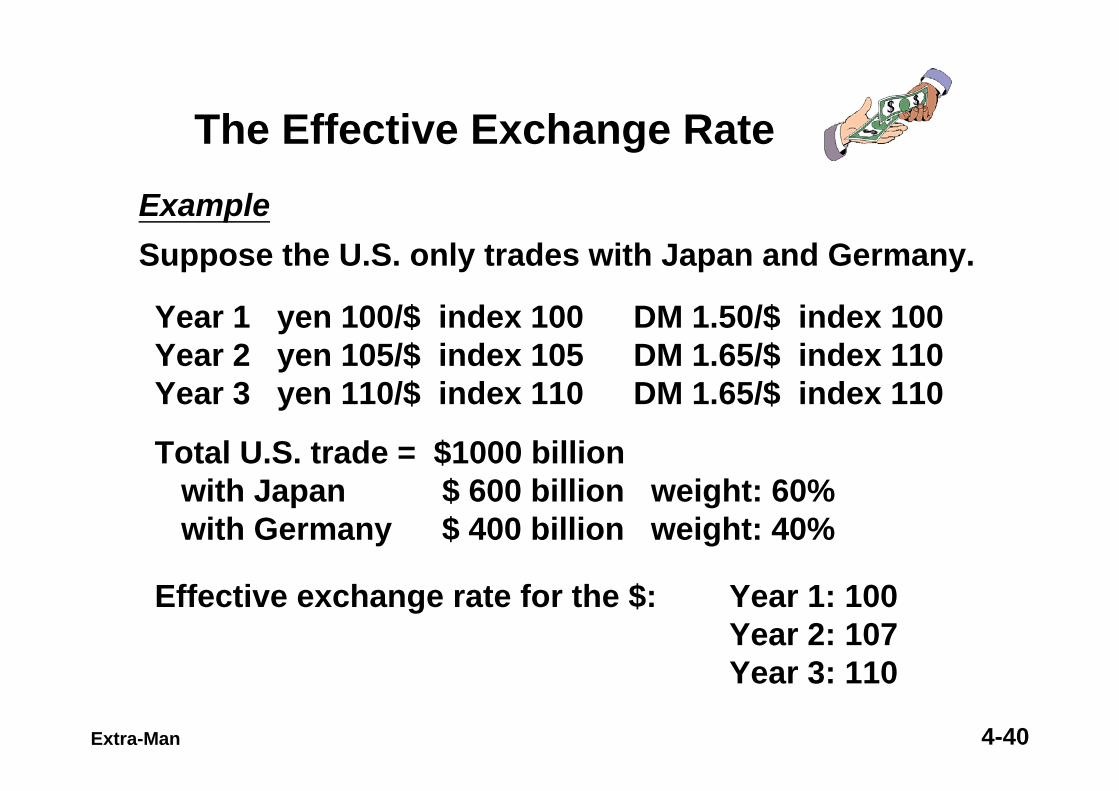
ExampleSuppose the U.S. only trades with Japan and Germany.
Year 1 yen 100/$ index 100 DM 1.50/$ index 100Year 2 yen 105/$ index 105 DM 1.65/$ index 110Year 3 yen 110/$ index 110 DM 1.65/$ index 110
Total U.S. trade = $1000 billionwith Japan $ 600 billion weight: 60%with Germany $ 400 billion weight: 40%
Effective exchange rate for the $: Year 1: 100Year 2: 107Year 3: 110
4-41
Openness in Goods and Financial Markets
Opening the Economy to International Transactions
Two dimensions of openness:
1. Openness in Goods Markets
2. Openness in Financial Markets
4-42
Openness in Goods Markets
4-43
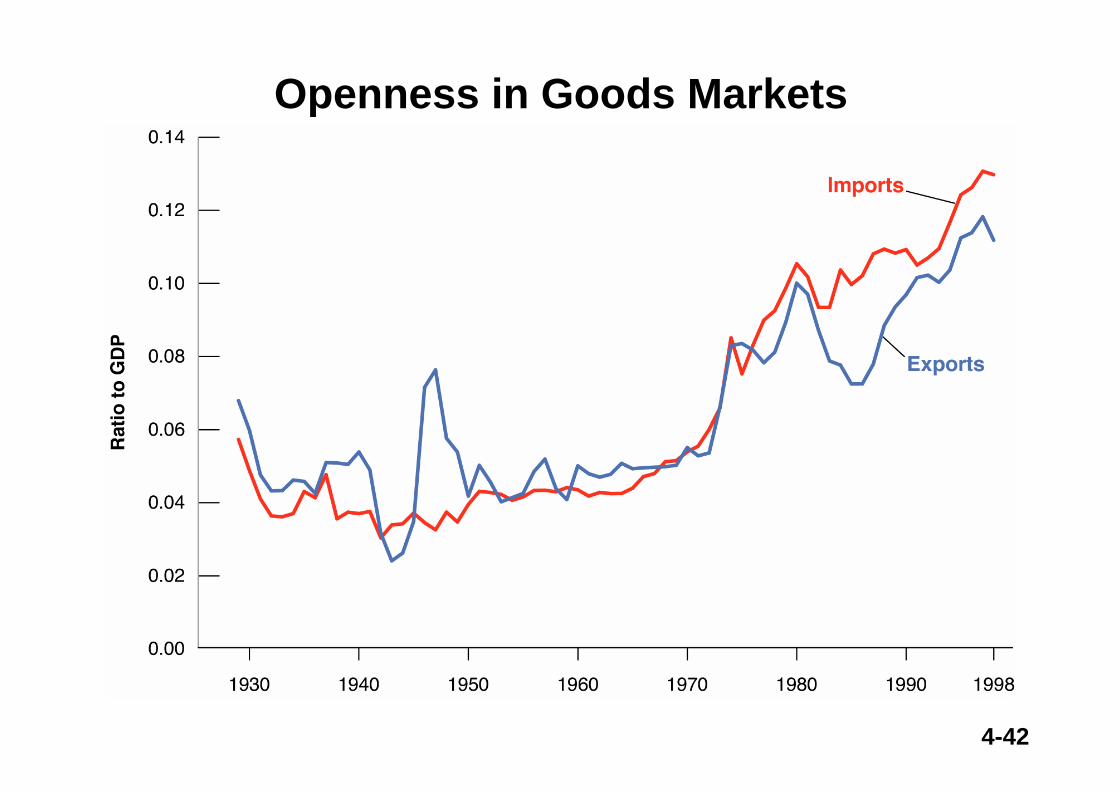
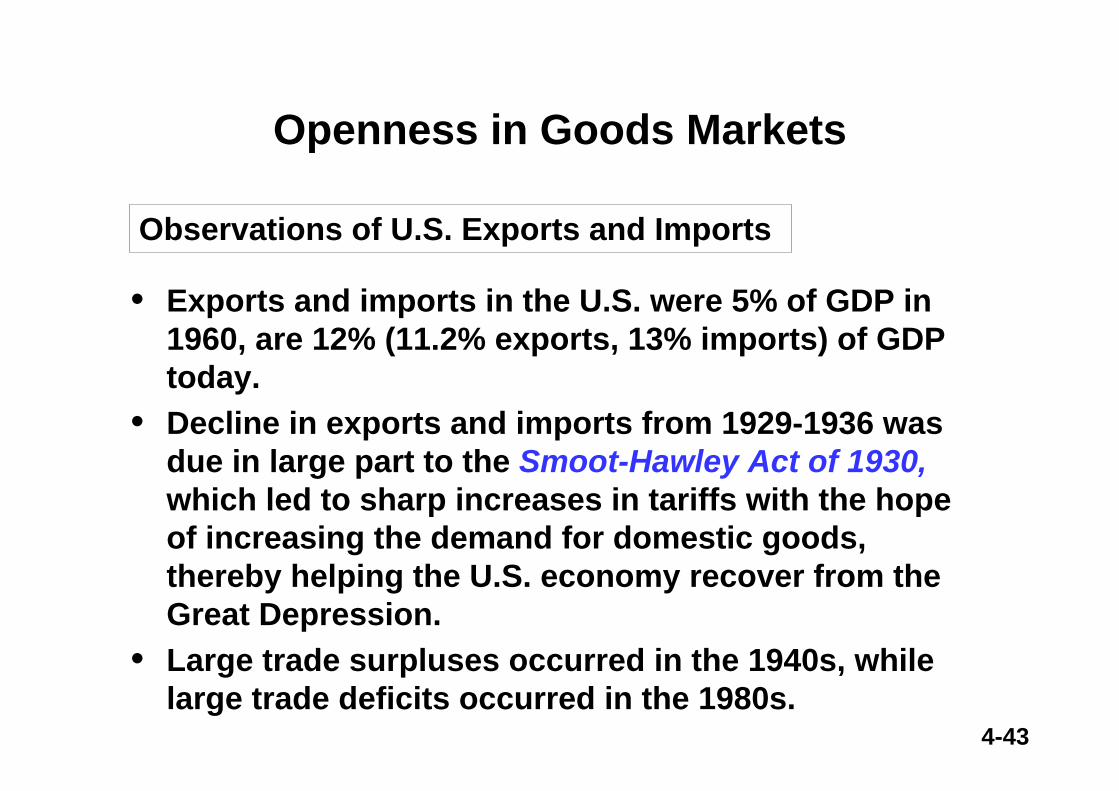
Observations of U.S. Exports and Imports
Openness in Goods Markets
• Exports and imports in the U.S. were 5% of GDP in 1960, are 12% (11.2% exports, 13% imports) of GDP today.
• Decline in exports and imports from 1929-1936 was due in large part to the Smoot-Hawley Act of 1930,which led to sharp increases in tariffs with the hope of increasing the demand for domestic goods, thereby helping the U.S. economy recover from the Great Depression.
• Large trade surpluses occurred in the 1940s, while large trade deficits occurred in the 1980s.
4-44
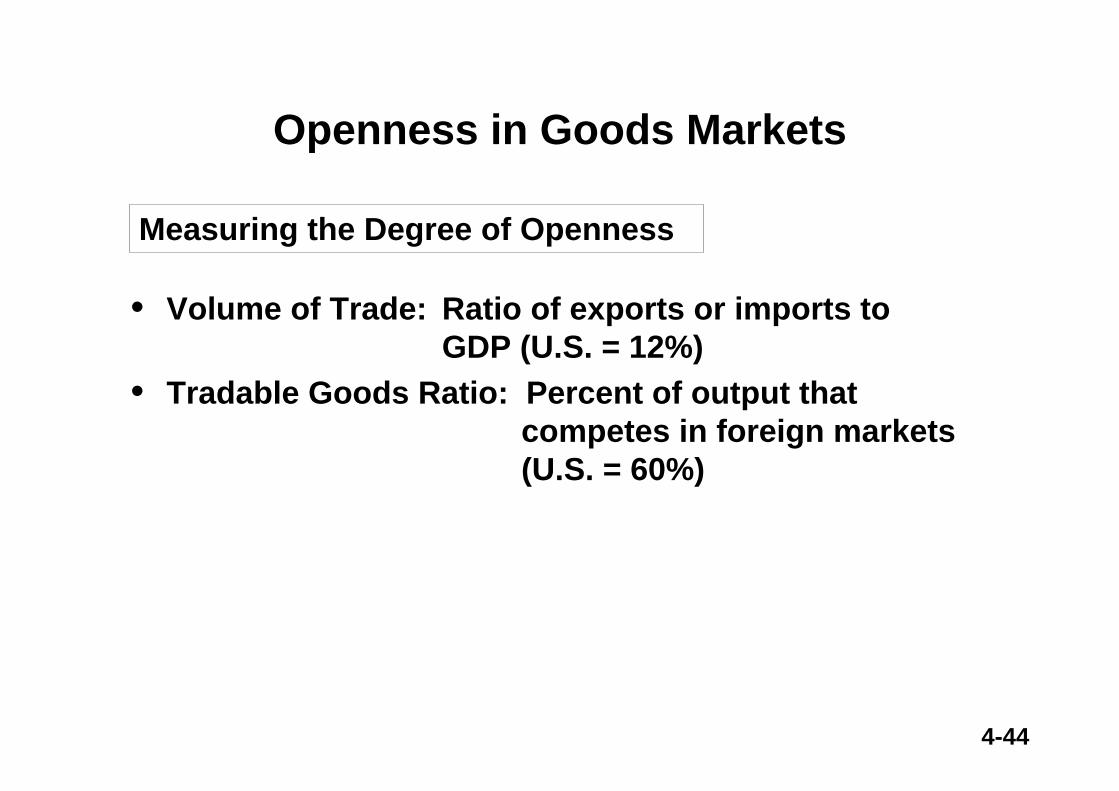
Measuring the Degree of Openness
Openness in Goods Markets
• Volume of Trade: Ratio of exports or imports toGDP (U.S. = 12%)
• Tradable Goods Ratio: Percent of output that competes in foreign markets(U.S. = 60%)
4-45
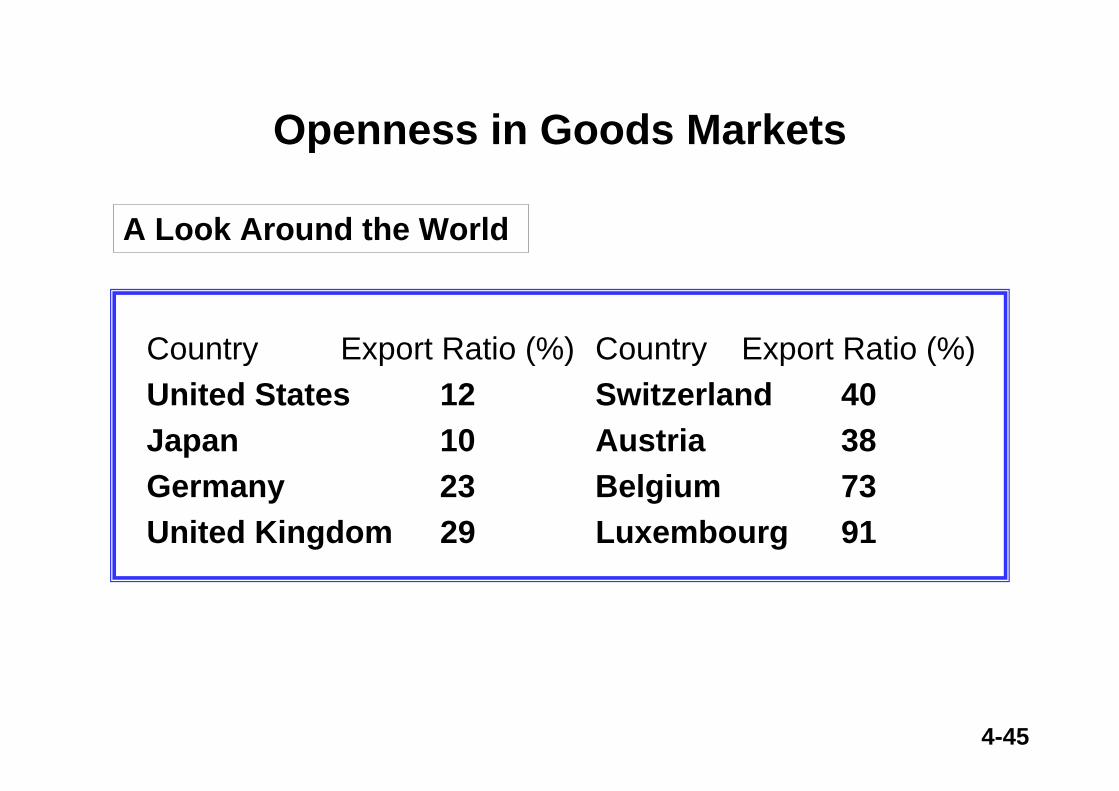
A Look Around the World
Openness in Goods Markets
Country Export Ratio (%) Country Export Ratio (%)United States 12 Switzerland 40Japan 10 Austria 38Germany 23 Belgium 73United Kingdom 29 Luxembourg 91
4-46
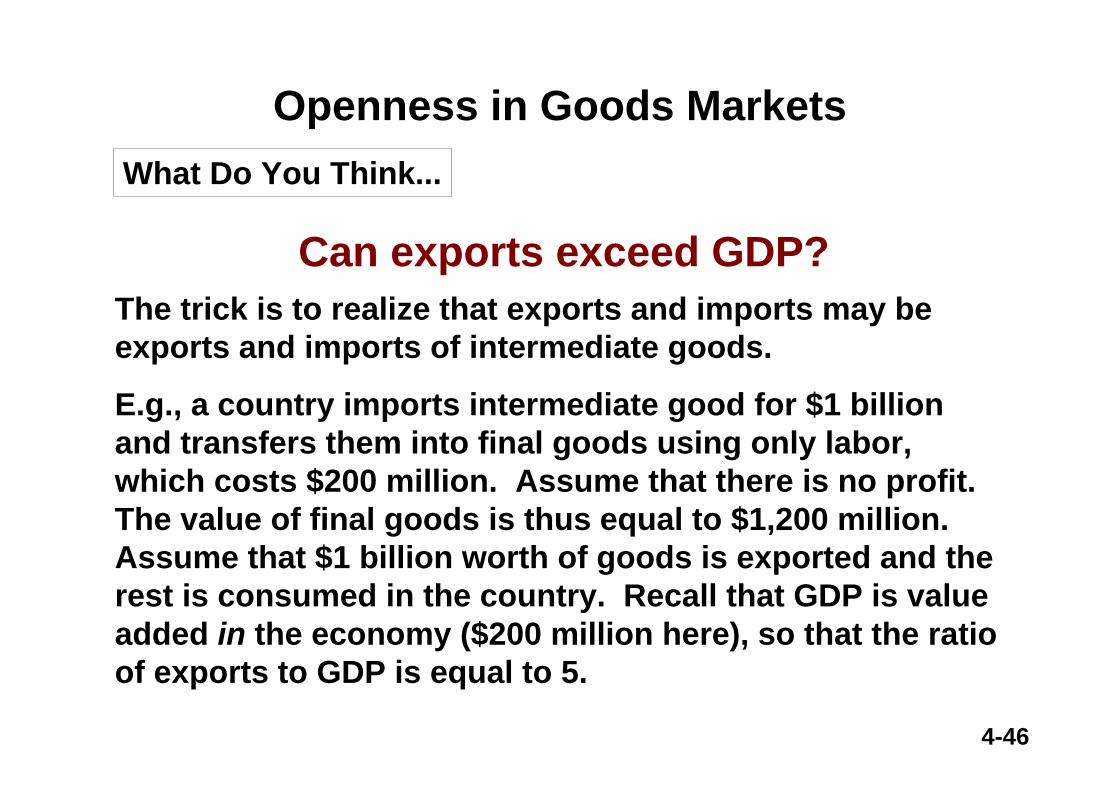
Openness in Goods MarketsWhat Do You Think...
Can exports exceed GDP?The trick is to realize that exports and imports may be exports and imports of intermediate goods.
E.g., a country imports intermediate good for $1 billion and transfers them into final goods using only labor, which costs $200 million. Assume that there is no profit. The value of final goods is thus equal to $1,200 million. Assume that $1 billion worth of goods is exported and the rest is consumed in the country. Recall that GDP is value added in the economy ($200 million here), so that the ratio of exports to GDP is equal to 5.
4-47
Openness in Goods Markets
The Choice Between Domestic and Foreign Goods
Real Exchange Rates: Price of foreign goods in terms ofdomestic goods
Nominal Exchange Rates: The relative prices of currencies
4-48
Openness in Goods Markets
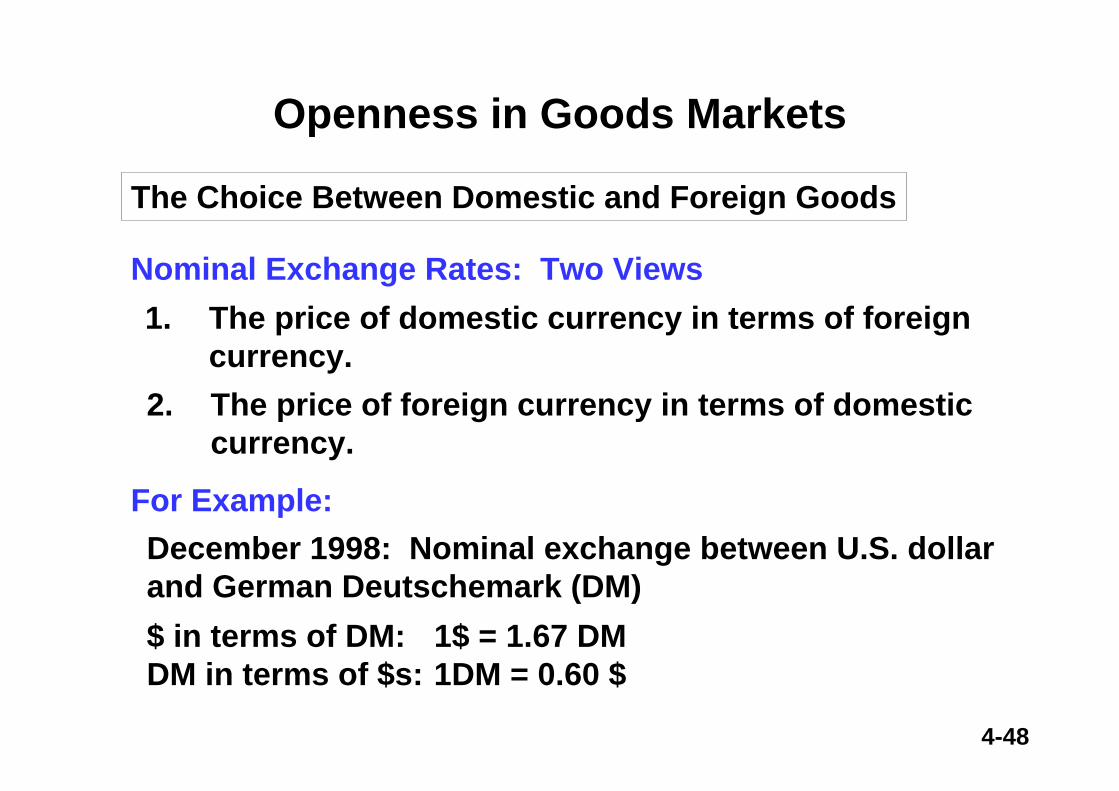
The Choice Between Domestic and Foreign Goods
Nominal Exchange Rates: Two Views1. The price of domestic currency in terms of foreign
currency.2. The price of foreign currency in terms of domestic
currency.
For Example:December 1998: Nominal exchange between U.S. dollarand German Deutschemark (DM)$ in terms of DM: 1$ = 1.67 DMDM in terms of $s: 1DM = 0.60 $
4-49
Openness in Goods Markets
The Choice Between Domestic and Foreign Goods
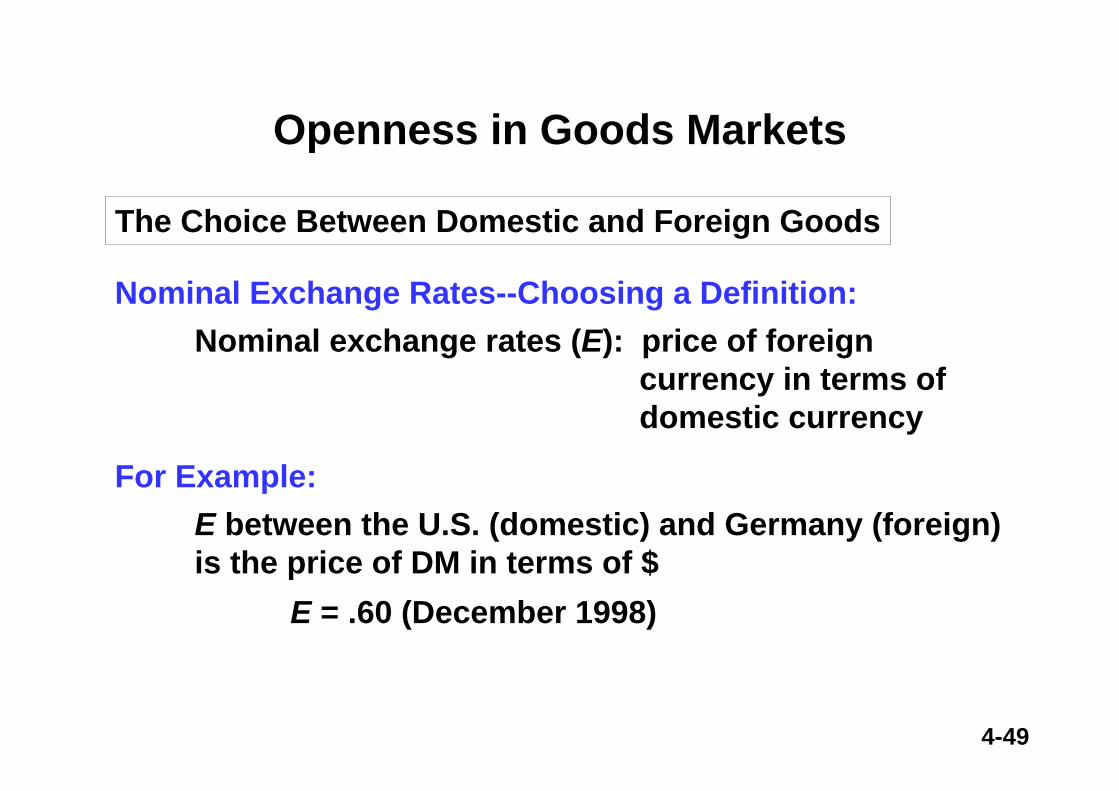
Nominal Exchange Rates--Choosing a Definition:Nominal exchange rates (E): price of foreign
currency in terms ofdomestic currency
For Example:E between the U.S. (domestic) and Germany (foreign)is the price of DM in terms of $
E = .60 (December 1998)
4-50
Openness in Goods Markets
The Choice Between Domestic and Foreign Goods
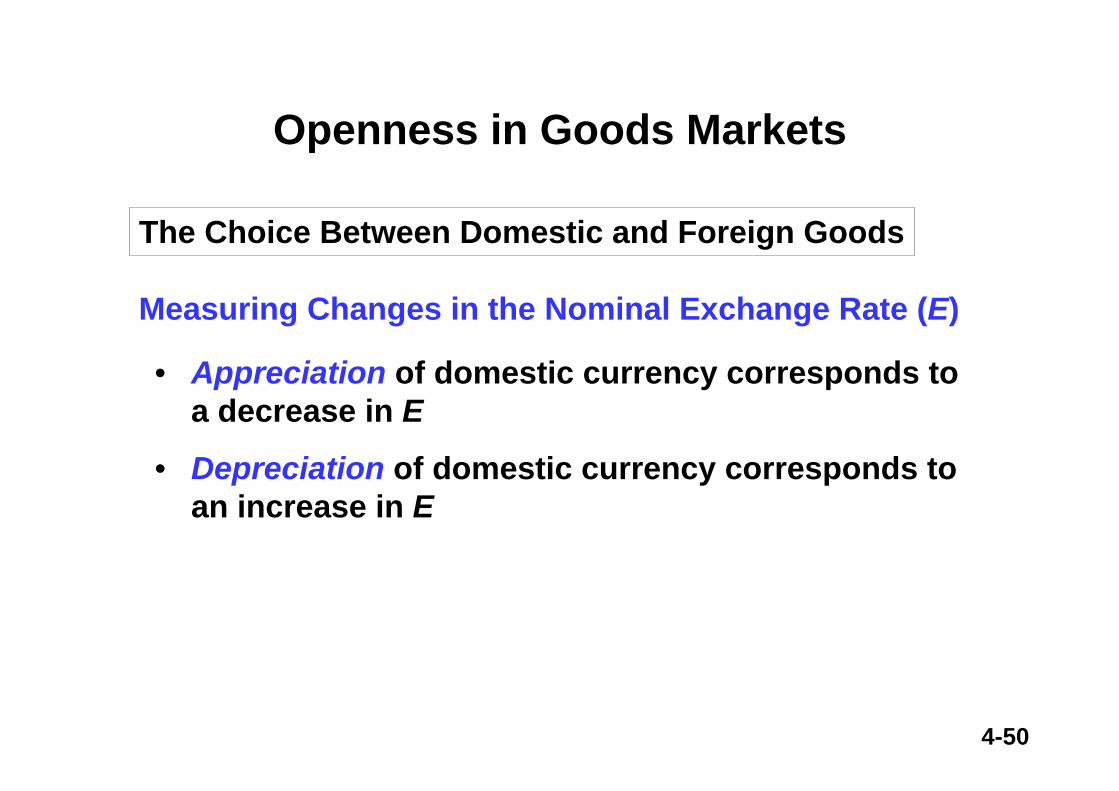
Measuring Changes in the Nominal Exchange Rate (E)
• Appreciation of domestic currency corresponds toa decrease in E
• Depreciation of domestic currency corresponds toan increase in E
4-51
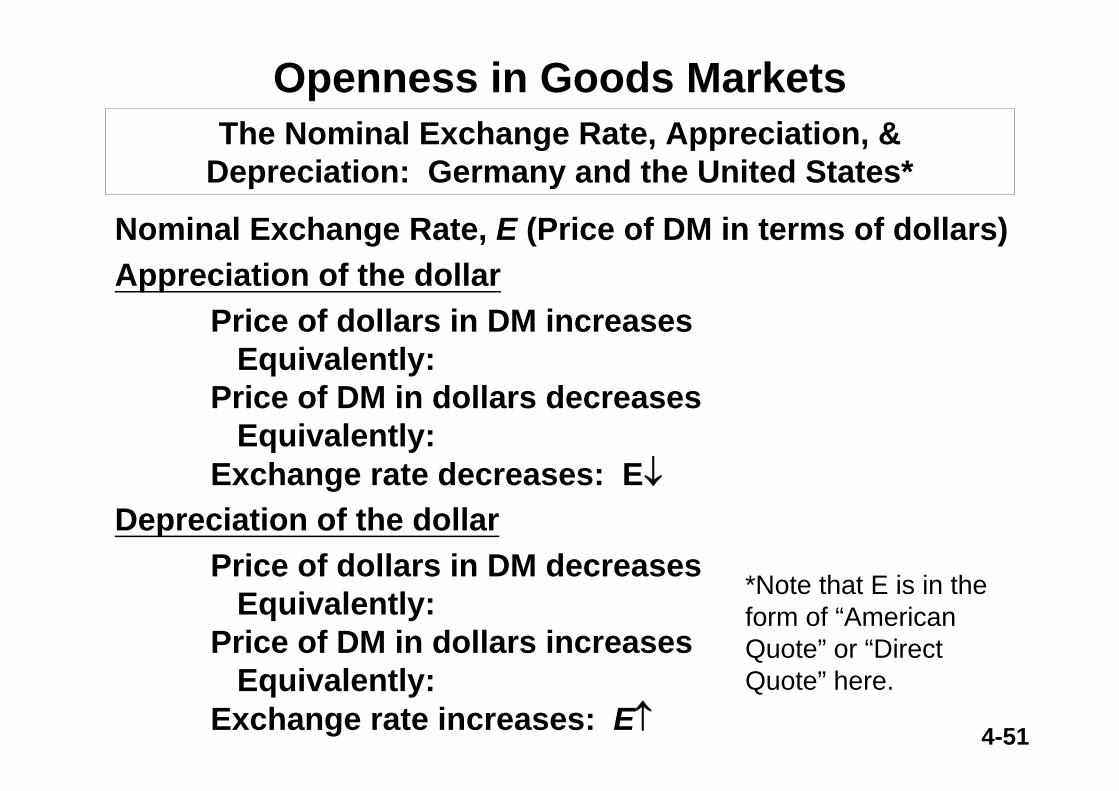
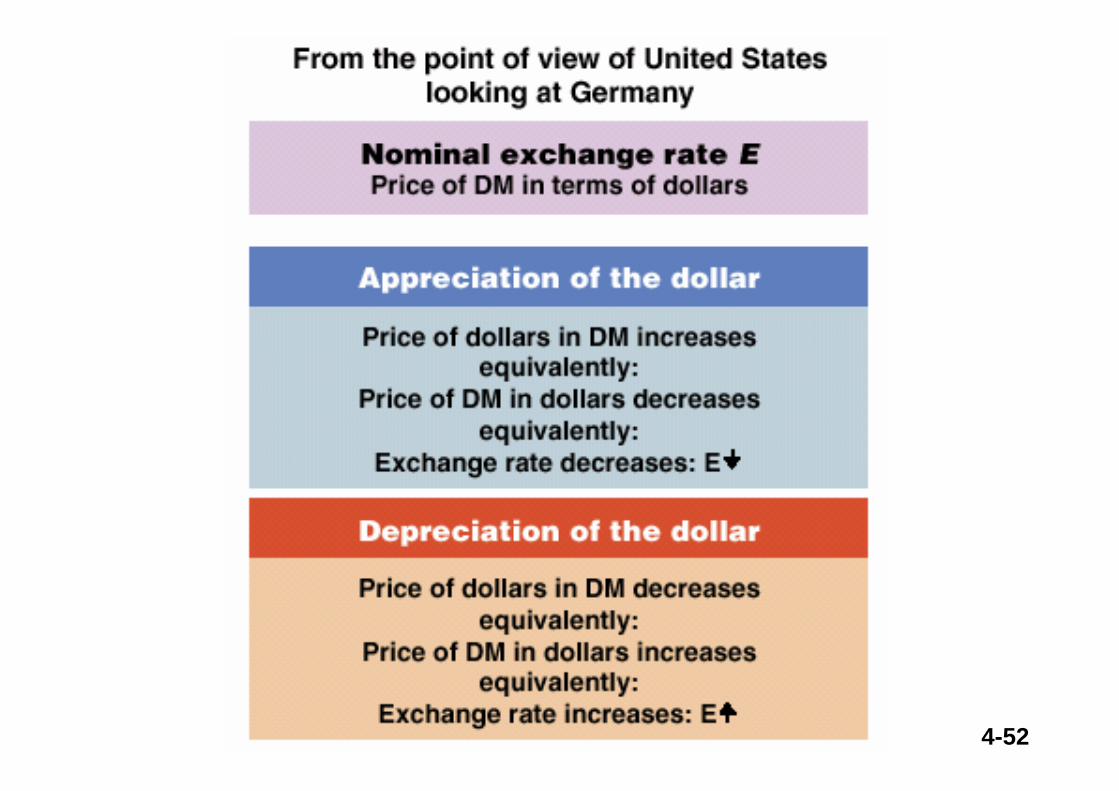
Openness in Goods Markets
Nominal Exchange Rate, E (Price of DM in terms of dollars)Appreciation of the dollar
Price of dollars in DM increasesEquivalently:
Price of DM in dollars decreasesEquivalently:
Exchange rate decreases: E↓Depreciation of the dollar
Price of dollars in DM decreasesEquivalently:
Price of DM in dollars increasesEquivalently:
Exchange rate increases: E↑
The Nominal Exchange Rate, Appreciation, & Depreciation: Germany and the United States*
*Note that E is in the form of “American Quote” or “Direct Quote” here.
4-52
4-53
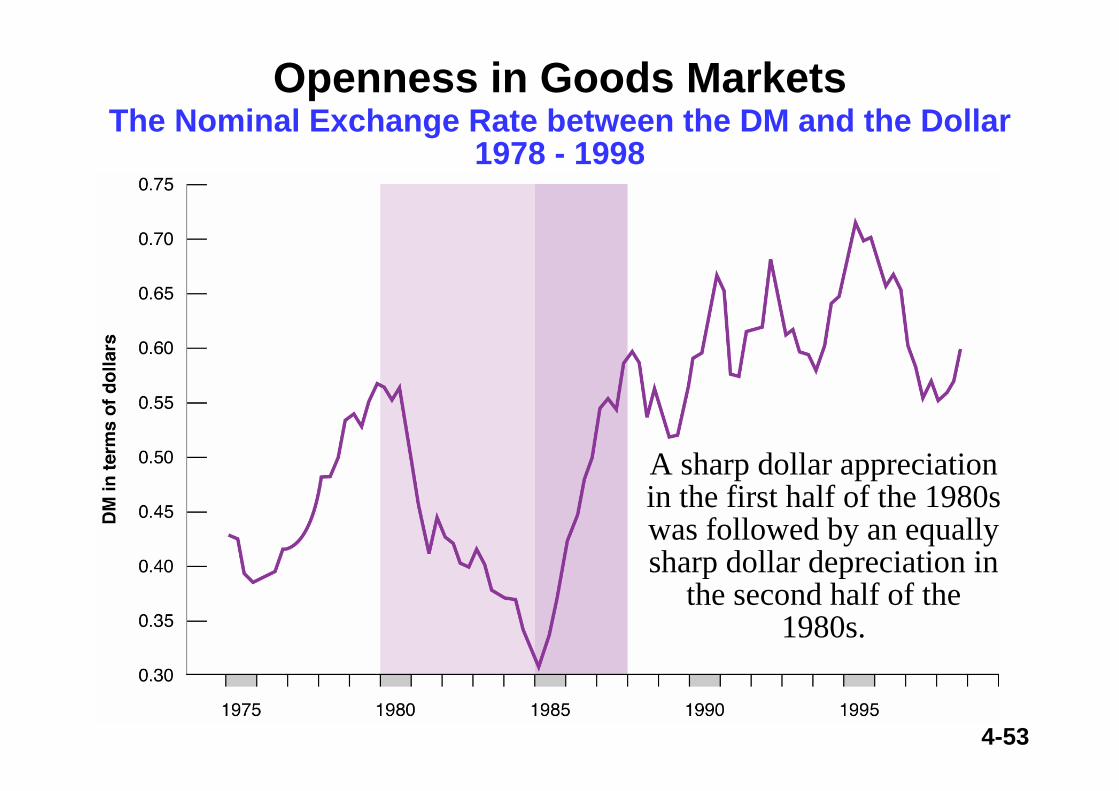
Openness in Goods MarketsThe Nominal Exchange Rate between the DM and the Dollar
1978 - 1998
A sharp dollar appreciation in the first half of the 1980s was followed by an equally sharp dollar depreciation in
the second half of the 1980s.
4-54
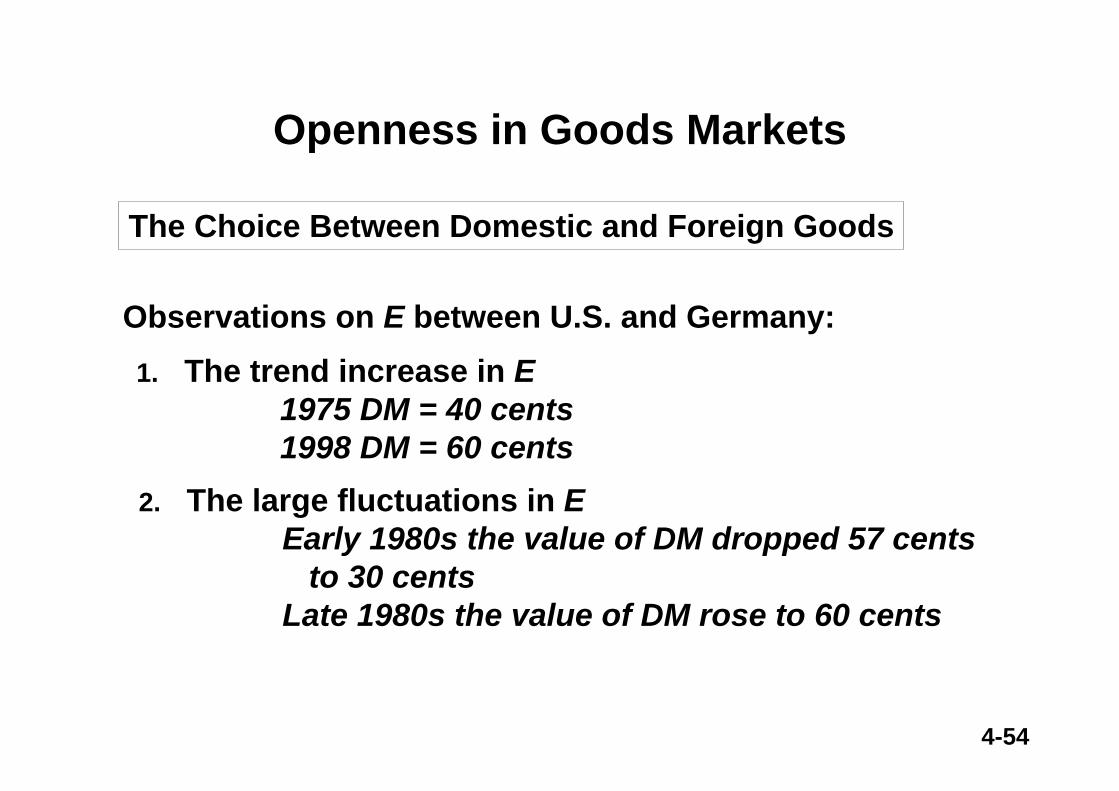
Openness in Goods Markets
The Choice Between Domestic and Foreign Goods
1. The trend increase in E1975 DM = 40 cents1998 DM = 60 cents
Observations on E between U.S. and Germany:
2. The large fluctuations in EEarly 1980s the value of DM dropped 57 cents
to 30 centsLate 1980s the value of DM rose to 60 cents
4-55
Openness in Goods Markets
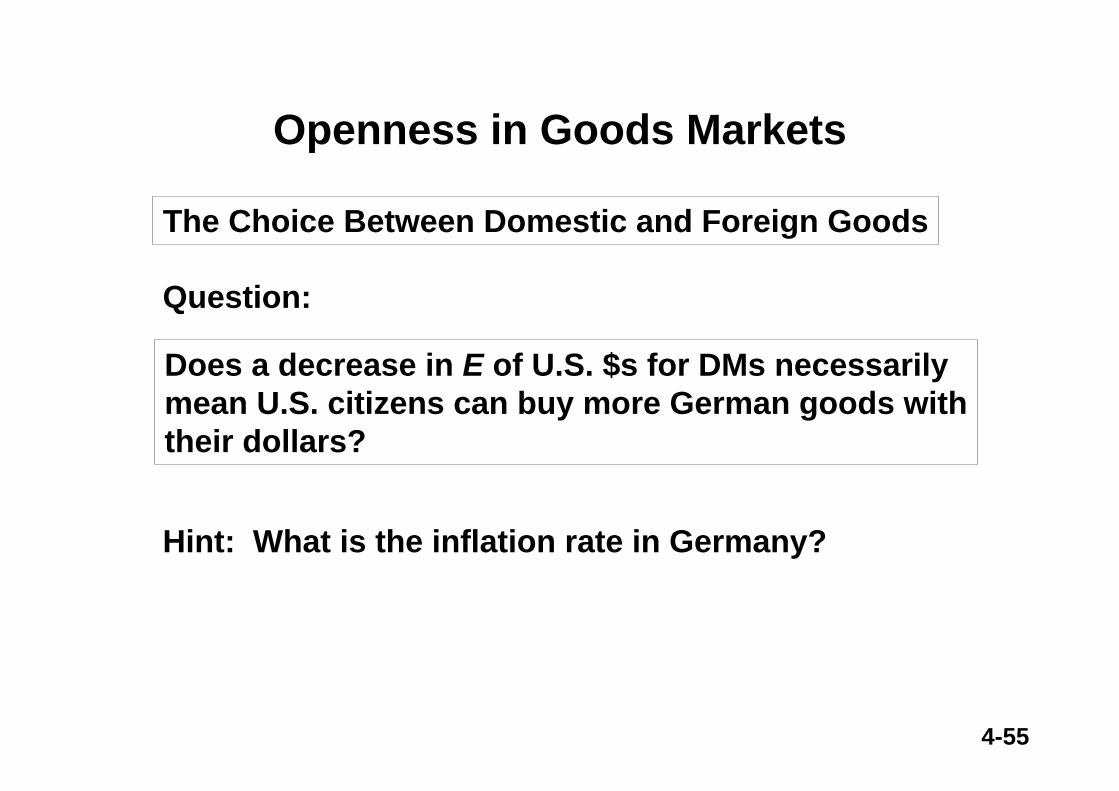
The Choice Between Domestic and Foreign Goods
Question:
Does a decrease in E of U.S. $s for DMs necessarilymean U.S. citizens can buy more German goods withtheir dollars?
Hint: What is the inflation rate in Germany?
4-56
Openness in Goods MarketsThe Choice Between Domestic and Foreign Goods
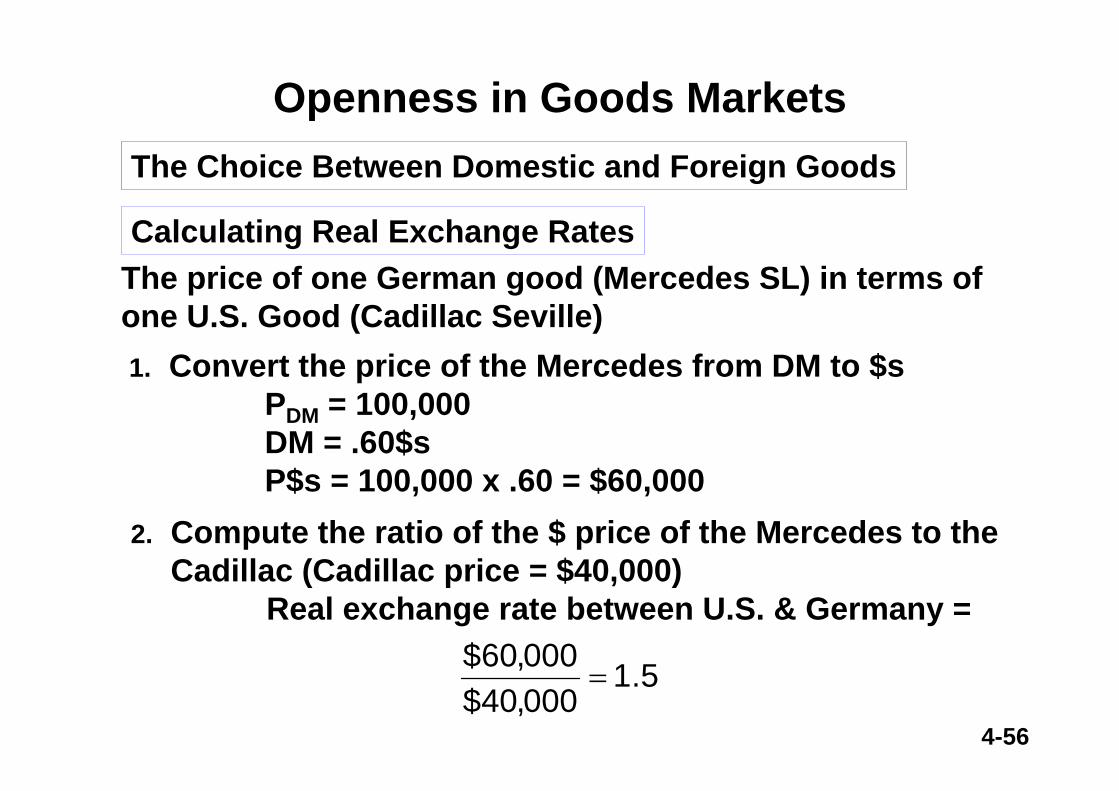
Calculating Real Exchange RatesThe price of one German good (Mercedes SL) in terms of one U.S. Good (Cadillac Seville)1. Convert the price of the Mercedes from DM to $s
PDM = 100,000DM = .60$sP$s = 100,000 x .60 = $60,000
2. Compute the ratio of the $ price of the Mercedes to theCadillac (Cadillac price = $40,000)
Real exchange rate between U.S. & Germany =
5.1000,40$000,60$
=
4-57
Openness in Goods MarketsThe Choice Between Domestic and Foreign Goods
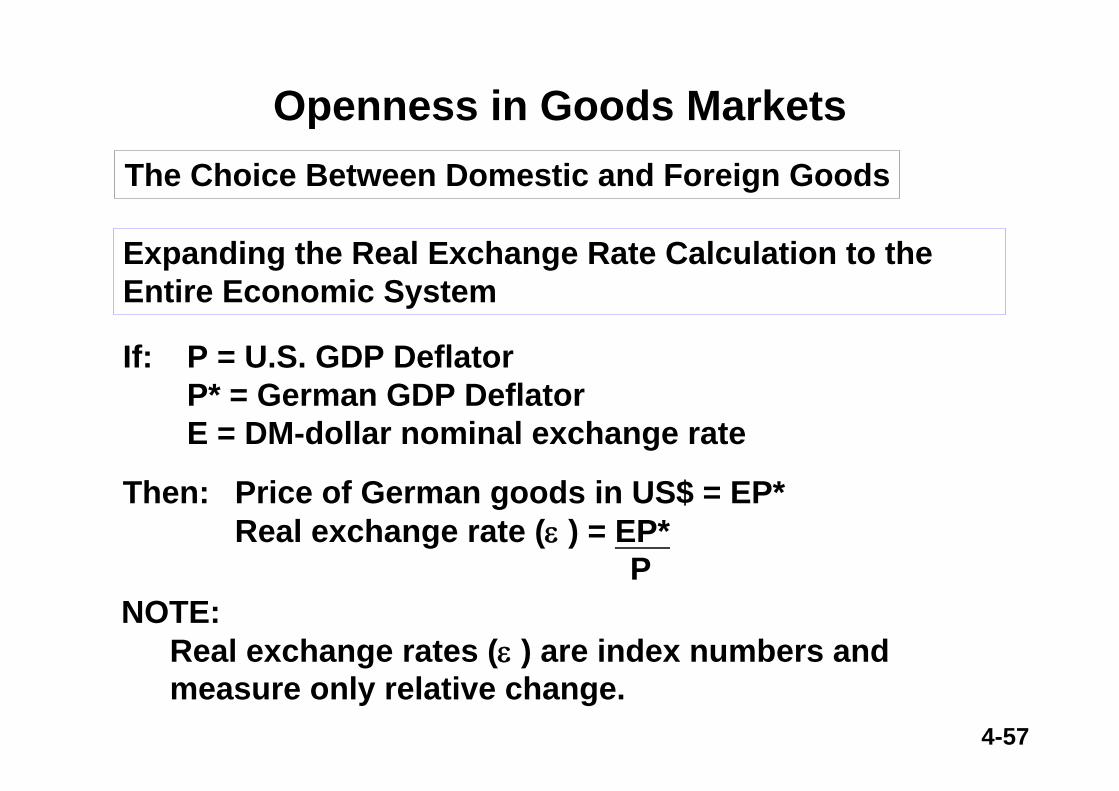
Expanding the Real Exchange Rate Calculation to the Entire Economic System
If: P = U.S. GDP DeflatorP* = German GDP DeflatorE = DM-dollar nominal exchange rate
Then: Price of German goods in US$ = EP*Real exchange rate (ε ) = EP*
PNOTE:
Real exchange rates (ε ) are index numbers and measure only relative change.
4-58
Openness in Goods Markets
The Choice Between Domestic and Foreign Goods
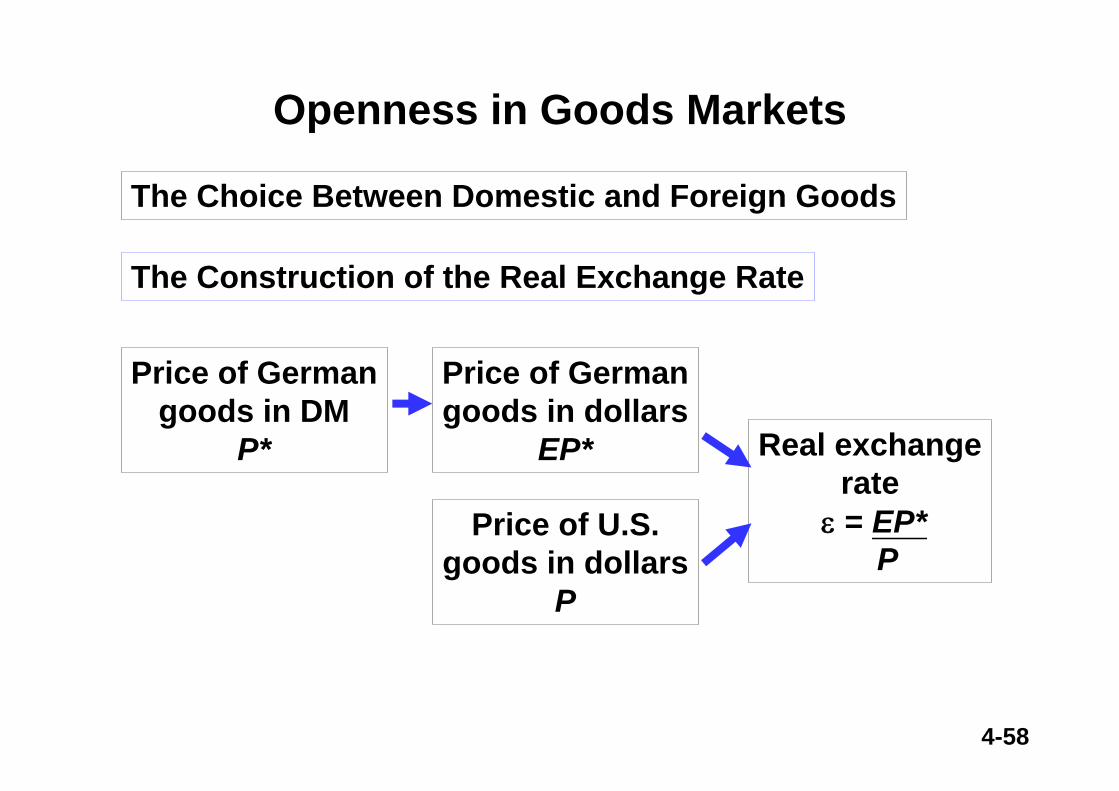
The Construction of the Real Exchange Rate
Price of Germangoods in DM
P*
Price of Germangoods in dollars
EP*
Price of U.S.goods in dollars
P
Real exchangerate
ε = EP*P
4-59
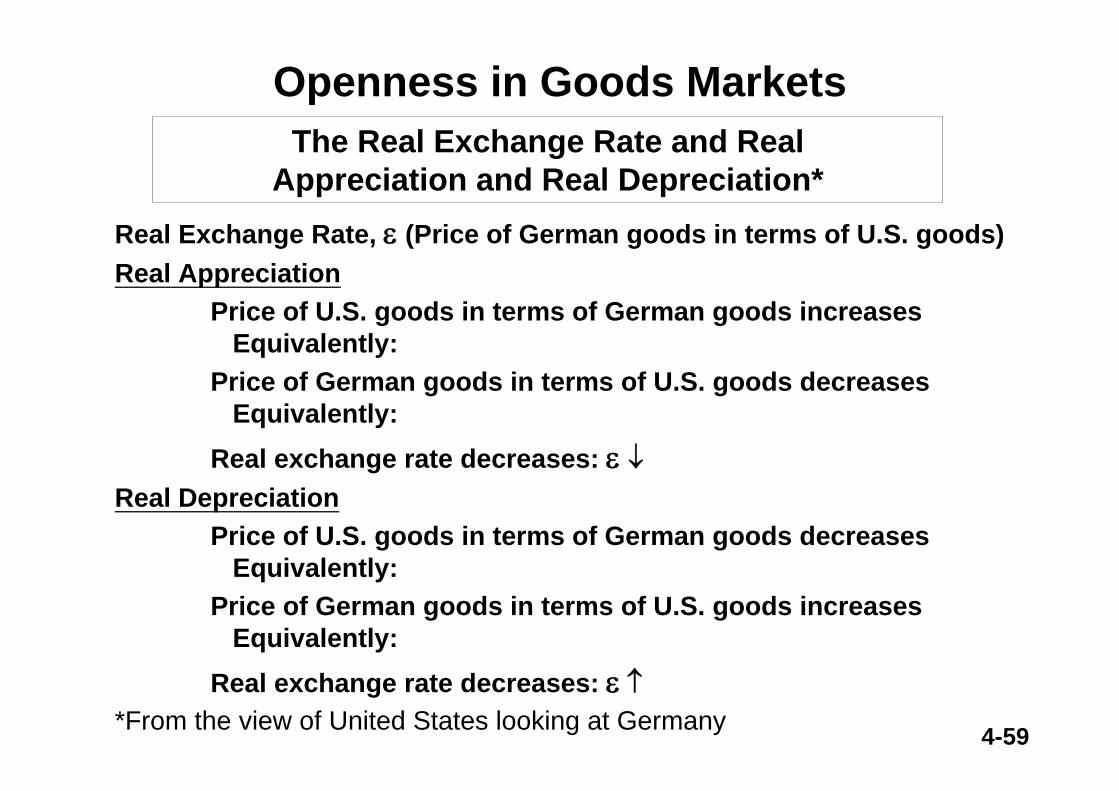
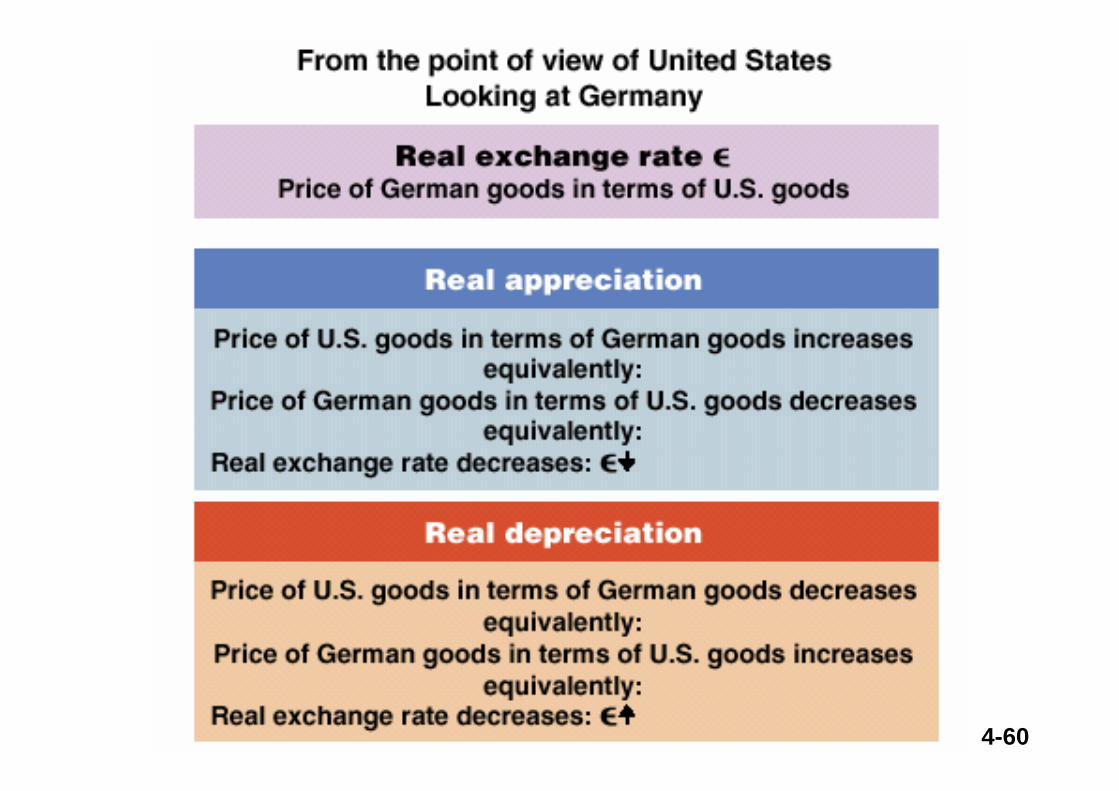
Openness in Goods Markets
Real Exchange Rate, ε (Price of German goods in terms of U.S. goods)Real Appreciation
Price of U.S. goods in terms of German goods increasesEquivalently:
Price of German goods in terms of U.S. goods decreasesEquivalently:
Real exchange rate decreases: ε ↓Real Depreciation
Price of U.S. goods in terms of German goods decreasesEquivalently:
Price of German goods in terms of U.S. goods increasesEquivalently:
Real exchange rate decreases: ε ↑
The Real Exchange Rate and RealAppreciation and Real Depreciation*
*From the view of United States looking at Germany
4-60
4-61
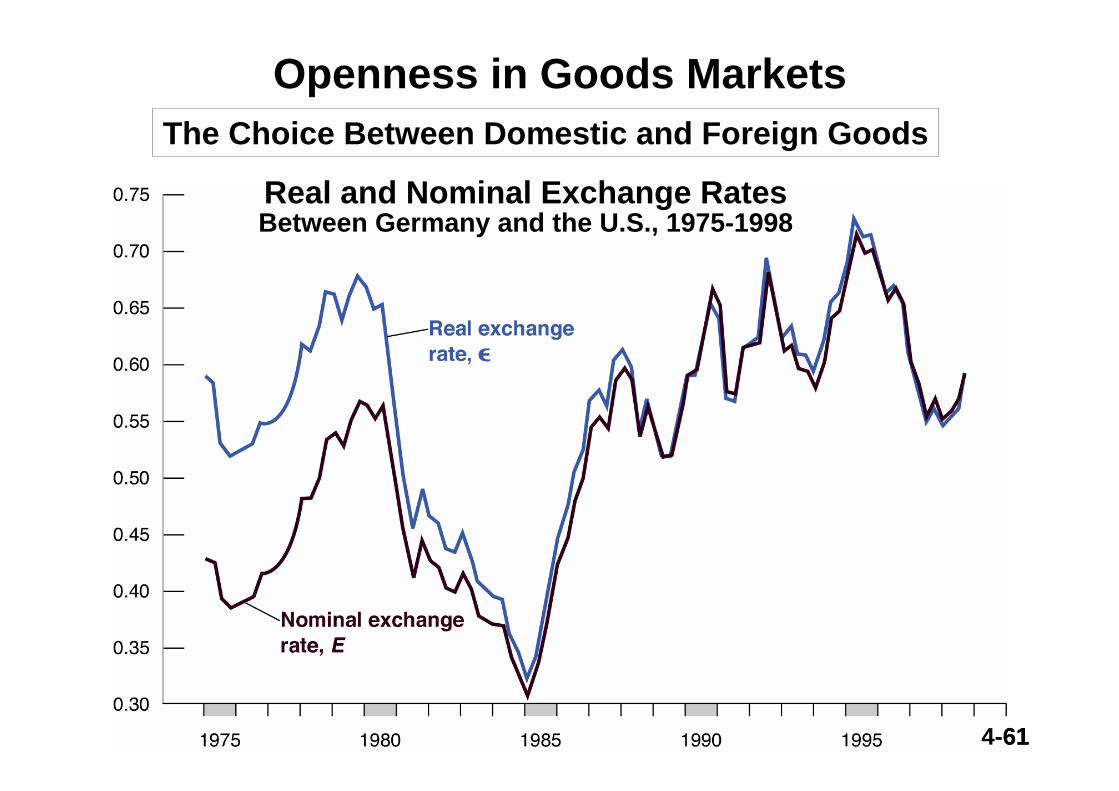
Openness in Goods MarketsThe Choice Between Domestic and Foreign Goods
Real and Nominal Exchange RatesBetween Germany and the U.S., 1975-1998
4-61
4-62
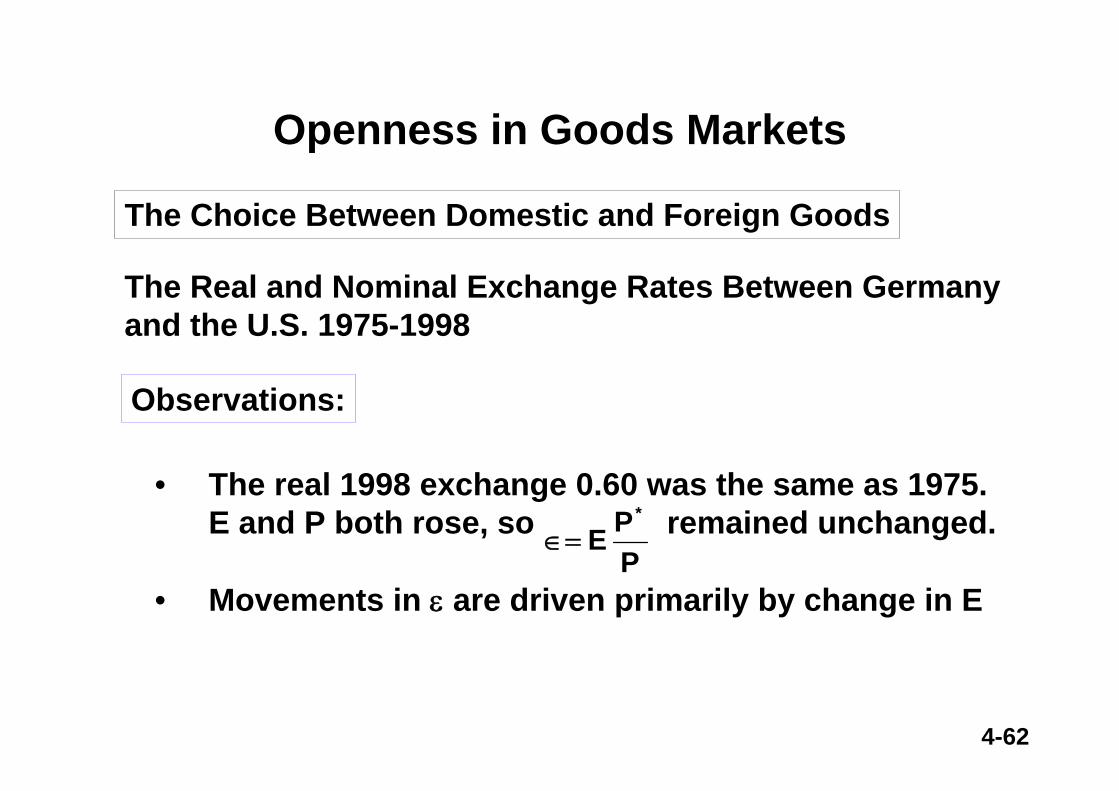
Openness in Goods Markets
The Choice Between Domestic and Foreign Goods
The Real and Nominal Exchange Rates Between Germanyand the U.S. 1975-1998
Observations:
• The real 1998 exchange 0.60 was the same as 1975. E and P both rose, so remained unchanged.
• Movements in ε are driven primarily by change in EPP E
*
∈=
4-63
Openness in Goods MarketsThe Choice Between Domestic and Foreign Goods
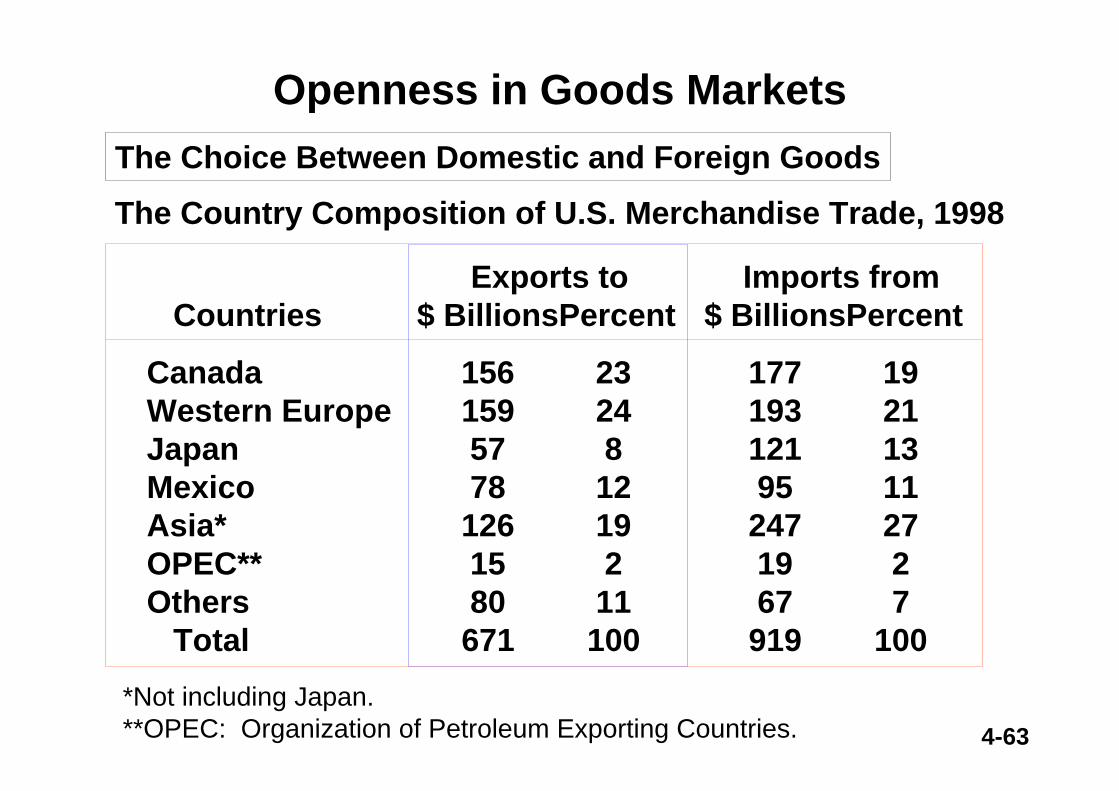
The Country Composition of U.S. Merchandise Trade, 1998
Exports to Imports fromCountries $ BillionsPercent $ BillionsPercent
Canada 156 23 177 19Western Europe 159 24 193 21Japan 57 8 121 13Mexico 78 12 95 11Asia* 126 19 247 27OPEC** 15 2 19 2Others 80 11 67 7
Total 671 100 919 100*Not including Japan.**OPEC: Organization of Petroleum Exporting Countries.
4-64
Openness in Goods Markets
The Choice Between Domestic and Foreign Goods
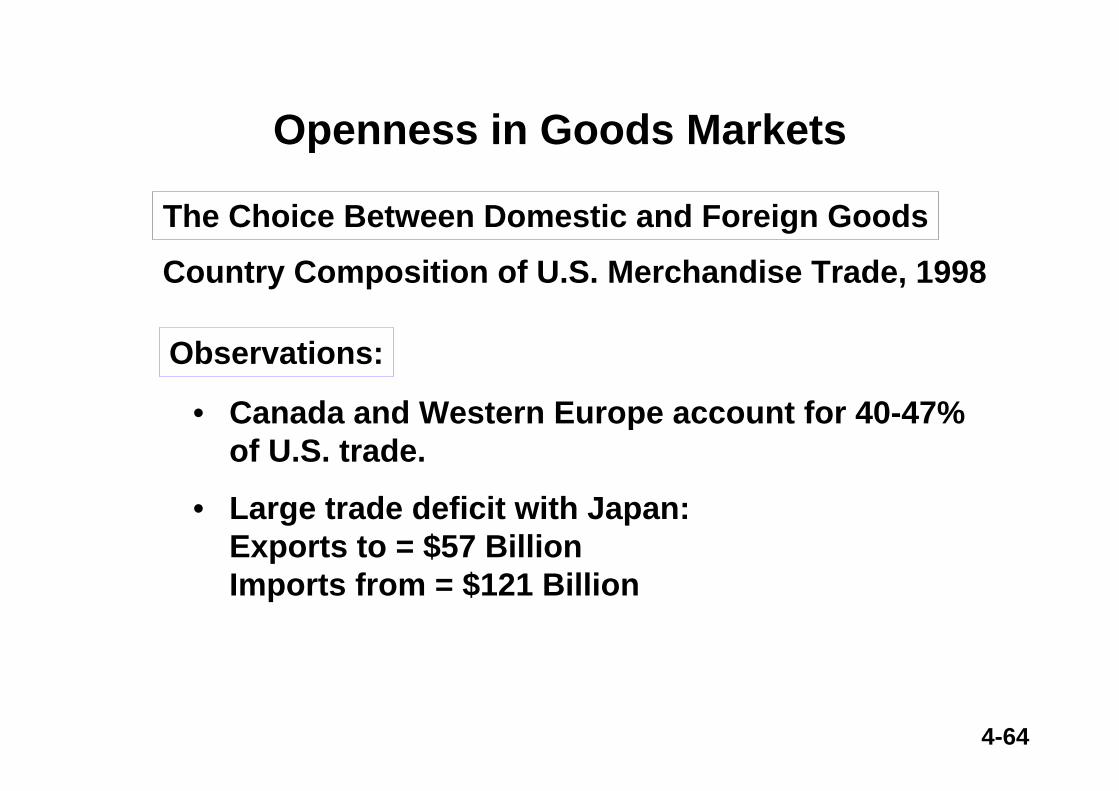
Country Composition of U.S. Merchandise Trade, 1998
Observations:
• Canada and Western Europe account for 40-47% of U.S. trade.
• Large trade deficit with Japan:Exports to = $57 Billion Imports from = $121 Billion
4-65
Openness in Goods Markets
The Choice Between Domestic and Foreign Goods
Real Multilateral Exchange Rates
• The real exchange rate when considering many countries
• Calculate by using each country’s share of trade as the weight for that country
4-66
Openness in Goods MarketsThe Choice Between Domestic and Foreign Goods
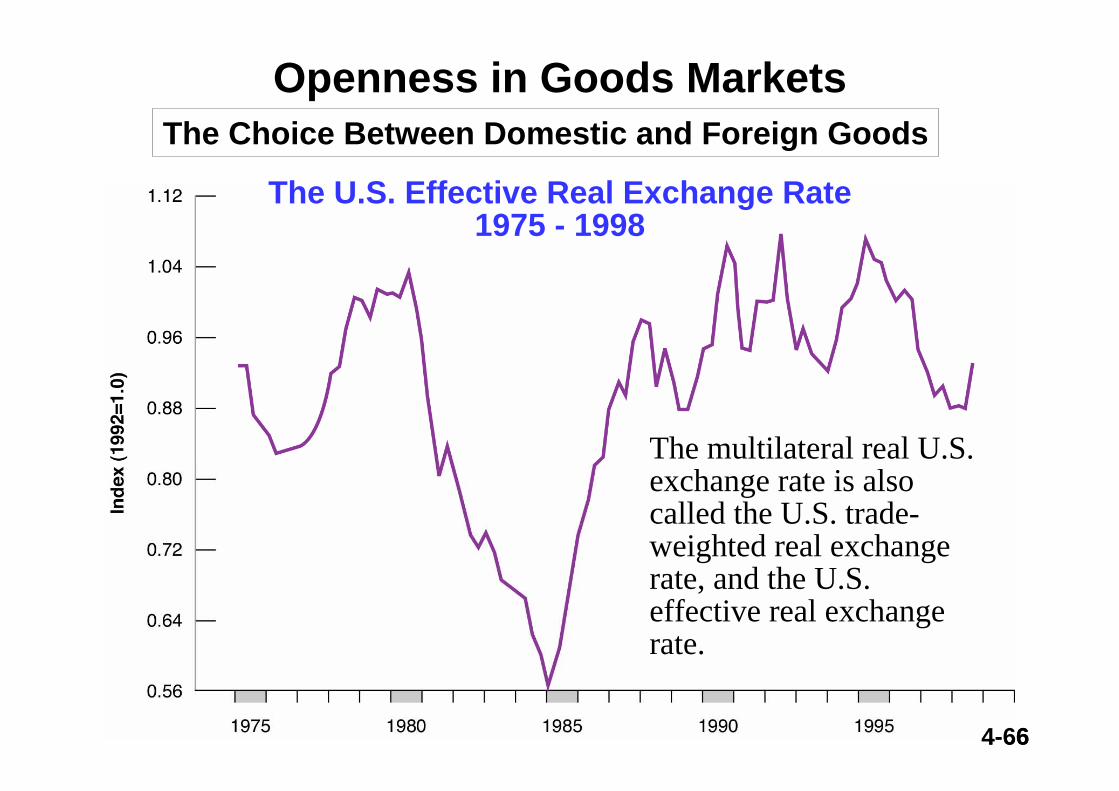
The U.S. Effective Real Exchange Rate1975 - 1998
The multilateral real U.S. exchange rate is also called the U.S. trade-weighted real exchange rate, and the U.S. effective real exchange rate.
4-66
4-67
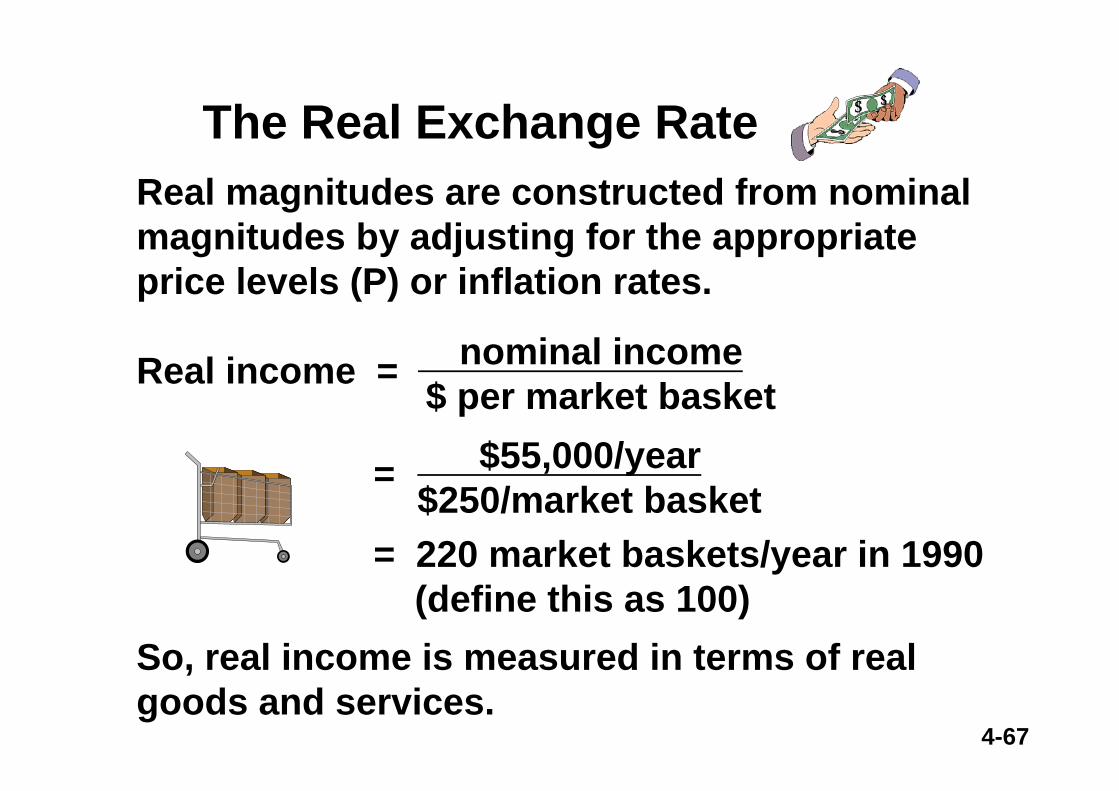
Real magnitudes are constructed from nominal magnitudes by adjusting for the appropriate price levels (P) or inflation rates.
Real income =
=
= 220 market baskets/year in 1990(define this as 100)
So, real income is measured in terms of real goods and services.
nominal income $ per market basket
$55,000/year $250/market basket
The Real Exchange Rate
4-68
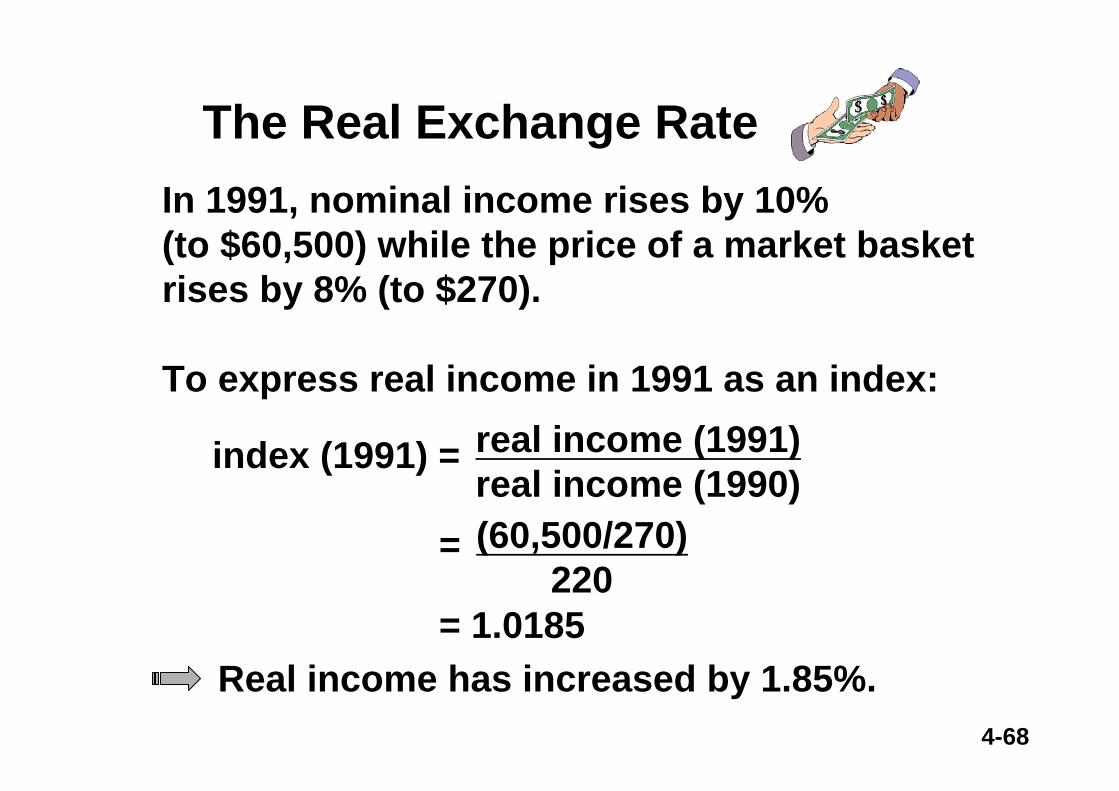
In 1991, nominal income rises by 10% (to $60,500) while the price of a market basket rises by 8% (to $270).
To express real income in 1991 as an index:
index (1991) =
=
= 1.0185
real income (1991)real income (1990)(60,500/270)
220
Real income has increased by 1.85%.
The Real Exchange Rate
4-69
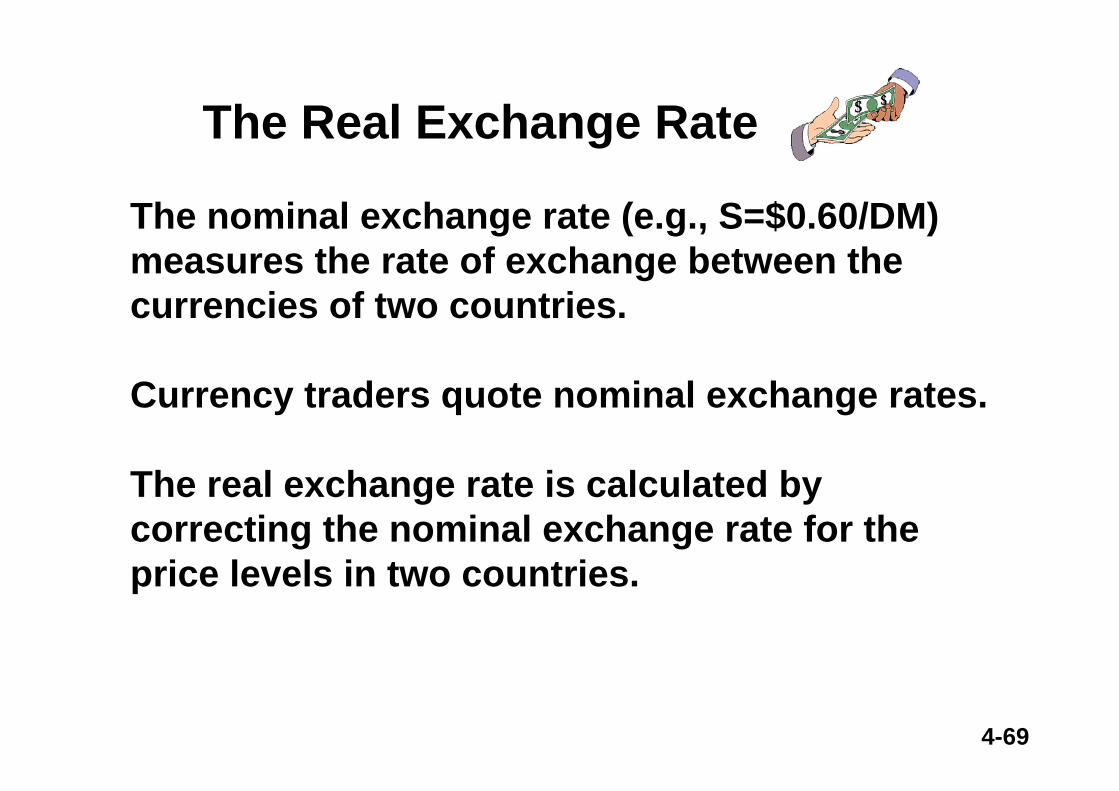
The nominal exchange rate (e.g., S=$0.60/DM) measures the rate of exchange between the currencies of two countries.
Currency traders quote nominal exchange rates.
The real exchange rate is calculated bycorrecting the nominal exchange rate for the price levels in two countries.
The Real Exchange Rate
4-70
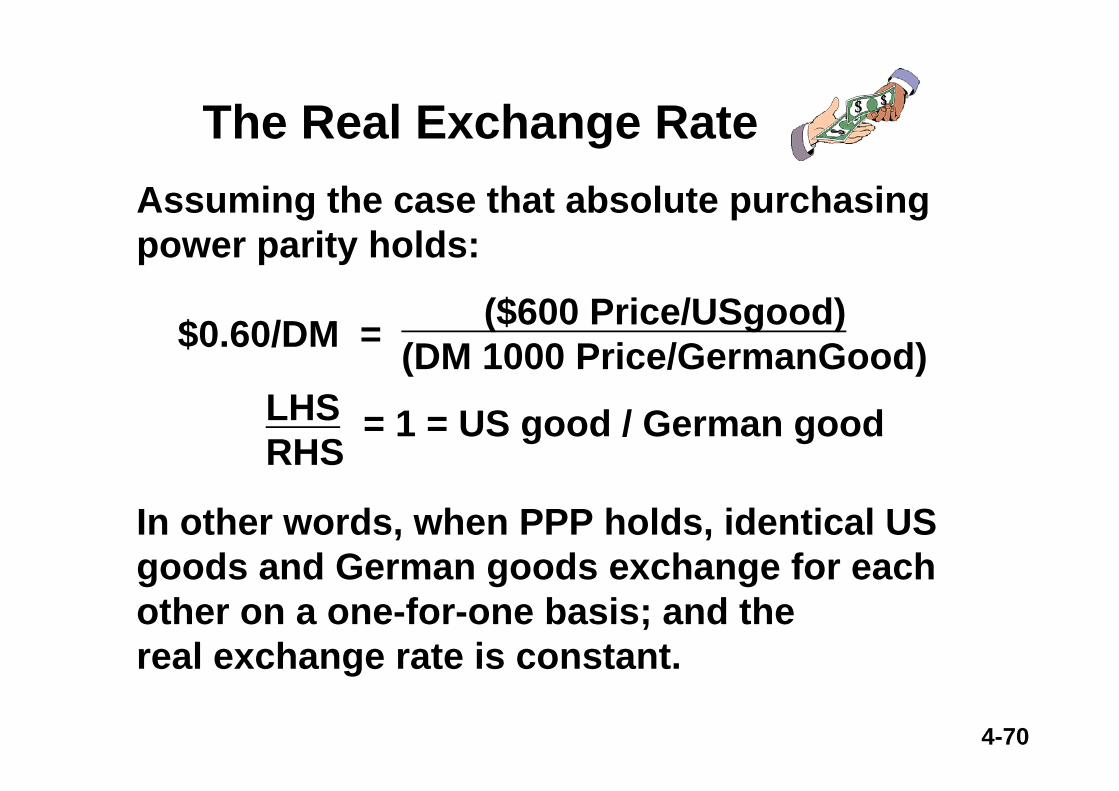
Assuming the case that absolute purchasing power parity holds:
$0.60/DM =
= 1 = US good / German good
In other words, when PPP holds, identical US goods and German goods exchange for each other on a one-for-one basis; and the real exchange rate is constant.
($600 Price/USgood) (DM 1000 Price/GermanGood)
LHSRHS
The Real Exchange Rate
4-71
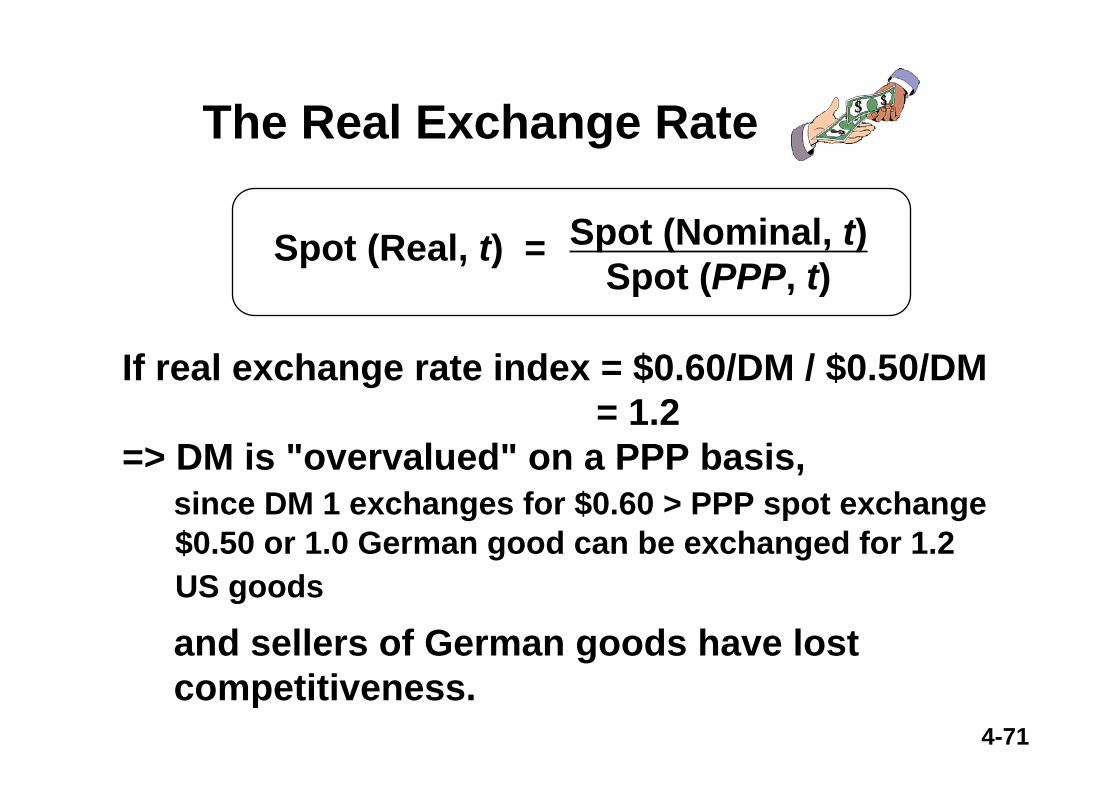
If real exchange rate index = $0.60/DM / $0.50/DM = 1.2
=> DM is "overvalued" on a PPP basis,since DM 1 exchanges for $0.60 > PPP spot exchange $0.50 or 1.0 German good can be exchanged for 1.2 US goods
and sellers of German goods have lost competitiveness.
Spot (Nominal, t)Spot (PPP, t)
Spot (Real, t) =
The Real Exchange Rate
4-72
Evidence: The Law of One Price• One test of the Law of One Price is the Big Mac index,
which has been published annually in The Economistsince 1986. http://www.economist.com/markets/Bigmac/Index.cfm
• The Big Mac index (burgernomics) was devised as a light-hearted guide to whether currencies are at their “correct” level, based on PPP – the notion that a dollar should buy the same amount in all countries.
• Thus in the long run, the exchange rate between two countries should move towards the rate that equalizes the prices of an identical basket of goods and services in each country.
• In other words, a dollar should buy the same amount everywhere.
The Economist
4-73
Evidence: The Law of One Price
¤ Our “basket” is a McDonalds’ Big Mac, which is produced and consumed in 120 countries around the world.
¤ The Big Mac PPP is the exchange rate that would leave hamburgers costing the same in America as abroad.
¤ Comparing actual exchange rates with PPPssignals whether a currency is under- or over-valued.
The Economist
4-74
Evidence: The Law of One Price
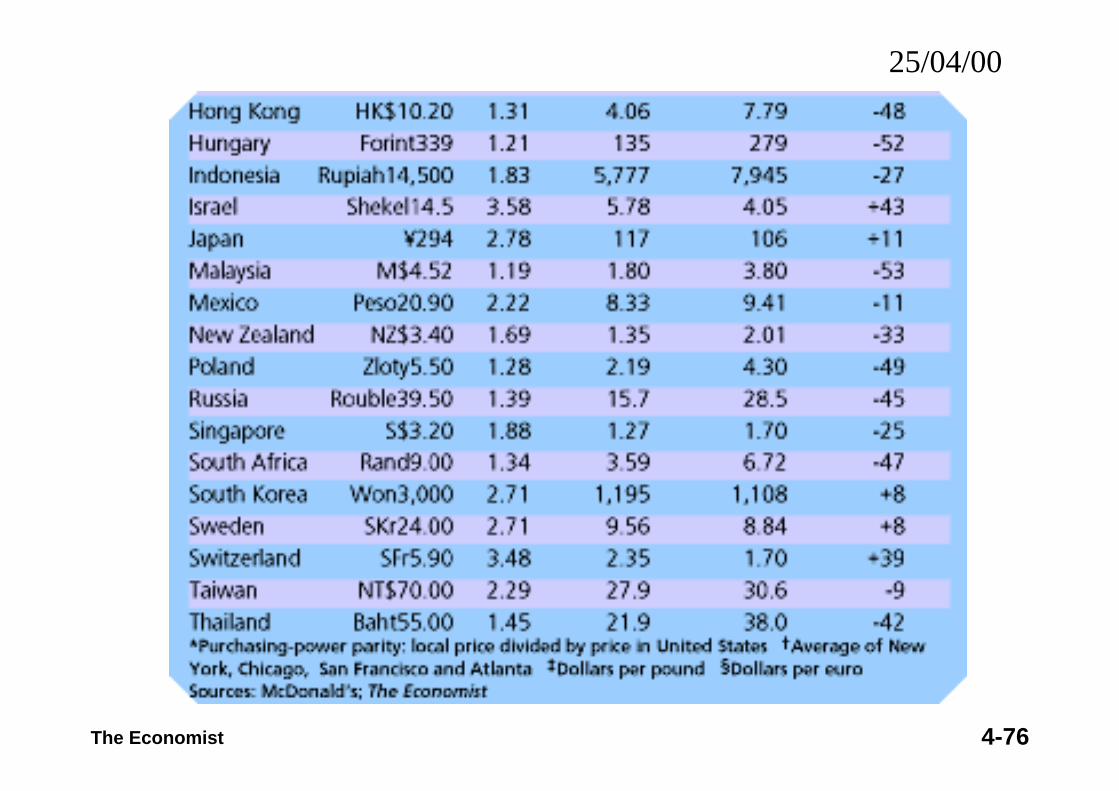
• The result of the 2000 survey suggested that the average price of a Big Mac in the U.S. was $2.51, but was as little as $1.19 in Malaysia, and as much as $3.58 in Israel.
• Hence the Israeli shekel is the most overvalued currency (by 43%), while the Malaysian ringgit is the most undervalued (by 53%).
The Economist
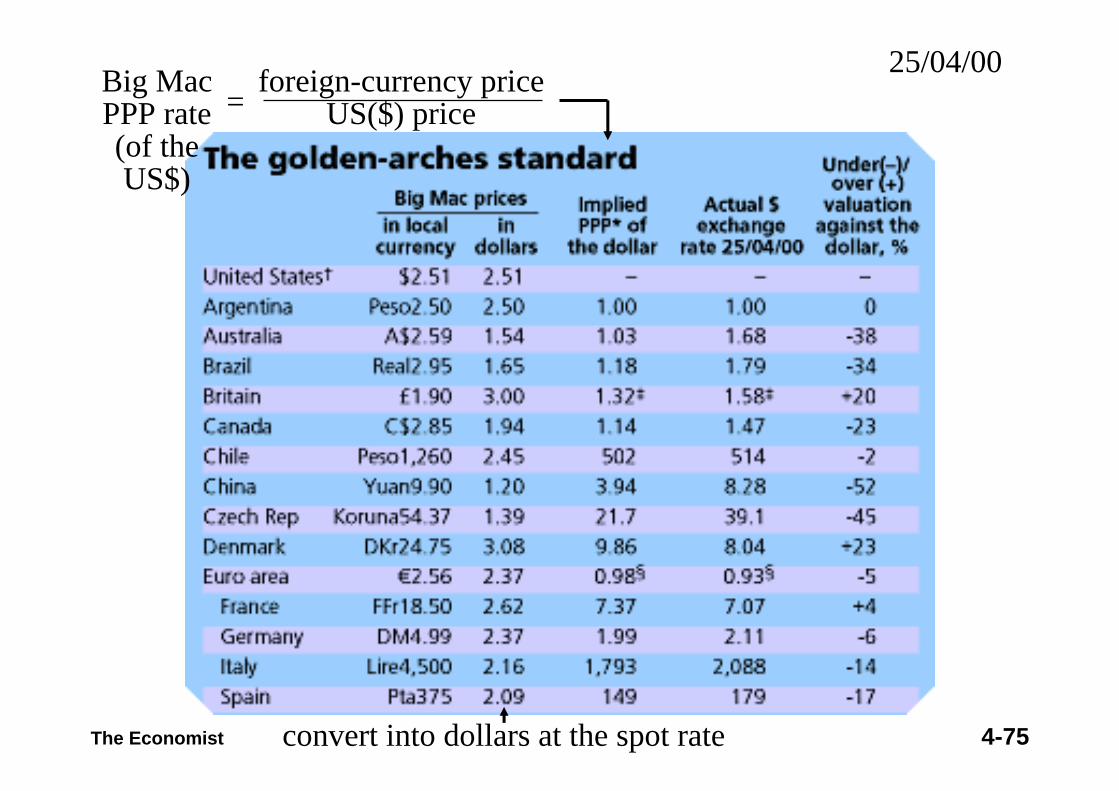
4-75The Economist convert into dollars at the spot rate
Big MacPPP rate(of the US$)
foreign-currency priceUS($) price=
25/04/00
4-76The Economist
25/04/00
4-77
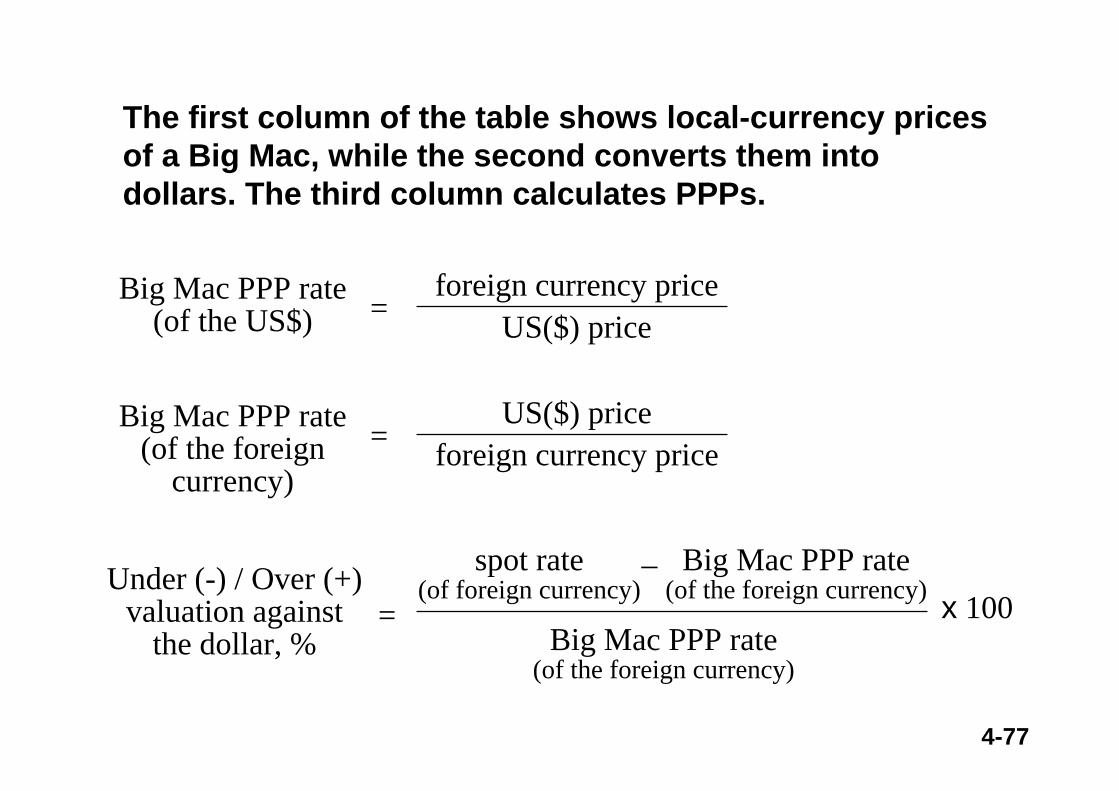
Big Mac PPP rate (of the foreign
currency)
US($) priceforeign currency price=
Big Mac PPP rate(of the foreign currency)
x 100spot rate
(of foreign currency)Big Mac PPP rate
(of the foreign currency)–Under (-) / Over (+)
valuation againstthe dollar, %
=
Big Mac PPP rate (of the US$)
foreign currency priceUS($) price=
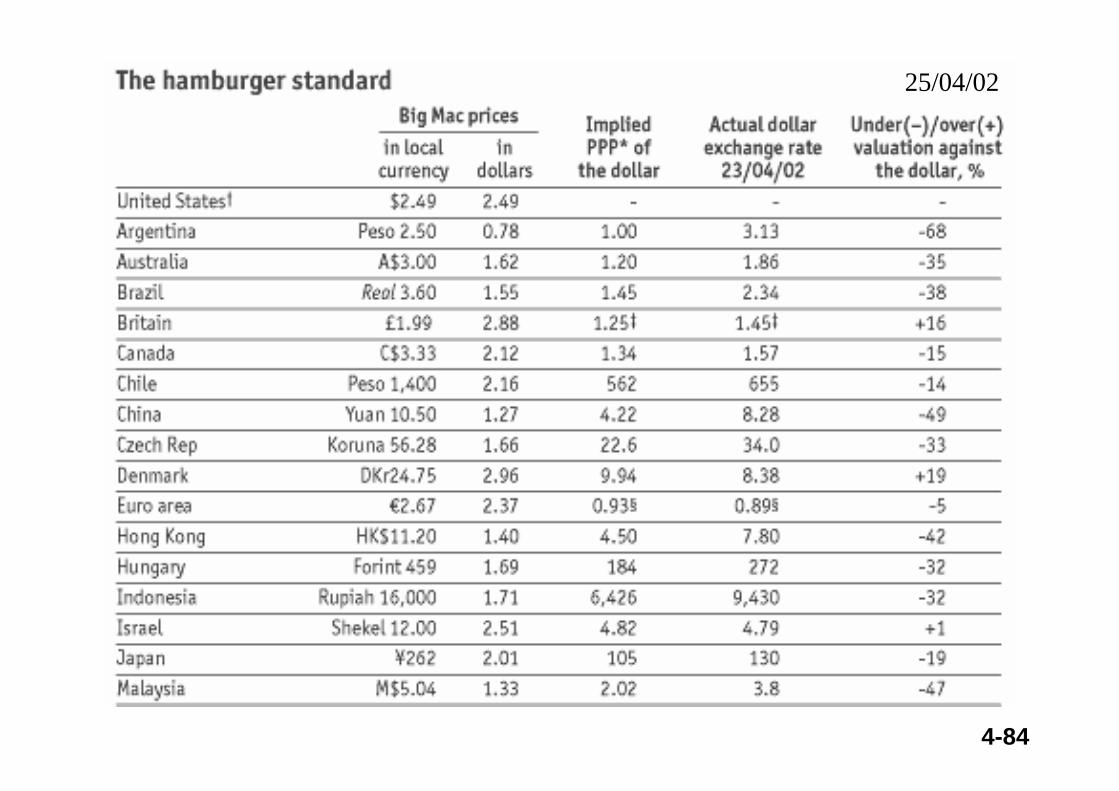
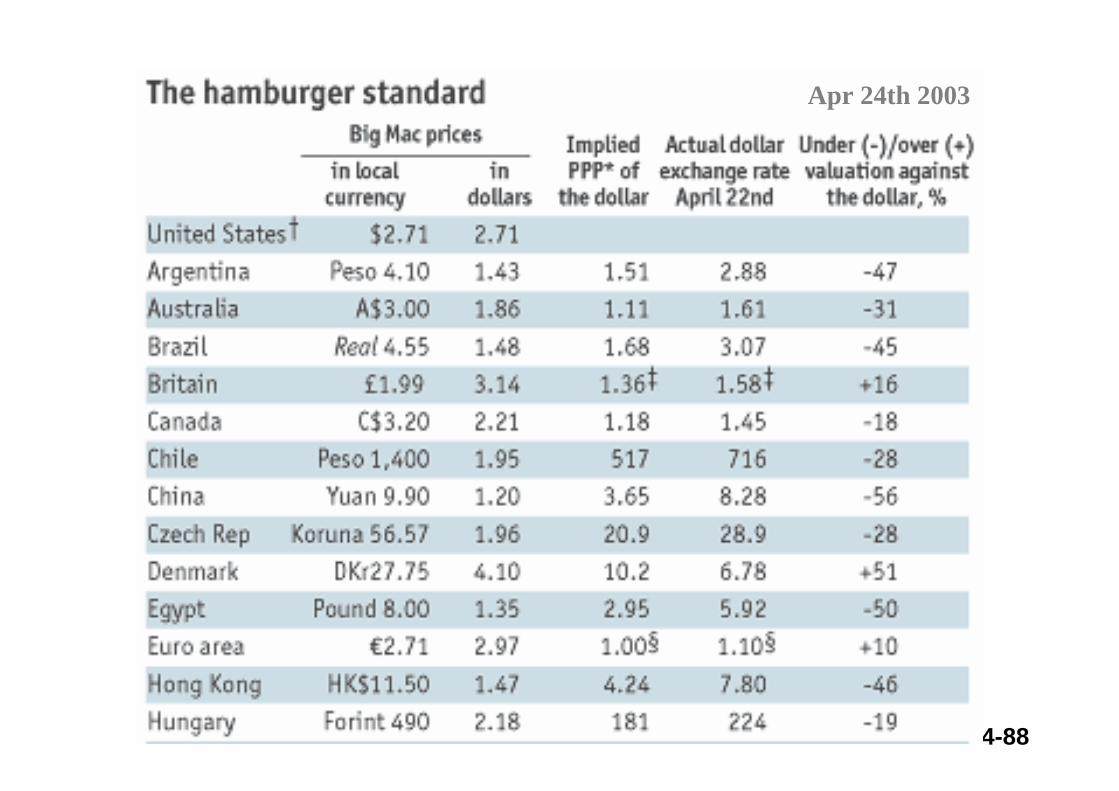
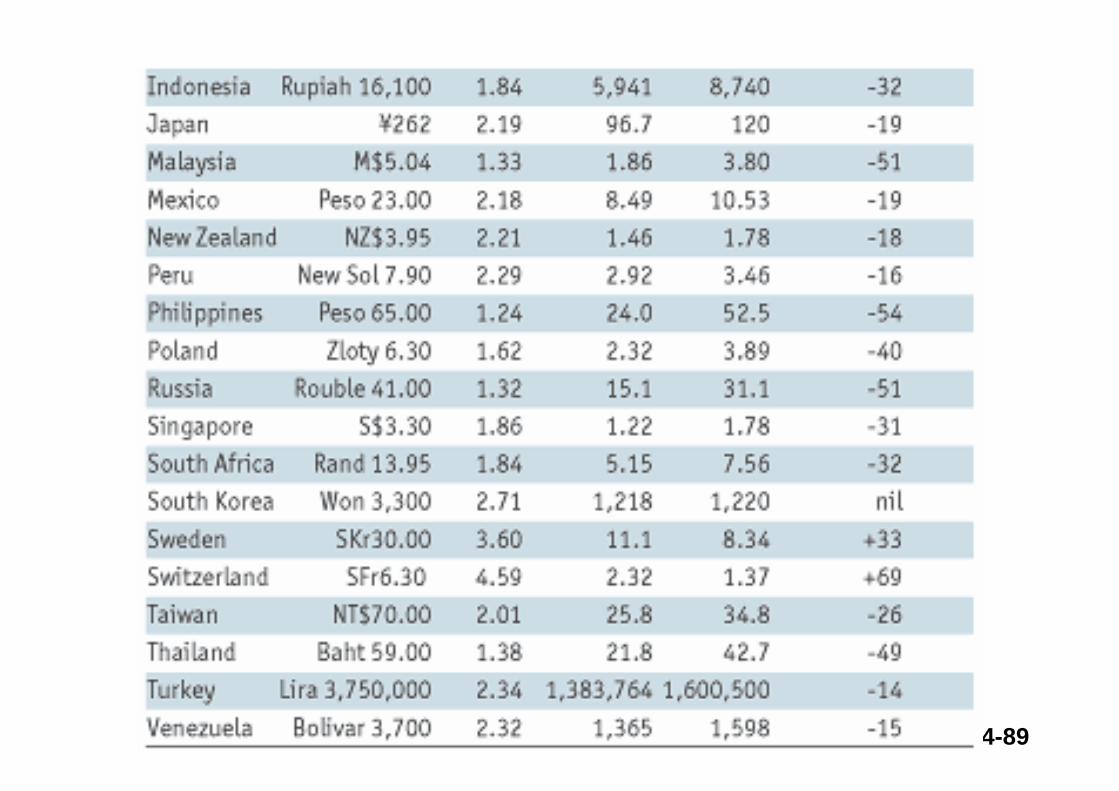
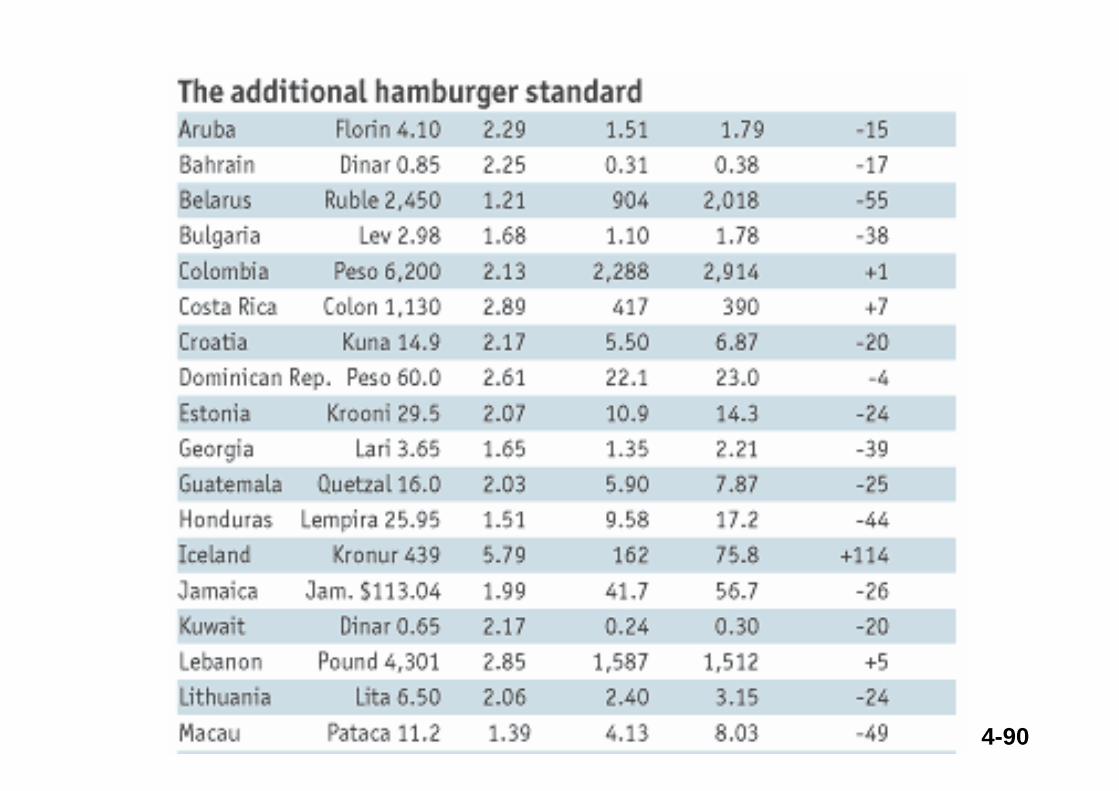
The first column of the table shows local-currency prices of a Big Mac, while the second converts them into dollars. The third column calculates PPPs.
4-78
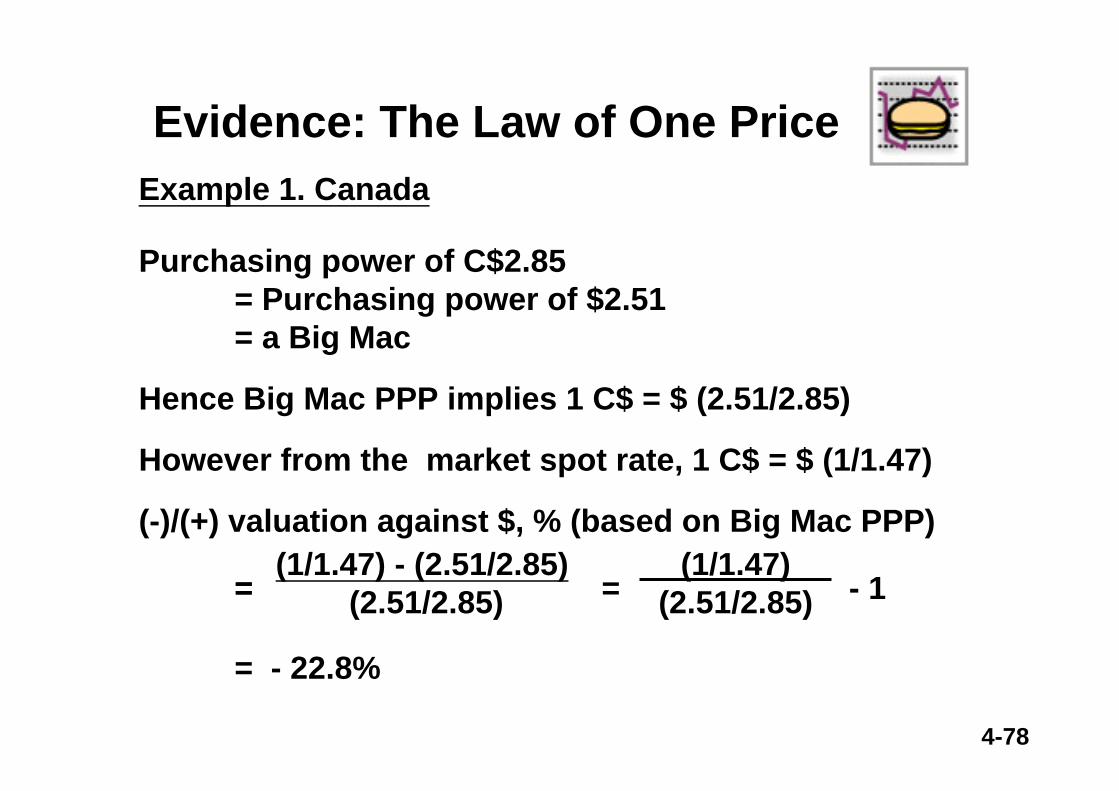
Example 1. Canada
Purchasing power of C$2.85 = Purchasing power of $2.51= a Big Mac
Hence Big Mac PPP implies 1 C$ = $ (2.51/2.85)
However from the market spot rate, 1 C$ = $ (1/1.47)
(-)/(+) valuation against $, % (based on Big Mac PPP)(1/1.47) - (2.51/2.85)
(2.51/2.85)=
= - 22.8%
Evidence: The Law of One Price
=(1/1.47)
(2.51/2.85)= - 1
4-79
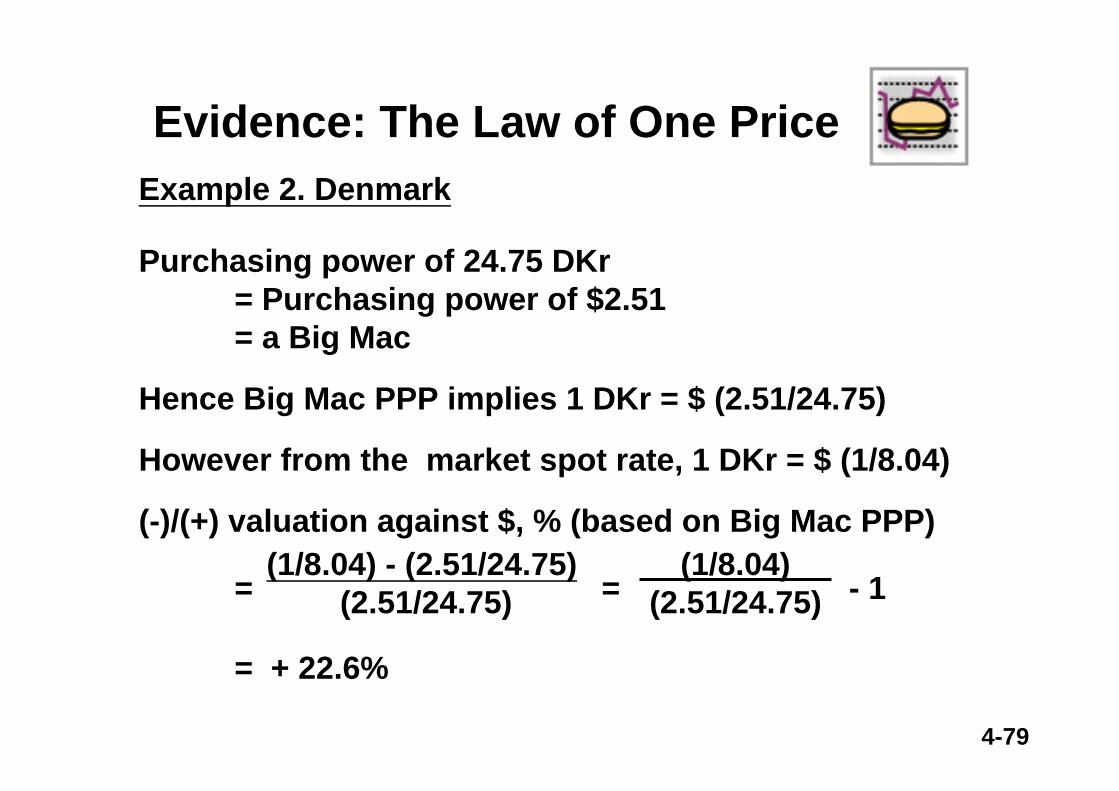
Example 2. Denmark
Purchasing power of 24.75 DKr = Purchasing power of $2.51= a Big Mac
Hence Big Mac PPP implies 1 DKr = $ (2.51/24.75)
However from the market spot rate, 1 DKr = $ (1/8.04)
(-)/(+) valuation against $, % (based on Big Mac PPP)(1/8.04) - (2.51/24.75)
(2.51/24.75)=
= + 22.6%
Evidence: The Law of One Price
(1/8.04)(2.51/24.75)= - 1
4-80
17/04/01
4-81
17/04/01
4-82
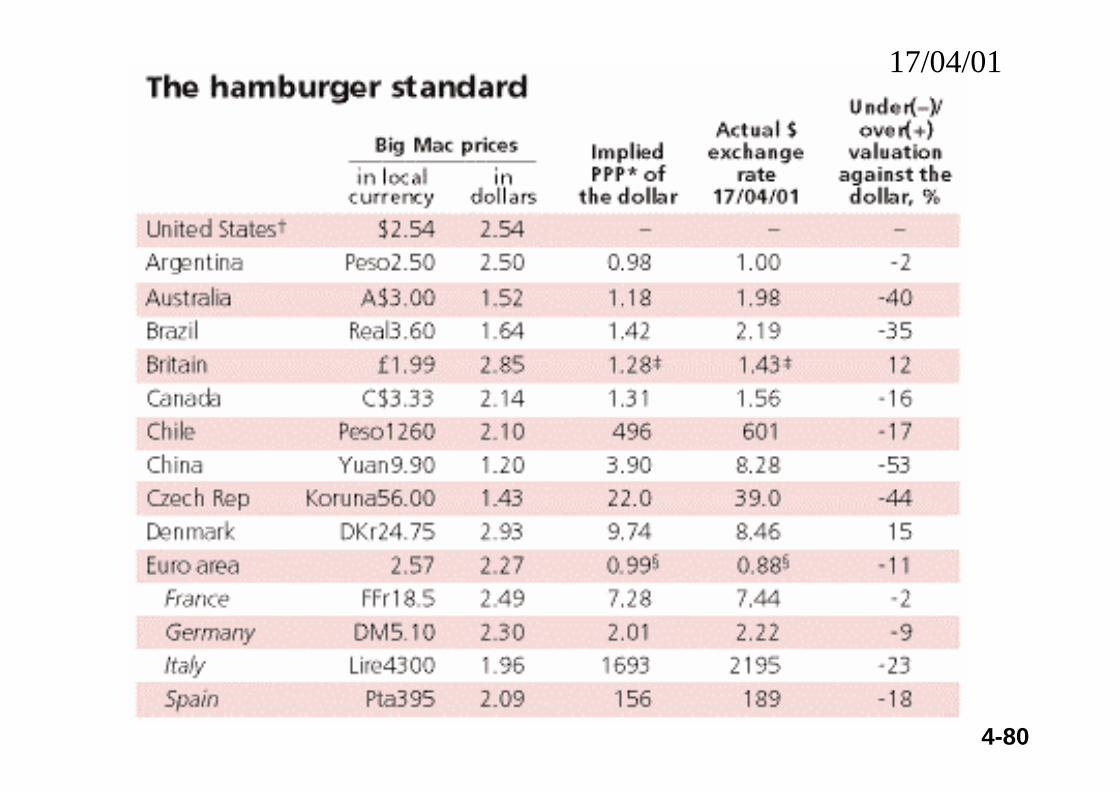
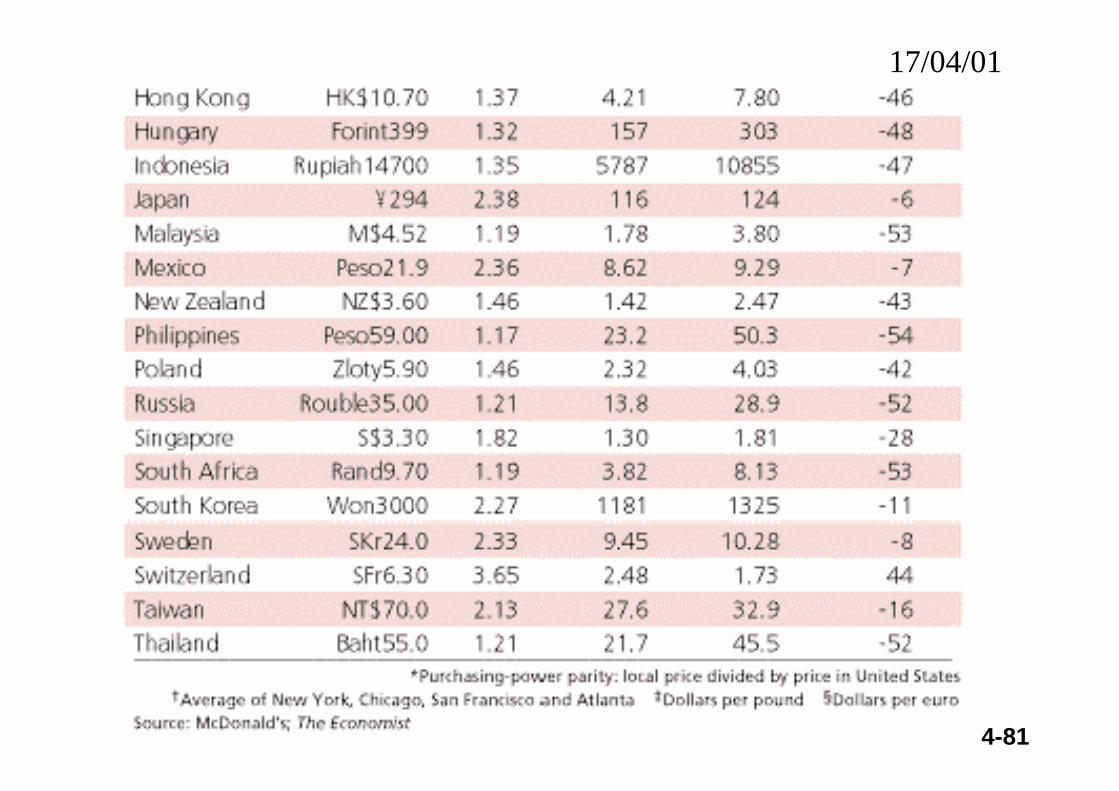
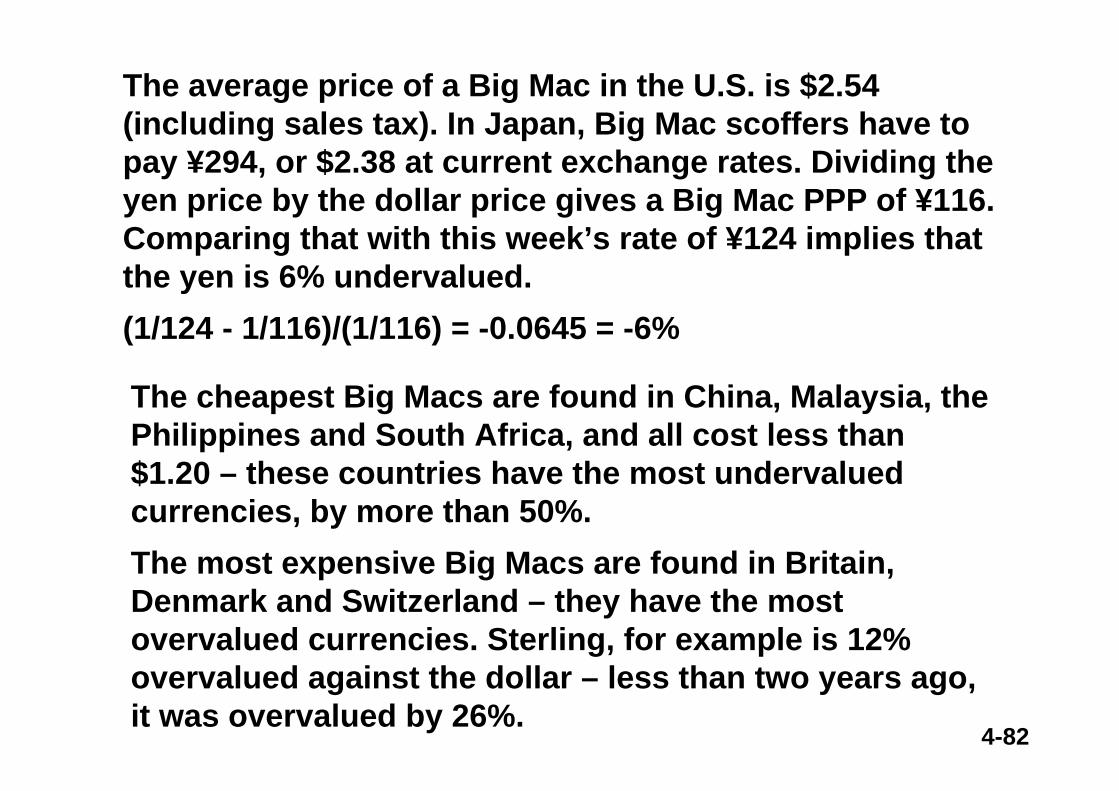
The average price of a Big Mac in the U.S. is $2.54 (including sales tax). In Japan, Big Mac scoffers have to pay ¥294, or $2.38 at current exchange rates. Dividing the yen price by the dollar price gives a Big Mac PPP of ¥116. Comparing that with this week’s rate of ¥124 implies that the yen is 6% undervalued. (1/124 - 1/116)/(1/116) = -0.0645 = -6%
The cheapest Big Macs are found in China, Malaysia, the Philippines and South Africa, and all cost less than $1.20 – these countries have the most undervalued currencies, by more than 50%.The most expensive Big Macs are found in Britain, Denmark and Switzerland – they have the most overvalued currencies. Sterling, for example is 12% overvalued against the dollar – less than two years ago, it was overvalued by 26%.
4-83
Overall, the dollar has never looked so overvalued during 15 years of burgernomics. In the mid 1990s the dollar was cheap against most currencies; now it looks dear against all but three. The most undervalued of the rich-world currencies are the Australian and New Zealand dollars, which are both 40-45% below McParity. They need to ketchup.All the emerging-market currencies are undervalued against the dollar on a Big Mac PPP basis. That, in turn, means that a currency such as Argentina’s peso, which is undervalued only a tad against the dollar, is massively overvalued compared with other currencies, such as the Brazilian real and virtually all of the East Asian currencies.
4-84
25/04/02
25/04/02
4-85
4-86
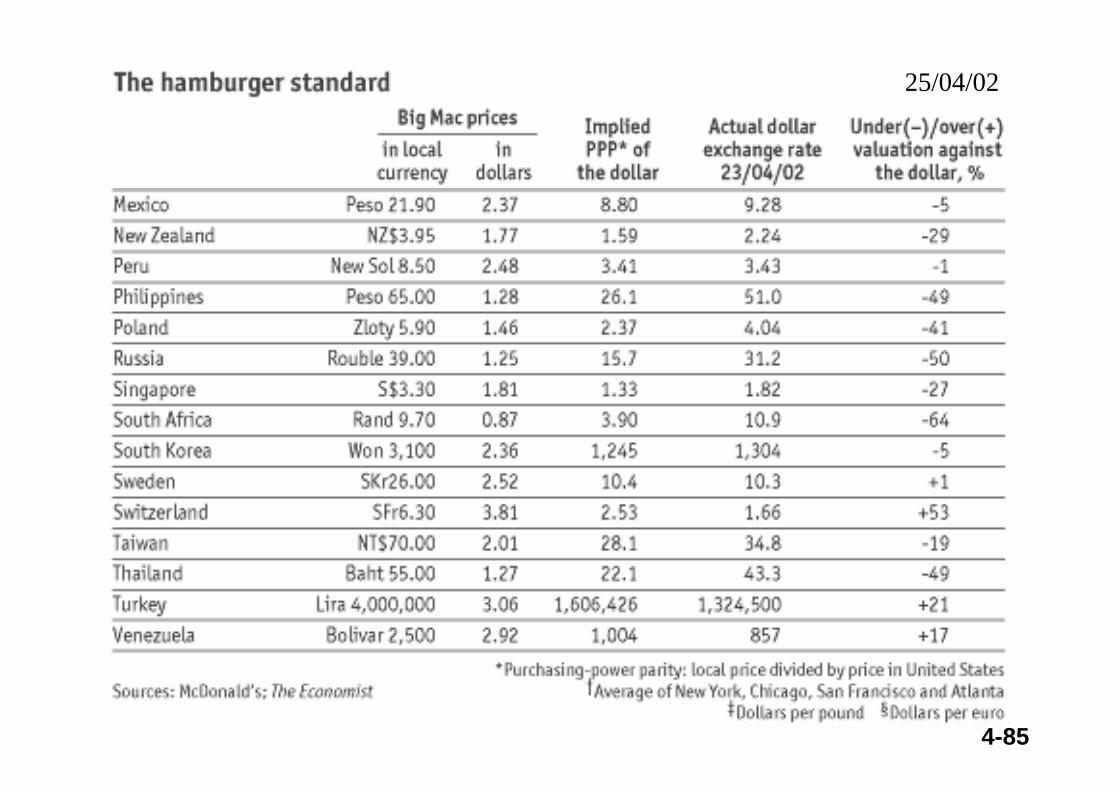
The average American price has fallen slightly over the past year, to $2.49. The cheapest Big Mac is in Argentina (78 cents), after its massive devaluation; the most expensive ($3.81) is in Switzerland. By this measure, the Argentine peso is the most undervalued currency and the Swiss franc the most overvalued.The euro is only 5% undervalued relative to its Big Mac PPP, far less than many economists claim. The euro area may have a single currency, but the price of a Big Mac varies from euro2.15 in Greece to euro2.95 in France. However, that range has narrowed from a year ago. The Australian dollar is the most undervalued rich-world currency, 35% below McParity. No wonder the Australian economy was so strong last year. Sterling, by contrast, is one of the few currencies that is overvalued against the dollar, by 16%; it is 21% too strong against the euro.
4-87
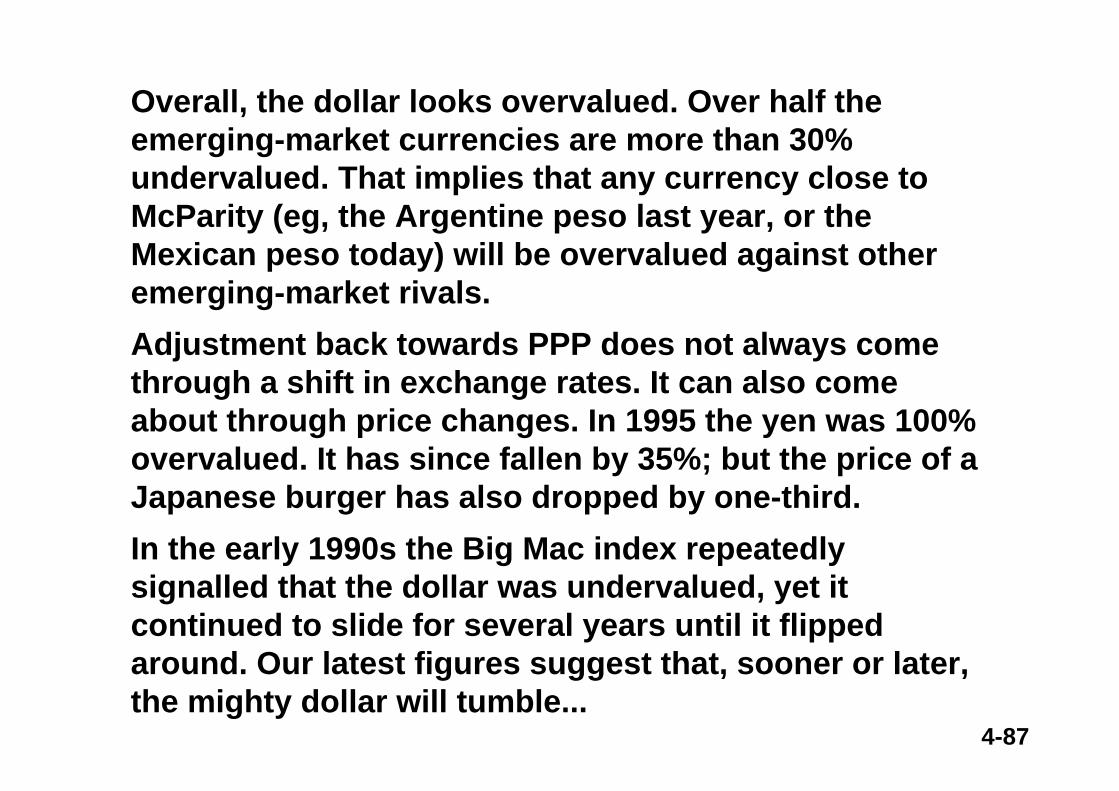
Overall, the dollar looks overvalued. Over half the emerging-market currencies are more than 30% undervalued. That implies that any currency close to McParity (eg, the Argentine peso last year, or the Mexican peso today) will be overvalued against other emerging-market rivals.Adjustment back towards PPP does not always come through a shift in exchange rates. It can also come about through price changes. In 1995 the yen was 100% overvalued. It has since fallen by 35%; but the price of a Japanese burger has also dropped by one-third.In the early 1990s the Big Mac index repeatedly signalled that the dollar was undervalued, yet it continued to slide for several years until it flipped around. Our latest figures suggest that, sooner or later, the mighty dollar will tumble...
4-88
Apr 24th 2003
4-89
4-90
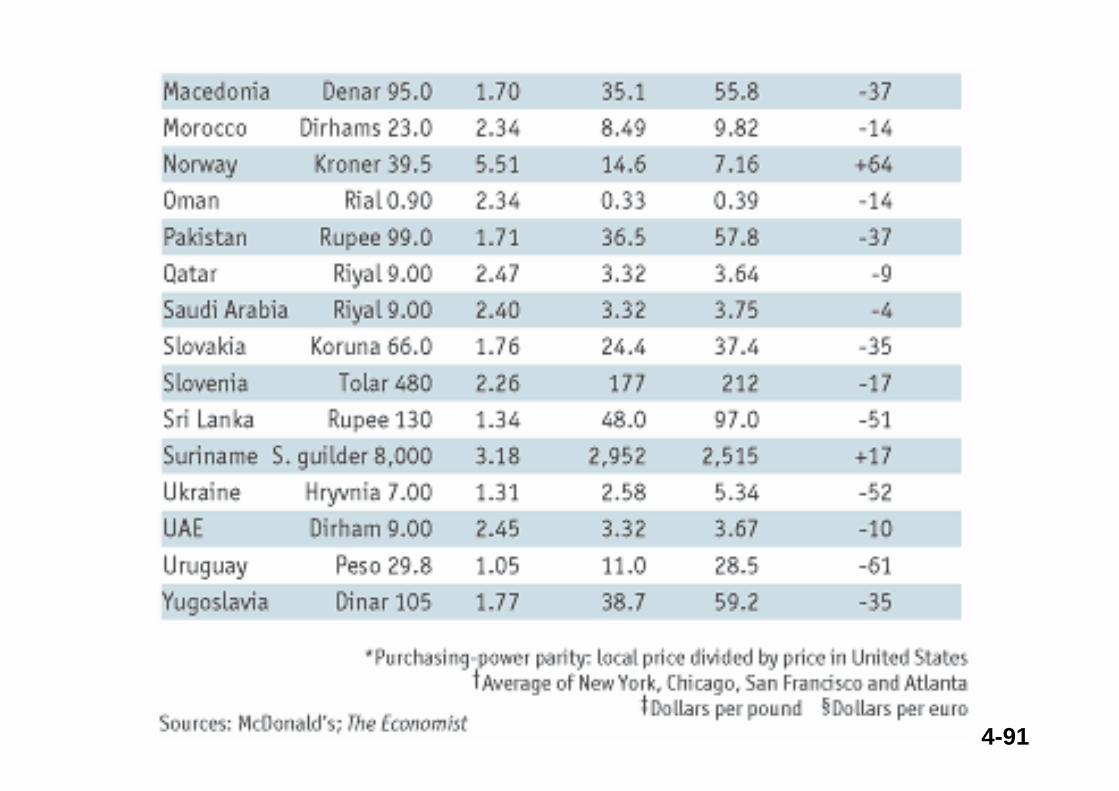
4-91
4-92
Evidence: The Law of One Price
The Economist
• Some find the Big Mac index hard to swallow. Not only does the PPP theory hold only for the very long run, but hamburgers are a flawed measure of PPP.
• Local prices may be distorted by trade barriers on beef, sales taxes, local competition and changes in the cost of non-traded inputs such as rents.
• But despite its flaws, the Big Mac index produces PPP estimates close to those derived by more sophisticated methods.
• A currency can deviate from PPP for long periods, but several studies have found that the Big Mac PPP is a useful predictor of future movements – “betting on the most undervalued of the main currencies each year is a profitable strategy.”
4-93
Evidence: The Law of One Price
The Economist
¤ Indeed, the Big Mac has had several forecasting successes.
¤ When the euro was launched at the start of 1999, most forecasters predicted that it would rise against the dollar. But the euro has instead tumbled – exactly as the Big Mac index had signaled. At the start of 1999, euro burgers were much dearer than American ones, suggesting that the euro had started off significantly overvalued.
¤ One of the best-known hedge funds, Soros Fund Management, admitted that it chewed over the sell signal given by the Big Mac index when the euro was launched, but then decided to ignore it. The euro tumbled, and Soros was cheesed off.
4-94
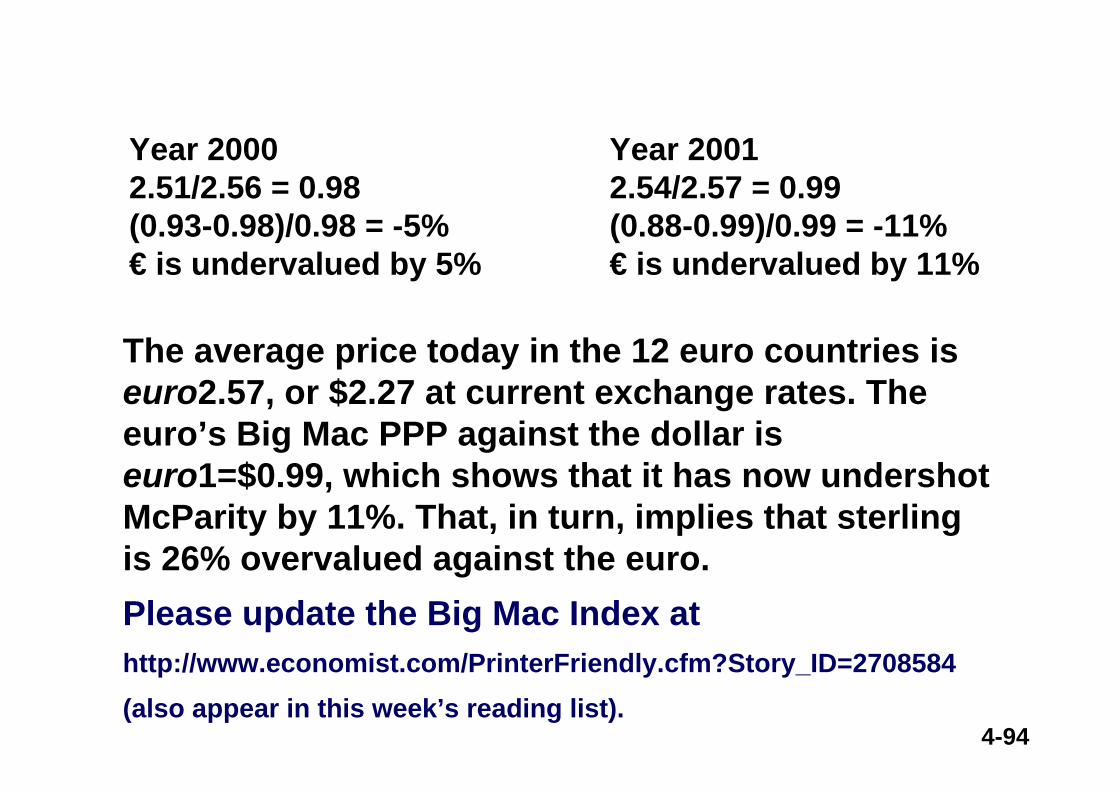
The average price today in the 12 euro countries is euro2.57, or $2.27 at current exchange rates. The euro’s Big Mac PPP against the dollar is euro1=$0.99, which shows that it has now undershot McParity by 11%. That, in turn, implies that sterling is 26% overvalued against the euro.Please update the Big Mac Index at http://www.economist.com/PrinterFriendly.cfm?Story_ID=2708584(also appear in this week’s reading list).
Year 20012.54/2.57 = 0.99(0.88-0.99)/0.99 = -11%€ is undervalued by 11%
Year 20002.51/2.56 = 0.98(0.93-0.98)/0.98 = -5%€ is undervalued by 5%
4-95
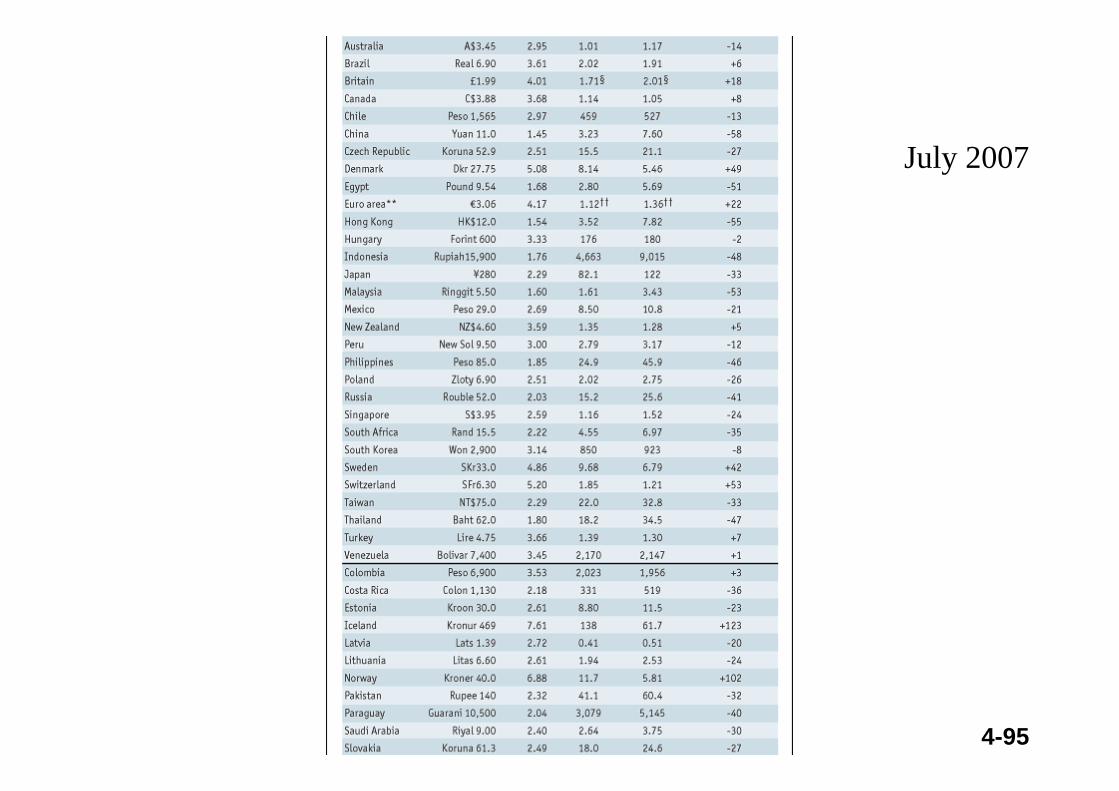
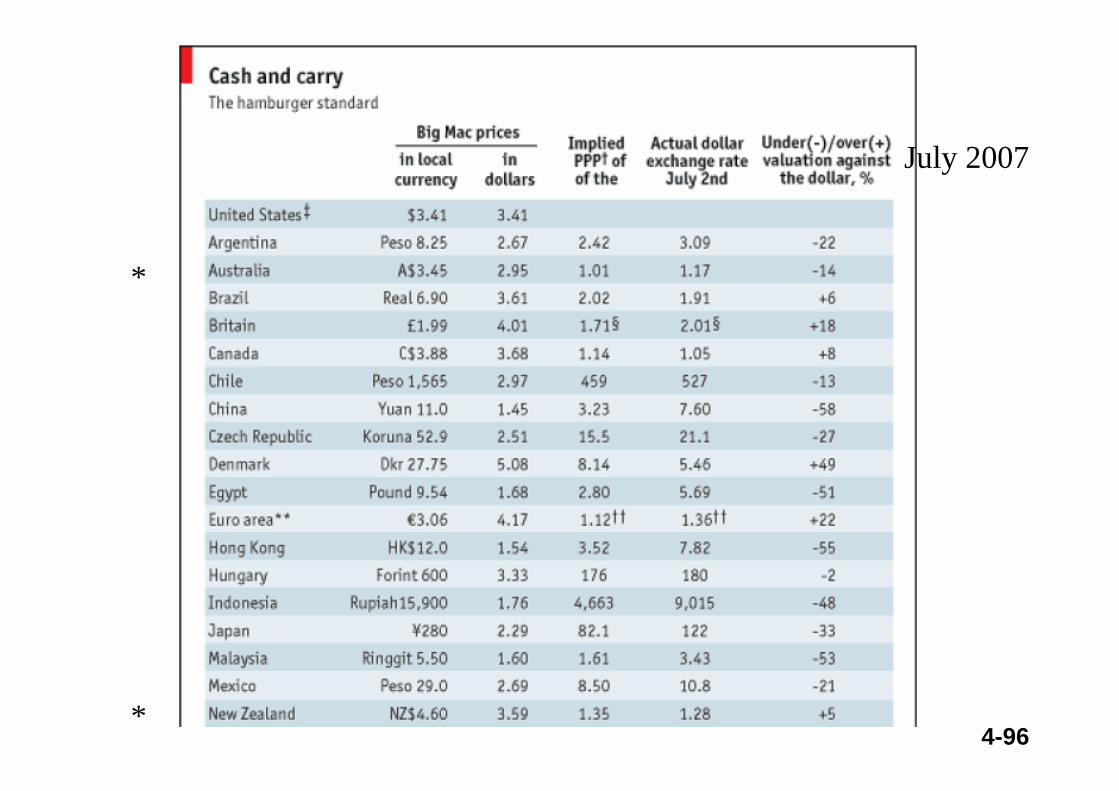
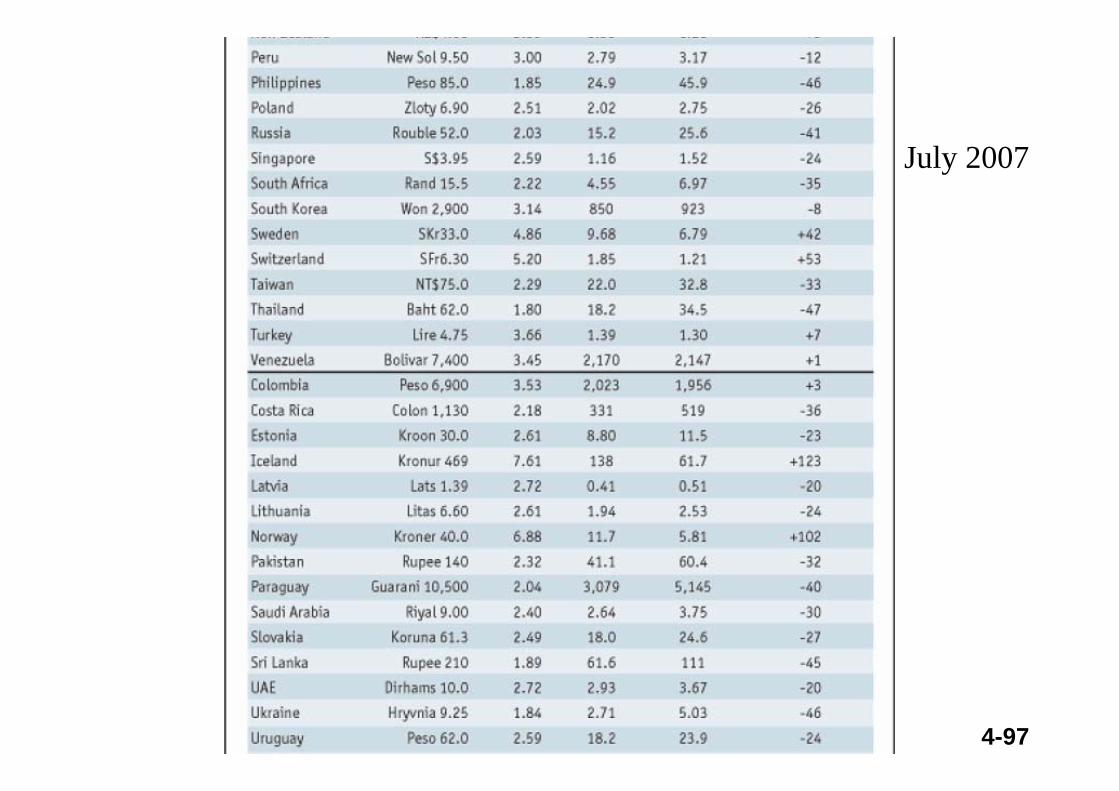
July 2007
4-96
July 2007
*
*
4-97
July 2007
4-98
The price of a burger depends heavily on local inputs such as rent and wages, which are not easily arbitraged across borders and tend to be lower in poorer countries. For this reason PPP is a better guide to currency misalignments between countries at a similar stage of development.
4-99
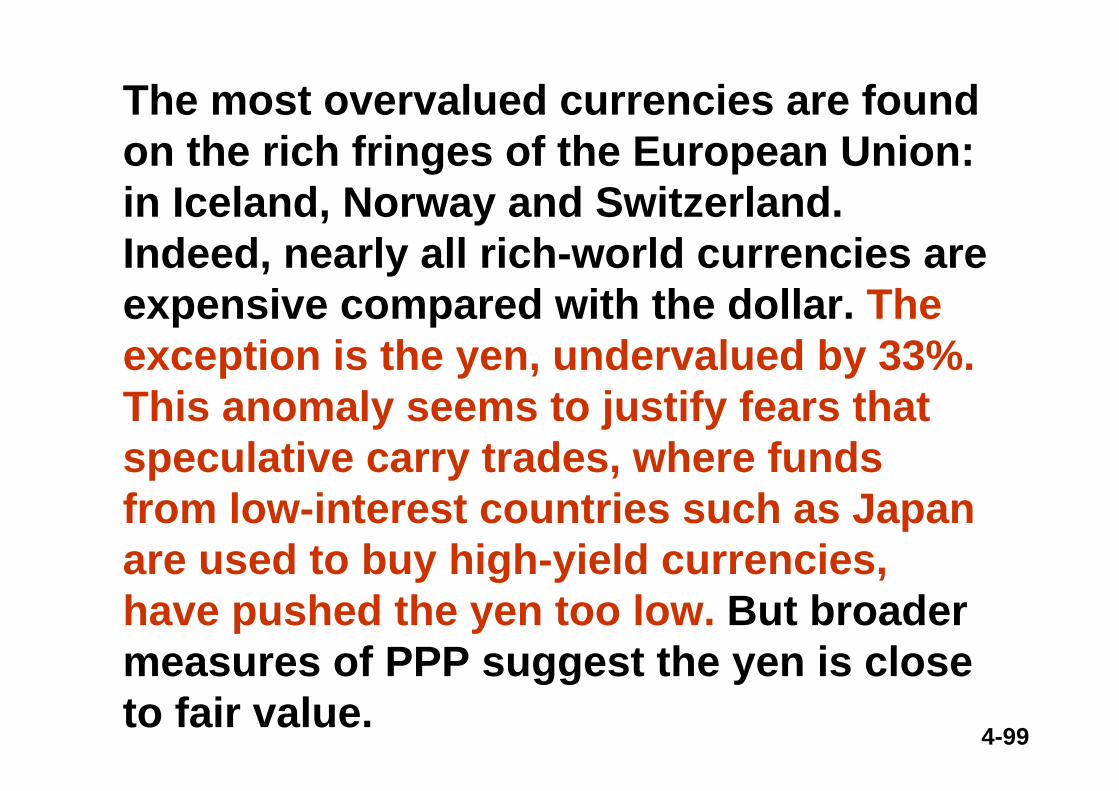
The most overvalued currencies are found on the rich fringes of the European Union: in Iceland, Norway and Switzerland. Indeed, nearly all rich-world currencies are expensive compared with the dollar. The exception is the yen, undervalued by 33%. This anomaly seems to justify fears that speculative carry trades, where funds from low-interest countries such as Japan are used to buy high-yield currencies, have pushed the yen too low. But broader measures of PPP suggest the yen is close to fair value.
4-100
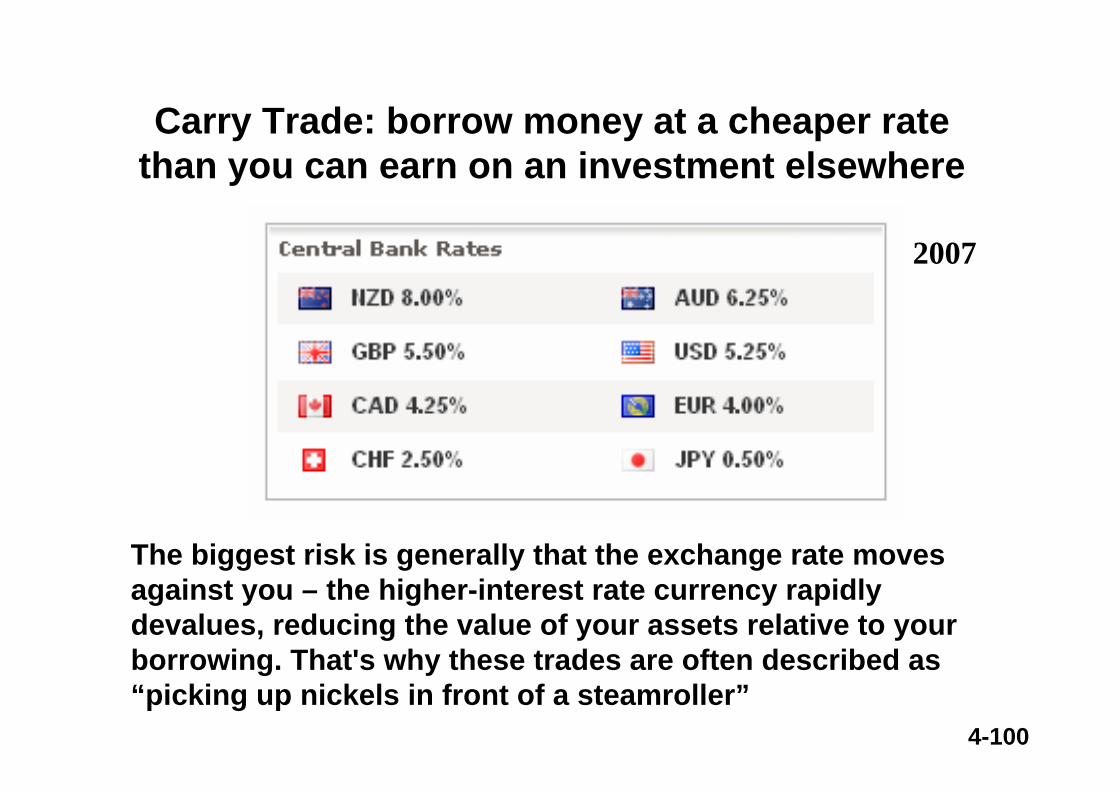
Carry Trade: borrow money at a cheaper rate than you can earn on an investment elsewhere
The biggest risk is generally that the exchange rate moves against you – the higher-interest rate currency rapidly devalues, reducing the value of your assets relative to your borrowing. That's why these trades are often described as “picking up nickels in front of a steamroller”
2007
4-101
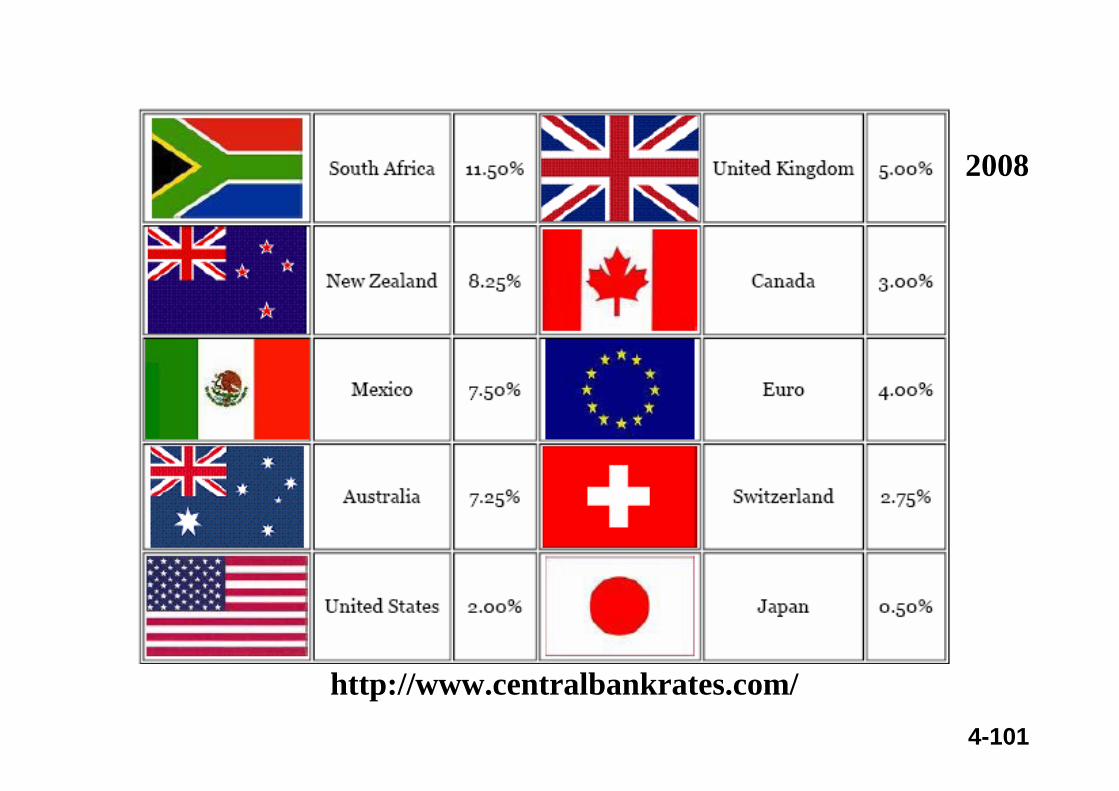
http://www.centralbankrates.com/
2008
4-102
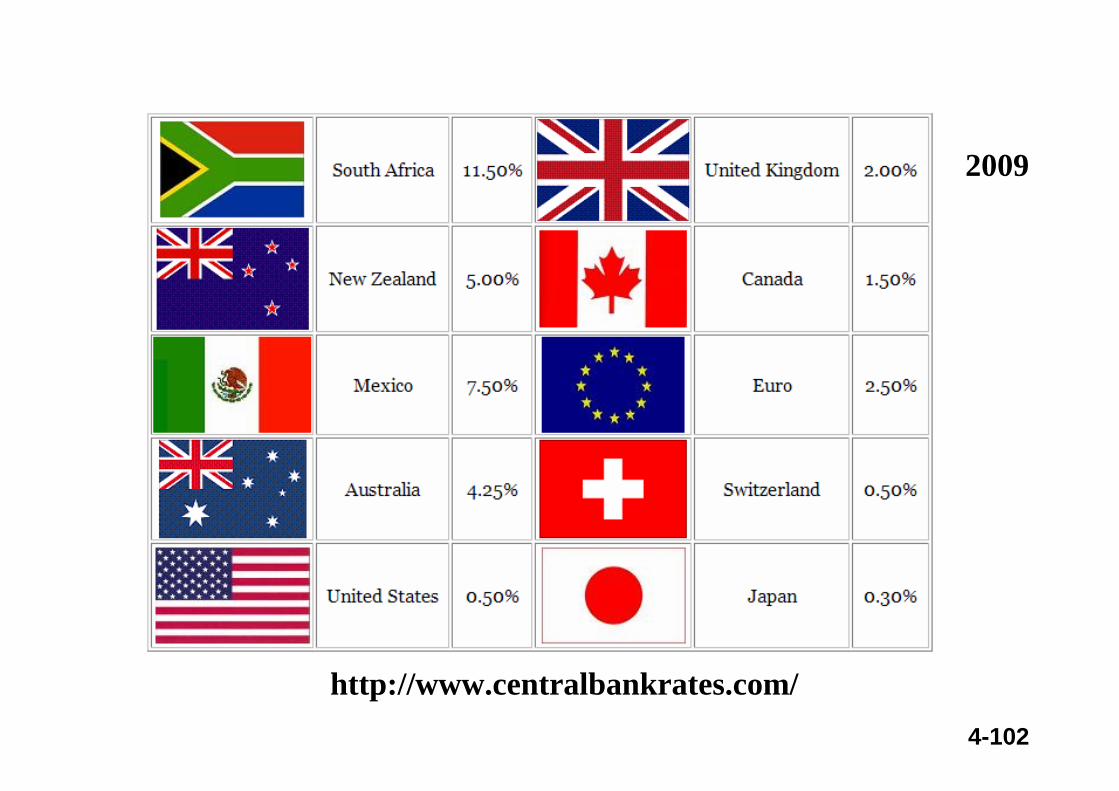
http://www.centralbankrates.com/
2009
4-103
Japan’s low Interest Rate
The savings rates of Japanese households have been among the highest in the world, and high savings rates push down the interest rate.
In addition, Japanese investment was low in 2002 because of the weak economy at that time. Low investment also reduced real interest rates.
http://www.worthpublishers.com/ballpreview/casestudy1.PDF

4-104
About the CFA Program
• The Chartered Financial Analyst (CFA) Program is a globally recognized standard for measuring the competence and integrity of financial analysts.
• Its curriculum develops and reinforces a fundamental knowledge of investment principles.
• Three levels of examination measure a candidate’s ability to apply these principles at a professional level.
• The CFA exam is administered annually in more than 70 nations worldwide.
• http://www.aimr.org/cfaprogram/
4-105
a. Explain the following three concepts of purchasing power parity (PPP):i. The law of one price.ii.Absolute PPP.iii. Relative PPP.
b. Evaluate the usefulness of relative PPP in predicting movements in foreign exchange rates on a:i. Short-term basis (e.g., three months).ii.Long-term basis (e.g., six years).
CFA (level III, 1997)
4-106
i. The law of one price is that, assuming competitive markets and no transportation costs or tariffs, the same goods should have the same real prices in all countries after converting prices to a common currency.
ii. Absolute PPP, focusing on baskets of goods and services, states that the same basket of goods should have the same price in all countries after conversion to a common currency. Under absolute PPP, the equilibrium exchange rate between two currencies would be the rate that equalizes the prices of a basket of goods between the two countries. This rate would correspond to the ratio of average price levels in the countries. Absolute PPP assumes no impediments to trade and identical price indexes that do not create measurement problems.
CFA (level III, 1997)
4-107
CFA (level III, 1997)
iii. Relative PPP holds that exchange rate movements reflect differences in price changes (inflation rates) between countries. A country with a relatively high inflation rate will experience a proportionate depreciation of its currency’s value vis-à-vis a country with a lower rate of inflation. Movements in currencies provide a means for maintaining equivalent purchasing power levels among currencies in the presence of differing inflation rates.Relative PPP assumes prices adjust quickly and price indexes properly measure inflation rates. Because relative PPP focuses on changes and not absolute levels, relative PPP is more likely to be satisfied than the law of one price or absolute PPP.
4-108
CFA (level III, 1997)i. Short-term basis (e.g., three months). Relative PPP is not
consistently useful in the short run because: (1) Relationships between month-to-month movements in market exchange rates and PPP are not consistently strong, according to empirical research. Deviations between the rates can persist for extended periods; (2) exchange rates fluctuate minute by minute because they are set in the financial markets. Price levels, in contrast, are sticky and adjust slowly; and, (3) many other factors can influence exchange rate movements rather than just inflation.
ii. Long-term basis (e.g., six years). Research suggests that over the long term a tendency exists for market and PPP rates to move together, with market rates eventually moving toward levels implied by PPP.
4-109
Even though the investment community generally believes that country M’s recent budget deficit reduction is “credible, sustainable, and large,”analysts disagree about how it will affect country M’s foreign exchange rate. Juan DaSilva, CFA, states “the reduced budget deficit will lower interest rates, which will immediately weaken country M’s foreign exchange rate.”
CFA (level III, 1998)
a.Discuss the direct (short-term) effects of a reduction in country M’s budget deficit on:i. Demand for loanable funds.ii. Nominal interest rates.iii. Exchange rates.
4-110
CFA (level III, 1998)
b.Helga Wu, CFA, states, “Country M’s foreign exchange rate will strengthen over time as a result of changes in expectations in the private sector in country M.” Support Wu’s position that country M’s foreign exchange rate will strengthen because of the changes a budget deficit reduction will cause in:i. Expected inflation rates.ii.Expected rates on return on domestic
securities.
4-111
CFA (level III, 1998)i. Demand for loanable funds. The immediate effect of
reducing the budget deficit is to reduce the demand for loanable funds because the government needs to borrow less to bridge the gap between spending and taxes.
ii. Nominal interest rates. The reduced public sector demand for loanable funds has the direct effect of lowering nominal interest rates because lower demand leads to lower cost of borrowing.
iii. Exchange rates. The direct effect of the budget deficit reduction is a depreciation of the domestic currency and the exchange rate. As investors sell lower yielding country M securities to buy the securities of other countries, country M’s currency will come under pressure and country M’s currency will depreciate.
4-112
CFA (level III, 1998)
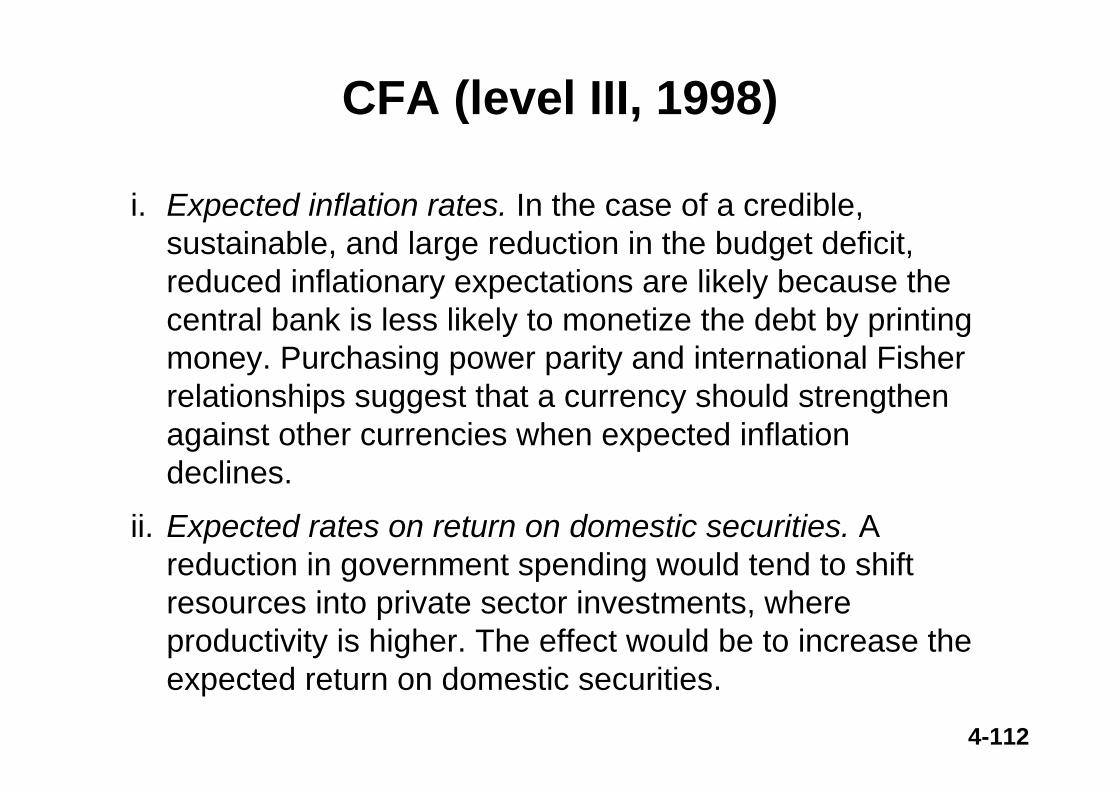
i. Expected inflation rates. In the case of a credible, sustainable, and large reduction in the budget deficit, reduced inflationary expectations are likely because the central bank is less likely to monetize the debt by printing money. Purchasing power parity and international Fisher relationships suggest that a currency should strengthen against other currencies when expected inflation declines.
ii. Expected rates on return on domestic securities. A reduction in government spending would tend to shift resources into private sector investments, where productivity is higher. The effect would be to increase the expected return on domestic securities.
4-113
CFA (level III, 1996)
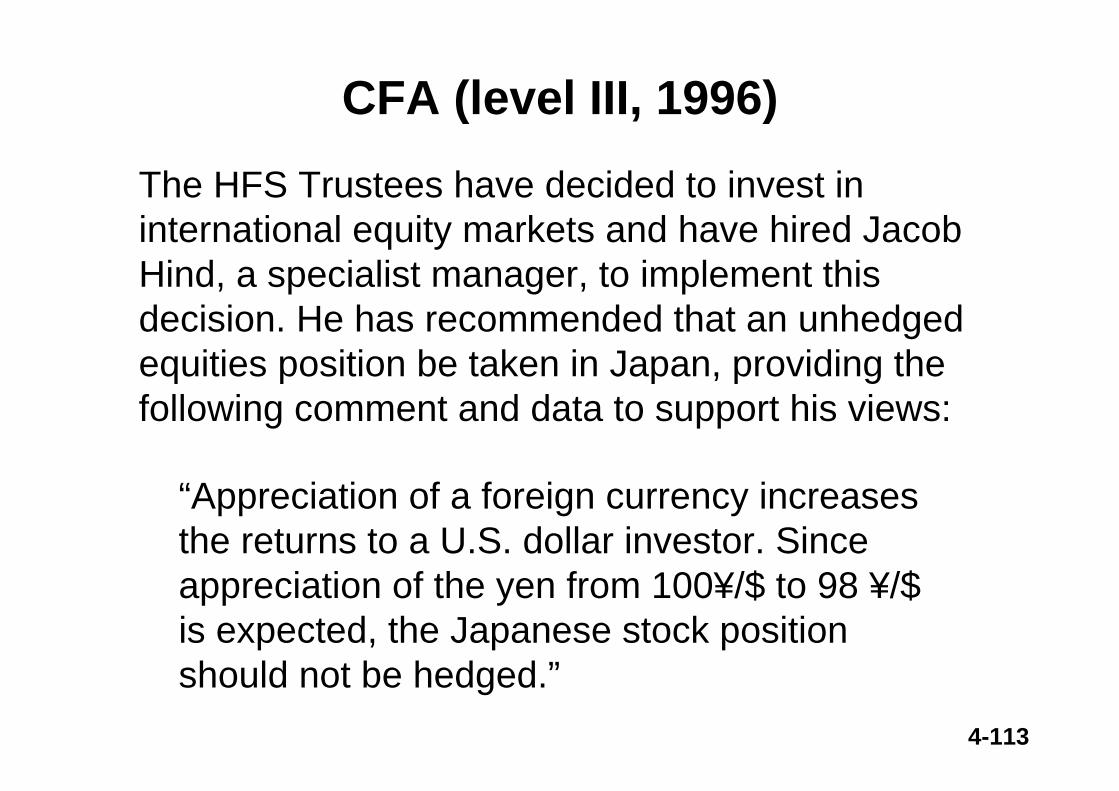
The HFS Trustees have decided to invest in international equity markets and have hired Jacob Hind, a specialist manager, to implement this decision. He has recommended that an unhedgedequities position be taken in Japan, providing the following comment and data to support his views:
“Appreciation of a foreign currency increases the returns to a U.S. dollar investor. Since appreciation of the yen from 100¥/$ to 98 ¥/$ is expected, the Japanese stock position should not be hedged.”
4-114
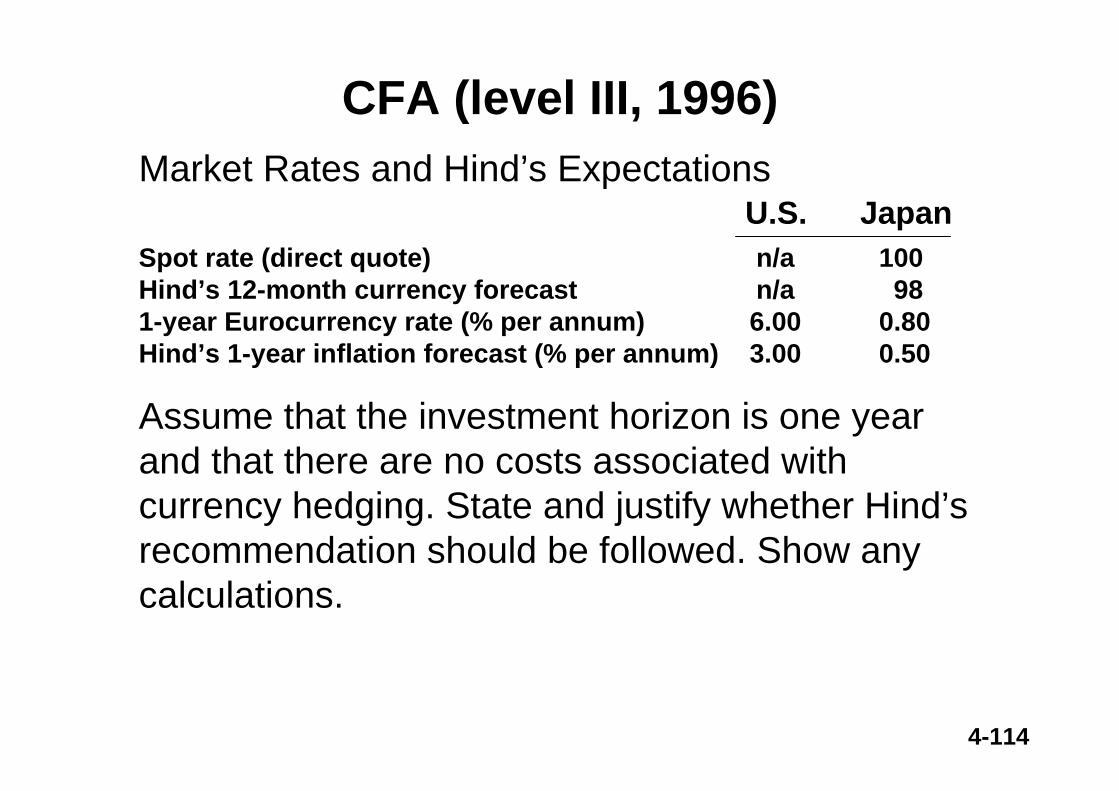
CFA (level III, 1996)Market Rates and Hind’s Expectations
Spot rate (direct quote)Hind’s 12-month currency forecast1-year Eurocurrency rate (% per annum)Hind’s 1-year inflation forecast (% per annum)
n/an/a6.003.00
10098
0.800.50
U.S. Japan
Assume that the investment horizon is one year and that there are no costs associated with currency hedging. State and justify whether Hind’s recommendation should be followed. Show any calculations.
4-115
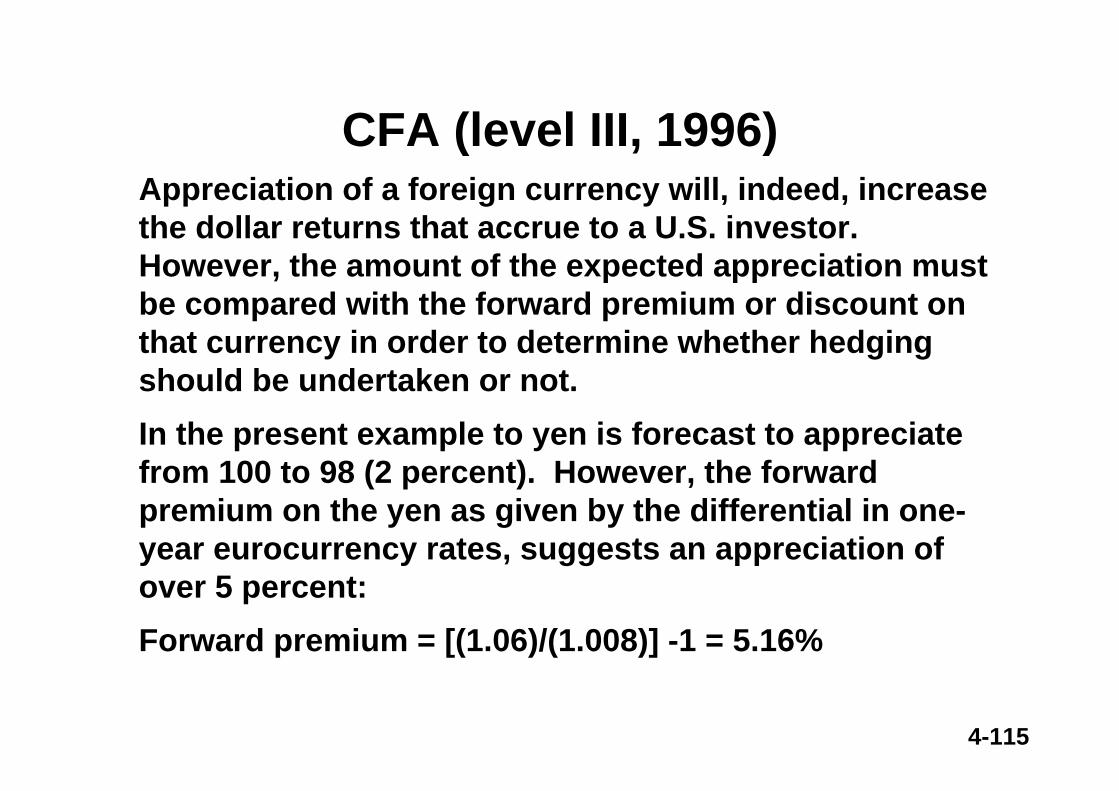
CFA (level III, 1996)Appreciation of a foreign currency will, indeed, increase the dollar returns that accrue to a U.S. investor. However, the amount of the expected appreciation must be compared with the forward premium or discount on that currency in order to determine whether hedging should be undertaken or not.In the present example to yen is forecast to appreciate from 100 to 98 (2 percent). However, the forward premium on the yen as given by the differential in one-year eurocurrency rates, suggests an appreciation of over 5 percent:Forward premium = [(1.06)/(1.008)] -1 = 5.16%
4-116
CFA (level III, 1996)Thus, the manager’s strategy to leave the yen unhedged is not appropriate. The manager should hedge because by doing so, a higher rate of yen appreciation can be locked in. Given the on-year eurocurrency rate differentials, the yen position should be left unhedged only if the yen is forecast to appreciate to over 95 yen per US dollar.
4-117
Measuring the Cost of Living
• Inflation refers to a situation in which the economy’s overall price level is rising.
• The inflation rate is the percentage change in the price level from the previous period.
4-118
The GDP Deflator versus the Consumer Price Index
• Economists and policymakers monitor both the GDP deflator and the consumer price index to gauge how quickly prices are rising.
• There are two important differences between the indexes that can cause them to diverge.
4-119
The GDP Deflator versus the Consumer Price Index
• The GDP deflator reflects the prices of all goods and services produced domestically, whereas...
• …the consumer price index reflects the prices of all goods and services bought by consumers.
4-120
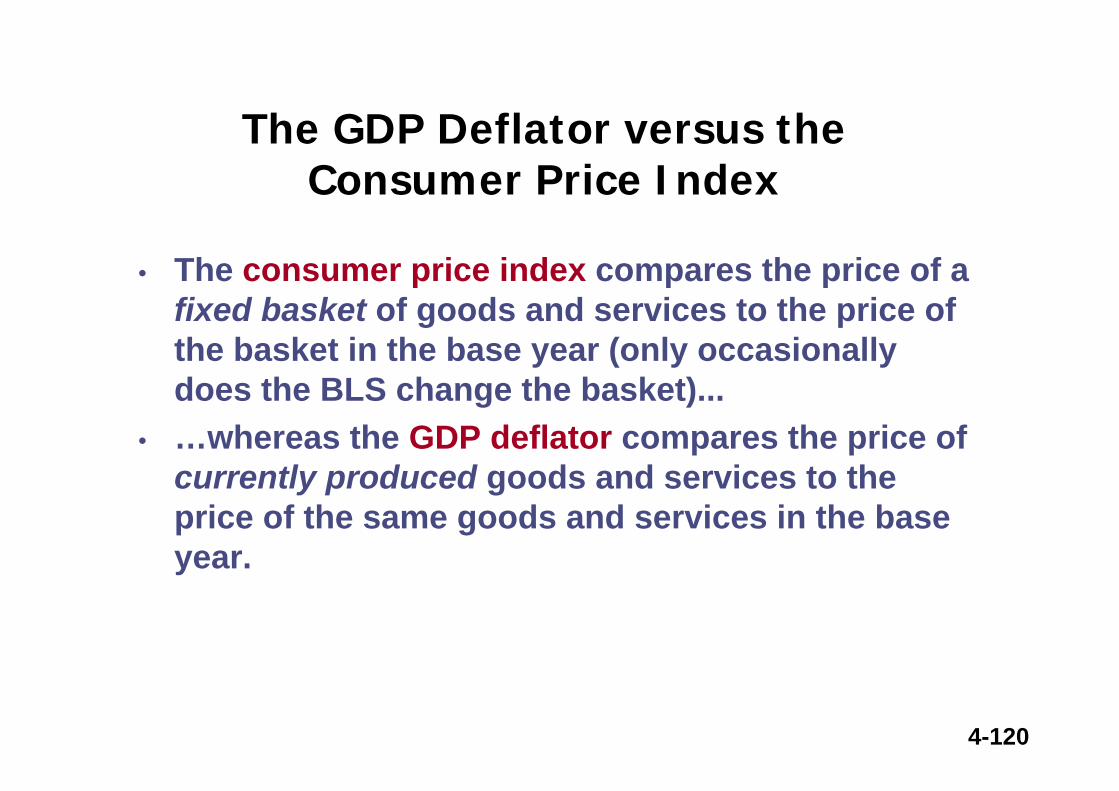
The GDP Deflator versus the Consumer Price Index
• The consumer price index compares the price of a fixed basket of goods and services to the price of the basket in the base year (only occasionally does the BLS change the basket)...
• …whereas the GDP deflator compares the price of currently produced goods and services to the price of the same goods and services in the base year.
4-121
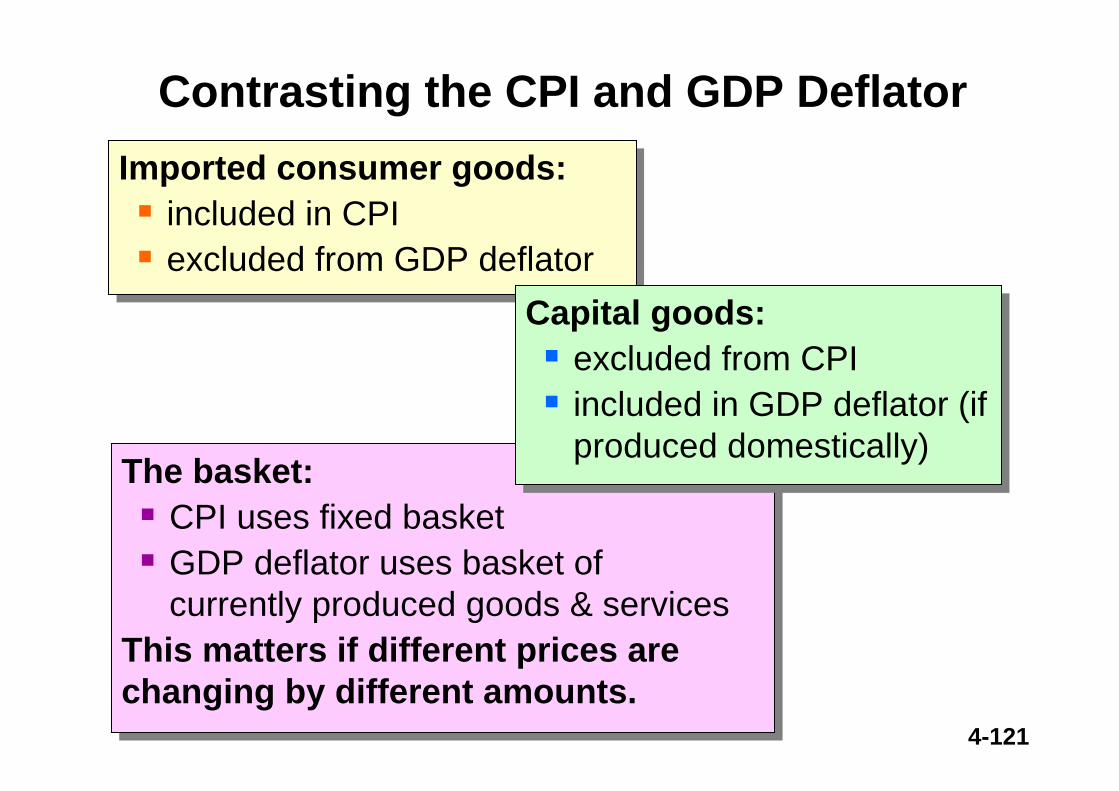
Imported consumer goods:included in CPI excluded from GDP deflator
Imported consumer goods:included in CPI excluded from GDP deflator
The basket:CPI uses fixed basketGDP deflator uses basket of currently produced goods & services
This matters if different prices are changing by different amounts.
The basket:CPI uses fixed basketGDP deflator uses basket of currently produced goods & services
This matters if different prices are changing by different amounts.
Capital goods:excluded from CPI included in GDP deflator (if produced domestically)
Capital goods:excluded from CPI included in GDP deflator (if produced domestically)
Contrasting the CPI and GDP Deflator
4-122
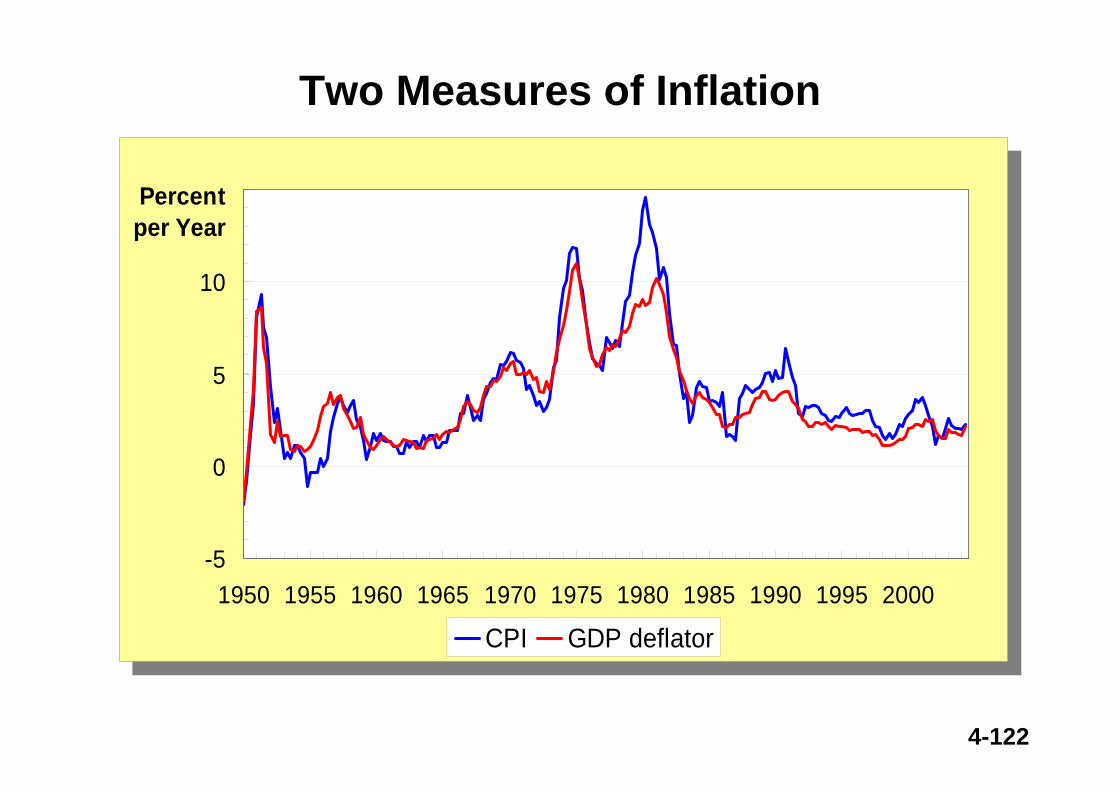
Two Measures of Inflation
-5
0
5
10
15
1950 1955 1960 1965 1970 1975 1980 1985 1990 1995 2000
Percent per Year
CPI GDP deflator
-5
0
5
10
15
1950 1955 1960 1965 1970 1975 1980 1985 1990 1995 2000
Percent per Year
CPI GDP deflator
4-123
CPI vs. GDP deflatorCPI vs. GDP deflator
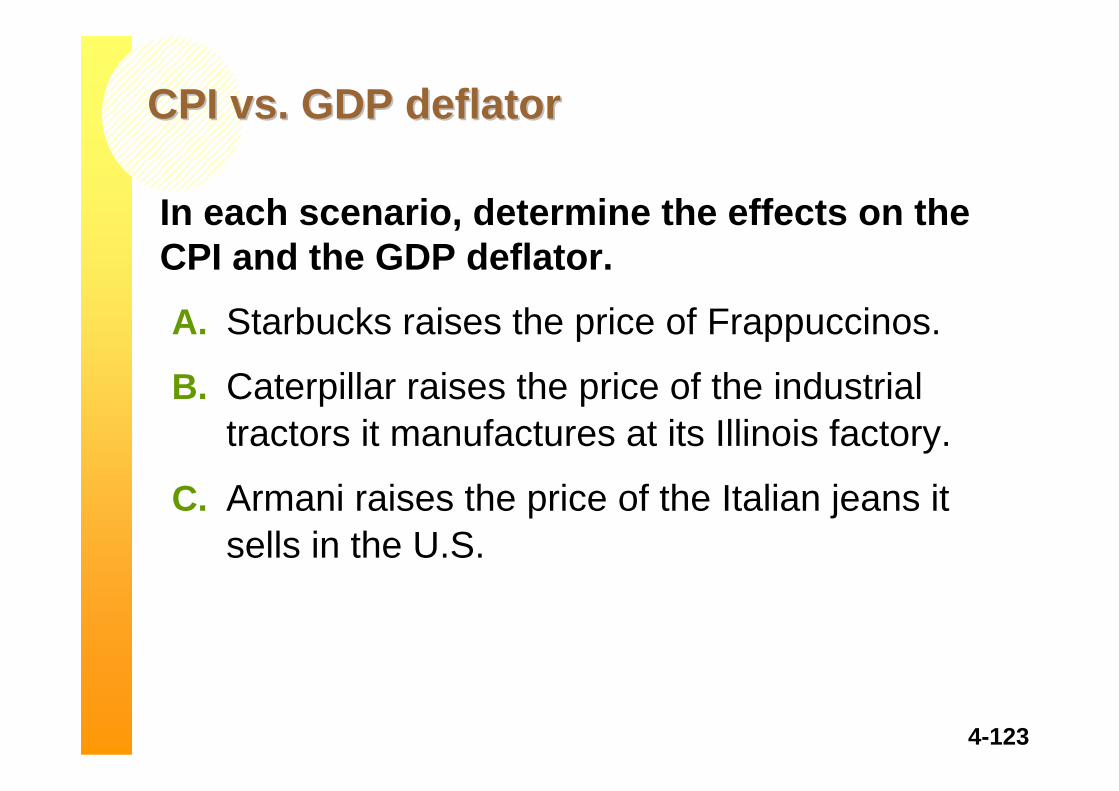
In each scenario, determine the effects on the CPI and the GDP deflator. A. Starbucks raises the price of Frappuccinos.
B. Caterpillar raises the price of the industrial tractors it manufactures at its Illinois factory.
C. Armani raises the price of the Italian jeans it sells in the U.S.
4-124
AnswersAnswers
A. Starbucks raises the price of Frappuccinos.The CPI and GDP deflator both rise.
B. Caterpillar raises the price of the industrial tractors it manufactures at its Illinois factory.The GDP deflator rises, the CPI does not.
C. Armani raises the price of the Italian jeans it sells in the U.S.The CPI rises, the GDP deflator does not.
4-125
Consumer Price Index• The consumer price index (CPI) is a measure
of the overall cost of the goods and services bought by a typical consumer.
• It is used to monitor changes in the cost of living over time.
• It reports the movement of prices using an index number.
• When the CPI rises, the typical family has to spend more dollars to maintain the same standard of living.
MEASURING THE COST OF LIVING
4-126
How the Consumer Price Index Is Calculated
• Fix the Basket: Determine what goods are most important to the typical consumer.
The Bureau of Labor Statistics (BLS) identifies a market basket of goods and services the typical consumer buys.
The BLS conducts monthly consumer surveys to determine what they buy and how much they pay.
• Find the Prices: Find the prices of each of the goods and services in the basket for each point in time.
4-127
How the Consumer Price Index Is Calculated
• Compute the Basket’s Cost: Use the data on prices to calculate the cost of the basket of goods and services at different times.
• Choose a Base Year and Compute the Index:Designate one year as the base year, which is the benchmark used for comparison. Compute the index by dividing the price of the basket in one year by the price in the base year and multiplying by 100.
4-128
How the Consumer Price Index Is Calculated
• Compute the inflation rate: The inflation rate is the percentage change in the price index from the preceding period.
4-129
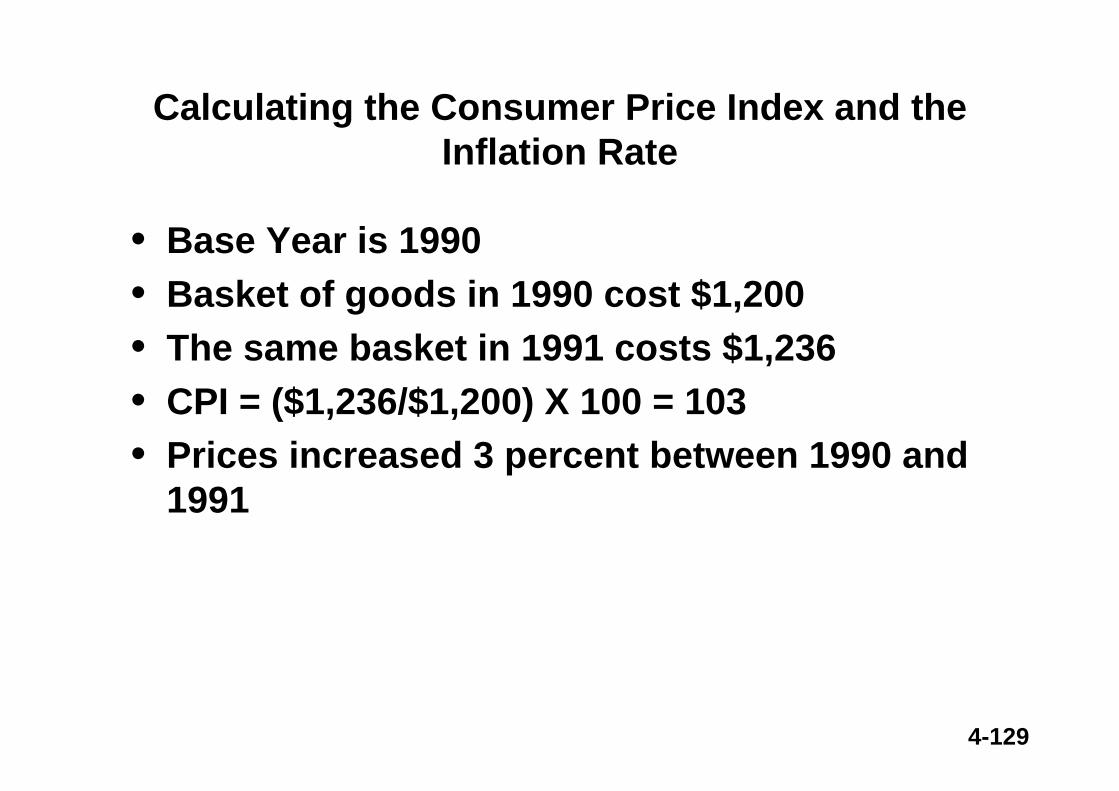
Calculating the Consumer Price Index and the Inflation Rate
• Base Year is 1990• Basket of goods in 1990 cost $1,200• The same basket in 1991 costs $1,236• CPI = ($1,236/$1,200) X 100 = 103• Prices increased 3 percent between 1990 and
1991
4-130
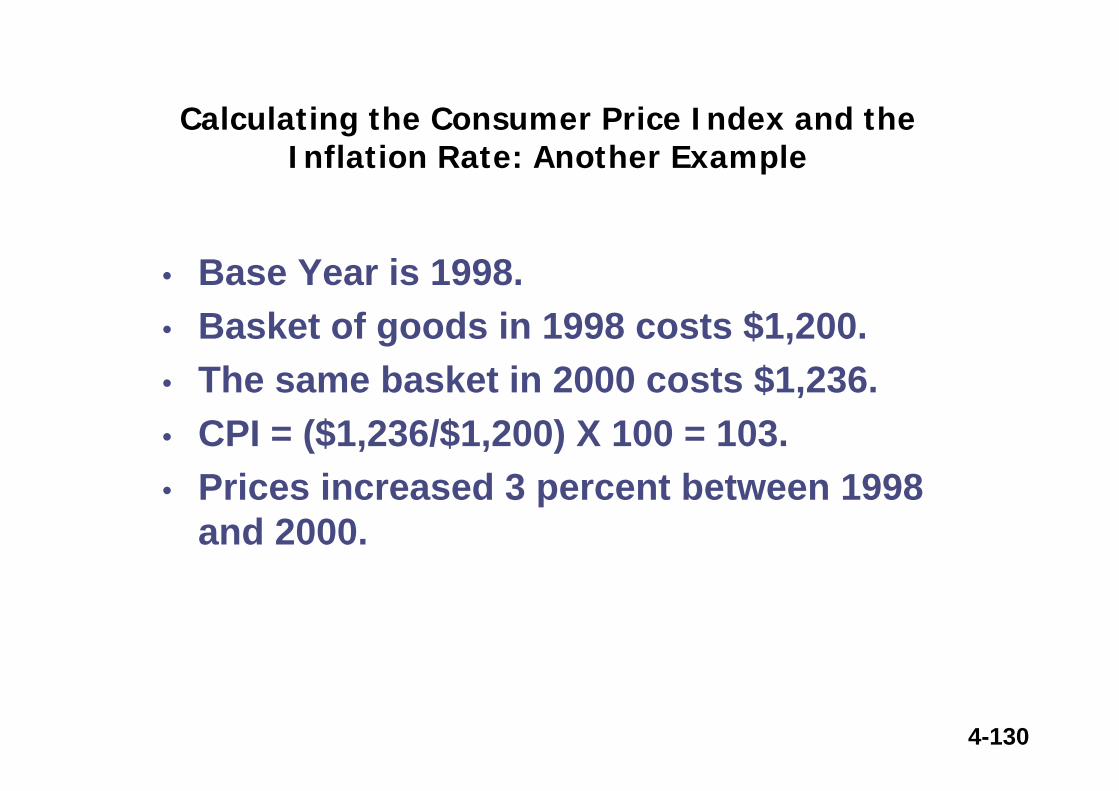
Calculating the Consumer Price Index and the Inflation Rate: Another Example
• Base Year is 1998.• Basket of goods in 1998 costs $1,200.• The same basket in 2000 costs $1,236.• CPI = ($1,236/$1,200) X 100 = 103.• Prices increased 3 percent between 1998
and 2000.
4-131
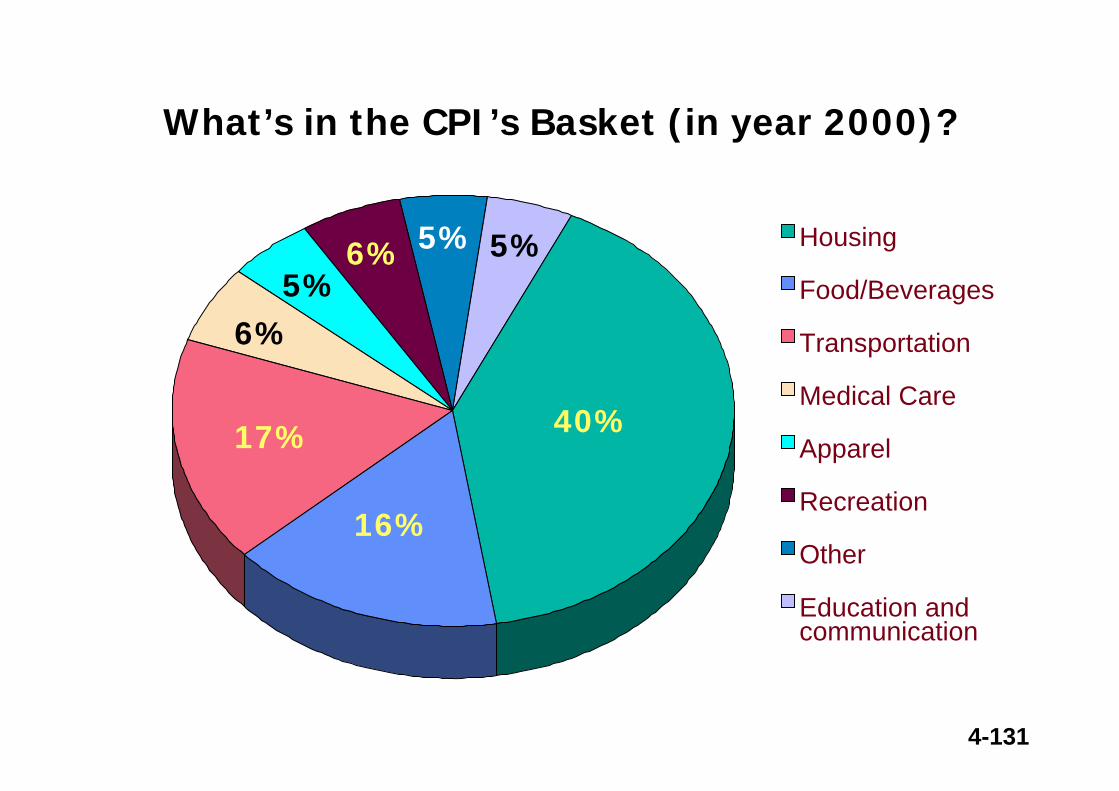
Housing
Food/Beverages
Transportation
Medical Care
Apparel
Recreation
Other
Education andcommunication
What’s in the CPI’s Basket (in year 2000)?
40%
16%
17%
6%5%
6% 5% 5%
4-132
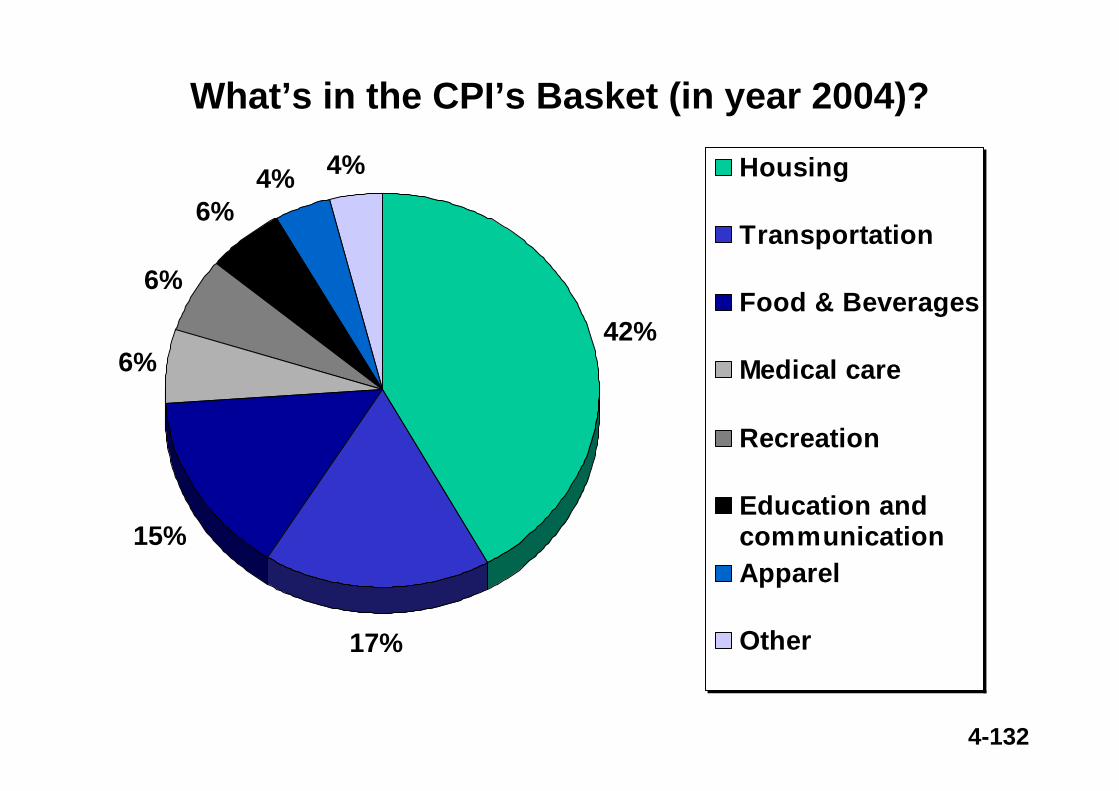
What’s in the CPI’s Basket (in year 2004)?
42%
17%
15%
6%
6%
6%4% 4% Housing
Transportation
Food & Beverages
Medical care
Recreation
Education andcommunicationApparel
Other
4-133
The Measurement of GDP
GDP is the market value of all final goods and services
produced within a country in a given period of time.
4-134
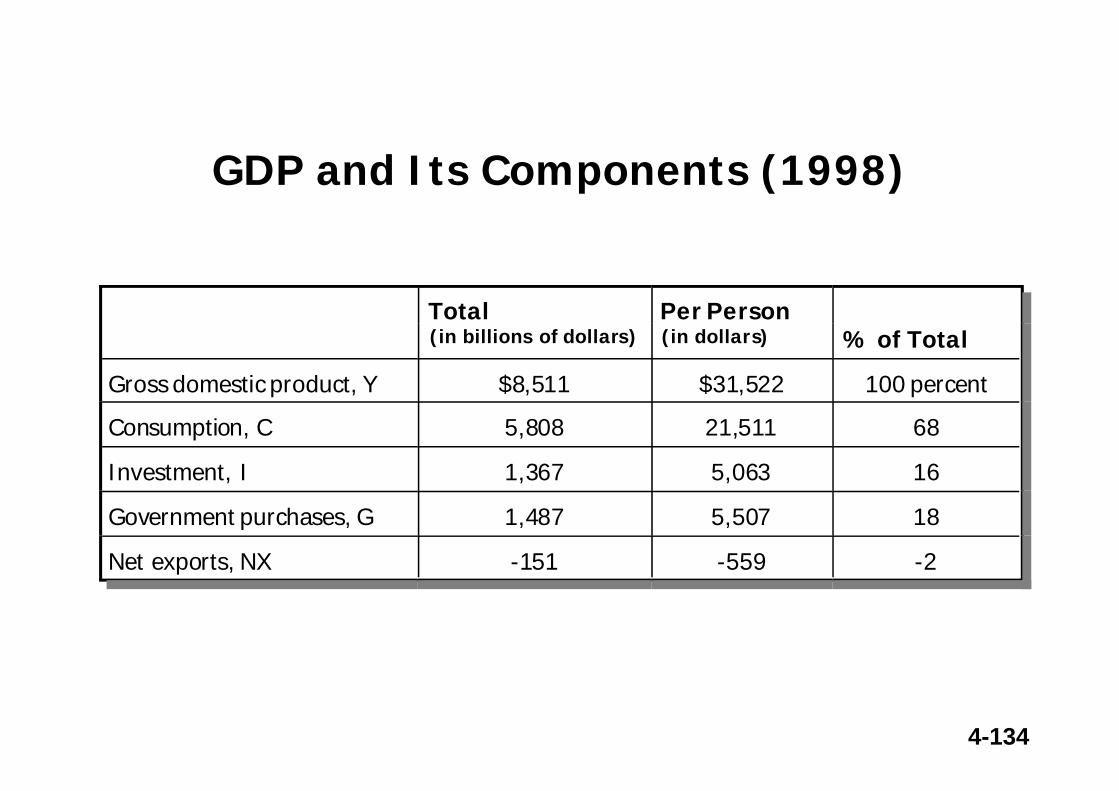
GDP and Its Components (1998)
Total(in billions of dollars)
Per Person(in dollars) % of Total
Gross domestic product, Y $8,511 $31,522 100 percent
Consumption, C 5,808 21,511 68
Investment, I 1,367 5,063 16
Government purchases, G 1,487 5,507 18
Net exports, NX -151 -559 -2
4-135
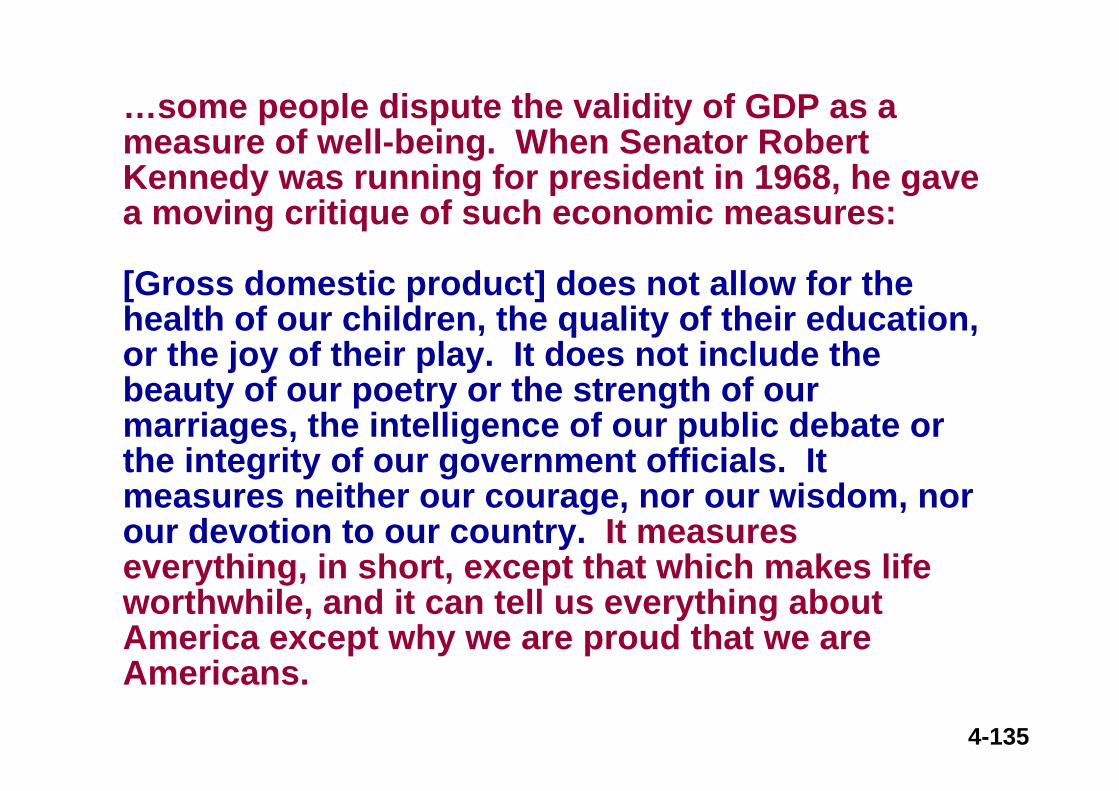
…some people dispute the validity of GDP as a measure of well-being. When Senator Robert Kennedy was running for president in 1968, he gave a moving critique of such economic measures:
[Gross domestic product] does not allow for the health of our children, the quality of their education, or the joy of their play. It does not include the beauty of our poetry or the strength of our marriages, the intelligence of our public debate or the integrity of our government officials. It measures neither our courage, nor our wisdom, nor our devotion to our country. It measures everything, in short, except that which makes life worthwhile, and it can tell us everything about America except why we are proud that we are Americans.
4-136
Real versus Nominal GDP
• Nominal GDP values the production of goods and services at current prices.
• Real GDP values the production of goods and services at constant prices.
4-137
Real versus Nominal GDP
An accurate view of the economy requires adjusting nominal to real GDP by using the GDP deflator.
4-138
GDP Deflator
• The GDP deflator measures the current level of prices relative to the level of prices in the base year.
• It tells us the rise in nominal GDP that is attributable to a rise in prices rather than a rise in the quantities produced.
4-139
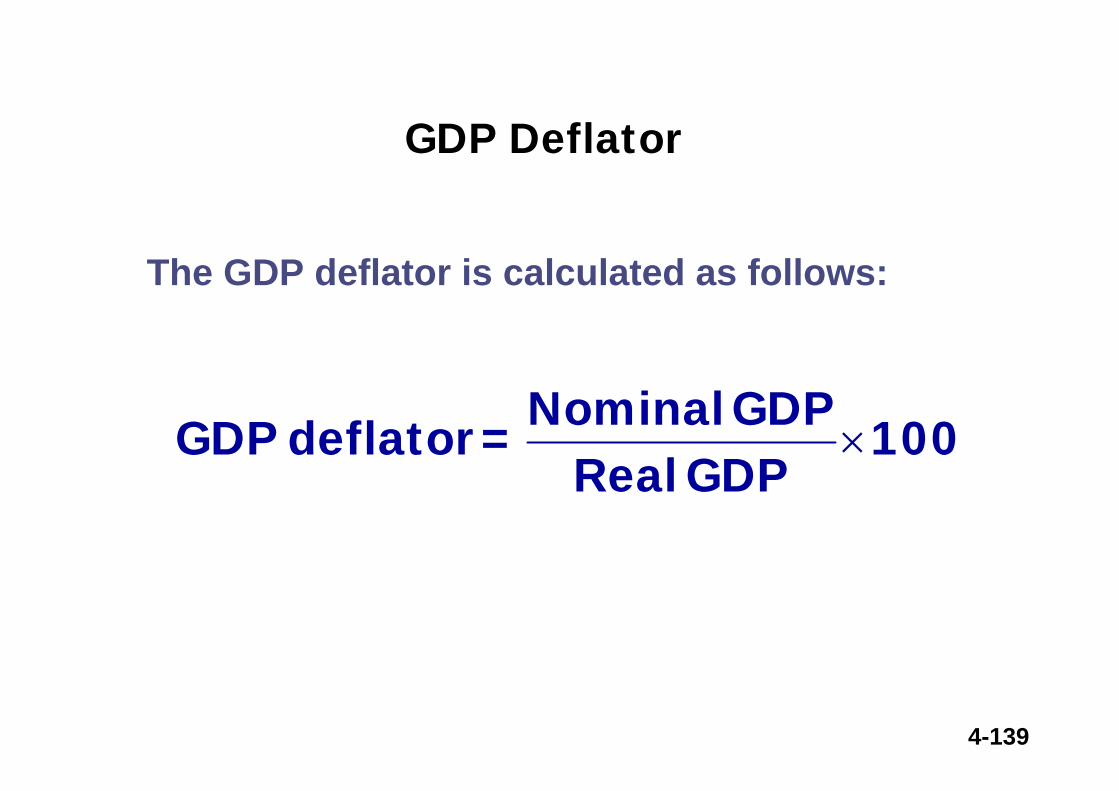
GDP Deflator
100GDP Real
GDPNominal=deflator GDP ×
The GDP deflator is calculated as follows:
4-140
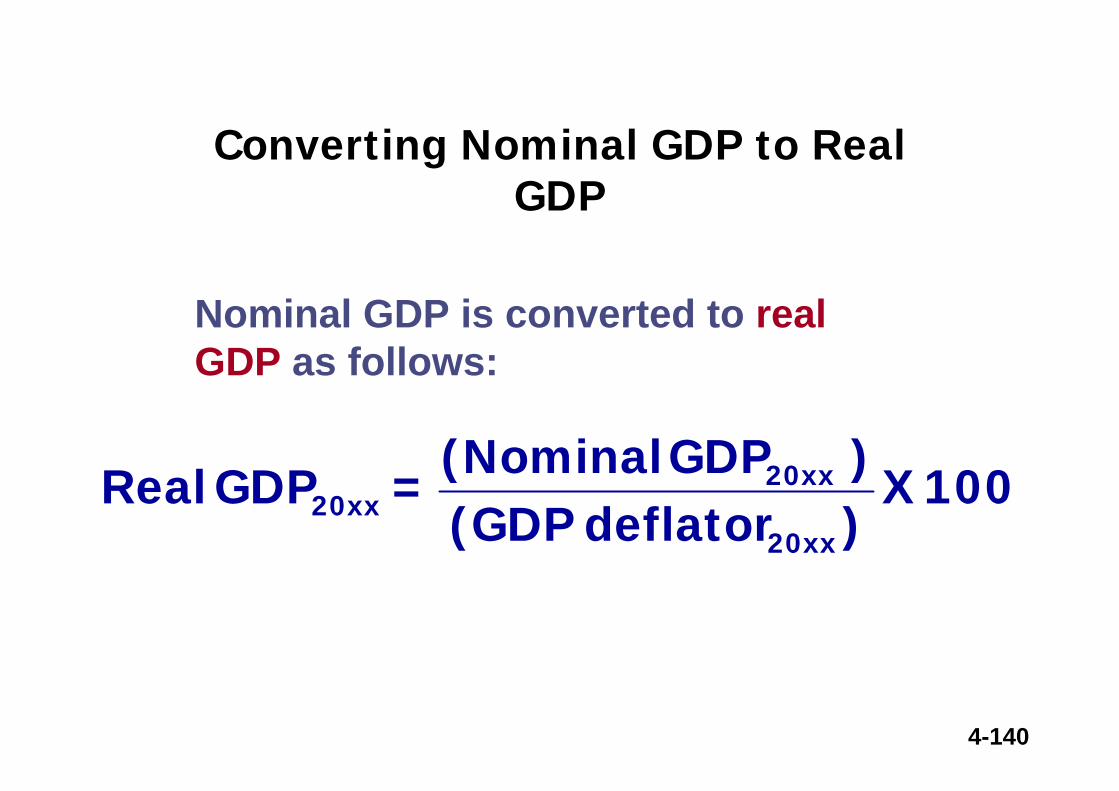
100X )deflator (GDP)GDP(Nominal =GDP Real
20xx
20xx20xx
Converting Nominal GDP to Real GDP
Nominal GDP is converted to real GDP as follows:
4-141
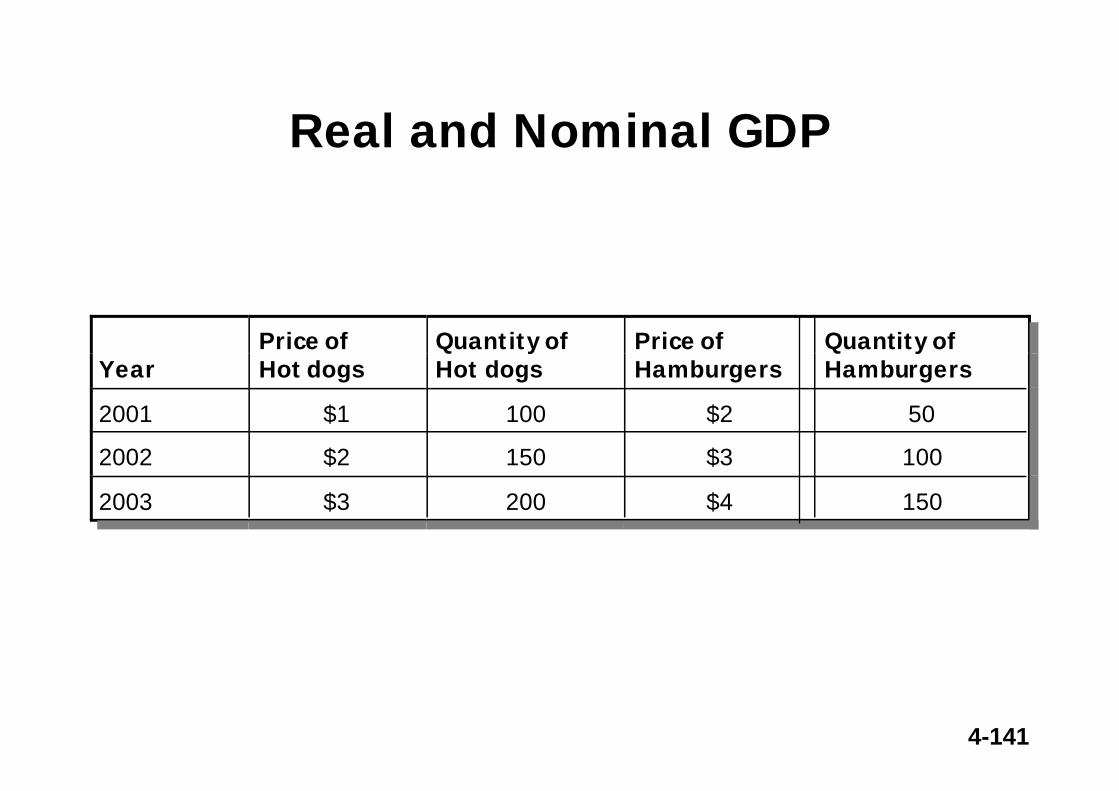
Real and Nominal GDP
YearPrice ofHot dogs
Quantity ofHot dogs
Price of Hamburgers
Quantity ofHamburgers
2001 $1 100 $2 50
2002 $2 150 $3 100
2003 $3 200 $4 150
4-142
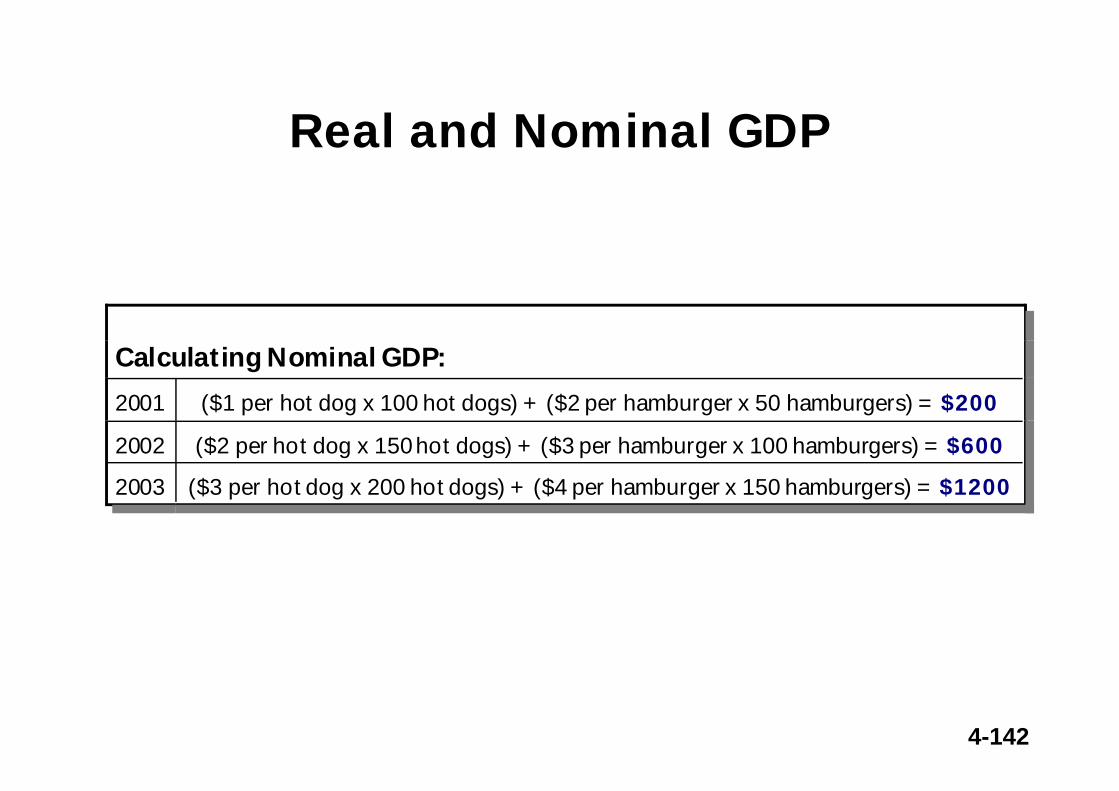
Real and Nominal GDP
Calculating Nominal GDP:
2001 ($1 per hot dog x 100 hot dogs) + ($2 per hamburger x 50 hamburgers) = $200
2002 ($2 per hot dog x 150 hot dogs) + ($3 per hamburger x 100 hamburgers) = $600
2003 ($3 per hot dog x 200 hot dogs) + ($4 per hamburger x 150 hamburgers) = $1200
4-143
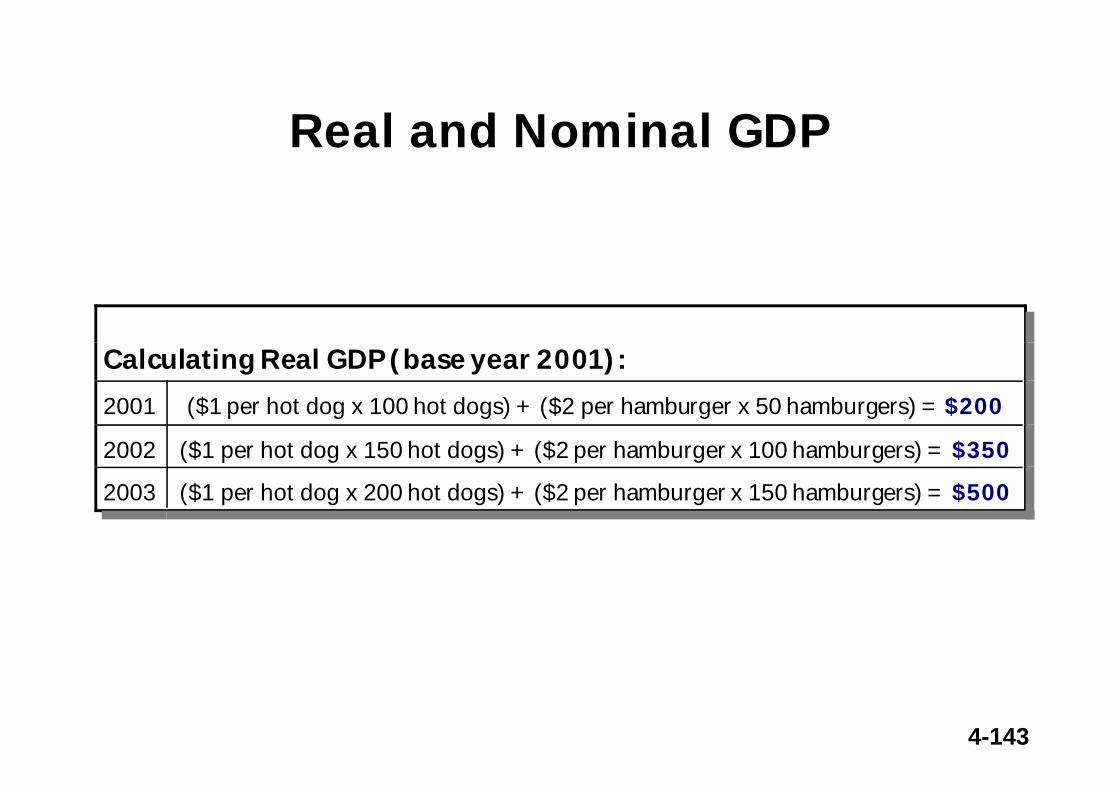
Real and Nominal GDP
Calculating Real GDP (base year 2001):
2001 ($1 per hot dog x 100 hot dogs) + ($2 per hamburger x 50 hamburgers) = $200
2002 ($1 per hot dog x 150 hot dogs) + ($2 per hamburger x 100 hamburgers) = $350
2003 ($1 per hot dog x 200 hot dogs) + ($2 per hamburger x 150 hamburgers) = $500
4-144
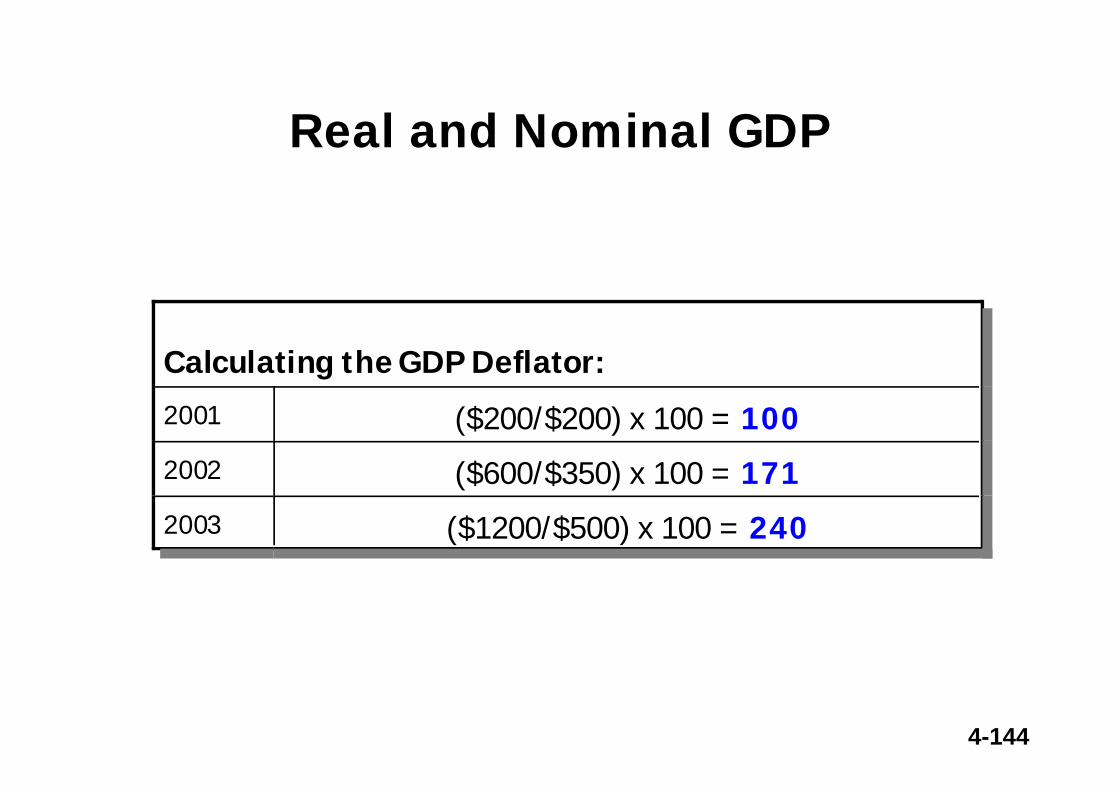
Real and Nominal GDP
Calculating the GDP Deflator:
2001 ($200/$200) x 100 = 1002002 ($600/$350) x 100 = 1712003 ($1200/$500) x 100 = 240
4-145
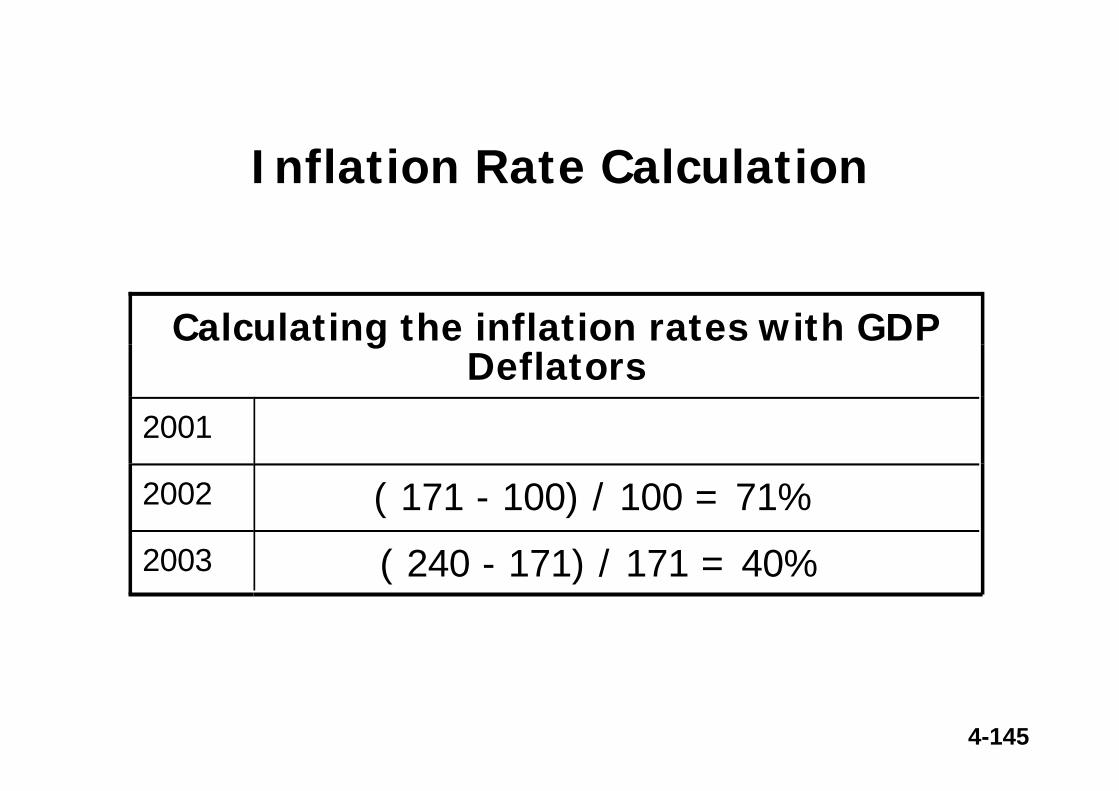
Inflation Rate Calculation
Calculating the inflation rates with GDP Deflators
2001
2002 ( 171 - 100) / 100 = 71%
2003 ( 240 - 171) / 171 = 40%
4-146
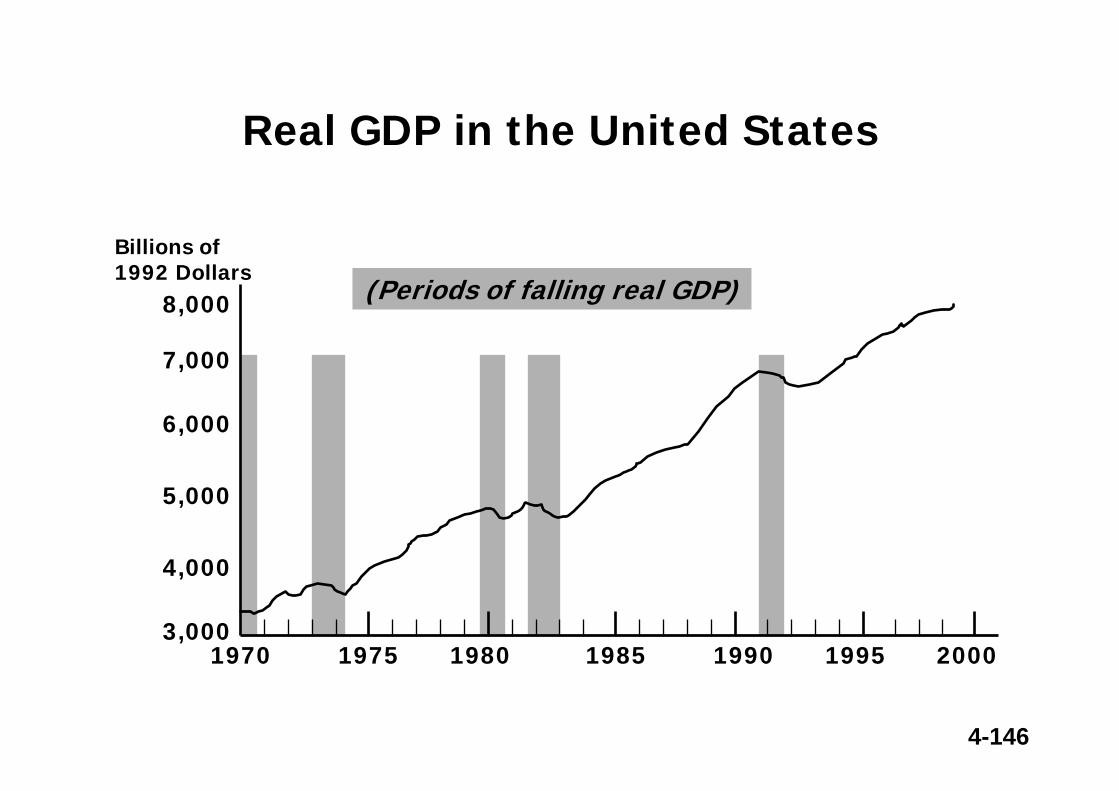
Real GDP in the United States
(Periods of falling real GDP)
1970 1975 1980 1985 1990 19953,000
4,000
5,000
6,000
7,000
Billions of 1992 Dollars
2000
8,000
4-147
Correcting Variables for Inflation:Comparing Dollar Figures from Different Times
• Inflation makes it harder to compare dollar amounts from different times.
• We can use the CPI to adjust figures so that they can be compared.
4-148
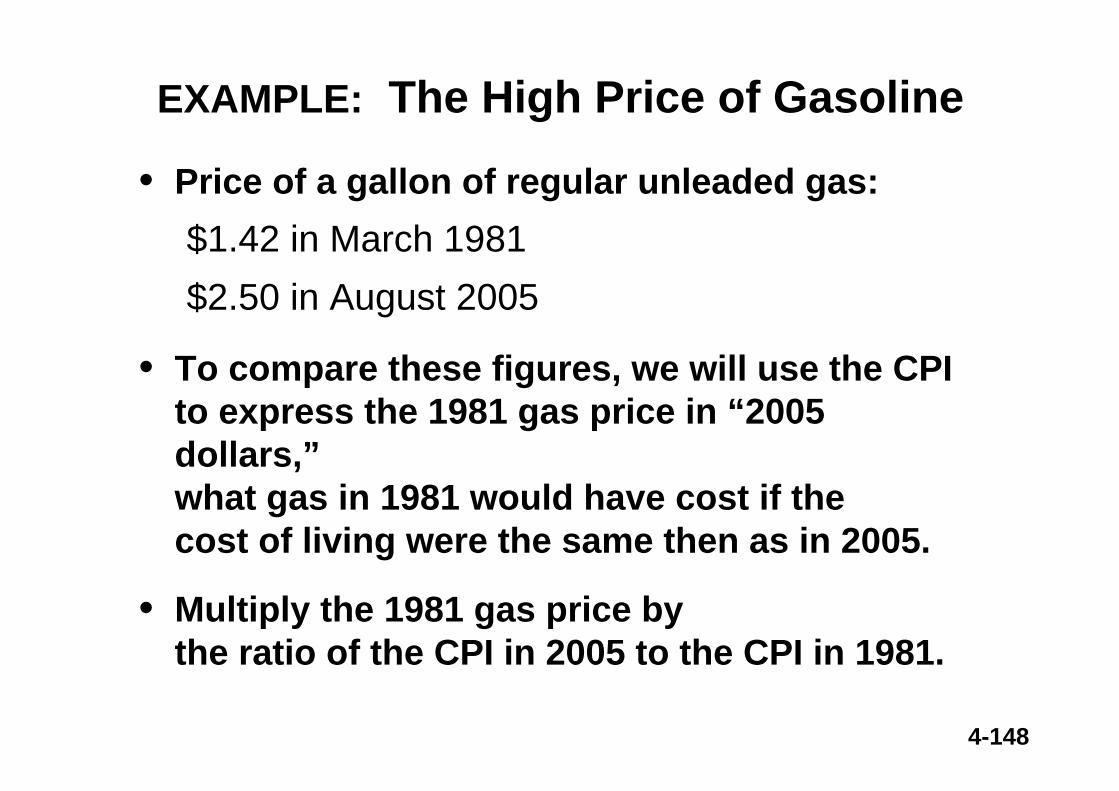
EXAMPLE: The High Price of Gasoline
• Price of a gallon of regular unleaded gas:$1.42 in March 1981$2.50 in August 2005
• To compare these figures, we will use the CPI to express the 1981 gas price in “2005 dollars,”what gas in 1981 would have cost if the cost of living were the same then as in 2005.
• Multiply the 1981 gas price by the ratio of the CPI in 2005 to the CPI in 1981.
4-149
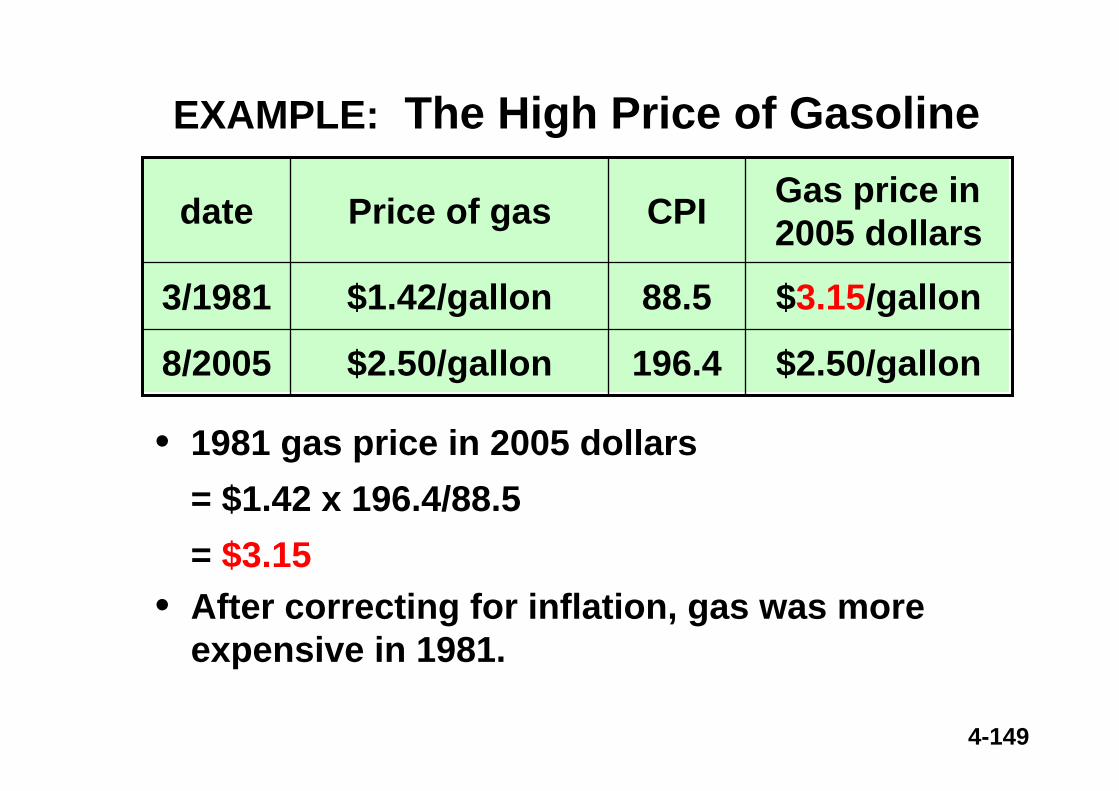
196.4$2.50/gallon8/2005
88.5$1.42/gallon3/1981
CPIPrice of gasdate
EXAMPLE: The High Price of Gasoline
• 1981 gas price in 2005 dollars= $1.42 x 196.4/88.5= $3.15
• After correcting for inflation, gas was more expensive in 1981.
$2.50/gallon
$3.15/gallon
Gas price in 2005 dollars
4-150
Correcting Variables for Inflation:Indexation
For example, the increase in the CPI automatically determines¤ the cost-of-living allowances (COLAs) in
many multi-year labor contracts¤ the adjustments in Social Security payments
and federal income tax brackets
A dollar amount is A dollar amount is indexedindexed for inflation for inflation if it is automatically corrected for inflation if it is automatically corrected for inflation
by law or in a contract.by law or in a contract.
4-151
Assignment for Chapter 4 Exercises 5, 6, 7.
Question: How to measure inflation "financially"?
Answer: Yields of TIPS "minus" Yields of regular treasury securities
Note that TIPs are Treasury Inflation Protected Securities. Investors may purchase TIPs at http://www.publicdebt.treas.gov/sec/seciis.htm
4-152
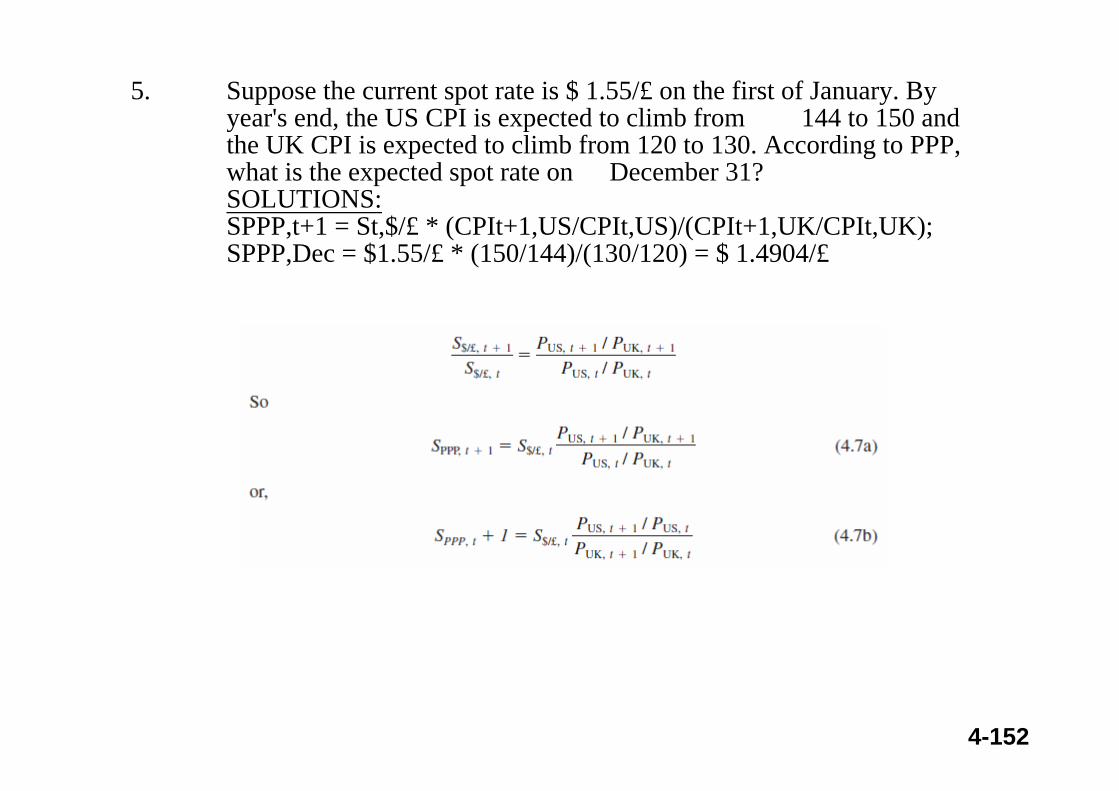
5. Suppose the current spot rate is $ 1.55/£ on the first of January. By year's end, the US CPI is expected to climb from 144 to 150 and the UK CPI is expected to climb from 120 to 130. According to PPP, what is the expected spot rate on December 31? SOLUTIONS:SPPP,t+1 = St,$/£ * (CPIt+1,US/CPIt,US)/(CPIt+1,UK/CPIt,UK);SPPP,Dec = $1.55/£ * (150/144)/(130/120) = $ 1.4904/£
4-153
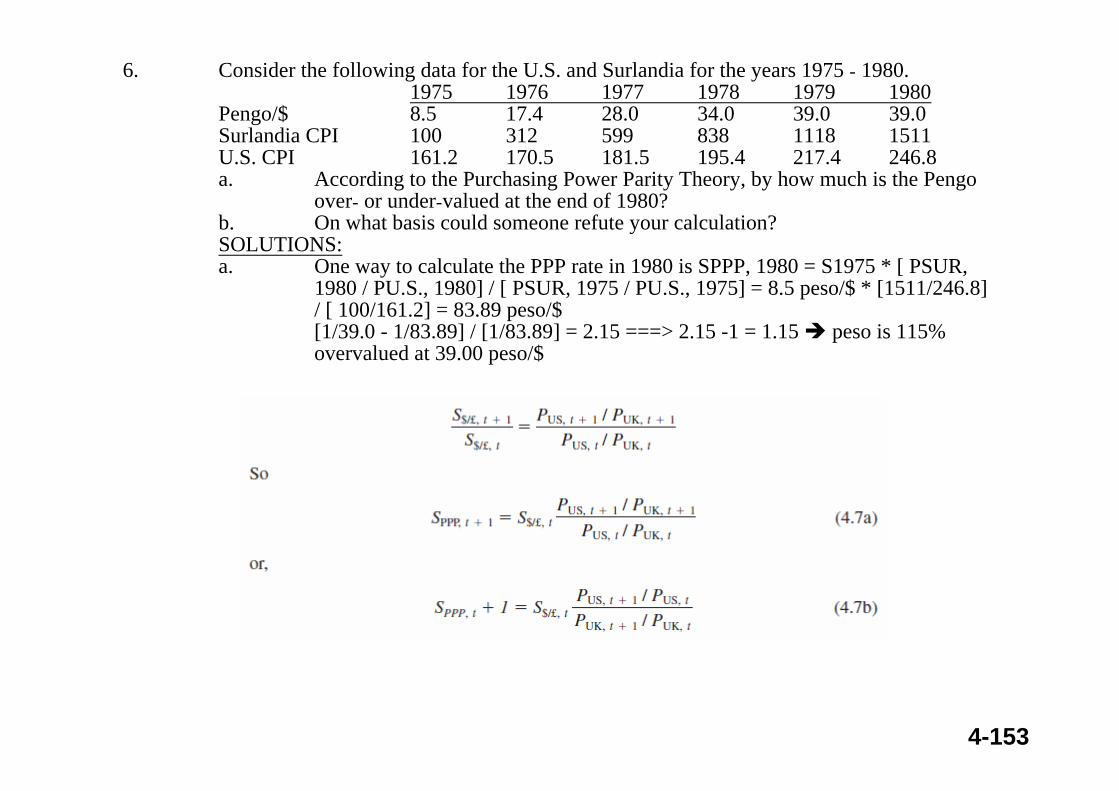
6. Consider the following data for the U.S. and Surlandia for the years 1975 - 1980.1975 1976 1977 1978 1979 1980
Pengo/$ 8.5 17.4 28.0 34.0 39.0 39.0Surlandia CPI 100 312 599 838 1118 1511U.S. CPI 161.2 170.5 181.5 195.4 217.4 246.8a. According to the Purchasing Power Parity Theory, by how much is the Pengo
over- or under-valued at the end of 1980?b. On what basis could someone refute your calculation?SOLUTIONS:a. One way to calculate the PPP rate in 1980 is SPPP, 1980 = S1975 * [ PSUR,
1980 / PU.S., 1980] / [ PSUR, 1975 / PU.S., 1975] = 8.5 peso/$ * [1511/246.8] / [ 100/161.2] = 83.89 peso/$[1/39.0 - 1/83.89] / [1/83.89] = 2.15 ===> 2.15 -1 = 1.15 peso is 115% overvalued at 39.00 peso/$
4-154
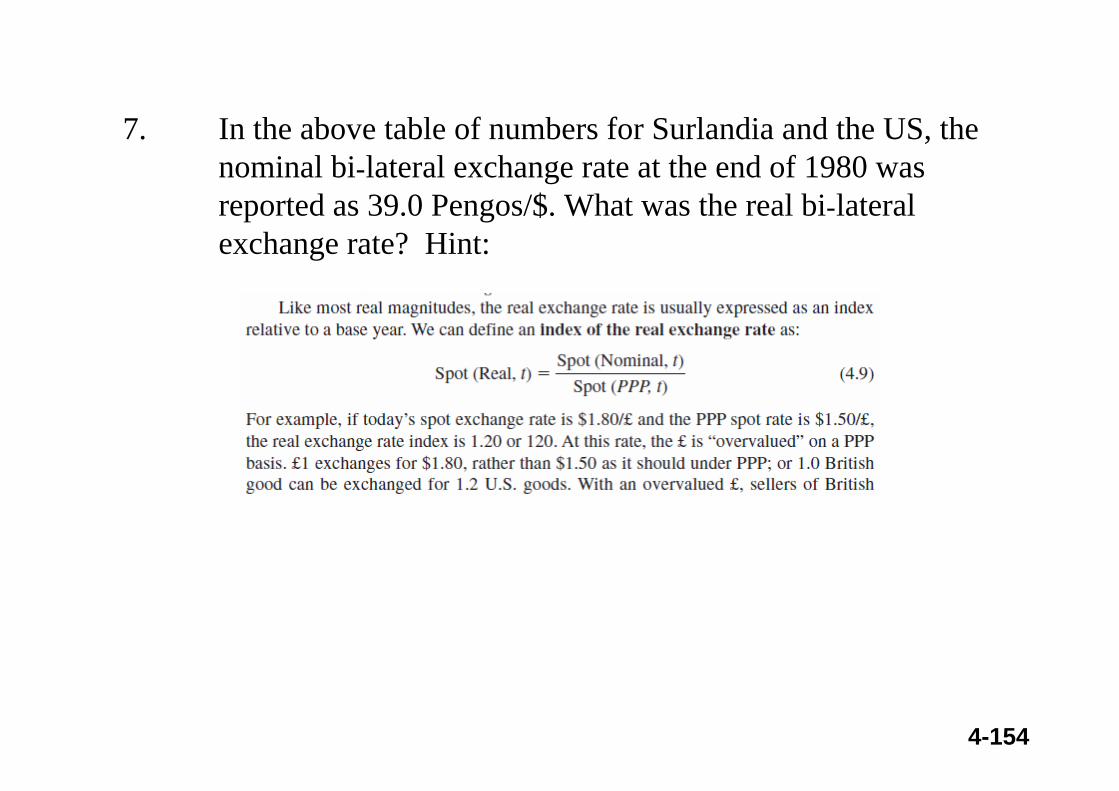
7. In the above table of numbers for Surlandia and the US, the nominal bi-lateral exchange rate at the end of 1980 was reported as 39.0 Pengos/$. What was the real bi-lateral exchange rate? Hint: