Embed Size (px)
Citation preview

AFRL-IF-RS-TR-2004-17 Final Technical Report January 2004 COURSE OF ACTION SIMULATION, TESTING, EVALUATION AND REVISION (COASTER) University of Massachusetts Sponsored by Defense Advanced Research Projects Agency DARPA Order No. J647, J775
APPROVED FOR PUBLIC RELEASE; DISTRIBUTION UNLIMITED. The views and conclusions contained in this document are those of the authors and should not be interpreted as necessarily representing the official policies, either expressed or implied, of the Defense Advanced Research Projects Agency or the U.S. Government.
AIR FORCE RESEARCH LABORATORY INFORMATION DIRECTORATE
ROME RESEARCH SITE ROME, NEW YORK

STINFO FINAL REPORT
This report has been reviewed by the Air Force Research Laboratory, Information Directorate, Public Affairs Office (IFOIPA) and is releasable to the National Technical Information Service (NTIS). At NTIS it will be releasable to the general public, including foreign nations. AFRL-IF-RS-TR-2004-17 has been reviewed and is approved for publication. APPROVED: /s/ JOSEPH A. CAROLI Project Engineer FOR THE DIRECTOR: /s/ JAMES W. CUSACK, Chief Information Systems Division Information Directorate
REPORT DOCUMENTATION PAGE Form Approved OMB No. 074-0188
Public reporting burden for this collection of information is estimated to average 1 hour per response, including the time for reviewing instructions, searching existing data sources, gathering and maintaining the data needed, and completing and reviewing this collection of information. Send comments regarding this burden estimate or any other aspect of this collection of information, including suggestions for reducing this burden to Washington Headquarters Services, Directorate for Information Operations and Reports, 1215 Jefferson Davis Highway, Suite 1204, Arlington, VA 22202-4302, and to the Office of Management and Budget, Paperwork Reduction Project (0704-0188), Washington, DC 20503 1. AGENCY USE ONLY (Leave blank)
2. REPORT DATEJANUARY 2004
3. REPORT TYPE AND DATES COVERED Final May 99 – May 03
4. TITLE AND SUBTITLE COURSE OF ACTION SIMULATION, TESTING, EVALUATION AND REVISION (COASTER)
6. AUTHOR(S) Paul R. Cohen/Principal Investigator, David Jensen, Marc Atkin, Zachary Eyler-Walker, Tim Oates, Michael Rosenstein, Zachary Rubenstein, Matthew Schmill, Brent Heeringa, Laura Firoiu, David Westbrook, Gary King, Andrew Hannon
5. FUNDING NUMBERS C - F30602-99-C-0061 PE - 62301E and 62702E PR - CPOF TA - 00 WU - 04
7. PERFORMING ORGANIZATION NAME(S) AND ADDRESS(ES) University of Massachusetts Computer Science Department Experimental Knowledge Systems Laboratory Amherst MA 01003
8. PERFORMING ORGANIZATION REPORT NUMBER N/A
9. SPONSORING / MONITORING AGENCY NAME(S) AND ADDRESS(ES) Defense Advanced Research Projects Agency AFRL/IFSF 3701 North Fairfax Drive 525 Brooks Road Arlington VA 22203-1714 Rome NY 13441-4505
10. SPONSORING / MONITORING AGENCY REPORT NUMBER AFRL-IF-RS-TR-2004-17
11. SUPPLEMENTARY NOTES AFRL Project Engineer: Joseph A. Caroli/IFSF/(315) 330-4205 [email protected]
12a. DISTRIBUTION / AVAILABILITY STATEMENT
APPROVED FOR PUBLIC RELEASE; DISTRIBUTION UNLIMITED.
12b. DISTRIBUTION CODE
13. ABSTRACT (Maximum 200 Words) This effort developed simulation, visualization and evaluation technology for air campaign planning. A simple war game called Capture the Flag was used to build and evaluate military Courses of Action based on the developed technology. The Capture the Flag system comprises a simulator, a control architecture, and a planner. The system provides graphical user interfaces for users to observe and participate in war games. A variety of visualizations, instrumentation, and other software support the execution and analysis of experiments. Dynamic maps were developed to visualize the results of hundreds of Monte Carlo simulation trials. This visualization technique, referred to as probabilistic dynamic mapping, relates dynamical properties of a war game to the probability of winning the game. A method for unsupervised clustering of univariate, categorical time series was also developed. This method is referred to as Bayesian Clustering by Dynamics.
15. NUMBER OF PAGES14. SUBJECT TERMS Probabilistic Dynamic Map, Capture the Flag, Monte Carlo Simulation, Course of Action, Bayesian Clustering by Dynamics 16. PRICE CODE
17. SECURITY CLASSIFICATION OF REPORT
UNCLASSIFIED
18. SECURITY CLASSIFICATION OF THIS PAGE
UNCLASSIFIED
19. SECURITY CLASSIFICATION OF ABSTRACT
UNCLASSIFIED
20. LIMITATION OF ABSTRACT
UL
NSN 7540-01-280-5500 Standard Form 298 (Rev. 2-89) Prescribed by ANSI Std. Z39-18 298-102
36
i
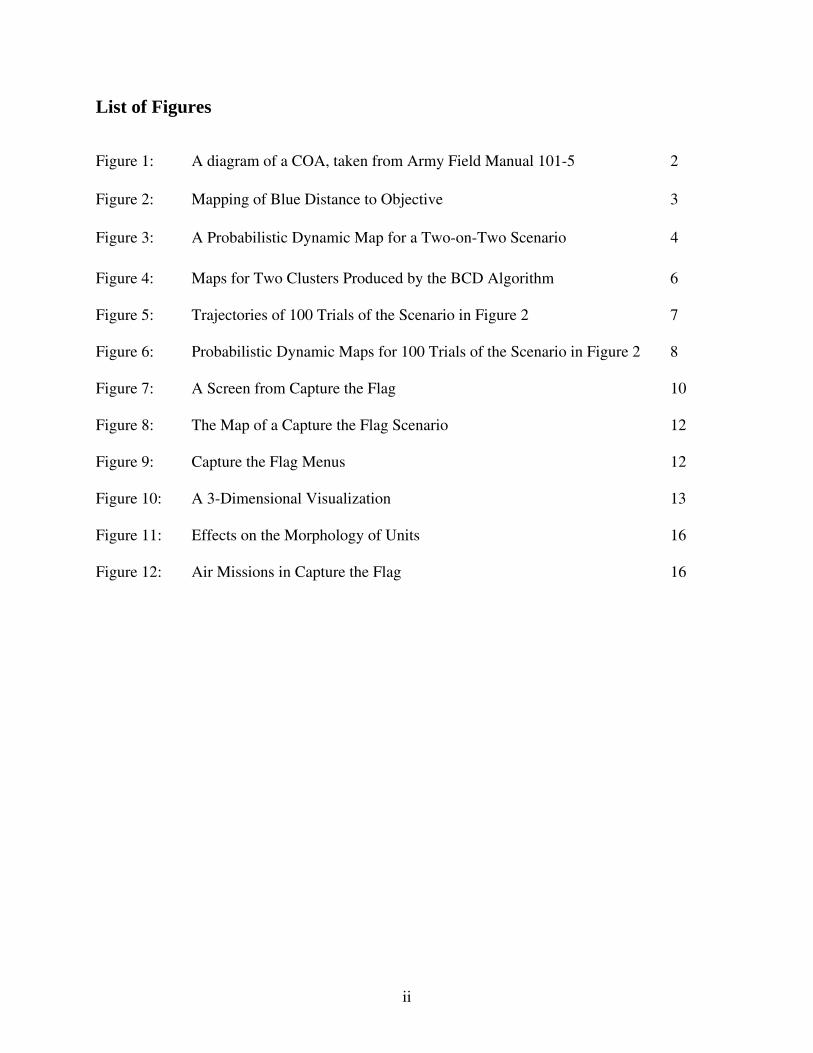
Table of Contents
Executive Summary 1
1. Visualizations of Battlefield Dynamics 1
1.1 Probabilistic Maps 3
1.2 Clustering by Dynamics 5
1.3 Maps for Complex Scenarios 6
1.4 Nearest-neighbor clustering 8
2. Capture the Flag 10
2.1 How Capture the Flag appears to players 11
2.2 The Major Components of Capture the Flag 13
2.3 Types and Attributes of Units 14
2.4 Tactics and other behaviors 15
2.5 Air Power in Capture the Flag 16 3. Technical Developments by Year 17
3.1 Technical Results Year 1 17
3.2 Technical Results Year 2 17
3.3 Technical Results Year 3 18
3.4 Technical Results Year 4 20
4. Products 20
5. Publications, Reports and Articles 22
6. Invited and Contributed Presentations 30
ii
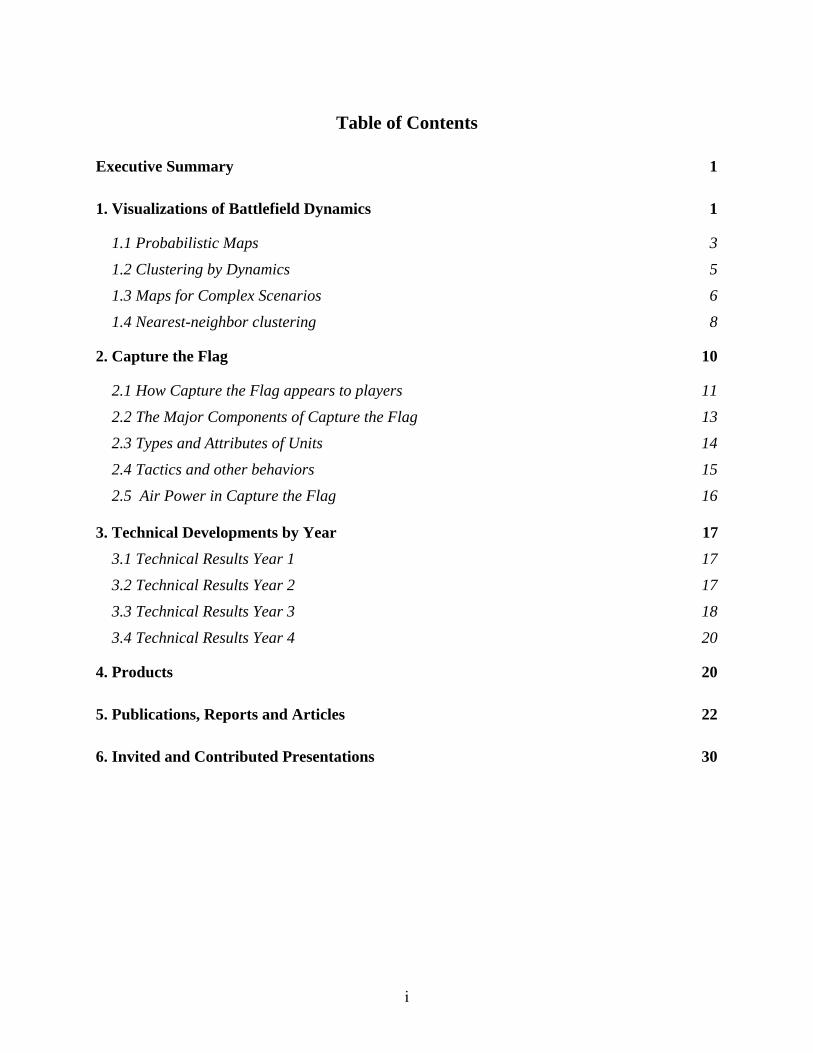
List of Figures
Figure 1: A diagram of a COA, taken from Army Field Manual 101-5 2
Figure 2: Mapping of Blue Distance to Objective 3
Figure 3: A Probabilistic Dynamic Map for a Two-on-Two Scenario 4
Figure 4: Maps for Two Clusters Produced by the BCD Algorithm 6 Figure 5: Trajectories of 100 Trials of the Scenario in Figure 2 7 Figure 6: Probabilistic Dynamic Maps for 100 Trials of the Scenario in Figure 2 8 Figure 7: A Screen from Capture the Flag 10 Figure 8: The Map of a Capture the Flag Scenario 12 Figure 9: Capture the Flag Menus 12 Figure 10: A 3-Dimensional Visualization 13 Figure 11: Effects on the Morphology of Units 16 Figure 12: Air Missions in Capture the Flag 16
1
Executive Summary With support from the ARPA/RL Planning Initiative (ARPI) we developed simulation, visualization and evaluation technology for Air Campaign Planning. We produced the Air Campaign Simulator (ACS) and demonstrated it in scenarios involving Korea, Tunisia, and the Persian Gulf (Holmes, 1995). A valuable innovation of ACS was a representation of centers of gravity to support target systems analysis. In 1995 we developed the theory that reasoning involves concepts that are grounded in physical action or are metaphorical extensions of physical concepts (Cohen, 1997; Cohen et al., 1997; Johnson, 1987). Supported by HPKB, we showed how concepts in Cyc’s base-level ontology are composed from primitives that represent physical actions (Cohen, 1998, Cohen and Oates, 1998). We developed representations based in dynamics, instead of the state-based representations common in AI (Bradley and Easley, 1997; Campbell and Bobick, 1995). We started to think of land campaigns in terms of the dynamics of the battlefield, the ebb and flow of influences, the ability to move and apply force (Rosenstein and Cohen, 1998). One consequence of this change in perspective is that we now have algorithms to search forward in a continuous battlespace. We need not discretize continuous space and time – a perilous process – but instead we can look forward in space and time for tactically advantageous situations. In 1997 we built a simulation of physical behavior called AFS, the Abstract Force Simulator (see Section B5). The basic units in AFS have physical attributes such as mass, inertia, and friction (Atkin et al., 1998). It is easy to add other layers of attributes to specialize these units to a particular domain, in particular, simulations of movements and engagements between forces. Capture the Flag (CTF) is a simple war game in which the basic physical units have the attributes of military units: the ability to inflict and absorb damage, the ability to move, consumption of resources, and so on. The overall plan was to use the Abstract Force Simulator (AFS) and CTF developed at Umass to build and evaluate military courses of action (COAs). Finer granularity (e.g., vehicle movements in ModSAF) is not appropriate for COA evaluation. The units we implemented are automata capable of limited reactive intelligence. This means the commander controls their activities at the macro level (e.g., telling them to attack a site) and the units figure out micro-control issues such as path planning. The two main thrusts of the completed work are visualization and clustering of battlefield dynamics, and building realistic models of operational combat for Capture the Flag.
1. Visualizations of Battlefield Dynamics
Military planners sketch courses of action in a stylized way illustrated in Figure 1. The icons represent units and the tactical engagements between them. Other icons represent terrain, such as mountains. Lines represent natural boundaries, roads, and areas of responsibility. Phase lines

2
(denoted PL) are places that units meet or otherwise adjust the timing of their operations. Although this kind of diagram represents the commander’s intent – what he or she expects to happen – it clearly does not represent what actually happens when units move and engage.
Figure 1. A diagram of a course of action, taken from Army Field Manual FM 101-5.
To grasp the dynamics of courses of action such as the one in Figure 1, the commander’s staff engages in war games. These laborious, manual exercises typically explore only a tiny fraction of the space of possible tactical situations. This is why we developed the Capture the Flag system. Like a “chess master in a box” that you can buy at any games store, Capture the Flag includes a powerful algorithm for playing war games, as well as a simulation of the dynamics of military engagements. Humans can play against Capture the Flag, or the system can play itself, or it can follow – more or less strictly – plans supplied by humans. In this way, military courses of action can be explored in Monte Carlo simulation against an intelligent adversary.
The problem is to visualize the results of hundreds of Monte Carlo trials, each of which is a lengthy time series of a vector of state variables, so as to inform the commander of the strengths and weaknesses of a course of action. Following an introduction to the Capture the Flag system, we will describe a visualization of the dynamics of simulated courses of action. This visualization, called a probabilistic dynamic map, relates dynamical properties of a war game to the probability of winning the game. Sometimes, a game produces clusters of outcomes that are so qualitatively different that they should be visualized separately. We describe an algorithm for finding these clusters automatically. We developed dynamic maps to visualize the variable dynamics of Monte Carlo trials in Capture the Flag, as well as the behavior of mobile robots and the semantics of verbs [5]. State variables are measures of situations such as locations and velocities of units, force ratios, attrition rates, and so on. A trajectory is a time series of the vector of one or more state variables. Each simulation of a course of action generates a trajectory. A map is an overlay of dozens or hundreds of trajectories. A map for a course of action is an overlay of trajectories for that course of action. Said differently, a map is a compilation of many experiences executing a course of action. For example, Figure 2a shows ten engagements between a Blue unit that is trying to capture a Red flag and a Red unit that is trying to defend its flag. Ten trajectories of a single

3
state variable – distance between the attacking Blue unit and the Flag – are shown. The colors denote who won the engagement; Red successfully defended its flag six times. Games tend to cluster into a handful of qualitatively different engagements. Figure 2a shows two distinct ways that Red can win (corresponding to blocking Blue – the squiggly lines – and directly engaging and attritting Blue, the straight red lines), and one way in which Blue can win (corresponding to a direct engagement that attrits Red).
1.1 Probabilistic Maps
If one colors trajectories by outcomes and lays a grid over the map, as in Figure 2a, then the proportion of trajectories of a given color in a given grid cell is an estimate of the probability of the corresponding outcome given that the trajectory enters that cell. More formally, let x and t be a state variable and time, respectively, and let the coordinate x,t define a cell of the map, of some fixed area, centered on the point x,t. Then the probability of an outcome, such as a win, is estimated as
Pr(win | x, t) =number of winning trajectories through x,t
total number of trajectories through x,t .
We can generate a three-dimensional map from coordinates x, t, Pr(win|x,t), as shown in Figure 2b. Every cell on the surface is a probability of a Red win for a trajectory that goes through the cell defined by x,t.
The landscape plot in Figure 2b shows a probabilistic map constructed in this way for 1000 trials in which a Blue unit attacks a Red flag. The blue spot on the surface represents a state of a game; its vertical altitude represents the probability that Red will win in this state. The arrow leaving the blue spot is the most common trajectory leaving that state. You can see that Red is most likely to lose.
Blue distance �to objective
Time
Probability of Red success
Blue distance �to objective
Time
Figure 2 On the left (2a) is a map of ten trajectories, time series of distance to the objective. On the right (2b) is a map of 1000 trajectories, showing the same state variable plotted against the probability of a successful outcome.
The probabilistic map in Figure 2 is “craggy,” not flat or smoothly rising or falling. Sharp slopes on dynamic maps correspond to what commanders call decisive points. These are points or regions where the probability of success changes relatively quickly. The idea of nonlinearity, particularly nonlinear dynamics, is slowly permeating tactical planning centers in the U.S.

4
military, and can be seen as a natural successor to Clausewitz, who revolutionized tactics by viewing warfare as a branch of physics. The surface in Figure 2b appeals to commanders because it provides them an abstract view of the dynamics of the battlefield, one in which dangerous areas for both sides are explicit. Commanders recognize that if they have maps like Figure 2b and their opponents do not, then they have an information advantage that they might exploit by “steering” their opponents into advantageous areas of the map.
As noted, the maps in Figure 2 represent the dynamics of engagements between a single Red and a single Blue unit. Will the same approach work – i.e., produce legible, informative surfaces relating state variables to probabilities of success – for more complex scenarios, such as the one in Figure 2? We have found no analytical answer to this question. In fact, the same approach works well for complex scenarios, as we describe later, yet fails for some simpler ones. For instance, when we changed the scenario for Figure 2 a little, to have two Blue units attack a Red flag defended by two Red units, the resulting map was unreadable. Figure 3 shows a “thresholded” version of the map: As before, the axes represent time and the state variable (although in this case the state variable is the relative strength of the two units) and the cell colors represent probabilities. Red cells represent probabilities of Red wins greater than a threshold value, and blue cells correspond to high probabilities of Blue wins. There is no obvious continuity or pattern relating these probabilities to time and the state variable, as there was in Figure 2.
Figure 3..A probabilistic dynamic map for a two-on-two scenario in which two Blue units try to capture a Red flag defended by two Red units. The state variable (horizontal axis) is the relative strength (or mass) of the units. The vertical axis represents time. The map has been thresholded so all cells with a high probability of win for Blue are colored blue, and similarly for Red. Tactically, the attacking units might concentrate on the flag, or the defending units, or split their efforts between these goals. This tactical variability is one reason that the map is not very informative.
The reason is that the two-on-two situation can unfold in several qualitatively different ways, and when the trajectories for these different dynamics are superimposed in a single map, the result is pretty meaningless. It is as if we tried to visualize the dynamics of several different pieces of music, or normal and irregular heartbeats, or placid and volatile markets, in one map. In any of these cases, we would first group trajectories that have similar dynamics, then build a separate map for each group.
mass differential
time
favors Red favors Blue
5
1.2 Clustering by Dynamics
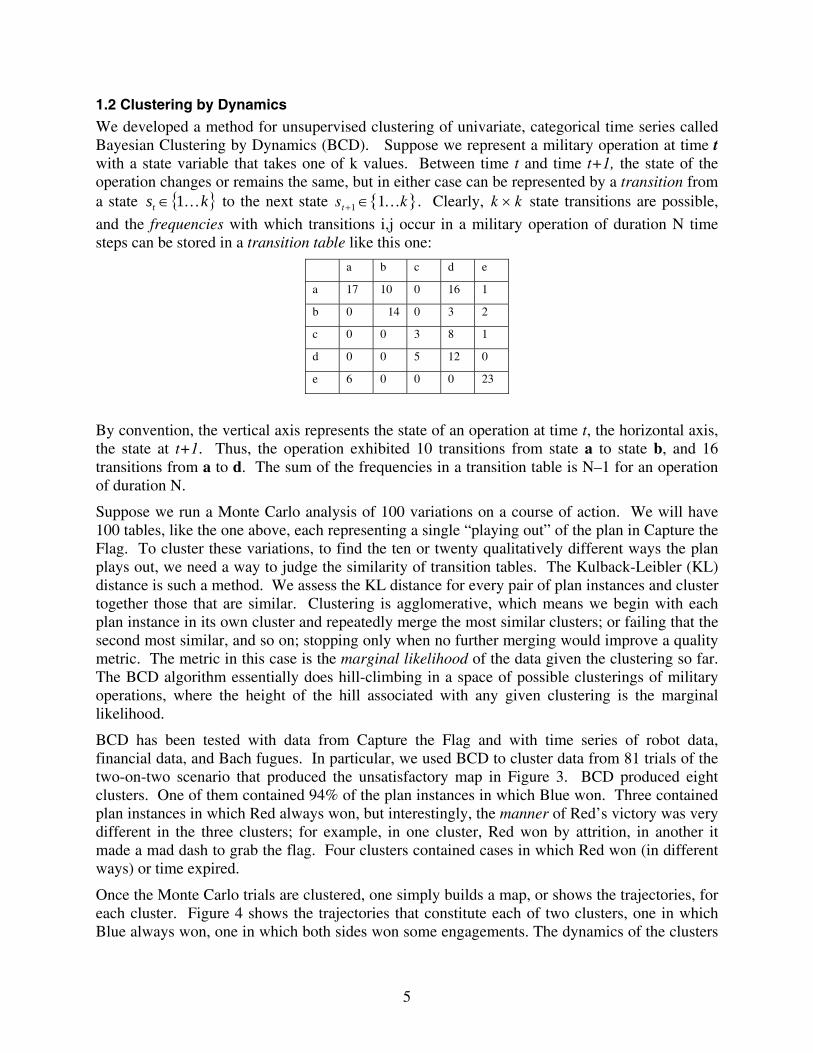
We developed a method for unsupervised clustering of univariate, categorical time series called Bayesian Clustering by Dynamics (BCD). Suppose we represent a military operation at time t with a state variable that takes one of k values. Between time t and time t+1, the state of the operation changes or remains the same, but in either case can be represented by a transition from a state { }kst K1∈ to the next state st+1 ∈ 1Kk{ }. Clearly, k × k state transitions are possible,
and the frequencies with which transitions i,j occur in a military operation of duration N time steps can be stored in a transition table like this one:
a b c d e
a 17 10 0 16 1
b 0 14 0 3 2
c 0 0 3 8 1
d 0 0 5 12 0
e 6 0 0 0 23
By convention, the vertical axis represents the state of an operation at time t, the horizontal axis, the state at t+1. Thus, the operation exhibited 10 transitions from state a to state b, and 16 transitions from a to d. The sum of the frequencies in a transition table is N–1 for an operation of duration N.
Suppose we run a Monte Carlo analysis of 100 variations on a course of action. We will have 100 tables, like the one above, each representing a single “playing out” of the plan in Capture the Flag. To cluster these variations, to find the ten or twenty qualitatively different ways the plan plays out, we need a way to judge the similarity of transition tables. The Kulback-Leibler (KL) distance is such a method. We assess the KL distance for every pair of plan instances and cluster together those that are similar. Clustering is agglomerative, which means we begin with each plan instance in its own cluster and repeatedly merge the most similar clusters; or failing that the second most similar, and so on; stopping only when no further merging would improve a quality metric. The metric in this case is the marginal likelihood of the data given the clustering so far. The BCD algorithm essentially does hill-climbing in a space of possible clusterings of military operations, where the height of the hill associated with any given clustering is the marginal likelihood.
BCD has been tested with data from Capture the Flag and with time series of robot data, financial data, and Bach fugues. In particular, we used BCD to cluster data from 81 trials of the two-on-two scenario that produced the unsatisfactory map in Figure 3. BCD produced eight clusters. One of them contained 94% of the plan instances in which Blue won. Three contained plan instances in which Red always won, but interestingly, the manner of Red’s victory was very different in the three clusters; for example, in one cluster, Red won by attrition, in another it made a mad dash to grab the flag. Four clusters contained cases in which Red won (in different ways) or time expired.
Once the Monte Carlo trials are clustered, one simply builds a map, or shows the trajectories, for each cluster. Figure 4 shows the trajectories that constitute each of two clusters, one in which Blue always won, one in which both sides won some engagements. The dynamics of the clusters

6
are quite different; one can see why superimposing trajectories from these (and the other six clusters) produces an illegible map (Fig. 3).
favors Red favors Blue mass differential
favors Red favors Blue mass differential
Figure 4. Maps for two clusters produced by the BCD algorithm. The state variable, mass differential (horizontal axis), behaves differently over time (vertical axis) in the clusters. On the left, the trial begins with Blue losing mass through attrition relative to Red but in most cases these losses “peak” early and Blue begins to regain ground relative to Red. In three cases, the differential later swings back toward Red, but Blue wins the games anyway. On the right, in nearly all cases, Blue loses mass monotonically throughout the game, and in most cases loses the game.
1.3 Maps for Complex Scenarios
The complex scenario in Figure 2 involves nine Red and nine Blue units with three different kinds of dynamics: mobile units, air cavalry, and artillery; and courses of action that involve at least two tactical phases. To build an informative map for this scenario, we need informative state variables. Because probabilistic maps devote only one of three dimensions to a state variable, it is necessary to design state variables that effectively summarize the entire battle. One, Mass-Near-the-Action (MNTA), is a measure of how much effective mass is concentrated near the center-of-mass (COM) of the opponent. The effective mass of a side is the sum of the effective mass of each of its units, and the effective mass of a unit is its average strength against each of the remaining enemy units. Strength is a unit's mass – roughly, how big it is – multiplied by unit-type effects (for example, artillery has a multiplier of 1.333 against infantry). Thus effective mass combines the masses of the units and the types of the units and the types of the enemy units. MNTA, in turn, is implemented as follows: For one side, say Red, look at each Red unit that is artillery or is close to Blue’s center of mass, and measure the effective mass of each unit against all the Blue blobs that it is close to. (Artillery is assumed to be always “close” to the action because it can operate over long ranges.) Roughly, MNTA measures the degree to which units are engaged with opposing units.
Figure 5 shows the trajectories of MNTA for 100 Monte Carlo trials corresponding to the scenario in Figure 2. Trajectories are colored red if Red forces captured the flag in the south-west corner, blue if the Red forces were disabled by Blue, and green if time expired. MNTA is shown on the vertical axis, time on the horizontal axis. Clearly, Blue won most of the trials. In general, trials begin with Blue MNTA increasing to a maximum value at around time 100, then dropping off as Red and Blue units are destroyed or disabled.

7
Figure 5. The trajectories of 100 trials of the scenario in Figure 2. Blue lines denote Blue victory, red lines, Red victory, and green lines indicate that time expired before either side won. The horizontal axis is time, the vertical axis is MNTA.
Two probabilistic maps of these trials are very informative. Recall that a probabilistic map for an outcome, such as Blue winning, has three coordinates: a state variable, time, and a probability of the outcome given that a trajectory passes through the cell defined by coordinate x,t. An alternative is to calculate and plot the probability of winning if a trajectory does not go through a cell:
Pr(win | not x, t) =number of winning trajectories that don' t go through x, t
number of winning trajectories
Both kinds of map are shown in Figure 6, in which higher probabilities are represented by brighter cells (black cells in Fig. 6a and gray cells in 6b are those which contained no trajectories). The axes of these figures are normalized so that time runs from 0 to 100 (horizontal axis) and so does MNTA (vertical axis). Figure 6a is for the probabilities Pr(win | x,t) and Figure 6b is for Pr(win | not x,t). The former tells much the same story as Figure 6, but the latter shows something surprising: A black cell at time = 15, MNTA = 47.5, corresponding to a zero probability of a Blue win if Blue’s trajectory does not transit that cell. To a military commander, Figure 6b gives a remarkable imperative: Go through this cell, or lose! By avoiding the lighter cells in Figure 6b, the commander can trace out the safer trajectories, because lighter cells correspond to higher probabilities of winning if one’s trajectory doesn’t transit the cell.

8
Figure 6. Probabilistic dynamic maps for 100 trials of the scenario in Figure 2. On the left, brightness of a cell is proportional to the probability of a Blue win given that a trajectory transits that cell. On the right, brightness is proportional to the probability of a Blue win if a trajectory does not transit a cell.
1.4 Nearest-neighbor clustering
The nearest-neighbor technique allows one to take an n-dimensional space of possible decisions and determine where to take actions that will lead to desired outcomes. One possible visualization from this work is a chart where decision boundaries are highlighted with probabilities of outcomes clearly delineated.
Discussion Probabilistic dynamic maps represent probabilities of outcomes given the dynamics of processes. We illustrated the idea by visualizing the probabilities of wins in war games given the dynamics of state variables such as distance to a goal and MNTA, but we suspect the technique is more general. Monte Carlo simulation is a valuable way to explore a state space, but not if one must pore over the trajectories of state variables in every trial. By superimposing these trajectories in a map, and coloring trajectories by outcomes, a great deal of simulation data can be reduced to a surface that represents conditional probabilities of outcomes. As we have seen, one can condition the probabilities on the event that a trajectory passes through a cell, or, as in Figure 6b, on the event that a trajectory passes through some other cell.
Some human art goes into probabilistic dynamic maps, but we are working to automate the process. One trick is to find an informative state variable. By informative we mean the state variable over time is a good predictor of outcomes. Finding informative state variables is a statistical model selection problem. One could easily use regression or Bayes’ networks, or related techniques, to select predictive state variables were it not for the requirement that the

9
state variable over time be predictive. What we need, then, is a characterization of the dynamics of a state variable which can be used as a predictor of outcomes. One way to characterize the dynamics of a variable is to cluster the trajectories of the variable by their dynamics, as described previously, then use the cluster membership of a trajectory as a predictor of the outcome of the trajectory. In a recent experiment, this approach selected “distance from the flag” and “relative mass of Red and Blue units” as the state variables whose dynamics best predict the outcome of the two-on-two scenario described earlier. These results are very preliminary but suggest that one aspect of building probabilistic maps might be automated.
Another kind of automation is provided by the BCD algorithm. Maps can be difficult to interpret when several qualitatively different dynamics are superimposed (Fig. 3), but finding qualitatively different trajectories by hand is tedious, error-prone work. The BCD algorithm saves us the trouble. It clusters trajectories with similar dynamics, so when we plot maps for each cluster, the dynamics are much clearer (Fig. 4).
It is equivocal whether maps would be more legible, informative, and acceptable to military experts if they did away with the time dimension. Phase portraits, which physicists use to visualize dynamics, usually plot a state variable x at time t against x at t+i, so time becomes implicit and relative, but transitions from state to state are clearer. For some aspects of war games absolute time matters, for others, relative time suffices. Phase lines (Fig. 1) describe both kinds of time: Some dictate where a unit should be at, say, 1300 hours, others dictate that a unit should not proceed beyond the line until it meets another unit. The explicit time dimension of our current maps makes it easy to represent absolute time constraints, but may create the illusion that an event must happen at an absolute time instead of a relative time. On the other hand, absolute time constraints are difficult to represent in phase portraits.
From the military perspective, the greatest weakness of probabilistic dynamic maps is that they do not tell the commander what he or she should do in a given state. Clearly, if a state is disadvantageous, the commander should move to a better one, but our maps do not specify how the commander should do this. Perhaps the right course is to retreat, perhaps it is to get reinforcements, or seek high ground, or engage the opponent. As time passes and the commander acts, the state of the game changes, so we can see a forward relationship between action and states in every trajectory. What we lack is a backward relationship that tells the commander what he or she should do to effect a transition to a desired state from the current state. Once this problem is solved, probabilistic dynamic maps will be an effective planning tool.
10
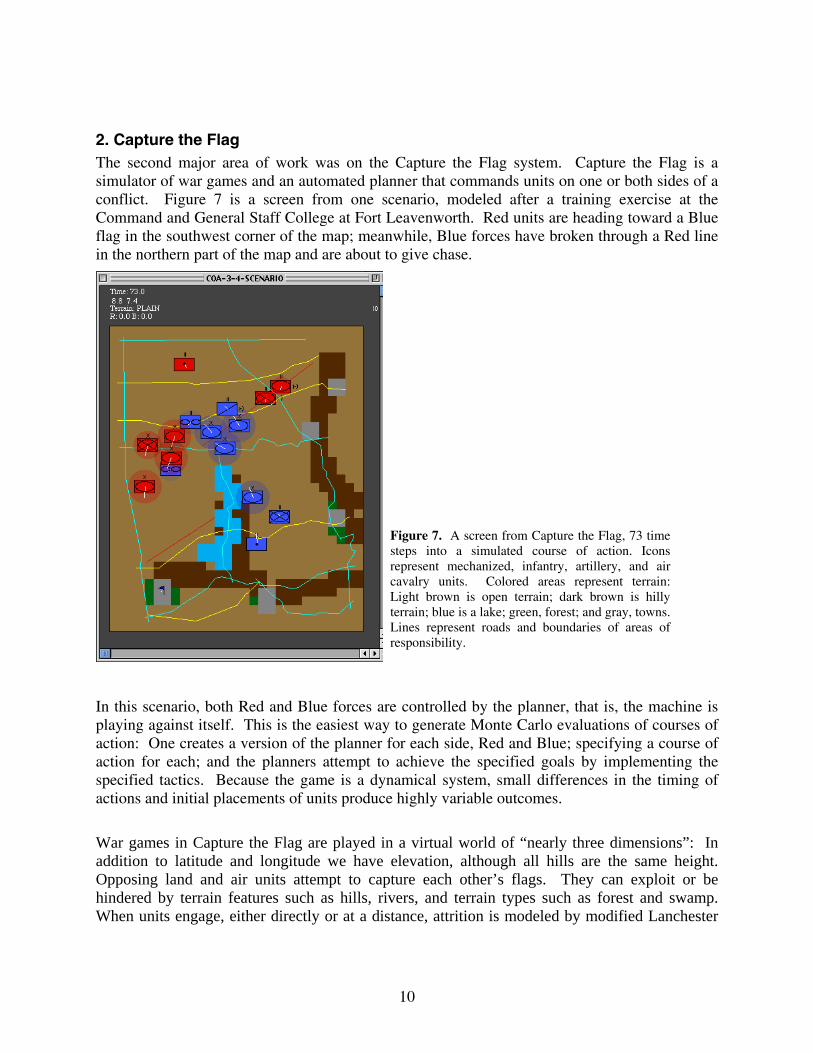
2. Capture the Flag The second major area of work was on the Capture the Flag system. Capture the Flag is a simulator of war games and an automated planner that commands units on one or both sides of a conflict. Figure 7 is a screen from one scenario, modeled after a training exercise at the Command and General Staff College at Fort Leavenworth. Red units are heading toward a Blue flag in the southwest corner of the map; meanwhile, Blue forces have broken through a Red line in the northern part of the map and are about to give chase.
Figure 7. A screen from Capture the Flag, 73 time steps into a simulated course of action. Icons represent mechanized, infantry, artillery, and air cavalry units. Colored areas represent terrain: Light brown is open terrain; dark brown is hilly terrain; blue is a lake; green, forest; and gray, towns. Lines represent roads and boundaries of areas of responsibility.
In this scenario, both Red and Blue forces are controlled by the planner, that is, the machine is playing against itself. This is the easiest way to generate Monte Carlo evaluations of courses of action: One creates a version of the planner for each side, Red and Blue; specifying a course of action for each; and the planners attempt to achieve the specified goals by implementing the specified tactics. Because the game is a dynamical system, small differences in the timing of actions and initial placements of units produce highly variable outcomes. War games in Capture the Flag are played in a virtual world of “nearly three dimensions”: In addition to latitude and longitude we have elevation, although all hills are the same height. Opposing land and air units attempt to capture each other’s flags. They can exploit or be hindered by terrain features such as hills, rivers, and terrain types such as forest and swamp. When units engage, either directly or at a distance, attrition is modeled by modified Lanchester

11
equations. In addition, the dynamics of engagements are influenced by models of psychological factors – fear, morale, fatigue and the like. Opposing units can be controlled by humans or by the GRASP planner1, and a common configuration is for humans to play against GRASP. A natural interface allows human players to direct their units on the battlefield, and the units themselves are capable of intelligent reactive behavior to carry out directives without constant supervision (e.g., one can direct a unit to attack another and it will figure out how best to get there, which formations to adopt, and so on). Tempo strongly influences the outcomes of these games. When human players lose the tempo, GRASP presses its advantage, and a tactical disadvantage quickly spreads to a scenario-wide loss of initiative. The human becomes reactive and eventually loses the game.
2.1 How Capture the Flag appears to players
The setup of a Capture the Flag scenario is shown in Figure 8. One panel of the display is a map with units arrayed in a starting configuration. (Configurations are selected by the system but may be changed before the game begins, to model prepositioning.) The other panel shows the parameters of the game. For instance, one can select the number of flags for each side (Red and Blue); the number of brigades of each of six kinds (Armored, Mech., Light, Medium, Airborne and Air Assault); and the number of battalions in each brigade. One can also take shortcuts and add entire divisions of various kinds, then modify their brigade and battalion structure as desired; or, as shown in the left-hand panel of Figure 9, one can specify each scenario unit individually. The other panel in Figure 9 shows a menu to select map views. The most common kind of view presents the military icons, terrain, roads and rivers, control measures, and other “bird’s eye view” features of the map, but one can see many other visualizations of the scenario, as we will discuss, shortly. Floating in the right-hand panel of Figure 8 is the Control Engine menu. It is used to run and stop the simulation and planner; single-step them; take a snapshot so one can replay a game from that situation; restore a situation; and zoom in or out on the map. Generally, humans cannot think fast enough to win a Capture the Flag game in real time, so they usually let the game run for a while and then stop it for a while.
1 The GRASP (General Reasoning with AbStract Physics) planner adapts Lakoff and Johnson (1987) physical schemas for planning.

12
Figure 8. The map of a Capture the Flag scenario, a menu for specifying the parameters of scenarios, and the “control engine” that runs the simulation and planner.
Figure 9. Menus for specifying the units in a Capture the Flag scenario and for configuring the visualizations presented in the map.

13
2.2 The Major Components of Capture the Flag
The Capture the Flag system comprises a simulator (AFS), a control architecture (HAC), and a planner (GRASP). In addition, the system provides GUIs for humans to observe and participate in war games, a variety of visualizations, and instrumentation and other software support to conduct and analyze experiments. One recent GUI is a three-dimensional display shown in Figure 10. When the user clicks on a unit, the display automatically rotates to show the avenues of approach, goals, and threats to the unit.
Figure 10. A 3-dimensional visualization. Clicking on a unit causes the display to rotate to an angle that best shows avenues of approach, the chosen trajectory, and targets and threats relevant to the unit. Playing against the system. A typical experience with Capture the Flag begins with the user designing a scenario, then directing his units (Blue, say) against those of the system. The game plays out in the Abstract Force Simulator (AFS), the dynamical analog of a chessboard. The simulator implements the models that make Capture the Flag realistic; models of movement; terrain; visibility, reconnaissance and sighting; attrition; and mental attributes such as fatigue and morale. Monte Carlo analysis of COAs. Alternatively, a human may supply a course of action (COA) and direct Capture the Flag to use it to direct, say, Blue units in war games against the GRASP planner. Monte Carlo experiments involve fighting numerous games with roughly the same COA. When a human player directs a unit to, say, attack another, the Hierarchical Control Architecture (HAC) takes care of the details:
• HAC finds the best route for the unit to follow, • It avoids obstacles on the route and reroutes units dynamically

14
• It manages attacks and maneuvers • It transforms units into different formations as the tactical situation and the terrain require. • HAC also implements the “eyes and ears” of units, and passes information among units.
The movements of opposing forces (Red, say) are determined by the GRASP planner, which coordinates the efforts of its units, directs them against Blue units and flags, and defends terrain features and flags. Just as human directives are managed by HAC and play out in AFS, so with GRASP’s directives.
2.3 Types and Attributes of Units
Capture the Flag provides land and air combat units of the following types: Tank, Mechanized Infantry, Light Infantry, Cavalry, Artillery, and Aviation. The smallest units in Capture the Flag are battalions, the largest, divisions. Unlike MODSAF, for example, our Abstract Force Simulator does not model the movements of individual vehicles, but rather, treats entire units as deformable “blobs.” The shapes of blobs change in response to terrain and tactical requirements. We take Clausewitz’s physical metaphors very seriously, so the most primitive attributes of units are physical attribute: mass, density, shape, velocity, resilience, and elasticity. The Abstract Force Simulator (AFS) determines how these attributes change over time in such a way as to model warfare. For example,
• One effect of attrition is to reduce the mass of a unit; attrition can also change the density of the unit (the distribution of its mass within its boundary), or its shape.
• Formations and to some extent maneuvers involve changing shape. Units can adopt columnar and frontal formations, as well as wedge (one up, two back) and “V” (two-up, one back) formations. They can change formation while moving, and while engaged, though in the latter case the process may be slower.
• The velocity of a unit depends on its shape (formation), the kind of terrain it must traverse, what kind of unit it is (e.g., infantry are faster than tank units in wooded terrain), whether it is in combat, and which tactical maneuver it is following (e.g., units move more slowly when they share an avenue of approach).
• When units “dig in,” their resilience increases; resilience is resistance to attrition. • The elasticity of a unit is the propensity for another unit to “bounce off” it. Some tactical
situations require units to “absorb” others; for example, a favorite of Sun Tsu’s involves absorbing an assault, allowing it to penetrate, then collapsing in on the incoming units.
In addition to these physical attributes of units, we model mental attributes such as morale, fatigue, and uncertainty. Crucially, AFS implements mutual dependencies between physical and mental attributes. Thus, attrition reduces morale, and low morale reduces the ability of a unit to inflict attrition on other units. This particular mutual dependency can lead to a downward spiral in which a unit becomes progressively more damaged, demoralized and unable to fight back. Visibility. Units have limited sensors, and limited knowledge of the battlefield. A unit becomes visible to another only when air reconnaissance spots it, or when the units make visual contact.

15
Units may hide in woods or behind hills. When humans play against the system, they may select an omniscient view of all units (we call this cheating) or they see only those opposing units that have been sighted.
2.4 Tactics and other behaviors
The behaviors of units range from low-level physical adjustments (e.g., changing formation) to movement and bringing fire, to tactical plans such as passage of lines, to emergent behaviors such as the downward spiral of demoralization mentioned earlier. We have implemented several tactical plans:
• For ground units: Move to a location, occupy (defend) a location, retain a flag, block, follow and assume, follow and support, forward passage of line, direct attack, indirect attack (e.g., by artillery).
• For aviation units, reconnaissance, interdiction, close air support, and establishment of air superiority.
We are constantly implementing other tactical plans; those on the agenda include flank attack, envelopment and double envelopment; and hasty and moving defenses. Many factors affect behavior, and thus the outcomes of tactical plans. For example, suppose unit A attacks unit B, what will happen? It depends on these and other factors:
• The relative masses of A and B (big units tend to win), and the types of the units; • The terrain on which they engage and the types of the units (e.g., tanks do poorly against
infantry in wooded terrain); • B’s degree of entrenchment; • The time it takes A to move to B (this affects B’s entrenchment and A’s level of fatigue),
which depends on terrain and the type of unit A; • Whether or not A surprises B (surprise acts as a multiplier on attrition), which itself
depends on whether A is visible to B; • The morale and fatigue levels of A and B • The formations of A and B
Blobology. Many tactical plans exploit geometry, for example, flank attacks require exposed flanks. Originally, all units in Capture the Flag were circles, and they maintained this shape in all conditions, making it difficult to implement tactical plans. Now, however, units change shape in response to terrain features (e.g., squeezing through a pass), tactical requirements (e.g., moving in column), and combat situations (e.g., a wedge formation may be deformed by contact with the enemy). Some examples are shown in Figure 11. We worked on the blobology model in CTF with specific emphasis on the integration with the current attrition and movement models in CTF. Depending on the specific shape of a blob attrition rates during an engagement will vary to simulate the effects of a military unit a being in a particular formation (i.e., delta, line, column). This works in a similar way for rates of movement.

16
Figure 11. Effects on the morphology of units. From left: A unit compressed by a lake; a unit squeezing through a narrow defile between a lake and an impassable area; a wedge formation moving east, deformed by the lake and impassable area; a unit moving in column.
2.5 Air Power in Capture the Flag
In earlier contracts with AFRL we developed a model of air power and an Air Campaign Simulator. This model was ported to Capture the Flag. Because the air war happens much faster than the land war, we do not run the both in the same simulation environment. To do so would slow things down enormously because land units need to be updated much less frequently than air units, and checking each land unit at the rate appropriate for air units is wasteful. One exception is attack helicopters, which move relatively slowly and are implemented in Capture the Flag. A screen shot for the air component of Capture the Flag is shown in Figure 12.
Figure 12. Air missions in Capture the Flag. Four mission types are supported: Air Superiority, close air support, reconnaissance, and interdiction.

17
3. Technical Developments by Year
3.1 Technical Results Year 1
For the Capture the Flag simulator we augmented the military unit, terrain and combat models to add the features necessary to provide a realistic baseline capability. Examples of this augmentation of the models include adding differential units speeds in the variety of terrain, differential combat attrition effects depending on terrain, varying entrenchment rates depending on terrain, and elevation effects on combat attrition and sighting. Also included in the new model is an enhanced “fog-of-war” system that includes differential sighting distances, terrain and elevation effects, sighting on fire and last-time-sighted based unit positions. The interface was enhanced to show the positions of units based on the fog-of-war model when this is appropriate. We also started building the defeat modeling mechanisms based on our discussions with General Holcombe. The plan at this point was to develop the models independently from Capture the Flag and run a series of experiments to test their validity. Integration into CTF will be the final phase of this work.
3.2 Technical Results Year 2
For the visualization effort we worked on smoothing surfaces to help remove noise in an attempt to discover the actual features of the scenario. We are also working on extending the existing data collection to more complex scenarios (e.g., more blobs on either team; more complex planning, timing, etc.). We investigated methods for building formal models for particular physical engagement strategies/schemas (e.g., gap model). This work was moving us in the direction of finding relations between these physical engagement schemas (e.g., when you shift from a "head-on attack" to "moving through a pass between enemy forces"). During this phase we had a series of very productive meetings with our source matter expert, General Otstott, where we presented the latest enhancements to the CTF models. This work included a more sophisticated combat terrain effects, an enhanced fog-of-war model, and a better handling of multi-unit formations. General Otstott indicated that while the fog-of-war enhancements contributed positively to the realism of the simulation they fell short of providing the correct sense of lack of information present during an actual battle. After a significant discussion it was decide that we needed to adopt a probabilistic model of unit sighting that took into account unit types, distances and terrain. In addition to solving some of the problems indicated by General Otstott a new probabilistic model would integrate nicely with a possible future air power additions to the simulation. We completed a prototype of the defeat model and successfully integrated it into Capture the Flag. It currently takes models attributes such as courage, fear, health and moral and has as input parameters rates of attrition, style of fighting and isolation. More information is available in the Heeringa paper below Preliminary experimentation indicates that it adds reasonable effects to the

18
outcomes of simulated engagements. We engaged in further study to determine if we had selected a good set of attributes, parameters and effects to model. We developed in CTF a new visualization of combat force we call Force Flow. We simulated the movement of forces into the future taking terrain, the intentions of the agents and the interactions between agents into account. We produced 2D visualizations of the resulting force data and worked briefly on a 3D map-based visualization capability. We also designed a new artillery model in CTF that provides for more realistic control. Artillery are targeted on regions using an implicit spotter. Fire and damage rates are variable depending on the number of rounds previously fired at a region and number of tubes available. Requests for fires will be queued and priorities can be specified. The first phase of a new artillery model which allows artillery units to place fire in a specific geometric area (previously only other units could be targeted). In addition artillery now undergoes a ranging effect where the fire becomes more accurate over time. In the CTF agent control framework, which we refer to as Hierarchical Agent Control (HAC), we implemented actions whose purpose was to take sensor data from one or more sources and produce an interpretation. We call these data combining actions “Abstract Sensors”. Abstract sensors can be used by the machine planner and the human planner to build a high level, composite picture from low-level data. Making an algorithm like Force Flow into an abstract sensor involves specifying who the generators of the lower-level data are, the format of the combined data, and when and exactly how the data will be produced. We did this for Force Flow and integrated this new data source into the machine planner. In the area of improved CTF combat models we began designing an enhanced blobology model in CTF. The new model simulates blobs as a collection of particles connected by spring-like forces. The reason for this effort was a realization that our previous geometrically static modeling of blobs precluded us from simulating a range of interactions between opposing groups of units. Specifically, it was difficult to accurately simulating a penetration or pulling two units apart “at the hinge” unless we could have some form of blob deformability. We enhanced the set of plans currently used by the machine planner to use the new blobology model. We began designing a new layer of plans that involve operational goals like double envelopment and turning a flank. We also built an enhanced defeat mechanism in CTF. The original mechanism used a simple isolation and attrition check. The enhanced defeat mechanism uses factors like courage, fear, health, morale and warfare style to calculate what we call and “effective fatigue” value. Effective fatigue is combined with state information and modifier functions to produce an overall probability of surrender.
3.3 Technical Results Year 3

19
We added additional functionality to the artillery model that allows artillery units to be placed in direct or indirect support of other units. In addition, added an artillery counter fire model where artillery becomes vulnerable to enemy artillery fire when it fires from the same location for a certain length of time. We worked on the blobology model in CTF with specific emphasis on the integration with the current attrition and movement models in CTF. Depending on the specific shape of a blob attrition rates during an engagement will vary to simulate the effects of a military unit a being in a particular formation (i.e., delta, line, column). This works in a similar for rates of movement. We have also did some studies of the stochastic defeat mechanism in CTF. Our preliminary results lead us towards a conclusion that it is very difficult with this model to determine which parameters are important and that the probabilities being used to determine surrender often combine in undesirable ways. To rectify these problems we have begun investigating a simpler model fore defeat which involves fewer parameters and relies on less “rolls of the dice”. We have also used nearest neighbor techniques to cluster data from simulated battles. This technique allows one to take an n-dimensional space of possible decisions and determine where to take actions that will lead to desired outcomes. One possible visualization from this work is a chart where decision boundaries are highlighted with probabilities of outcomes clearly delineated. The first version of the blobology model in CTF was completed. We tested this model with a static defense scenario in order to calibrate the attrition and movement models. We initiated a competition where different sub-groups in the lab compete against one another to build plans for different types of scenarios. The first scenario is the static defense scenario where the red force is defending a fixed objective with a smaller force than the blue force. For the sake of simplicity we did not include artillery plans in this initial phase of the competition. For the second phase of this competition we tackled a meeting engagement style scenario and will be including artillery plans. As part of the plan competition started using Tapir to write plans in CTF. Tapir is a semi-declarative agent control language that was developed by us for the RKF project. Tapir has constructs for defining agents, sensors, actions, and messages. It has mechanisms for handling multiple agents, re-sources, concurrent actions, debugging and instrumentation. Tapir is built upon and extends the Hierarchical Agent Control (HAC) architecture. The work on nearest neighbor techniques for clustering data from simulated battles was completed. Nearest neighbor queries on R-trees use a number of pruning techniques to improve the search. We examined three common 1-nearest neighbor pruning strategies and generalized them to k-nearest neighbors. This generalization clears up a number of prior misconceptions. Specifically, we showed that the generalization of one pruning technique, referred to as strategy 2, is non-trivial and requires the introduction of a new algorithm we call promise-pruning. In addition, we showed that, contrary to other claims, applying this generalized strategy to k-nearest neighbor queries results in a theoretically better search. This discovery is reinforced with empirical results showing the success of promise-pruning on both random and real-world data.

20
Enhancements were made to the AFS and HAC event systems that allowed us to explicitly model events - both exogenous and internal coordination events. This provides the action/plan designer the ability to build more sophisticated temporal coordination schemes. This work is leading towards a fully realized planning language where plans and actions can be written to handled opportunistic events that occur during the execution of a prescribed action. Along similar lines we also worked with Lieutenant General (US Army Retired) Charles Otstott to develop realistic actions and plans for the CTF simulator. We adapted scenarios from our previous HPKB work – scenarios from the Kansas area involving division size units – and augmented these scenarios with better planning for the agent and the adversary.
3.4 Technical Results Year 4
We ported CTF to the new Macintosh operating system OS X. We have also rewritten some of the underlying interface protocols in the simulator to allow us to rapidly prototype different types of interface interaction schemes and visualizations. The new interface context system lets us have graphical user interfaces that alter their appearance and function based on the general domain in which the simulator is operating. For example, in a the default CTF simulation mode the units, terrain and actions are all based on the domain of echelon division level and the GUI reflects this by allowing actions, units and terrain that are appropriate to that domain. However, the underlying simulator can also support a more detailed simulation of – say at the battalion level down to individual squads. In this case the GUI can be tailored to present and allow actions, units and terrain that are appropriate to that level of simulation. We have not yet implemented this more detailed level of GUI in the military domain, but this general framework has been used to transform CTF into a simulation of Robots in an office environment, a simulation of Robots in a infinite two-dimensional plan, a simulation of Rats doing search and rescue operations and a cellular biology simulation.
4. Products Capture the Flag (CTF) is a system for dynamic planning in an adversarial domain. It includes as components the Abstract Force Simulator (AFS), a domain-general simulator of agents applying forces; the Hierarchical Agent Control architecture, an agent control architecture; and a planner. HAC is a general toolkit for designing an action hierarchy. It supports action abstraction, a multi-level computational architecture, sensor integration, and planning. Tapir is a general purpose, semi-declarative agent control language that extends and enhances the HAC. The language is built around constructs that define agents, sensors, actions, and messages. It has mechanisms for handling multiple agents, a flexible resource model, and multiple means for structuring concurrent actions. The following systems and prototypes are available for dissemination:

21
AFS and CTF. POC: David Westbrook, [email protected]. AFS and CTF currently run in Common Lisp. There is a GUI available written in Macintosh Common Lisp. See http://eksl-www.cs.umass.edu/research/ctf. HAC: POC: David Westbrook, [email protected]. AFS and CTF currently run in Common Lisp. See http://eksl-www.cs.umass.edu/research/ctf. Tapir: POC: Gary W. King, [email protected]. Tapir currently runs in Common Lisp. See http://eksl-www.cs.umass.edu/research/ctf.

22
5. Publications, Reports and Articles These documents are available at http://www-eksl.cs.umass.edu/publications.html. Presentations, see http://eksl-www.cs.umass.edu/talks.html Books, or Parts Thereof Liu, Xiaohui, Paul Cohen and Michael Berthold, (Eds.), Advances in Intelligent Data Analysis: Reasoning about Data, Second International Symposium Proceedings, IDA-97, (Lecture Notes in Computer Science, Vol. 1280), Springer-Verlag, 1997. Journal Articles Jensen, David, and Paul R. Cohen . 2000. Multiple Comparisons in Induction Algorithms. Machine Learning, vol. 38, no. 3, pp. 309-338. Abstract. St. Amant, Robert and Paul R. Cohen. 1998. Interaction with a Mixed-Initiative System for Exploratory Data Analysis. Knowledge-Based Systems, Vol. 10, No. 5, pp. 265-273. St. Amant, Robert and Paul R. Cohen. 1998. Intelligent Support for Exploratory Data Analysis. The Journal of Computational and Graphical Statistics, Vol. 7, No. 4, pp. 545-558. Refereed Conference Papers St. Amant, Robert, Christopher Healy, Mark Riedl, Sarat Kocherlakota, David Pegram and Mika Torhola. 2001. Intelligent Visualization in a Planning Situation. International Conference on Intelligent User Interfaces. Atkin, Marc, Gary W. King, David Westbrook, Brent Heeringa, Andrew Hannon and Paul Cohen . 2000. Hierarchical Agent Control: A Framework for Defining Agent Behavior. Proceedings of Fifth International Conference on Autonomous Agents, pp. 425-432. Heeringa, Brent and Paul Cohen. 2000. An Underlying Model for Defeat Mechanisms. Proceedings of Winter Simulation Conference, p. 933. Cohen, Paul R, John Warwick, Gary W. King, Clayton Morrison, Marco Ramoni, and Paola Sebastiani. 2000. Probabilistic Dynamic Maps to Visualize the Dynamics of Monte Carlo Simulations. Submitted to the Journal of Electronic Imaging, Special Section on Visualization and Data Analysis. Atkin, Marc, David L. Westbrook , and Paul R. Cohen .HAC: A Unified View of Reactive and Deliberative Activity .Working Notes of the European Conference on Artificial Intelligence Workshop, Balancing Reactivity and Social Deliberation in Multi-Agent Systems.

23
Sebastiani, Paola, Marco Ramoni, Paul R. Cohen, John Warwick and James Davis. 1999. Discovering Dynamics Using Bayesian Clustering. In Proceedings of the Third Symposium on Intelligent Data Analysis. Atkin Marc S., David L. Westbrook and Paul R. Cohen. 1998. Capture the Flag: Military Simulation Meets Computer Games. Presented at AAAI Spring Symposium on AI and Computer Games, 1999. Cohen, Paul R., Marc S. Atkin and David L. Westbrook. 1998. Capture the Flag: A Continuous, Dynamical Planner. In Working Notes of the AAAI-98 Fall Symposium on Continuous and Dynamic Planning, Orlando FL. Atkin, Marc S., David L. Westbrook, Paul R. Cohen and Gregory D. Jorstad. 1998. AFS and HAC: Domain-General Agent Simulation and Control. Presented at Workshop on Software Tools for Developing Agents, AAAI-98, Madison WI. Cohen, Paul R. 1998. Maps for Verbs. In Proceedings of The Information and Technology Systems Conference, Fifteenth IFIP World Computer Congress. Pp. 21-33. Cohen, Paul R. 1998. Dynamic Maps as Representations of Verbs. In Proceedings of the13th Biennial European Conference on Artificial Intelligence. Pp. 145-149. Cohen, Paul R. and Tim Oates. 1998. A Dynamical Basis for the Semantic Content of Verbs. Presented at the Grounding of Word Meaning: Data & Models Workshop, AAAI-98. Pp. 5-8. Sebastiani, Paola, Marco Ramoni, Paul R. Cohen, John Warwick and James Davis. 1999. Discovering Dynamics using Bayesian Clustering. In Proceedings of The Third Symposium on Intelligent Data Analysis, pp. 199-209. Paul R. Cohen and Mary Litch. 1999. What are contentful mental states? Dretske's theory of mental content viewed in the light of robot learning and planning algorithms. In Proceedings of The Sixteenth National Conference on Artificial Intelligence, pp. 108-113. Rosenstein, Michael T. and Paul R. Cohen. 1999. Continuous Categories for a Mobile Robot . In Proceedings of The Sixteenth National Conference on Artificial Intelligence, pp. 634-640. Oates, Tim, Matthew D. Schmill and Paul R. Cohen. 1999. Efficient Mining of Statistical Dependencies. In Proceedings of the Sixteenth International Joint Conference on Artificial Intelligence, pp. 794-799. Cohen, Paul R. 1998. Maps for Verbs. In Proceedings of The Information and Technology Systems Conference, Fifteenth IFIP World Computer Congress, pp. 21-33. Cohen, Paul R. 1998. Dynamic Maps as Representations of Verbs. In Proceedings of The 13th Biennial European Conference on Artificial Intelligence, pp. 145-149.
24
Piater, Justus H., Paul R. Cohen, Xiaoqun Zhang and Michael Atighetchi. 1998. A Randomized ANOVA Procedure for Comparing Performance Curves. In Proceedings of The Fifteenth International Conference on Machine Learning, pp. 430-438. Schmill, Matthew D., Michael T. Rosenstein, Paul R. Cohen, and Paul Utgoff. 1998. Learning What is Relevant to the Effects of Actions for a Mobile Robot. In Proceedings of the Second International Conference on Autonomous Agents, pp. 247-253. Cohen, Paul R., Marc Atkin, Tim Oates, and Beal, Carole R. 1997. Neo: Learning Conceptual Knowledge by Sensorimotor Interaction with an Environment. In Proceedings of the First International Conference on Autonomous Agents, pp. 170-177. Cohen, Paul R. 1997. Projections as Concepts. In Proceedings of the 2nd European Conference on Cognitive Science, pp. 56-60. Gregory, Dawn E. and Paul R. Cohen. 1997. Integrating Many Techniques for Discovering Structure in Data. In Proceedings of the Second International Conference on Intelligent Data Analysis, pp. 77-88. Jensen, David, Tim Oates and Paul R. Cohen. 1997. Building Simple Models: A Case Study with Decision Trees. In Proceedings of the Second International Conference on Intelligent Data Analysis, pp. 211-222. McGeoch, C.C., Doina Precup and Cohen, Paul R. 1997. How to Find Big-Oh in your Data Set (and How Not To). In Proceedings of the Second International Conference on Intelligent Data Analysis, pp. 41-52. Oates, Tim, Matthew D. Schmill, and Paul R. Cohen. 1997. Parallel and Distributed Search for Structure in Multivariate Time Series. In Proceedings of the Ninth European Conference on Machine Learning, pp. 191-198. St. Amant, Robert and Paul R. Cohen. 1997. Evaluation of a Semi-Autonomous Assistant for Exploratory Data Analysis. In Proceedings of the First International Conference on Autonomous Agents, pp. 355-362. St. Amant, Robert and Paul R. Cohen. 1997. Interaction with a Mixed Initiative System for Exploratory Data Analysis. In Proceedings of the Third International Conference on Intelligent User Interfaces, pp. 15-22. Refereed Workshop and Symposia Papers Atkin, Marc and David Westbrook. 2001. Panel Discussion: Collaboration Between Academia and Industry: A Case Study. Working Notes of AAAI Spring Symposium, pp. 5-6. Atkin, Marc, David L. Westbrook and Paul Cohen . 2000. Domain-General Simulation and Planning with Physical Schemas. Proceedings of Winter Simulation Conference, pp. 464-470.
25
Atkin, Marc and Paul Cohen. 2000. Using Simulation and Critical Points to Define States in Continuous Search Spaces, Proceedings of Winter Simulation Conference, pp. 1730-1738. Heeringa, Brent and Paul Cohen. 2000. An Underlying Model for Defeat Mechanisms. Proceedings of Winter Simulation Conference, p. 933. Heeringa, Brent and Paul Cohen. 2000. An Underlying Model for Defeat Mechanisms. Presented at AAAI Fall Symposium, 2000 Workshop on Simulating Human Agents. St. Amant, Robert. Planning Meets User Interface Design: Affordances, Ibots and PUM s. IUI workshop on Planning for Intelligent User Interfaces, 2000. Atkin, Marc, David L. Westbrook, and Paul R. Cohen. HAC: A Unified View of Reactive and Deliberative Activity .Working Notes of the European Conference on Artificial Intelligence Workshop, Balancing Reactivity and Social Deliberation in Multi-Agent Systems. Firoiu, Laura. 2000. Rule Induction from Noisy Examples. Presented at AAAI Workshop: Learning Statistical Models from Relational Data. Ramoni, Marco, Paola Sebastiani and Paul R. Cohen. 2000. Multivariate Clustering by Dynamics. Proceedings of the Seventeenth National Conference on Artificial Intelligence, pp. 633-638. AAAI Press/The MIT Press: Menlo Park/Cambridge. Oates, Tim, Matthew D. Schmill and Paul R. Cohen. 2000. A Method for Clustering the Experiences of a Mobile Robot that Accords with Human Judgments. Proceedings of the Seventeenth National Conference on Artificial Intelligence, pp. 846-851. AAAI Press/The MIT Press: Menlo Park/Cambridge. Schmill, Matthew D, Tim Oates and Paul R. Cohen. 2000. Learning Planning Operators in Real-World, Partially Observable Environments. Proceedings of the Fifth International Conference on Artificial Intelligence Planning and Scheduling, AI Planning Systems, AAAI Press, pp. 246-253. Cohen, Paul R., Marco Ramoni, and Paola Sebastiani. 2000. Unsupervised Clustering of Robot Activities: A Bayesian Approach. Proceedings of the Fourth International Conference on Autonomous Agents, pp. 134-135. ACM: New York, NY. Oates, Tim, Zachary Eyler-Walker and Paul R. Cohen. 2000. Toward Natural Language Interfaces for Robotic Agents: Grounding Linguistic Meaning in Sensors. Proceedings of the Fourth International Conference on Autonomous Agents, pp. 227-228. ACM: New York, NY. Oates, Tim, Matthew Schmill and Paul R. Cohen. 2000. Identifying Qualitatively Different Outcomes of Actions: Gaining Autonomy Through Learning. Proceedings of the Fourth International Conference on Autonomous Agents, pp. 110-111. ACM: New York, NY.

26
Atkin, Marc, Gary King, David L. Westbrook and Paul R. Cohen . 2000. Some Issues in AI Engine Design. Presented at AAAI Spring Symposium on Artificial Intelligence and Interactive Entertainment. Proceedings of the European Conference on Philosophical Psychology. St. Amant, Robert. Resolving Conflicts in Collaborative Human - Computer Interaction. AAAI Technical Report WS-99-08 (Notes from the Agents' Conflicts workshop.) AAAI Press. 1999. .Pegram, David A, Robert St. Amant, Mark Riedl. An approach to visual interaction in mixed-initiative planning. Paper presented at Mixed-Initiative Intelligence Workshop, AAAI-99 Ramoni, Marco, Paola Sebastiani and Paul R. Cohen. 1999. Bayesian Analysis of Sensory Inputs of a Mobile Robot. Proceedings of the Second European Conference on Highly Structured Stochastic Systems (HSSS-99), Pavia, Italy. Sebastiani, Paola, Marco Ramoni, Paul R. Cohen, John Warwick and James Davis. 1999. Discovering Dynamics using Bayesian Clustering. Proceedings of the Third Symposium on Intelligent Data Analysis. Oates, Tim. 1999. Identifying Distinctive Subsequences in Multivariate Time Series by Clustering. Proceedings of KDD-99, International Conference on Knowledge Discovery and Data Mining, pp. 322-326. Provost, Foster, David Jensen and Tim Oates. 1999. Efficient Progressive Sampling. Proceedings of KDD-99, International Conference on Knowledge Discovery and Data Mining, pp. 23-32. Oates, Tim. 1999. Identifying Qualitatively Different Outcomes of Actions: Experiments with a Mobile Robot. Paper presented at IJCAI-99, Workshop on Robot Action Planning, pp. 30-36. Firoiu, Laura and Paul R. Cohen. 1999. Learning Elements of Representations for Redescribing Robot Experiences. Presented at Third Symposium on Intelligent Data Analysis. Firoiu, Laura and Paul R. Cohen. 1999. Abstracting from Robot Sensor Data using Hidden Markov Models. Proceedings of the Sixteenth International Conference on Machine Learning, pp. 106-114. Sebastiani, Paolo, Marco Ramoni and Paul R. Cohen. 1999. Unsupervised Classification of Sensory Input in a Mobile Robot. Paper presented at IJCAI-99 Workshop on Sequence Learning, pp. 23-28. Rosenstein, Michael T. and Paul R. Cohen. 1999. Continuous Categories for a Mobile Robot. Paper presented at IJCAI-99 Workshop on Sequence Learning, pp. 47-53. Oates, Tim, Laura Firoiu and Paul R. Cohen. 1999. Clustering Time Series with Hidden Markov Models and Dynamic Time Warping. Paper presented at IJCAI-99 Workshop on Sequence Learning, pp. 17-21.

27
Paul R. Cohen and Mary Litch. 1999. What are contentful mental states? Dretske's theory of mental content viewed in the light of robot learning and planning algorithms. Proceedings of the Sixteenth National Conference on Artificial Intelligence, pp. 108-113. Jensen, David, Michael Atighetchi, Regis Vincent and Victor R. Lesser. 1999. Learning Quantitive Knowledge for Multiagent Coordination. Proceedings of the Sixteenth National Conference on Artificial Intelligence, pp. 24-31. Oates, Tim and David Jensen. 1999. Toward a Theoretical Understanding of Why and When Decision Tree Pruning Algorithms Fail. Proceedings of the Sixteenth National Conference on Artificial Intelligence, pp. 372-378. Paul R. Cohen, Vinay Chaudrhi, Adam Pease and Robert Schrag. 1999. Does Prior Knowledge Facilitate the Development of Knowledge-based Systems? Proceedings of the Sixteenth National Conference on Artificial Intelligence, pp. 221-226. Oates, Tim, Matthew D. Schmill and Paul R. Cohen. 1999. Efficient Mining of Statistical Dependencies. Proceedings of the Sixteenth International Joint Conference on Artificial Intelligence, pp. 794-799. Atkin, Marc, David L. Westbrook and Paul R. Cohen. 1999. Capture the Flag: Military Simulation Meets Computer Games. Presented at AAAI Spring Symposium on AI and Computer Games. St. Amant, Robert. 1999. Planning and User Interface Affordances. Proceedings of the Fifth International Conference on Intelligent User Interfaces. Schmill, Matthew D, Tim Oates and Paul R. Cohen. 1998. Learned Models for Continuous Planning . Presented at Uncertainty '99: The Seventh International Workshop on Artificial Intelligence and Statistics, pp. 278-282. Atkin, Marc and Paul R. Cohen. 1998. Physical Planning and Dynamics. In Working Notes of the AAAI Fall Symposium on Distributed Continual Planning, pp. 4-9. Firoiu, Laura, Tim Oates and Paul R. Cohen. 1998. Learning a Deterministic Finite Automaton with a Recurrent Neural Network. In Proceedings of the Fourth International Colloquium on Grammatical Inference, pp. 90-101. Cohen, Paul R. and Tim Oates. 1998. A Dynamical Basis for the Semantic Content of Verbs. In The Grounding of Word Meaning: Data & Models Workshop, AAAI-98, pp. 5-8. Rosenstein, Michael T. and Paul R. Cohen. 1998. Symbol Grounding with Delay Coordinates. In The Grounding of Word Meaning: Data & Models Workshop, AAAI-98, pp. 20-21.
28
Utgoff, Paul E. and Paul R. Cohen. 1998. Applicability of Reinforcement Learning. In Methodology of Applying Machine Learning: Problem Definition, Task Decomposition and Technique Selection Workshop, ICML-98, pp. 37-43. Oates, Tim. David Jensen and Paul R. Cohen. 1998. Discovering Rules for Clustering and Predicting Asynchronous Events. In Predicting the Future: AI Approaches to Time Series Workshop, AAAI-98, pp. 73-79. Atkin, Marc, David L. Westbrook, Paul R. Cohen and Gregory D. Jorstad. 1998. AFS and HAC: Domain-General Agent Simulation and Control. In Workshop on Software Tools for Developing Agents, AAAI-98, pp. 89-95. Cohen, Paul R., and David Jensen. 1997. Overfitting Explained. In Preliminary Papers of the Sixth International Workshop on Artificial Intelligence and Statistics, pp. 115-122. Gregory, Dawn E. and Paul R. Cohen. 1997. Intelligent Assistance for Computational Scientists: Integrated Modeling, Experimentation and Analysis. In Preliminary Papers of the Sixth International Workshop on Artificial Intelligence and Statistics, pp. 231-238. McGeoch, C.C. and Paul R. Cohen. 1997. How to Find Big-Oh in Your Data Set (and How Not To). In Preliminary Papers of the Sixth International Workshop on Artificial Intelligence and Statistics, pp. 347-354. Oates, Tim, Matthew D. Schmill, David Jensen, and Paul R. Cohen. 1997. A Family of Algorithms for Finding Temporal Structure in Data. In Preliminary Papers of the Sixth International Workshop on Artificial Intelligence and Statistics, pp. 371-378. Rosenstein, Michael T., Paul R. Cohen, Matthew D. Schmill, and Marc S. Atkin. 1997. Action Representation, Prediction and Concepts. In AAAI Workshop on Robots, Softbots, Immobots: Theories of Action, Planning and Control. St. Amant, Robert and Paul R. Cohen. 1997. Building an EDA Assistant: A Progress Report. In Preliminary Papers of the Sixth International Workshop on Artificial Intelligence and Statistics, pp. 501-512. Ph.D. Dissertations James T. Oates, 2000. Grounding Knowledge in Sensors: Unsupervised Learning for Language and Planning. Unreferenced Reports, Articles and Editorials King, Gary W. 2001. LIFT - The LIsp Framework for Testing. University of Massachusetts Computer Science Department Technical Report 01-25.

29
Cohen, Paul R., Niall Adams and David Hand. 2001. Finding Patterns that Correspond to Episodes. University of Massachusetts Computer Science Department Technical Report 01-11. Schmill, Matthew and Paul Cohen. 2001. A Motivational System That Drives the Development of Activity . University of Massachusetts Computer Science Department Technical Report 01-12. Cohen, Paul R . 2000. Learning Concepts by Interaction. University of Massachusetts Computer Science Department Technical Report 00-52. Atkin, Marc, David L. Westbrook, Paul R. Cohen. 2000. Planning in Continuous Adversarial Domains. University of Massachusetts Computer Science Department Technical Report 00-17. Cohen, Paul R., James Davis and John Warwick. 2000. Dynamic Visualization of Battle Simulations. University of Massachusetts Computer Science Department Technical Report 00-16. King, Gary and Tim Oates. The Importance of Being Discrete: Learning Actions Through Interaction. University of Massachusetts Computer Science Department Technical Report 00-15. Atkin, Marc S. and Paul R. Cohen. 1999. Searching Continuous State Spaces Effectively Using Critical Points. University of Massachusetts Computer Science Department Technical Report 99-36. Oates, Tim, Zachary Eyler-Walker and Paul R. Cohen. 1999. Using Syntax to Learn Semantics: An Experiment in Language Acquisition with a Mobile Robot. University of Massachusetts Computer Science Department Technical Report 99-35. Cohen, Paul R. 1998. Growing Ontologies. University of Massachusetts Computer Science Department Technical Report 98-20. Schmill, Matthew D. 1998. A Distributed Approach to Finding Complex Dependencies in Data. Computer Science, University of Massachusetts Computer Science Department Technical Report 98-13. Piater, Justus and Paul R. Cohen. 1997. A Randomized ANOVA Procedure for Comparing Performance Curves., University of Massachusetts/Amherst. Dept. of Computer Science, Technical Report 97-41. Oates, Tim, David Jensen and Paul R. Cohen. 1997. Automatically Acquiring Rules for Event Correlation from Event Logs. University of Massachusetts Computer Science Department Technical Report 97-14.
30
6. Invited and Contributed Presentations Paul Cohen attended AAAI-99, IDA-99 and IJCAI-99 where several EKSL papers were presented. He also presented the following talks: “The Mind Reading Problem.” Invited Speaker at AAAI-99 Workshop on Mixed Initiative Intelligence, Orlando, FL. “Data Analysis and the Development of Robot Minds.” Keynote Speaker at the Third Symposium on Intelligent Data Analysis, Amsterdam, the Netherlands. “Fourteen Comments on Empirical Methods.” Invited Speaker at IJCAI-99 Workshop on Empirical AI, Stockholm, Sweden. “Agent Systems: The Semantic Challenge.” Invited Speaker at Dagstuhl Seminar on Agent-Oriented Software Approaches in Distributed Modeling and Simulation: Challenges and Methodologies, Dagstuhl Castle, Germany. “Tots and ‘Bots: The Development of Cognition.” Invited Speaker at the British Computer Society Specialist Group on Applied Artificial Intelligence and Knowledge-Based Systems, Birbeck College, London. “8.4 Comments on Empirical Methods.” Paul Cohen, presented at AAAI Fall Symposium, Falmouth MA, November, 1999. August 1999: “Fourteen Comments on Empirical Methods,” Keynote Talk presented by Paul Cohen at the IJCAI-99 Workshop on Empirical AI, Stockholm Sweden. http://www-eksl.cs.umass.edu/research/aaai_fall1999. July 1999: “Agents Systems: The Semantic Challenge,” presented at Dagstuhl Seminar: Agent-Oriented Approaches in Distributed Modeling and Simulation, Frankfurt Germany. http://eksl-www.cs.umass.edu/research/Dagstuhl/. July 1999: “The Mind Reading Problem,” Opening Talk by Paul Cohen at the Workshop on Mixed Initiative Planning, AAAI-99, Orlando FL. http://eksl-www.cs.umass.edu/research/miper/initiative/index.html. June 1999: “Hotwash Themes,” presented by Paul Cohen at DARPA/Control of Agent Based Systems Workshop, Northampton MA. June 1999: “The Grid,” presented by Paul Cohen at DARPA/Control of Agent Based Systems Workshop, Northampton, MA. June 1999: “Modeling,” presented by Paul Cohen at DARPA/Control of Agent Based Systems Workshop, Northampton, MA. May 1999: “Deep Understanding of Courses of Action,” presented by Paul Cohen at the DARPA Workshop on Knowledge Based Planning for Coalition Forces, Edinburgh Scotland, May 1999. http://eksl-www.cs.umass.edu/research/nato/index.html. February 1999: “Building and Maintaining Interactionist Onologies,” presented by Paul Cohen at AFOSR/HPKB contractor’s meeting, Fort Collins CO. January 1999: “Simulating Tactical Engagements for COA Criticism,” presented by Paul Cohen at DARPA/High Performance Knowledge Bases Workshop, Austin TX. January 1999: “Moving Ahead with Metrics: A Case Based Approach,” presented by Paul Cohen at DARPA/High Performance Knowledge Bases Workshop, Austin TX. May 1998: “Capture-the-Flag, Briefing,” presented by Paul Cohen at the ARPI PI Workshop, Monterey CA. http://eksl-www.cs.umass.edu/research/miper/ctf/Pages/index.html.

31
April 1998: “Physical Planning and Dynamics,” presented by Paul Cohen at the Information and Technology Division Planning Seminar Series, Air Force Research Laboratory, Rome NY. January 1998: “EKSL ARPI Work.” Presented at EKSL-hosted site visit for DARPA/ARPI Program Manager, Major Doug Dyer. http://eksl-www.cs.umass.edu/research/miper/dyer/Pages/slides/index.html December 1997: “Recognition and Prediction Based on Dynamics,” presented by Paul Cohen at the HPKB PI Meeting, San Diego CA. http://eksl-www.cs.umass.edu/research/hpkb/r-p-d/slides/index.html. June 1997: “Semantic Models for Mixed Initiative Plan Evaluation and Repair,” presented by Paul Cohen at ARPI PI Meeting, San Diego CA. http://eksl-www.cs.umass.edu/research/miper/talkindex.html. March 1997: “Acquiring Conceptual Structure through Activity,” presented by Paul Cohen at School of Computer Science, Carnegie Mellon University. http://eksl-www.cs.umass.edu/research/conceptual-systems/index.html I. Related Service to the ARPI, DARPA and the AI Research Community Editorships Contributions to DARPA Programs Paul Cohen headed up the evaluation plan for the DARPA High Performance Knowledge Bases (HPKB) program from 1997 – 1999, and was a member of the design team for Challenge Problem specification. Cohen also consulted to the DARPA Program Managers in the Rapid Knowledge Formation program and the Control of Agent Based Systems program. Cohen was one of three U.S. academic representatives attending the DARPA Workshop on Knowledge-Based Planning for Coalition Forces held in Edinburgh, Scotland in May, 1999. This workshop brought together a community of international researchers, developers and government representatives to discuss emerging advanced planning technology and how it might be further developed to support military coalition planning and execution. The EKSL also hosted a 4-day workshop in August 1999 for the LOE-1 and LOE-2 groups in the DARPA Command Post of the Future Program. Paul Cohen served on the following program committees:
• Fifth and Sixth International Workshops on Artificial Intelligence and Statistics, 1995 and 1997;
• Fourteenth National Conference on Artificial Intelligence (AAAI-97); • First and Third International Symposium on Intelligent Data Analysis (IDA-95 and IDA-
99). • He also served as Co-Chair of the Program Committee and Chair of the Steering
Committee for IDA-97. Paul Cohen was nominated, and interviewed for the position of Director of DARPA’s Information Technology Office in 1999. He was promoted to Full Professor of Computer Science in September, 1995, and was awarded a University of Massachusetts Faculty Fellowship in 1998 for outstanding research and scholarship.