Embed Size (px)
Citation preview

County of Los Angeles Countywide Integrated Waste Management Plan
2012 Annual Report
Countywide Summary Plan & Countywide Siting Element
County of Los Angeles Department of Public Works August 2013

GAIL FARBER, Director
August 1, 2013
COUNTY OF LOS ANGELES
DEPARTMENT OF PUBLIC WORKS
`To Enrich Lives Through Effective and Caring Service°
Ms. Caroll MortensenDirectorDepartment of ResourcesRecycling and RecoveryCal/EPA Building1001 I StreetSacramento, CA 95812-4025
Dear Ms. Mortensen:
900 SOUTH FRLMONT AVENUEALHAMBRA, CAIJFORNIA 91803-1331
Telephone: (626) 458-5100
http://dpw.lacounty.gov ADDRESS ALL CORRESPONDENCE TO:P.O. BOX 1460
ALHAMdRA, CALIFORNIA 91802-1460
IN REPLY PLEASEREFER TO FILE: EP-5
TRANSMITTAL OF THE 2012 ANNUAL REPORTLOS ANGELES COUNTY COUNTYWIDE INTEGRATED WASTE MANAGEMENT PLANSUMMARY PLAN AND SITING ELEMENT ASSESSMENTS
Enclosed for your review and approval is the 2012 Annual Report for the Summary Planand Siting Element of the Los Angeles County Countywide Integrated WasteManagement Plan pursuant to Section 41821 of the Public Resources Code.
The 2012 Annual Report includes discussion on the status of the revised Siting Elementwhich is anticipated to be disseminated for public comment during 2014 and submittedto CalRecycle in 2016. Also included in the 2012 Annual Report are permit changes,in-depth assessments of the County's disposal capacity needs, detailed updates on theremaining permitted in-County disposal capacity, and the County's strategies formaintaining adequate disposal capacity through 2027.
Through the analyses of nine scenarios, the 2012 Annual Report demonstrates that theCounty would meet the disposal capacity requirements of Assembly Bill 939 through amulti-pronged approach which includes successfully permitting and developingproposed in-County landfill expansions, utilizing available or planned out-of-Countydisposal capacity, developing necessary infrastructure to facilitate exportation of wasteto out-of-County landfills, and developing conversion and other alternative technologies.Additionally, by continuing to enhance diversion programs and increasing theCountywide diversion rate, jurisdictions in Los Angeles County may further ensureadequate disposal capacity is available to serve the needs of the residents andbusinesses through the planning period.

Ms. Caroll MortensenAugust 1, 2013Page 2
If you have any questions regarding this Annual Report, please contact me at(626) 458-3500 or Mr. Bahman Hajialiakbar at (626) 458-3502, Monday throughThursday, 7 a.m. to 5:30 p.m.
Very truly yours,
GAIL FARBERD' r of P ~ Works
r
PAT PROANOAssistant Deputy DirectorEnvironmental Programs Division
JB:dyP:~Sec~2012 AR Cover Letter
Enc.
cc: California Department of Resources Recycling and Recovery Office of LocalAssistance for Southern California
Each City Mayor in the County of Los AngelesEach City Recycling Coordinator in the County of Los AngelesEach Member of the Los Angeles County Integrated Waste ManagementCommittee/Integrated Waste Management Task Force
Each Member of the Los Angeles County Regional Planning Commission

2012 Annual Report Los Angeles County Countywide Integrated Waste Management Plan
i
TABLEOFCONTENTS
WHAT IS THE ANNUAL REPORT? ......................................................... 1 SECTION D: SUMMARY PLAN ASSESSMENT (FORM) .......................... 2 SUMMARY PLAN ................................................................................. 3 REGIONAL SOLID WASTE ISSUES ......................................................... 4 SECTION E: SITING ELEMENT ASSESSMENT (FORM) ......................... 10 SITING ELEMENT REVISION ............................................................... 12 SOLID WASTE DISPOSAL FACILITIES .................................................. 14 DISPOSAL ANALYSIS FOR 2012 .......................................................... 16 STRATEGY FOR MAINTAINING ADEQUATE DISPOSAL CAPACITY ...... 28 JURISDICTION/REGIONAL AGENCY CONTACT ................................... 45 Appendix E‐1 Solid Waste Facility Fact Sheets
Antelope Valley Recycling & Disposal Facility .............................. 46 Azusa Land Reclamation Landfill ................................................. 47 Burbank Landfill ............................................................................ 48 Calabasas Landfill ......................................................................... 49 Chiquita Canyon Landfill ............................................................... 50 Chiquita Canyon Landfill Expansion ............................................. 51 Commerce Refuse‐to‐Energy Facility (CREF) ................................ 52 Lancaster Landfill and Recycling Center ...................................... 53 Mesquite Regional Landfill ........................................................... 54 Pebbly Beach Landfill .................................................................... 55 Puente Hills Landfill ...................................................................... 56 San Clemente Landfill ................................................................... 57 Scholl Canyon Landfill ................................................................... 58
Scholl Canyon Landfill Expansion ................................................. 59 Southeast Resource Recovery Facility (SERRF) ............................ 60 Sunshine Canyon City/County Landfill ......................................... 61 Whittier (Savage Canyon) Landfill ............................................... 62 Whittier (Savage Canyon) Landfill Expansion ........................... 623
Appendix E‐2 Tables Table 1 ‐ Remaining Permitted Capacity of Existing Solid Waste
Disposal Facilities in Los Angeles County Table 2 ‐ Disposal Capacity of Inert Debris Engineered Fill Operations in Los Angeles County Table 3 ‐ Out‐of‐County Landfills Currently Available for Use by
Jurisdictions in Los Angeles County Table 4 ‐ Population, Employment, and Taxable Sales in
Los Angeles County Table 5 ‐ Los Angeles County Solid Waste Disposal Capacity Appendix E‐3 Comparison of Daily Disposal Demand and SB 1016 Limit
Table 1 ‐ Base Year Projections Based on SB 1016 Limit Table 2 ‐ Comparison of Daily Disposal Demand and SB 1016 Disposal Limit Appendix E‐4 Disposal Capacity Analysis Scenarios Appendix E‐5 Map of Transfer and Processing Facilities Appendix E‐6 Map of Landfills
63

2012 Annual Report Los Angeles County Countywide Integrated Waste Management Plan
ii
ACRONYMSANDGLOSSARYOFTERMS
ADC Alternative Daily Cover CSE Countywide Siting Element (Siting Element) CUP Conditional Use Permit DRS Disposal Reporting System EIR Environmental Impact Report FOC Finding of Conformance IDEFO Inert Debris Engineered Fill Operation LARA Los Angeles Regional Agency LEA Local Enforcement Agency Public Works County of Los Angeles Department of Public Works Regional Planning County of Los Angeles Department of Regional Planning Sanitation Districts Sanitation Districts of Los Angeles County SRRE Source Reduction and Recycling Element Summary Plan Los Angeles County Countywide Integrated Waste Management Summary Plan SWFP Solid Waste Facility Permit SWIMS Solid Waste Information Management System Task Force Los Angeles County Solid Waste Management Committee/Integrated Waste Management Task Force TPD Tons per Day, Based on 6 Operating Days per Week TPW Tons per Week TPY Tons per Year UCLA University of California, Los Angeles CalRecycle California Department of Resources Recycling and Recovery WTE Waste‐to‐Energy

2012 Annual Report Los Angeles County Countywide Integrated Waste Management Plan
1
WHATISTHEANNUALREPORT?
The California Integrated Waste Management Act of 1989, also known as Assembly Bill 939 (AB 939), mandates jurisdictions to meet a diversion goal of 50 percent by year 2000 and thereafter. In addition, each county is required to prepare and administer a Countywide Integrated Waste Management Plan. This plan is comprised of the County’s and the cities’ solid waste reduction planning documents, an Integrated Waste Management Summary Plan (Summary Plan), and a Countywide Siting Element (CSE). In order to assess jurisdiction’s compliance with AB 939, the Disposal Reporting System was established to measure the amount of disposal from each jurisdiction and determine if it has met the goals. The County of Los Angeles Department of Public Works (Public Works) is responsible for preparing and administering the Summary Plan and the CSE. These documents were approved by the County, a majority of the cities within the County containing a majority of the cities’ population, the County Board of Supervisors, and the California Department of Resources, Recycling, and Recovery (CalRecycle).
The Summary Plan, approved by CalRecycle on June 23, 1999, describes the steps to be taken by local agencies, acting independently and in concert, to achieve the mandated state diversion rate by integrating strategies aimed toward reducing, reusing, recycling, diverting, and marketing solid waste generated within the County.
The CSE, approved by CalRecycle on June 24, 1998, identifies how, for a 15‐year planning period, the county and the cities within would meet their long‐term disposal capacity needs to safely handle solid waste generated in the county that cannot be reduced, recycled, or composted. The purpose of the Annual Report is to provide an annual update to the Los
Angeles County Countywide Integrated Waste Management Plan. Public Works prepares the Annual Report to summarize the changes that have taken place since the approval of the Summary Plan and the CSE by the jurisdictions and CalRecycle. It consists of Section D: Summary Plan Assessment and Section E: Siting Element Assessment. The other sections pertaining to individual jurisdictions, namely, Sections A, B, C, and H, are included in a separate annual report from each jurisdiction.

2012 Annual Report Los Angeles County Countywide Integrated Waste Management Plan
2
SECTIOND:SUMMARYPLANASSESSMENT(FORM)
Check each item as completed, providing attachments as applicable. [ ] D‐1 Does the Summary Plan need to be revised? For example, have there been any significant changes in the financing of Countywide or regional programs and/or facilities, in demographics, in solid waste management infrastructure, or in planning documents; i.e., Source Reduction and Recycling Element (SRRE), Household Hazardous Waste Element, or Non‐Disposal Facility Element from any of the jurisdictions within the County? [ ] Yes. Discuss below. Include a time schedule for revising the Summary Plan. [ ] No. Discussion Please see Summary Plan (Page 3) and Regional Solid Waste Issues (Page 4) for a discussion of the Summary Plan.

2012 Annual Report Los Angeles County Countywide Integrated Waste Management Plan
3
SUMMARYPLAN
The Summary Plan, approved by CalRecycle in 1999, was prepared and administered by the County to describe the steps to be taken by jurisdictions, acting independently and in concert, to achieve the 50 percent waste diversion mandate. Since then, a number of changes have occurred, such as regional solid waste management, demographics, and public awareness of environmental stewardship. At the same time, the County and cities continue to enhance and expand their waste reduction efforts in response to changing conditions. Jurisdictions in the County of Los Angeles continue to implement and enhance the waste reduction, recycling, special waste, and public education programs identified in their SRREs, Household Hazardous Waste Element, and Non‐Disposal Facility Element (as updated through their Annual Reports).
These efforts, together with Countywide and regional programs implemented by the County and the cities, acting in concert or independently, have achieved significant, measurable results. As such, CalRecycle approved the County’s second Five‐Year Review Report in August 2010, which concluded that an update to the Summary Plan is not necessary.
The following section is a summary discussion on the various regional solid waste issues that currently play a significant role in the County’s continuing solid waste management efforts, including markets for recyclable materials, development of alternative technology facilities, diversion credit for such technology, and the State’s 75‐percent recycling goal.

2012 Annual Report Los Angeles County Countywide Integrated Waste Management Plan
4
REGIONALSOLIDWASTEISSUES
DisposalTrendDuringEconomicRecession
Although the economy has shown signs of improvement, the amount of waste that residents and businesses generated as well as disposed of in Los Angeles County continued to remain relatively low. Figure 1: Disposal Trend
Figure 1 shows a downward disposal trend from 2005 to 2010 and plateaus thereafter. Figure 2 shows disposal trends of selected facilities within the County. Figure 2: Disposal Trend at Major Landfills
0.0
1.0
2.0
3.0
4.0
5.0
6.0
7.0
8.0
9.0
10.0
11.0
12.0
13.0
2001 2002 2003 2004 2005 2006 2007 2008 2009 2010 2011 2012
Mill
ion
tons
Waste Exported to Out-of-County FacilitiesWaste Disposed at in County FacilitiesTotal Disposal
0.0
0.1
0.2
0.3
0.4
0.5
0.6
0.7
0.8
0.9
1.0
2010 2011 2012
Tons
of S
olid
Was
te D
ispo
sed
per
Qua
rter
(in m
illio
ns)
Puente Hills Sunshine Canyon
Chiquita Canyon Scholl Canyon
Calabasas Antelope Valley

2012 Annual Report Los Angeles County Countywide Integrated Waste Management Plan
5
GreenWasteasAlternativeDailyCover
As the closure of Puente Hills Landfill in 2013 draws near, jurisdictions that currently depend on the facility to recycle their green waste as alternative daily cover (ADC) must secure alternative sites to recycle or compost their green waste in order to continue to meet their diversion goals. As shown in Figure 3, of the 428,923tons of green waste ADC used at in‐County landfills, Puente Hills Landfill alone accepted 55 percent, or 235,692 tons, which is equivalent to an average of 755 tons per day (tpd) Figure 3: Use of Green Waste as ADC in 2012
Cities, the County, and the waste management industry are working towards developing alternatives for the management of greenwaste in anticipation of the closure of Puente Hills Landfill. There are many challenges associated with green waste management, such as inadequate green waste management capacity in the County due to difficulties encountered in permitting and developing composting facilities, limited markets for compost made from green waste, and increasing costs for long‐distance transportation to out‐of‐County facilities and operations.
ProjectedShortfallofAvailablePermittedDisposalCapacity
As detailed in the Strategy for Maintaining Adequate Disposal Capacity section (Page 28), a shortfall of permitted solid waste disposal capacity in the County is anticipated under current conditions. To meet their disposal needs during the planning period, jurisdictions in the County must further enhance their waste reduction and diversion efforts, continue to encourage development of alternative technologies such as waste‐to‐energy and conversion technology facilities, support the use of waste‐by‐rail system to Mesquite Regional Landfill, as well as expand solid waste processing facilities in areas where processing capacity is inadequate if found to be environmentally sound and technically feasible.
0.00
0.05
0.10
0.15
0.20
0.25
0.30
Tons
(in
mill
ions
)
Facility

2012 Annual Report Los Angeles County Countywide Integrated Waste Management Plan
6
LosAngelesCounty’sConversionTechnologyEfforts
Los Angeles County continues to support alternatives to landfills through our Conversion Technology Program. Focusing on processes that convert non‐recyclable materials into renewable energy, bio‐fuels, and other useful products, this innovative program emphasizes local project development and statewide outreach and education. Over the past year, the County has worked with stakeholders on a state and local level to identify the barriers to project development in California and develop solutions to overcoming those barriers. In September 2012, the County Board of Supervisors directed the County to work with the Chief Executive Office to pursue legislation that would establish a more clearly defined permitting pathway for conversion technologies in state statute. This has led the County to conduct several educational visits with Sacramento legislators and state agencies such as Air Resources Board, Energy Commission, and Natural Resources Agency. Currently the County is partnering with the California State Association of Counties (CSAC) to sponsor Senate Bill 804, conversion technology legislation introduced by Senator Ricardo Lara (D‐33), with the goal of establishing clear definitions in statute that promote the highest and best use of resources while supporting the state’s key environmental goals. If passed, the bill would assist in meeting California’s 75 percent
waste reduction goal by assessing how the tens of millions of tons of materials that cannot be reduced, recycled or composted can better be handled. Additionally, the bill would assist in meeting the goals of the state’s Bioenergy Action Plan, which has identified municipal solid waste as a substantially underutilized resource for biomass feedstock.
County Engineers visit Waste Management’s Reclaimable Anaerobic Composter Demonstration in Lancaster, CA
The County continues to chair the Conversion Technology Working Group hosted by CSAC as well as the Los Angeles County Integrated Waste Management Task Force’s Alternative Technology Advisory Subcommittee. These groups monitor the development of projects in California, such as the CR&R

2012 Annual Report Los Angeles County Countywide Integrated Waste Management Plan
7
Incorporated anaerobic digester project in Perris, CA, which is closer to the final stages of design and construction. As a part of its partnership with CR&R, the County assisted the project in earning a $4.5 million grant from the Energy Commission under the State’s Alternative and Renewable Fuel, Vehicle Technology, Clean Air, and Carbon Reduction Program (commonly known as AB 118). Other companies and jurisdictions have approached the County about potential projects at approximately 2 dozen locations throughout the County, and a number of projects are being considered or moving forward at several of these sites.
CityofLosAngeles’AlternativeTechnologyEfforts
In May 2011, the City of Los Angeles (City), Board of Public Works (Board) authorized the Bureau of Sanitation (Bureau) to enter into contract negotiations with Green Conversion Systems (GCS) for development of the first commercial scale alternative technology facility. GCS proposed to build a 1,100 ton per day facility that would include an upfront mechanical pre‐processing system to separate and recover recyclables materials, followed by an advanced thermal recycling system to produce energy and recover by‐products. Additionally, in December 2012, the City’s Board authorized the Bureau to enter into contract negotiations with Urbaser‐Keppel Seghers for development of an integrated scale alternative technology facility. The proposed facility could include a combination of one or more of the following technologies: upfront mechanical pre‐processing system, anaerobic digestion, composting, advanced thermal recycling, and/or gasification,
and would include the flexibility to negotiate for increased tonnage commitments. The Bureau is currently in contract negotiations with GCS and Urbaser‐Keppel Seghers for the development of a commercial and emerging alternative technology facility, respectively.
California’s75‐Percent“Recycling”Goal
On October 6, 2011, Governor Brown signed Assembly Bill 341 establishing a State policy goal that no less than 75‐percent of solid waste generated be source reduced, recycled, or composted by 2020, and requiring CalRecycle to provide a report to the Legislature that recommends strategies to achieve the policy goal by January 1, 2014. The bill also mandates local jurisdictions to implement commercial recycling by July 1, 2012. Subsequently, CalRecycle began holding workshops to receive feedback from stakeholders and released for public comment a draft report entitled, California’s New Goal: 75 Percent Recycling. Consequently, the County and the Los Angeles County Integrated Waste Management Task Force (Task Force) provided their comments and recommendations on the 75‐Percent Recycling Goal to CalRecycle. The recommendations include to: (1) revise the hierarchy to reflect the best management practices that puts the highest emphasis on product redesign and producer responsibility, followed in order of preference by waste prevention, reuse, recycling, composting, conversion technologies, transformation, and lastly, landfill disposal if no other management option is reasonably feasible; (2) conduct a comprehensive, peer‐

2012 Annual Report Los Angeles County Countywide Integrated Waste Management Plan
8
reviewed life‐cycle analysis of each solid waste management option; (3) continue diversion credit for green waste when used as alternate daily cover at landfills due to lack of markets for compost and composting infrastructure; (4) support local and state policies that would promote the development of technologies as an alternative to landfilling, such as conversion technologies; and (5) pursue strategies that would promote and provide for the use of recyclables at in‐state facilities only. In addition, comments were made on definitions of some terms including the definition of “Recycling” which is inconsistent with the California Public Resources Code definition. Jurisdictions in Los Angeles County will still be working with CalRecycle during the stakeholder process to assist in developing the strategies with an emphasis on State policies and activities that supplement and enhance existing statewide and local recycling efforts; sound, science‐based recommendations; minimal potential impacts of the proposal on cities’ and County’s AB 939 compliance; and continued diversion credit for green waste as an alternate daily cover at landfills.
AB32–ReducingGreenhouseGasEmissionsinCalifornia
The California Air Resources Board (CARB) is currently developing their 2013 Scoping Plan that will provide an update on how the State is meeting our greenhouse gas (GHG) emission reduction targets specified in AB 32. In 2008, CARB developed the original Scoping Plan with only a small portion dedicated to solid waste and recycling. The single solid waste
measure with an associated measurable goal was methane reduction at landfills. The 2013 Scoping Plan will include a more comprehensive discussion of the waste management sector, including measures relating to waste reduction and recycling, anaerobic digestion and composting, biomass conversion, landfills, thermal waste conversion, and procurement of recyclable products. The waste management sector GHG target is tied to State’s AB 341 goal. CalRecycle estimates that if the 75 percent waste reduction, recycling, and composting goal are met by 2020 it will result in a 20‐30 Million Metric Ton of Carbon Dioxide‐Equivalent (MMTCO2e) reduction. The County and Task Force have both submitted comments to CalRecycle and CARB. The comments re‐emphasized concerns made regarding the 75‐percent goal, as well as highlighted the need for the Scoping Plan update to include the connection between sustainable feedstock suppliers, bioenergy generations and distributions, and end user markets in transportation and water sectors.
MarketsforRecoveredMaterials
The County strongly recommends CalRecycle to continue its efforts to address the need to develop sufficient statewide markets and take a leadership role in the expansion of markets for recycled products. These efforts are in line with the statewide goal of 75 percent “recycling.” State recycling mandates have long created an extensive supply of diverted materials, but have not fully addressed the demand side of the “recycling equation.” The result has been a substantial dependence on foreign markets for our recyclable

2012 Annual Report Los Angeles County Countywide Integrated Waste Management Plan
9
materials, where there are substantially inadequate environmental controls for processing these materials. While collection of recyclable materials is an important element of our integrated solid waste management system and is imperative in reducing our dependence on landfills, true success of recycling efforts can only be realized with a strong market demand for recovered materials.
ExtendedProducerResponsibility
To facilitate a comprehensive solid waste management strategy, the County strongly supports statewide legislation, regulations, and/or policies that establish product stewardship, also known as extended producer responsibility (EPR). EPR is an adopted strategic policy that shifts the responsibility of product waste management from local governments to producers and manufacturers. EPR emphasizes product designs that promote environmental sustainability and minimize the negative impact on human health and the environment, as well as considers the cost of treatment and disposal in the total cost of the product. Effective July 2012, AB 1343 requires paint manufacturers to take responsibility for the end‐of‐life management of postconsumer paints sold in California. This state law is the first significant extended producer responsibility bill in California and necessitates the paint industry to take responsibility of the end‐of‐life management of their product by designing and managing a collection system for postconsumer paint that would potentially save local governments millions of dollars in
taxpayer funds each year. As such, AB 1343 is meant to reduce the end‐of‐life management costs for paint and mitigate the environmental impacts of its disposal. On October 19, 2012, PaintCare, the stewardship organization, designated by paint manufacturers, implemented a program with a chain of about 300 local paint retail stores to take back postconsumer paint from the public. Currently, there are over 60 retail locations spread throughout Los Angeles County. PaintCare is also working with various existing Household Hazardous Waste programs to add to its collection infrastructure. Currently, the County of Los Angeles is evaluating options for participating in PaintCare’s collection infrastructure.

2012 Annual Report Los Angeles County Countywide Integrated Waste Management Plan
10
SECTIONE:SITINGELEMENTASSESSMENT(FORM)
Check each item as completed, providing attachments as applicable. [ ] E‐1 Describe the changes in remaining disposal capacity facility description, pursuant to the California Code of
Regulations (CCR) Section 18755.5, since the Los Angeles County Countywide Siting Element (Siting Element) adoption. [ ] Attach the remaining capacity description (label as Appendix E‐1) that includes the following information
for each facility: a. Name of the facility and name of facility owner and operator b. Facility permit number, permit expiration date, date of last permit review, and an estimate of
remaining site life c. The maximum permitted daily and yearly rates of waste disposal in tons and cubic yards d. The permitted types of wastes e. The expected land use for the site and if site closure is expected to occur within the 15‐year
planning period DiscussionPlease see Solid Waste Disposal Facilities (Page 14) for a summary of the changes in the remaining disposal capacity facility. Detailed description of each facility is provided in Appendix E‐1.

2012 Annual Report Los Angeles County Countywide Integrated Waste Management Plan
11
[ ] E‐2 Has the County or regional agency maintained or provided a strategy that provides for the maintenance
of 15 years of disposal capacity? [ ] Yes. Attach a table (label as Appendix E‐2) with the total disposal capacity the County or regional
agency has for each year for the next 15 years in tons and cubic yards. [ ] No. Attach a table (label as Appendix E‐2) with the total disposal capacity the County or regional
agency has for each year for the next 15 years in tons and cubic yards. DiscussionPlease see Strategy for Maintaining Adequate Disposal Capacity (Page 28) for a discussion on how the County will maintain 15 years of disposal capacity. Detailed data is provided in Appendix E‐2, E‐3, and E‐4. [ ] E‐3 Examine the adequacy of the Siting Element. Has the County or regional agency maintained 15 years of
disposal capacity, as described in E‐2 above. [ ] Yes. (No revision necessary.) [ ] Yes. However, revision will be needed to add new disposal sites and/or strategies. Attach a discussion
of the new sites or strategies and include a time schedule for revising the Siting Element and label as Appendix E‐4.
[ ] No. Attach a discussion of how additional capacity will be provided, and include a time schedule for revising the Siting Element. Label as Appendix E‐4
DiscussionThe Siting Element is currently being revised to remove two sites previously identified as potential landfill sites and add new strategies, including expansions of some in‐County Class III landfills in order to increase landfill capacities within the County, updates to some of the goals and policies to enhance the comprehensiveness of the County’s solid waste management system, fostering the development of alternatives to landfilling such as alternative technology facilities and promoting the development of infrastructure to facilitate exportation of waste to Mesquite Regional Landfill in Imperial County. Please see Strategy for Maintaining Adequate Disposal Capacity (Page 28) for a detailed discussion. Data is provided in Appendices E‐1 through E‐4. Appendices E‐5 and E‐6 show locations of current transfer and process facilities and disposal sites within the County.

2012 Annual Report Los Angeles County Countywide Integrated Waste Management Plan
12
SITINGELEMENTREVISION
AB 939, as amended, requires each county to prepare a countywide siting element that describes how the county, and the cities within the county plan to manage the disposal of their solid waste for a 15‐year planning period. The existing Los Angeles County Countywide Siting Element (CSE) was approved by the majority of the cities in the County containing a majority of the cities’ population, the Board of Supervisors in January 1998, and by CalRecycle on June 24, 1998. The CSE establishes goals and policies for the County to maintain adequate permitted disposal capacity for a 15‐year planning period. To provide the needed disposal capacity, the CSE offers strategies and establishes siting criteria to aid in evaluating the feasibility of potential sites for development of solid waste management and disposal facilities. Out‐of‐County landfills potentially available to accept waste generated in the County are also identified. Additionally, the CSE includes goals and policies to facilitate the use of out‐of‐County/remote landfills and foster the development of alternatives to landfill disposal, such as conversion technologies on a Countywide basis. In August 2010, CalRecycle approved the County’s second Five‐ Year Review Report, which provides a comprehensive analysis on the adequacy of the Summary Plan and Siting Element. The Five‐Year Review Report confirmed that an update to the Summary Plan is not necessary; however, there is a need to revise the CSE.
The revised CSE, which would cover the 15‐year planning period beginning 2010 through 2025, is anticipated to reflect the following significant changes compared to the current version:
Removal of Elsmere and Blind Canyons as potential new landfill sites in accordance with the Board of Supervisors’ decision on September 30, 2003 to remove those sites from the list of potential new landfill sites;

2012 Annual Report Los Angeles County Countywide Integrated Waste Management Plan
13
Expansion of several in‐County Class III landfills in order to increase landfill capacities within the County;
Updates to the goals and policies to be consistent with a new solid waste management paradigm to enhance the comprehensiveness of the Los Angeles County’s solid waste management system and incorporate current and upcoming solid waste management processes and technologies;
Promotes the development of alternatives to landfilling such as conversion technologies, on a Countywide basis; and
Promotes the development and use of infrastructure to
transport solid waste to out‐of‐County landfills such as Mesquite Regional Landfill to complement the County’s
waste management system.
On November 15, 2012, the Los Angeles County Integrated Waste Management Task Force (Task Force) concurred with the draft revised CSE.
The draft revised CSE and its environmental document will undergo a review and approval process in compliance with numerous statutory and regulatory requirements. This includes CEQA review, and review and approval by jurisdictions
in Los Angeles County, the County Board of Supervisors, and CalRecycle. The goal is to complete the entire revision process, disseminate the document for public comment, and submit the final draft CSE and the environmental document to CalRecycle by 2016.

2012 Annual Report Los Angeles County Countywide Integrated Waste Management Plan
14
SOLIDWASTEDISPOSALFACILITIES
ExpandedFacilitiesLancasterLandfillandRecyclingCenterThe Lancaster Landfill and Recycling Center is owned and operated by Waste Management of California, Inc. On December 14, 2011, Los Angeles County Regional Planning Commission approved a new CUP to extend landfilling operations by 30 years by increasing the maximum daily disposal capacity from 1,700 tpd to 3,000 tpd , and the acceptance of inert debris and beneficial use materials up to 2,100 tpd effective August 1, 2012. Refer to Appendix E‐1 for more detailed information. PermitChangesLancasterLandfillandRecyclingCenterA Finding of Conformance (FOC) was granted for Lancaster Landfill and Recycling Center by the Task Force on March 21, 2013. A new solid waste facility permit (SWFP) was issued by the Local Enforcement Agency and concurred by CalRecycle on February 19, 2013. Refer to Appendix E‐1 for more detailed information.
ProposedFacilityExpansions
ChiquitaCanyonLandfillExpansionOn December 5, 2008, Republic Services merged with Allied Waste Industries, Inc. As a condition of the merger, Republic Services was required to divest the Chiquita Canyon Landfill. Republic Services and Waste Connections signed a definitive agreement providing for
the sale of the Chiquita Canyon Landfill to Waste Connections, Inc. on February 6, 2009. In 2011, Waste Connections, Inc. re‐submitted an application to request an expansion of the waste footprint and an increase in the allowable daily tonnage. The County of Los Angeles Department of Regional Planning (Regional Planning) prepared a Notice of Preparation (NOP) for the proposed Chiquita Canyon Landfill Master Plan Revision and circulated it for public comments from November 28, 2011 to February 13, 2012. In September 2012, Waste Connections, Inc. submitted its updated Master Plan Revision to the Regional Planning, which provided a more detailed description of the proposed landfill expansion project. The proposed expansion project includes lateral extension of the existing waste footprint from 257 acres to 400 acres, increase in maximum elevation from 1430 feet to 1,573 feet, and increase in maximum daily disposal capacity from 6,000 tpd to 12,000 tpd. A draft Environmental Impact Report is currently being prepared and is expected to be released for public comment. Refer to Appendix E‐1 for more detailed information.
SchollCanyonLandfillExpansionThe Scholl Canyon Landfill is located north of the Ventura Freeway in the City of Glendale. The Landfill is operated by the Sanitation Districts of Los Angeles County (Sanitation Districts) pursuant to a Joint Powers Agreement between the Sanitation Districts, City of Glendale, and the County. The Landfill is operating under a Use Variance (Case No. 6668‐U) granted on November 27, 1978. The City of Glendale is proposing an expansion consisting of two variations: vertical expansion only, providing approximately five

2012 Annual Report Los Angeles County Countywide Integrated Waste Management Plan
15
million tons of additional capacity (Variation 1) and vertical and horizontal expansion, providing approximately six million tons of additional capacity (Variation 2). Under both variations, the landfill would continue to be permitted to receive 3,400 tons per day of non‐hazardous solid waste, and existing resource and material recovery programs will continue to be implemented. On December 4, 2007, the Sanitation Districts initiated the CEQA process on behalf of the City of Glendale for the landfill expansion and circulated the Notice of Preparation/Initial Study. Refer to Appendix E‐1 for more detailed information. Whittier(SavageCanyon)LandfillExpansionThe Whittier Landfill is owned and operated by the City of Whittier. The City Public Works Department is proposing to increase the site capacity from approximately 8.1 million cubic yards, as identified in the current SWFP issued on February 28, 1995, to 12.5 million cubic yards. The City is in the process of obtaining a solid waste facility permit from the Los Angeles County Department of Public Health, the State‐approving Local Enforcement Agency. Refer to Appendix E‐1 for more detailed information. OthersEagleMountainLandfillOn May 22, 2013, the Board of Directors of Sanitation District No. 2 took action to cease negotiations for Eagle Mountain Landfill. The site is currently owned by Ontario‐based Mine Reclamation Corporation. The 4,654‐acre landfill would have taken up to 20,000 tons of waste per day brought by rail from communities in Los Angeles County.
MesquiteRegionalLandfillThe Sanitation Districts owns and operates the Mesquite Regional Landfill, located in Imperial County, and anticipates receiving a portion of the County’s waste by truck or rail. Refer to Out‐of‐County Disposal Facilities (Page 42) and Appendix E‐1 for more detailed information. PuenteHillsLandfillThe Puente Hills Landfill is owned and operated by the Sanitation Districts. On January 23, 2002, the Sanitation Districts’ Board of Directors certified the Final Environmental Impact Report (EIR) for the expansion project. The County of Los Angeles Regional Planning Commission granted a new CUP on December 18, 2002 and extended the life of the landfill to October 31, 2013. The Task Force granted a FOC on February 20, 2003. CalRecycle approved the project on July 11, 2003, and issued a revised SWFP. Operation of the expanded landfill began on November 1, 2003. The expansion increased the life of the landfill by ten years at a maximum daily disposal capacity of 13,200 tpd. Refer to Appendix E‐1 for more detailed information.

2012 Annual Report Los Angeles County Countywide Integrated Waste Management Plan
16
DISPOSALANALYSISFOR2012
SolidWasteDisposal
In 2012, total solid waste disposed at Class III landfills and transformation facilities located in and out of the County was 8.7 million tons. In addition, the amount of inert waste disposed at permitted inert waste landfills totaled 89,142 tons. The following is a breakdown of disposal amounts at each type of disposal facility.
Annual Disposal Tonnage for 2012 In‐County Class III Landfills 6,304,060 tons
Transformation Facilities 569,539 tons
Exports to Out‐of‐County Landfills 1,844,175 tons
Subtotal Solid Waste Disposed 8,717,773 tons
Permitted Inert Waste Landfills 89,142 tons
Grand Total Disposed 8,806,915 tons
Average Daily Disposal Rate for 2012 (Based on Six Operating Days) In‐County Class III Landfills 20,205 tpd
Transformation Facilities 1825 tpd
Exports to Out‐of‐County Landfills 5,911 tpd Subtotal Solid Waste Disposed 27,942 tpd
Permitted Inert Waste Landfills 286 tpd
Grand Total Disposed 28,227 tpd

2012 Annual Report Los Angeles County Countywide Integrated Waste Management Plan
17
Figure 4 below shows the top 10 jurisdictions that disposed solid waste, including inert waste disposed at permitted inert waste landfills, in and outside of the County in 2012. Figure 4: Top 10 Jurisdiction Disposal Quantities in 2012
WasteGeneration
For the purpose of long‐term disposal capacity planning, a countywide diversion rate of 60 percent was assumed for 2012. Based on the 8.6 million tons of disposal and the 60 percent diversion rate, the County generated approximately 21.5 million tons or an average of 58,987 tpd. Note that the
estimates do not include inert waste disposed at permitted inert waste landfills.
SB1016
With the implementation of Senate Bill 1016, CalRecycle no longer calculates diversion rate based on actual disposal and estimated annual generation using CalRecycle’s Adjustment Methodology. As a result, Countywide diversion rates are no longer calculated. The last diversion rates approved by CalRecycle were for 2006. Considering each jurisdiction’s approved diversion rate, a countywide diversion rate for 2006 is estimated at 58 percent. Under SB 1016, a target per capita disposal rate, which is equivalent to a 50‐percent diversion rate, is calculated using an approved jurisdiction‐specific average of per capita generation rates of years 2003 to 2006. To establish compliance with AB 939, each jurisdiction’s per capita disposal rate is calculated for each reporting year and compared with their individual target rates. Using projections of population, employment, and real taxable sales from the University of California, Los Angeles (UCLA), it is estimated that in order to meet the per capita disposal requirements, jurisdictions in Los Angeles County would need to continue their diversion programs as well as other disposal reduction strategies.
0.0
0.5
1.0
1.5
2.0
2.5
3.0
3.5
CITY OF LOS ANGELES
COUNTY UNINCORP.
LONG BEACH
CARSON
TORRANCE
PASADENA
VERNON
GLENDALE
POMONA
SANTA CLARITA
3.08
0.81
0.44
0.27
0.15
0.15
0.14
0.14
0.13
0.12
Tons (in millions)

2012 Annual Report Los Angeles County Countywide Integrated Waste Management Plan
18
Figure 5 shows the County meeting the AB 939 diversion mandate through the year 2027 provided that the County as a whole maintains a 60‐percent diversion rate. Refer to Appendix E‐3 for detailed data. Figure 5: Projection of Countywide Disposal Equivalent
WasteDisposalatIn‐CountyFacilities
In addition to waste generated within Los Angeles County, Class III landfills, permitted inert waste landfills, and transformation facilities in the County also received 141,145tons, or 452 tpd, of waste from jurisdictions outside the County in 2012. Figure 6 shows the total amount of solid waste disposed at each Class III landfill and transformation facility, including waste generated from within and outside the County. Refer to Appendix E‐2 Table 1 for detailed data.
0.01.02.03.04.05.06.07.08.0
2012
2013
2014
2015
2016
2017
2018
2019
2020
2021
2022
2023
2024
2025
2026
2027
Poun
ds of w
aste per person pe
r day
Actual Rate Projected Rate SB 1016 Limit
2012 Waste Generation and Disposal Quantities for Municipal Solid Waste
A B C D E F In‐County Disposal Out‐of
County Class III Landfills (Exports)
Total
Disposal*
Estimated Countywide Diversion Rate
Calculated 2012
Solid Waste Generation*
Class III Landfills
Transformation Facilities
TONS TONS TONS TONS % TONS 6,239,143
528,765
1,844,175
8,612,083
60 21,530,206
* Data from permitted inert waste landfills and imports from Out-of-County landfills is excluded from these calculations.
Column A: Total disposal at Class III landfills in Los Angeles County. Does not include waste imported from jurisdictions outside the County.
Column B: Total disposal at transformation facilities in Los Angeles County. Does not include waste imported from jurisdictions outside the County.
Column C: Waste exported by jurisdictions in Los Angeles County to disposal facilities located outside the County.
Column D: Columns A + B + C.
Column E: A Countywide Diversion Rate of 60 percent is assumed.
Column F: Column D ÷ 40% (disposal percentage). This estimate is used to project the County's Class III landfill and transformation disposal needs through the year 2027.

2012 Annual Report Los Angeles County Countywide Integrated Waste Management Plan
19
Figure 6: Disposal Quantities by Facility in 2012
When waste is received at Class III landfills and transformation facilities, some of it is recycled for on‐site use, such as ADC, and some is sent off‐site for recycling or processing. The remaining is landfilled or transformed into energy. If transformed, the residual ash is turned into ashcrete and used for winter deck and other beneficial uses at the Puente Hills Landfill. Figure 7 quantitatively illustrates these activities. The various types of
materials recycled or beneficially used on‐site at Class III landfills are further broken down on Figure 8.
0.0
0.5
1.0
1.5
2.0
2.5
3.0
Tons
of S
olid
Was
te D
ispo
sed
(in m
illio
ns)
Facility
On-site Use2,008,068
22%Off-site Use83,054
1%
Transformed569,539
6%
Ash175,840
2%
Landfilled6,304,060
69%
Figure 7: Solid Waste at In-County Disposal Facilities (tons)
On-site Use Off-site Use Transformed Ash Landfilled
Green Waste557,386
28%
Auto Shred89,559
4% C&D515,251
26%
Compost0
0%Treated Soil318,682
16%Sludge
1920%
Ash153,330
8%
Other373,667
18%
Figure 8: On-site Beneficial Use (tons)
Green Waste Auto Shred C&D CompostTreated Soil Sludge Ash Other

2012 Annual Report Los Angeles County Countywide Integrated Waste Management Plan
20
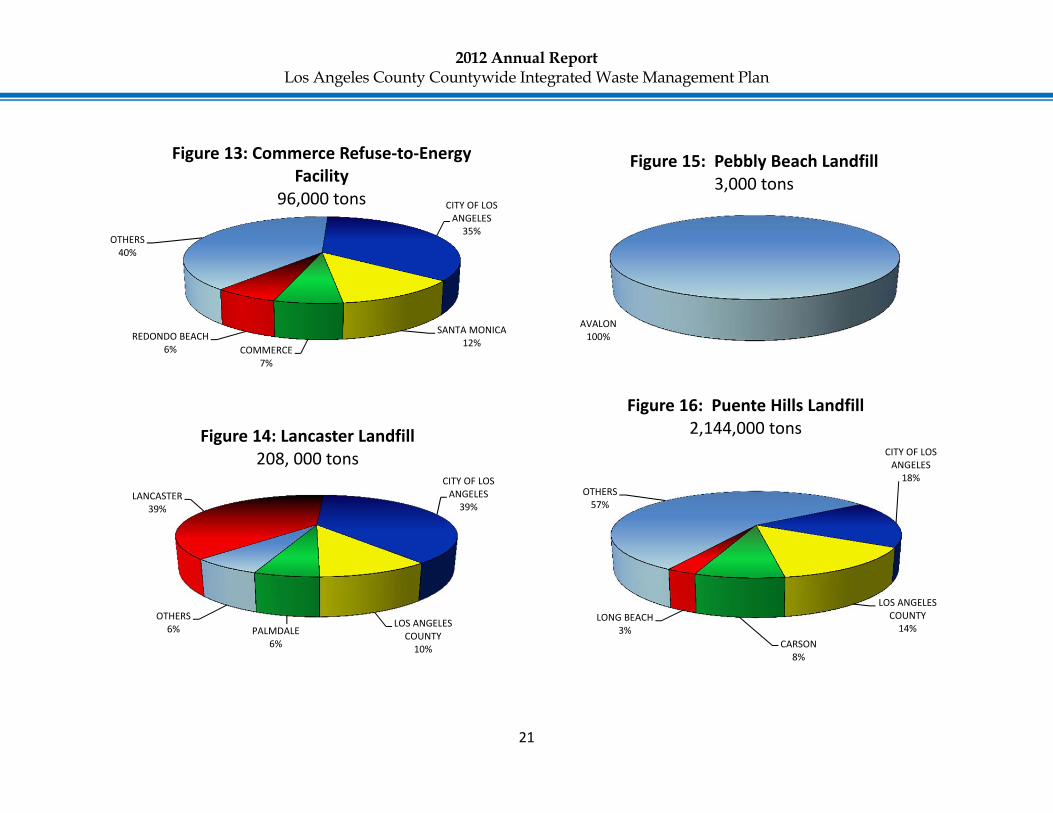
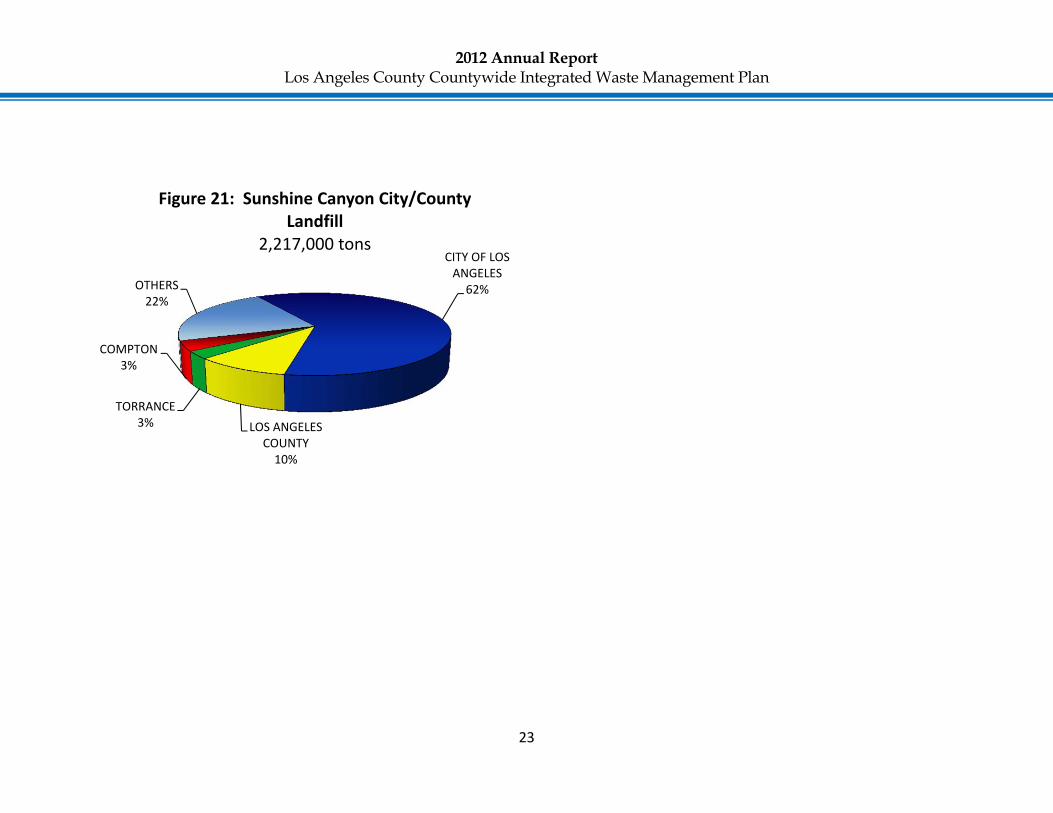
Figures 9 through 21 show the disposal at each in‐County facility broken down by jurisdiction. Refer to Appendix E‐5 for a map that shows the location of each facility.
OTHERS3%
CITY OF LOS ANGELES37%
PALMDALE33%
LOS ANGELES COUNTY19%
LANCASTER8%
Figure 9: Antelope Valley Landfill252,000 tons
BURBANK100%
Figure 10: Burbank Landfill33,000 tons
OTHERS5%
CITY OF LOS ANGELES58%
LOS ANGELES COUNTY17%
CALABASAS11%
MALIBU9%
Figure 11: Calabasas Landfill187,000 tons
OTHERS21%
CITY OF LOS ANGELES56%
SANTA CLARITA13%
LOS ANGELES COUNTY
6%
CULVER CITY4%
Figure 12: Chiquita Canyon Landfill906,000 tons
2012 Annual Report Los Angeles County Countywide Integrated Waste Management Plan
21
OTHERS40%
CITY OF LOS ANGELES35%
SANTA MONICA12%
COMMERCE7%
REDONDO BEACH6%
Figure 13: Commerce Refuse‐to‐Energy Facility
96,000 tons
OTHERS6%
LANCASTER39%
CITY OF LOS ANGELES39%
LOS ANGELES COUNTY10%
PALMDALE6%
Figure 14: Lancaster Landfill208, 000 tons
AVALON100%
Figure 15: Pebbly Beach Landfill3,000 tons
OTHERS57%
CITY OF LOS ANGELES18%
LOS ANGELES COUNTY14%
CARSON8%
LONG BEACH3%
Figure 16: Puente Hills Landfill2,144,000 tons

2012 Annual Report Los Angeles County Countywide Integrated Waste Management Plan
22
LOS ANGELES COUNTY100%
Figure 17: San Clemente Landfill400 tons
OTHERS3%
PASADENA46%
GLENDALE43%LOS ANGELES
COUNTY7%
SOUTH PASADENA
1%
Figure 19: Scholl Canyon Landfill211,000 tons
OTHERS5%
WHITTIER61%
SANTA FE SPRINGS18%BELLFLOWER
12%NORWALK
4%
Figure 18: Whittier (Savage Canyon) Landfill
78,000 tons
OTHERS34%
LONG BEACH47%
CITY OF LOS ANGELES
8%TORRANCE
7%
SANTA MONICA
4%
Figure 20: Southeast Resource Recovery Facility432,000 tons
2012 Annual Report Los Angeles County Countywide Integrated Waste Management Plan
23
OTHERS22%
CITY OF LOS ANGELES62%
LOS ANGELES COUNTY10%
TORRANCE3%
COMPTON3%
Figure 21: Sunshine Canyon City/County Landfill
2,217,000 tons

2012 Annual Report Los Angeles County Countywide Integrated Waste Management Plan
24
RemainingDisposalCapacityatEndof2012
TransformationFacilitiesPresently, two transformation facilities operate in the County with a combined average daily tonnage of 2,069 tpd, which is equivalent to 645,600 tpy.
It is expected that these two facilities will continue to operate at their current permitted daily capacity during the planning period of 2012 through 2027. The owners and operators of these facilities indicate that there are no plans to increase the permitted daily capacity.
ClassIIILandfillsPublic Works conducted a survey requesting landfill operators in the County to provide updates to their estimated remaining disposal capacity. Based on the results of the survey and considering permit restrictions, the total remaining permitted Class III landfill capacity in the County is estimated at 129.2 million tons as of December 31, 2012. The figure below shows a breakdown of each landfill’s remaining capacity in million tons as of December 31, 2012. Refer to Appendix E‐2 Table 1 for detailed data.
Figure 24: Class III Landfill Remaining Capacity
When each landfill's average daily disposal and closure date, if specified in its permits, are accounted for, its lifespan is as shown in the following figure.
0.0 5.0 10.0 15.0 20.0 25.0
Sunshine Canyon…
Antelope Valley
Lancaster
Puente Hills
Calabasas
Chiquita Canyon
Savage Canyon
Scholl Canyon
Burbank
Pebbly Beach
San Clemente
74.37
16.91
12.27
6.1
5.51
3.97
3.56
3.41
2.95
0.09
0.04
Tons (in millions)

2012 Annual Report Los Angeles County Countywide Integrated Waste Management Plan
25
Figure 25: Class III Landfill Remaining Life
* Landfill remaining life based on 2012 average daily disposal ** Landfill remaining life based on maximum permitted capacity as of December
31, 2012 *** Landfill remaining life based on land use/solid waste facility permit restrictions as of December 31, 2012.
PermittedInertWasteLandfillThere is one permitted Inert Waste Landfill that has a full solid waste facility permit (Azusa Land Reclamation) in Los Angeles County in 2012. The remaining capacity of this landfill is estimated at 64.1 million tons or 52.1 million cubic yards. Refer to Appendix E‐2 Table 1 for detailed data. Given the remaining permitted capacity and at the average disposal rate of 286 tpd in 2012, this capacity would be exhausted in 718 years.
InertDebrisEngineeredFillOperationsThere are other Inert Waste Landfill operations which are under the State permit tier of Enforcement Agency Notification. These facilities are classified as Inert Debris Engineered Fill Operations (IDEFO). In 2006, CalRecycle reclassified Nu‐Way Arrow Reclamation, Inc., Nu‐Way Live Oak Reclamation, Inc. and Calmat Reliance Pit #2, and Peck Gravel Road Pit to an IDEFO. These sites and other IDEFOs handled nearly 1.9 million tons or approximately 1.6 million cubic yards of material in the County (Refer to Appendix E‐2 Table 2).
TransferandProcessingCapacityThere are 44 permitted Large Volume Transfer/Processing and Direct Transfer Facilities, which are permitted to receive 100 tons of waste or more per operating day, and numerous facilities of smaller volume operating in the County. As local waste disposal capacity options diminish in the County, transfer and processing facilities operators are expected to ship waste to out‐of‐County landfills via truck or rail transport. Refer to Appendix E‐5 for a list of Large Volume Transfer and Processing facilities in the County.
0 20 40 60 80 100 120 140
Burbank***
Antelope Valley***
Sunshine Canyon**
San Clemente***
Pebbly Beach***
Calabasas***
Scholl Canyon*
Savage Canyon***
Lancaster**
Chiquita Canyon**
Puente Hills***
41
30
20
20
16
16
16
13
13
2
1
Years

2012 Annual Report Los Angeles County Countywide Integrated Waste Management Plan
26
On‐goingEfforts toOptimizeUtilization ofExistingDisposalCapacityOver the last decade, the County has encouraged waste diversion and recycling activities at landfills in the County unincorporated areas through the land use permit process. The process incorporates a Waste Plan Conformance Agreement which requires a landfill operator to implement specified waste diversion and recycling programs as well as other activities on‐ and off‐site to assist jurisdictions in the County in achieving the mandates of AB 939. In addition, the Agreement contains provisions to encourage and assist residents in properly disposing of their wastes. These programs or activities may include: Conservation of Capacity Maximize available fill capacity by improving compaction
methods and diverting or reducing high‐volume or low‐density waste materials;
Conduct waste characterization studies; On‐Site Reuse Utilize waste materials received and processed at the
landfill, such as shredded green waste, as a supplement to daily, intermediate, and final cover;
Use green waste for other beneficial uses, including composting;
Salvage wood wastes for landscaping and erosion, weed, and fire break control;
Salvage construction and demolition wastes for road construction, erosion control, and other uses;
Establishment of: Materials recovery operations or facilities; Used oil collection center; Drop‐off or buy‐back recycling center; Activities to Encourage Proper Disposal Free disposal days; Waste tire processing; Christmas tree recycling; Acceptance of bulky items from residents free of charge; As appropriate, providing reduced rates to customers for
source‐separated materials which can be diverted or otherwise salvaged at the landfill;
Public education activities; Provide Funding for: Household hazardous and electronic waste collection
events; and Research and development of alternative technologies; Active Class III landfills that have a Waste Plan Conformance Agreement with the County include Chiquita Canyon, Lancaster, Puente Hills, and Sunshine Canyon City/County Landfills. Together, these landfills handle over 85 percent of in‐County Class III waste. It should be noted that due to the dynamic nature of solid waste management in the County, the provisions of the Waste Plan Conformance Agreement for each landfill are different and tailored to meet the specific needs of the communities serviced by the landfill.

2012 Annual Report Los Angeles County Countywide Integrated Waste Management Plan
27
As the economy continues to show signs of improvement, increasing diversion rate, and advancements, such as improving methods in compaction techniques, will impact the remaining capacity of existing landfills not being depleted as quickly as previously projected, and therefore is anticipated to provide longer lifespan.

2012 Annual Report Los Angeles County Countywide Integrated Waste Management Plan
28
STRATEGYFORMAINTAININGADEQUATEDISPOSALCAPACITY
This section will discuss how the County plans to maintain adequate solid waste disposal capacity for the next 15 years from 2012 to 2027. The discussion first evaluates whether the existing permitted disposal capacity in the County would be able to accommodate the solid waste generated that cannot be reduced, recycled, or reprocessed. However, as will be shown by the following evaluation, depending on existing infrastructure alone is not sufficient. As a solution, the discussion goes on to present several scenarios utilizing various options to manage the residual solid waste. Note that since the County currently has adequate permitted inert waste landfill capacity as discussed earlier inPermitted Inert Waste Landfill (Page 25), inert waste landfills are not included in the discussion.
DefinitionsDaily Disposal Demand – The amount of solid waste generated less the amount diverted by means of reuse, recycling, composting, or anaerobic digestion based on a 6‐day‐per‐week operation at permitted solid waste disposal facilities. Disposal Capacity Reserve – The amount by which the total Daily Available Capacity exceeds Daily Disposal Demand. Disposal Capacity Shortfall – The amount by which Daily Disposal Demand exceeds the total Daily Available Capacity.
Daily Available Capacity – The amount of waste a permitted to be received at solid waste disposal facilities based on a 6‐day‐per‐week operation in accordance with the terms, conditions, and wasteshed restrictions of the facility’s SWFP, land use permit, Waste Discharge Requirements, or any other permit regulating the operation, whichever is more restrictive.
EvaluationofExistingDisposalInfrastructure
WasteGenerationProjectionsProjections of solid waste generation during the planning period were made using the Adjustment Methodology developed by CalRecycle. The Methodology requires knowledge of the waste distribution by residential and non‐residential sectors as well as future population, employment, and real taxable sales. Population, employment, and real taxable sales projections are available from the State Department of Transportation and UCLA for each year of the planning period. The UCLA Long‐Term Forecast, published in July 2012, was utilized since it focuses on the Los Angeles region as compared to the State Department of Transportation, which is Statewide and yields more general projections. Additionally, the UCLA forecast data is updated more frequently. The graph below shows the parameters utilized. The detailed data is also provided in Appendix E‐2 Table 4.

2012 Annual Report Los Angeles County Countywide Integrated Waste Management Plan
29
Figure 26: Population, Employment, and Real Taxable Sales Considering each jurisdiction’s SRRE and last approved base generation year as of 2005, the average Countywide distribution by sector is as follows: Residential Waste Generation = 27 percent of total waste generation Non‐Residential Waste Generation = 73 percent of total waste generation
DailyDisposalDemandProjectionsThe quantity of Daily Disposal Demand depends on the amount of solid waste that may be diverted. As noted in Waste Generation (Page 17), a diversion rate of 60 percent will be assumed for analysis in this report. With this assumption, the amount of residual waste that requires disposal capacity will be 40 percent of the projected waste generation.
TransformationFacilityCapacityAs explained earlier in Remaining Disposal Capacity at End of 2012 (Page 24), the two transformation facilities in the County are expected to provide up to 2,069 tpd of Daily Available Capacity. The capacity is projected during the planning period.
ClassIIILandfillCapacityNeededAssuming no other options are available, such as exporting to out‐of‐County facilities or development of new alternative technologies, the County’s Class III landfill disposal needs are determined after considering the available transformation capacity. The result of the evaluation is plotted in the graph below. The detailed data is also provided in Appendix E‐2 Table 5.
2
4
6
8
10
12
14
2012
2013
2014
2015
2016
2017
2018
2019
2020
2021
2022
2023
2024
2025
2026
2027
40
80
120
160
200
240
280Po
pula
tion/
Empl
oym
ent (
mill
ions
)
Rea
l Tax
able
Sal
es (B
illio
ns)
Countywide Real Taxable Sales (UCLA Data)Countywide Population (UCLA Data)Countywide Employment (UCLA Data)

2012 Annual Report Los Angeles County Countywide Integrated Waste Management Plan
30
Figure 27: Solid Waste Generation and Disposal Trend
The area in green illustrates the amount of Class III landfill capacity needed. By the end of year 2026, the cumulative need for Class III landfill disposal capacity, approximately 134 million tons, will exceed the 2012 remaining permitted Class III landfill capacity of 129 million (Page 24). Refer to Appendix E‐2 Table 5.. Other constraints that may limit the accessibility of Class III landfill capacity include: wasteshed boundaries, geographic barriers, weather, and natural disasters. In conclusion, further
detailed analysis that incorporates capacity options in addition to existing in‐County infrastructure as well as permit constraints is necessary to provide a more thorough evaluation.
ScenarioAnalysis
The scenario analysis utilizes the various capacity options currently available or may become available in the future to assist the County in meeting the Daily Disposal Demand. The analysis will consider the following: Existing in‐County Class III Landfills and Transformation Facilities – The analyses take into account a facility’s permitted capacity, termination date, and wasteshed restriction, if any. Proposed Expansions of In‐County Class III Landfills – The analyses assume additional disposal capacity that may be provided by proposed landfill expansions. Detailed discussion is provided in Proposed Facility Expansions (Page 14). Various Levels of Imports and Exports – The analyses consider various levels of imported and exported waste from and to out‐of‐county jurisdictions. Existing facilities in Orange, Riverside, San Bernardino, and Ventura Counties are currently accepting waste from the County. Future use of Mesquite Regional Landfill in Imperial County is also considered. Refer to Out‐of‐County Disposal Facilities (Page 42) for more detail. Alternative Technologies – Potential conversion technology facilities or other alternative technologies may be developed in the near future.
0
5
10
15
20
25
30
35
2012
2013
2014
2015
2016
2017
2018
2019
2020
2021
2022
2023
2024
2025
2026
2027
Solid
Was
te (m
illio
n to
ns)
144 Million tons
Transformation CapacityClass III Landfill Capacity DemandGenerationTotal Disposal Demand

2012 Annual Report Los Angeles County Countywide Integrated Waste Management Plan
31
Increase in Diversion Rate – Potential increase in diversion rate affected by enhanced diversion programs by jurisdictions within the County. Given all the various capacity options, the analysis evaluated nine potential scenarios during the 15‐year planning period. The table below summarizes the differences between the scenarios. For all nine scenarios, the projected waste generation and Daily Available Capacity from transformation facilities will remain unchanged from the analysis performed in Evaluation of Existing Disposal Infrastructure (Page 28). Given the current diversion rates achieved by jurisdictions in the county, a diversion rate of 60 percent will be applied, except for those scenarios that consider a higher diversion rate. The analysis will examine closely how much Daily Available Capacity from existing Class III landfills is expected to be utilized during each year. No new landfills in the County are expected to be permitted during the planning period. In the case where the Daily Disposal Demand cannot be met, the analysis evaluates when a Disposal Capacity Shortfall is expected to occur. Refer to Appendix E‐4 Disposal Capacity Analysis Scenarios.

2012 Annual Report Los Angeles County Countywide Integrated Waste Management Plan
32
Scenario Comparison Table
Scenario No.
Existing Permitted In‐
County Class III Landfill Capacity
Current Available Out‐of‐County Disposal Capacity
Increase in Diversion
Rate (up to 65 percent)
Utilization of Alternative Technology
Facility Capacity (up to 2,300 tpd)
Proposed Expansions of in‐County Class III Landfills
Increase In Available Out‐of‐County Disposal Capacity
Maximizing Diversion Rate
(up to 75 percent)
Increase In Alternative Technology
Facility Capacity (up to 3,500 tpd)
Full Utilization of
Out‐of‐County Disposal Capacity
I (Status Quo Scenario)
II Increase In Diversion Rate
(Up to 65%)
III Utilization of Alternative Technology
Capacity (Up to 2,300 tpd)
IV (In‐County Class III Landfills Expansions with out‐of‐County Disposal Capacity)
V (Increase In Available Out‐of‐County Disposal
Capacity)
VI Maximizing Diversion Rate
(Up to 75%, Considering AB 341 goal)
VII Increase In Alternative Technology Capacity
(Up to 3,500 tpd)
VIII Full Utilization of Out‐of‐County Disposal
Capacity
IX (Best Case Scenario ‐ All Solid Waste
Management Options Considered Become Available)

2012 Annual Report Los Angeles County Countywide Integrated Waste Management Plan
33
Scenario1‐(StatusQuo)
• Existing In‐County Class III Landfills and Transformation Facilities • Current Available Out‐of‐County Disposal Capacity Scenario I considers the use of existing disposal infrastructure and utilizes up to 6,200 tpd of out‐of‐County landfill capacity. The scenario assumes no expansions of existing landfills, no new landfills, and no additional capacity from alternative technologies. The following assumptions are made with respect to imports and exports: Imports – Based on the average rate of 452 tpd for 2012, waste import quantities are projected to be at 500 tpd for 2013 and 700 tpd every year thereafter. Exports – The amount of waste exported to out‐of‐County landfills in 2012 was approximately 5,911 tpd and it is assumed to be at 6,200 tpd through the remainder of the planning period. Based on these assumptions, a Disposal Capacity Shortfall is expected to occur during the planning period. Refer to Appendix E‐4 for detailed data.
0
10,000
20,000
30,000
40,000
50,000
60,000
70,000
80,000
90,000
2012
2013
2014
2015
2016
2017
2018
2019
2020
2021
2022
2023
2024
2025
2026
2027
Tons
per
day
ScenarioI
Daily Available Capacity from In-County Facilities
Out-of-County Disposal Facilities
Disposal Capacity Reserve
Disposal Capacity Shortfall
Total Daily Disposal Demand (Including Imports)
Waste Generation

2012 Annual Report Los Angeles County Countywide Integrated Waste Management Plan
34
ScenarioII‐(IncreaseInDiversionRate‐upto65%)
• Existing In‐County Class III Landfills and Transformation Facilities • Current Available Out‐of‐County Disposal Capacity
• Increase in Diversion Rate (up to 65%) Scenario II assumes that all solid waste disposed would be managed by existing disposal infrastructure and the current available Out‐of‐County disposal capacity. The scenario also assumes an increase in diversion of up to 65%. The following assumptions are made with respect to imports and exports: Imports – Based on the average rate of 452 tpd for 2012, waste import quantities are projected to be 500 tpd for 2013 and 700 tpd every year thereafter. Exports – The amount of waste exported to out‐of‐County landfills in 2012 was approximately 5,911 tpd and it is assumed to be at 6,200 tpd through the remainder of the planning period. Based on these assumptions, a Disposal Capacity Shortfall is expected to occur during the planning period. Refer to Appendix E‐4 for detailed data.
0
10,000
20,000
30,000
40,000
50,000
60,000
70,000
80,000
90,000
2012
2013
2014
2015
2016
2017
2018
2019
2020
2021
2022
2023
2024
2025
2026
2027
Tons
per
day
ScenarioII
Daily Available Capacity from In-County Facilities
Out-of-County Disposal Facilities
Disposal Capacity Reserve
Disposal Capacity Shortfall
Total Daily Disposal Demand
Waste Generation

2012 Annual Report Los Angeles County Countywide Integrated Waste Management Plan
35
ScenarioIII‐(UtilizationofAlternativeTechnologyCapacity‐ upto2,300tpd)• Existing In‐County Class III Landfills and Transformation Facilities • Current Available Out‐of‐County Disposal Capacity
• Increase in Diversion Rate (up to 65%)
• Utilization of Alternative Technology Capacity (up to 2,300 tpd)
Scenario III assumes that by 2017, alternative technology facilities for residential waste would become operational in the County. The permitted capacity of these facilities is estimated to start at 1,300 tpd in 2017 and increase up to 2,300 tpd in 2021 and throughout the remainder of the planning period. The following assumptions are made with respect to imports and exports: Imports – Based on the average rate of 452 tpd for 2012, waste import quantities are projected to be 500 tpd for 2013 and 700 tpd every year thereafter. Exports – The amount of waste exported to out‐of‐County landfills in 2012 was approximately 5,911 tpd and it is assumed to be at 6,200 tpd through the remainder of the planning period. Based on these assumptions, a Disposal Capacity Shortfall is expected to occur during the planning period. Refer to Appendix E‐4 for detailed data.
0
10,000
20,000
30,000
40,000
50,000
60,000
70,000
80,000
90,000
2012
2013
2014
2015
2016
2017
2018
2019
2020
2021
2022
2023
2024
2025
2026
2027
Tons
per
day
ScenarioIII
Daily Available Capacity from In-County Facilities
Alternative Technologies
Out-of-County Disposal Facilities
Disposal Capacity Reserve
Disposal Capacity Shortfall
Total Daily Disposal Demand (Including Imports)
Waste Generation

2012 Annual Report Los Angeles County Countywide Integrated Waste Management Plan
36
ScenarioIV‐(In‐CountyClassIIILandfillExpansionswithOut‐of‐CountyDisposalCapacity)
• Existing In‐County Class III Landfills and Transformation Facilities • Current Available Out‐of‐County Disposal Capacity
• Increase in Diversion Rate (up to 65%)
• Utilization of Alternative Technology Capacity (up to 2,300 tpd)
• Proposed Expansions of In‐County Class III Landfills Along with the other assumptions mentioned in Scenario III, Scenario IV assumes the use of additional capacity from proposed expansions of existing in‐County disposal infrastructure. The following assumptions are made with respect to imports and exports: Imports – Based on the average rate of 452 tpd for 2012, waste import quantities are projected to be 500 tpd for 2013 and 700 tpd every year thereafter. Exports – The amount of waste exported to out‐of‐County landfills in 2012 was approximately 5,911 tpd and it is assumed to be at 6,200 tpd through the remainder of the planning period. Based on these assumptions, a Disposal Capacity Shortfall would not be expected during the 15‐year planning period. Refer to Appendix E‐4 for detailed data.
0
10,000
20,000
30,000
40,000
50,000
60,000
70,000
80,000
90,000
2012
2013
2014
2015
2016
2017
2018
2019
2020
2021
2022
2023
2024
2025
2026
2027
Tons
per
day
ScenarioIV
Daily Available Capacity from In-County Facilities
Alternative Technologies
Out-of-County Disposal Facilities
Disposal Capacity Reserve
Disposal Capacity Shortfall
Total Daily Disposal Demand (Including Imports)
Waste Generation

2012 Annual Report Los Angeles County Countywide Integrated Waste Management Plan
37
ScenarioV‐(IncreaseinAvailableOut‐of‐CountyDisposalCapacity)
• Existing In‐County Class III Landfills and Transformation Facilities • Increase in Available Out‐of‐County Disposal Capacity (up to
12,000 tpd) • Increase in Diversion Rate (up to 65%)
• Utilization of Alternative Technology Capacity (up to 2,300 tpd)
• Proposed Expansions of In‐County Class III Landfills Scenario V uses the same assumptions as Scenario IV, with the exception of assuming an increase in available out‐of‐County disposal capacity of up to 12,000 tpd. The following assumptions are made with respect to imports and exports: Imports – Based on the rate of 452 tpd for 2012, waste import quantities are projected at 500 tpd for 2013 and increase to 700 tpd every year thereafter. Exports – The amount of waste exported to out‐of‐County landfills in 2012 was approximately 5,911 tpd and will be assumed to increase up to 12,000 tpd during the planning period. Based on these assumptions, a Disposal Capacity Shortfall would not be expected during the 15‐year planning period. Refer to Appendix E‐4 for detailed data.
0
10,000
20,000
30,000
40,000
50,000
60,000
70,000
80,000
90,000
2012
2013
2014
2015
2016
2017
2018
2019
2020
2021
2022
2023
2024
2025
2026
2027
Tons
per
day
ScenarioV
Daily Available Capacity from In-County Facilities
Alternative Technologies
Out-of-County Disposal Facilities
Disposal Capacity Reserve
Disposal Capacity Shortfall
Total Daily Disposal Demand (Including Imports)
Waste Generation

2012 Annual Report Los Angeles County Countywide Integrated Waste Management Plan
38
ScenarioVI‐(MaximizingDiversionRate‐upto75%, ConsideringAB341Goal)• Existing In‐County Class III Landfills and Transformation Facilities • Increase in Available Out‐of‐County Disposal Capacity (up to
12,000 tpd) • Maximizing Diversion Rate (up to 75%)
• Increase in Alternative Technology Capacity (up to 2,300 tpd)
• Proposed Expansions of In‐County Class III Landfills Scenario VI is similar to Scenario V, with the exception of the diversion rate, which is assumed to increase each year beginning in 2013 until it reaches 75 percent in 2020. It will remain at 75 percent through 2027. This scenario maximizes the diversion rate by complying with the AB 341 goal. The following assumptions are made with respect to imports and exports: Imports – Based on the rate of 452 tpd for 2012, waste import quantities are projected at 500 tpd for 2013 and increase to 700 tpd every year thereafter. Exports – The amount of waste exported to out‐of‐County landfills in 2012 was approximately 5,911 tpd and will be assumed to increase up to 12,000 tpd during the planning period.
Based on these assumptions, a Disposal Capacity Shortfall would not be expected during the 15‐year planning period. Refer to Appendix E‐4 for detailed data.
0
10,000
20,000
30,000
40,000
50,000
60,000
70,000
80,000
90,000
2012
2013
2014
2015
2016
2017
2018
2019
2020
2021
2022
2023
2024
2025
2026
2027
Tons
per
day
ScenarioVI
Daily Available Capacity from In-County Facilities
Alternative Technologies
Out-of-County Disposal Facilities
Disposal Capacity Reserve
Disposal Capacity Shortfall
Total Daily Disposal Demand (Including Imports)
Waste Generation

2012 Annual Report Los Angeles County Countywide Integrated Waste Management Plan
39
ScenarioVII‐(IncreaseinAlternativeTechnologyCapacity‐upto3,500tpd)
• Existing In‐County Class III Landfills and Transformation Facilities • Increase in Available Out‐of‐County Disposal Capacity (up to
12,000 tpd) • Increase in Diversion Rate (up to 65%)
• Increase in Alternative Technology Capacity (up to 3,500 tpd)
• Proposed Expansions of In‐County Class III Landfills Scenario VII is similar to Scenario V, with the exception of the increased alternative technology capacity of up to 3,500 tpd. The following assumptions are made with respect to imports and exports: Imports – Based on the rate of 452 tpd for 2012, waste import quantities are projected at 500 tpd for 2013 and increase to 700 tpd every year thereafter. Exports – The amount of waste exported to out‐of‐County landfills in 2012 was approximately 5,911 tpd and will be assumed to increase up to 10,000 tpd during the planning period. Based on these assumptions, a Disposal Capacity Shortfall would not be expected during the 15‐year planning period. Refer to Appendix E‐4 for detailed data.
0
10,000
20,000
30,000
40,000
50,000
60,000
70,000
80,000
90,000
2012
2013
2014
2015
2016
2017
2018
2019
2020
2021
2022
2023
2024
2025
2026
2027
Tons
per
day
ScenarioVII
Daily Available Capacity from In-County Facilities
Alternative Technologies
Out-of-County Disposal Facilities
Disposal Capacity Reserve
Disposal Capacity Shortfall
Total Daily Disposal Demand (Including Imports)
Waste Generation

2012 Annual Report Los Angeles County Countywide Integrated Waste Management Plan
40
ScenarioVIII‐(FullUtilizationofAvailableOut‐of‐CountyDisposalCapacity)
• Existing In‐County Class III Landfills and Transformation Facilities • Full Utilization of Available Out‐of‐County Disposal Capacity
(up to 19,000 tpd) • Increase in Diversion Rate (up to 65%)
• Utilization of Alternative Technology Capacity (up to 2,300 tpd)
• Proposed Expansions of In‐County Class III Landfills Scenario VIII is similar to Scenario V, with the exception of the full utilization of available out‐of‐County disposal capacity of up to 19,000 tpd. The following assumptions are made with respect to imports and exports: Imports – Based on the rate of 452 tpd for 2012, waste import quantities are projected at 500 tpd for 2013 and increase to 700 tpd every year thereafter. Exports – The amount of waste exported to out‐of‐County landfills in 2012 was approximately 5,911 tpd and will be assumed to gradually increase up to 19,000 tpd during the planning period. Based on these assumptions, a Disposal Capacity Shortfall would not be expected during the 15‐year planning period. Refer to Appendix E‐4 for detailed data.
0
10,000
20,000
30,000
40,000
50,000
60,000
70,000
80,000
90,000
2012
2013
2014
2015
2016
2017
2018
2019
2020
2021
2022
2023
2024
2025
2026
2027
Tons
per
day
ScenarioVIII
Daily Available Capacity from In-County Facilities
Alternative Technologies
Out-of-County Disposal Facilities
Disposal Capacity Reserve
Disposal Capacity Shortfall
Total Daily Disposal Demand (Including Imports)
Waste Generation

2012 Annual Report Los Angeles County Countywide Integrated Waste Management Plan
41
ScenarioIX‐(BestCase)• Existing In‐County Class III Landfills and Transformation Facilities • Utilization of Out‐of‐County Disposal Capacity (up to
16,000 tpd) • Maximizing Diversion Rate (up to 75%)
• Increase in Alternative Technology Capacity (up to 3,000 tpd)
• Proposed Expansions of In‐County Class III Landfills Scenario IX includes all solid waste management options mentioned in all of the previous scenarios. The following assumptions are made with respect to imports and exports: Imports – Based on the rate of 452 tpd for 2012, waste import quantities are projected at 500 tpd for 2013 and increase to 700 tpd every year thereafter. Exports – The amount of waste exported to out‐of‐County landfills in 2012 was approximately 5,911 tpd and will be assumed to gradually increase up to 16,000 tpd during the planning period. Based on these assumptions, a Disposal Capacity Shortfall would not be expected during the 15‐year planning period. Refer to Appendix E‐4 for detailed data.
0
10,000
20,000
30,000
40,000
50,000
60,000
70,000
80,000
90,000
2012
2013
2014
2015
2016
2017
2018
2019
2020
2021
2022
2023
2024
2025
2026
2027
Tons
per
day
ScenarioIX
Daily Available Capacity from In-County Facilities
Alternative Technologies
Out-of-County Disposal Facilities
Disposal Capacity Reserve
Disposal Capacity Shortfall
Total Daily Disposal Demand (Including Imports)
Waste Generation

2012 Annual Report Los Angeles County Countywide Integrated Waste Management Plan
42
Out‐of‐CountyDisposalFacilities
The scenario analysis considers the availability or potential availability of these out‐of County disposal facilities: El Sobrante Landfill, Riverside County – It has a remaining capacity of 179 million tons and an expected design lifespan of about 33 years as of January 1, 2012. It is permitted to receive 16,054 tpd of waste for disposal. In 2012, the landfill received an average of 6,179 tpd, of which 2,640 tpd were imported from Los Angeles County. It is assumed that the landfill could receive up to 4,000 tpd from Los Angeles County during the planning period. FrankR.BowermanSanitaryLandfill,OlindaAlphaSanitaryLandfill,andPrimaDeshechaSanitaryLandfill,OrangeCounty –Orange County currently has waste importation agreements with various entities in Los Angeles County. It is assumed that these landfills could collectively receive up to 4,500 tpd from Los Angeles County through 2015. In 2012, Frank R Bowerman Sanitary Landfill, Olinda Alpha Sanitary Landfill, and Prima Deshecha Sanitary Lanfill received 158 tpd, 1,878 tpd, and 60 tpd from Los Angeles County, respectively.
SimiValleyLandfill&RecyclingCenter,VenturaCounty – The Landfill is permitted to receive a maximum of 6,000 tpd, of which 766 tpd came from Los Angeles County in 2012. It is assumed that the landfill could receive up to 3,000 tpd from Los Angeles County during the planning period. MesquiteRegionalLandfill, ImperialCounty– The Sanitation Districts acquired the landfill in 2002 and completed
construction of all infrastructures on December 24, 2008. The landfill is permitted to accept up to 20,000 tpd with a total disposal capacity of 582 million tons, which is equivalent to a lifespan of nearly 100 years. It is assumed that the Landfill could receive up to 12,000 tpd from Los Angeles County during the planning period.
EagleMountain Landfill,Riverside County ‐ Eagle Mountain Landfill, owned by Mine Reclamation Corporation, is located in Riverside County. It is permitted to accept 10,000 tpd for the first 10 years, with the option of increasing the daily limit to 20,000 tpd after a review of environmental performance. Its permitted capacity of 460 million tons and total capacity of 708 million tons would provide an approximate lifespan of 100 years. Due in part to a Federal litigation and bankruptcy filing by the landfill developer, on May 22, 2013, the Sanitation Districts took action to cease negotiations forEagle Mountain Landfill.
These out‐of‐County landfills could potentially handle up to approximately 21,350 tpd of waste from Los Angeles County. Refer to Appendix E‐2 Table 3 for more detailed data.

2012 Annual Report Los Angeles County Countywide Integrated Waste Management Plan
43
Conclusion
The scenario analysis discussed earlier assessed the County’s ability to meet the Daily Disposal Demand under 9 scenarios. Under Scenario I Status Quo, without expanding existing landfills in the County, available disposal capacity would be inadequate to meet the Daily Disposal Demand of all 88 cities and the unincorporated County areas. Scenario II: Increase In Diversion Rate of up to 65% by 2027 shows that available disposal capacity would still be inadequate to meet the Daily Disposal Demand. Considering existing in‐County landfill disposal capacity and utilization of up to 6,200 tpd of out‐of‐County disposal capacity, Scenario III: Utilization of Alternative Technology Up to 2,300 tpd by 2027 shows a shortfall would still be experienced beginning 2018. This demonstrates that jurisdictions in Los Angeles County would need to pursue additional strategies to meet the needs of residents and businesses through the 15‐year planning period. Scenario IV: In‐County Class III Landfill Expansions with Out‐of‐County Disposal Capacity assesses the effects of expanding existing Class III in‐County landfills with the current available out‐of‐County disposal capacity. Based on this assumption, a disposal shortfall would not occur during the planning period. Scenarios V through IX assess the effects of a multi‐pronged strategies, including maximizing the Countywide diversion rate up to 75 percent by 2027, consistent with the State’s recycling goal; increasing alternative technology capacity up to 3,500 tpd
by 2027; and the full utilization of out‐of‐County disposal capacity of up to 19,000 tpd by 2027. Through various combinations of these options, Scenarios IV through IX demonstrate that the jurisdictions in Los Angeles County would be able to meet the disposal needs through the 15‐year planning period. In conclusion, in order to avert a disposal shortfall, jurisdictions in Los Angeles County must continue to pursue all of the following strategies: Expand Existing Landfills – Expanded landfill capacity is
necessary, provided it can be done in a technically feasible and environmentally safe manner.
Study, Promote, and Develop Conversion Technologies –
Development of commercial‐scale state‐of‐the‐art conversion technologies, as an alternative to landfilling, appears within reach. Jurisdictions must invest and actively participate in the research, promotion, and development of alternative technology facilities. Actions that may be taken by jurisdictions include:
o Supporting legislation that places these facilities higher than landfilling in the waste management hierarchy.
o Entering into waste commitment agreements. o Establishing partnerships with facilities and
technology vendors.
Expand Transfer and Processing Infrastructure – Development of additional in‐County solid waste management infrastructure, such as transfer/processing,

2012 Annual Report Los Angeles County Countywide Integrated Waste Management Plan
44
composting, and anaerobic digestion facilities, to assist jurisdictions in achieving higher levels of diversion and to facilitate transport to out‐of‐County landfills.
Develop a Waste‐by‐Rail System – Currently, nearly all
solid waste in Los Angeles County is transported to disposal sites in the metropolitan area by truck. However, as public opposition to siting new or expanding existing disposal facilities near urban areas has grown, sites farther from the Los Angeles Basin have become more desirable, despite the costs associated with longer transport distances. For some sites, such as the Mesquite Regional Landfill in Imperial County which is 210 miles from downtown Los Angeles, rail transport is an efficient means to transport solid waste to remote disposal sites. Transitioning to remote disposal of solid waste that involves rail transport requires new infrastructure and continues to be developed by the Sanitation Districts. The Waste‐by‐Rail system will provide long‐term disposal capacity to replace local landfills as they reach capacity and close. The starting point of the Waste‐by‐Rail System is the Puente Hills Intermodal Facility (PHIMF), located near the Puente Hills Materials Recovery Facility. Residual waste from materials recovery facilities and transfer stations located throughout the County will be loaded unto rail carts at the PHIMF, and then transported via rail to the Mesquite Regional Landfill for disposal.
Maximize Waste Reduction and Recycling – A steady increase in the Countywide diversion rate could significantly reduce the Daily Disposal Demand, extend landfill life, and assure that Los Angeles County will be able to meet the disposal needs of its residents and businesses.
All jurisdictions are strongly encouraged to continue to expand and enhance programs to maximize Diversion. It should be noted that future conditions considered in this report are projections, and may change based on factors such as decisions made by the 89 jurisdictions or their waste management service providers and other conditions such as changes in regulatory requirements, disposal rates, fuel costs, and traffic congestion. Nevertheless, the preceding scenario analysis provides a useful tool to assess the ability of jurisdictions in Los Angeles County to meet the disposal needs of their residents and businesses under various conditions. Given that solid waste disposal is an essential public service, it must be provided without interruption in order to protect public health and safety as well as the environment. Accordingly, major concerted actions must continue to be taken by jurisdictions towards expanding and enhancing waste reduction and recycling programs, and implementing prudent solid waste management strategies.

2012 Annual Report Los Angeles County Countywide Integrated Waste Management Plan
45
JURISDICTION/REGIONALAGENCYCONTACT
Primary Contact PAT PROANO Assistant Deputy Director Environmental Programs Division Phone: (626) 458‐3500 Fax: (626) 458‐3569 E‐Mail: [email protected] Mailing Address County of Los Angeles Department of Public Works Environmental Programs Division P.O. Box 1460 Alhambra, CA 91802‐1460
Secondary Contact BAHMAN HAJIALIAKBAR Assistant Division Engineer Environmental Programs Division Phone: (626) 458‐3502 Fax: (626) 458‐3569 E‐Mail: [email protected] CARLOS RUIZ Assistant Division Engineer Environmental Programs Division Phone: (626) 458‐3501 Fax: (626) 458‐3569 E‐Mail: [email protected]

2012 Annual Report Los Angeles County Countywide Integrated Waste Management Plan
48
Appendix E‐1 Solid Waste Facility Fact Sheets

2012 Annual Report Los Angeles County Countywide Integrated Waste Management Plan
46
AntelopeValleyRecycling&DisposalFacility
1. FACILITY INFORMATION Owner: Waste Management of California, Inc. Operator: Waste Management of California, Inc. Address: 1200 West City Ranch Road, Palmdale 93551 Operating Days: Monday‐Saturday SWFP No: 19‐AA‐5624 SWFP Issue Date: 11/16/2011
Last 5‐year Review Date: 09/28/2011 5‐year Review Due Date: 11/16/2016 2. REMAINING PERMITTED CAPACITY (as of December 31, 2012) Remaining Permitted Capacity: 16,913,937 tons 19,952,356 cubic yards Estimated Remaining Life: 30 years (based on the current SWFP estimated closure date) In‐Place Density: 0.76 tons/cubic yard 3. MAXIMUM PERMITTED DAILY CAPACITY Daily: 1,800 tons [2,368 cubic yards] Yearly Equivalent: [561,600 tons] [738,947 cubic yards] 4. 2012 AVERAGE WASTE QUANTITIES DISPOSED Daily: 832 tons [1,095 cubic yards] 5. LAND USE/CONDITIONAL USE PERMIT Permit No.: 98‐12 Effective: 06/09/2011 Expiration: Completion of Project 6. WASTE DISCHARGE REQUIREMENTS Order No.: 6‐95‐119A2 Effective: 10/10/2001 7. FOC GRANT DATE – 11/17/2011 8. PERMITTED WASTE TYPES ‐ Solid waste 9. FUTURE LAND USE ‐ No plans at this time 10. RESTRICTIONS ‐ There is no wasteshed or restriction on origin of waste. 11. REMARKS/STATUS ‐ The City of Palmdale approved the expansion of Antelope Valley Landfill, which consolidates Unit 1 and Unit
2, on June 9, 2011 Note: Calculated or assumed quantities are shown in brackets.

2012 Annual Report Los Angeles County Countywide Integrated Waste Management Plan
47
AzusaLandReclamationLandfill
1. FACILITY INFORMATION Owner: USA Waste of California, Inc. Operator: USA Waste of California, Inc. Address: 1211 West Gladstone Street, Azusa, CA 91702 Operating Days: Monday‐Saturday SWFP No: 19‐AA‐0013 SWFP Issue Date: 12/08/1989
Last 5‐year Review Date: 03/10/2011 5‐year Review Due Date: 03/10/2016 2. REMAINING PERMITTED CAPACITY (as of December 31, 2012) Remaining Permitted Capacity: 64, 125,859 tons 52,134,844 cubic yards Estimated Remaining Life: 718 years (based on average daily disposal of 286 tpd, 312 days per year) In‐Place Density: ` 1.23tons/cubic yard 3. MAXIMUM PERMITTED DAILY CAPACITY Daily: 6,500 tons [5,285 cubic yards] Yearly Equivalent: [2,028,000 tons] [1,648,780 cubic yards] 4. 2012 AVERAGE WASTE QUANTITIES DISPOSED Daily: [286] tons [232 cubic yards] 5. LAND USE/CONDITIONAL USE PERMIT Permit No.: Owner Participation Agreement No.1 (incorporated CUP No. C‐151 of 4/9/75) Effective: 01/27/1984 6. WASTE DISCHARGE REQUIREMENTS Order No.: R4‐2009‐0098 Effective: 09/03/2009 7. FOC GRANT DATE – 05/16/1996 8. PERMITTED WASTE TYPES – Inert Solid waste 9. FUTURE LAND USE ‐ Open space 10. RESTRICTIONS ‐ 6,500 tpd per SWFP. Only accepts inert solid waste. 11. REMARKS/STATUS ‐ By Court Order, on October 2, 1996, the California Regional Water Quality Control Board‐Los Angeles region
ordered the Azusa Land Reclamation Landfill to stop accepting Municipal Solid Waste. Permitted daily capacity of 6,500 tpd consists of 6,000 tpd of refuse and 500 tpd of inert waste. Facility currently accepts inert waste only.
Note: Calculated or assumed quantities are shown in brackets.

2012 Annual Report Los Angeles County Countywide Integrated Waste Management Plan
48
BurbankLandfill
1. FACILITY INFORMATION Owner: City of Burbank Operator: City of Burbank
Address: 3000 Bel Aire Drive, Burbank, CA 91504 Operating Days: Monday‐Friday SWFP No.: 19‐AA‐0040 SWFP Issue Date: 06/03/1997 Last 5‐year Review Date: 07/11/2011 5‐year Review Due Date: 07/11/2016
2. REMAINING PERMITTED CAPACITY (as of December 31, 2012) Remaining Permitted Capacity: [2,950,200 tons] 5,364,000 cubic yards Estimated Remaining Life: 41 years (based on the current SWFP estimated closure date) In‐Place Density: 0.55 tons/cubic yard 3. MAXIMUM PERMITTED DAILY CAPACITY Daily: 240 tons [436 cubic yards] Yearly Equivalent: [62,400] [113,455 cubic yards] 4. 2012 AVERAGE WASTE QUANTITIES DISPOSED Daily: 128 tons [233 cubic yards] 5. LAND USE/CONDITIONAL USE PERMIT Permit No.: 2000‐16 Effective: 11/13/2000 6. WASTE DISCHARGE REQUIREMENTS Order No.: R4‐2011‐0052 Effective 03/03/2011 7. FOC GRANT DATE – 12/18/1986 8. PERMITTED WASTE TYPES ‐ Solid waste 9. FUTURE LAND USE ‐ Irrigated open space. 10. RESTRICTIONS ‐ Origin of waste limited to the City of Burbank and is not open to the public. 11. REMARKS/STATUS ‐ Limited to the City of Burbank use only.
Note: Calculated or assumed quantities are shown in brackets.

2012 Annual Report Los Angeles County Countywide Integrated Waste Management Plan
49
CalabasasLandfill
1. FACILITY INFORMATION Owner: County of Los Angeles Operator: County Sanitation District 2 of Los Angeles County
Address: 5300 Lost Hills Road, Agoura, CA 91301 (Los Angeles County unincorporated area) Operating Days: Monday‐Saturday SWFP No.: 19‐AA‐0056 SWFP Issue Date: 08/05/2002 Last 5‐year Review Date: 08/11/2009 5‐year Review Due Date: 08/11/2014
2. REMAINING PERMITTED CAPACITY (as of December 31, 2012) Remaining Permitted Capacity: 5,514,921 tons 12,337,631 cubic yards Estimated Remaining Life: 16 years (based on the current SWFP estimated closure date) In‐Place Density: 0.447 tons/cubic yard 3. MAXIMUM PERMITTED DAILY CAPACITY Daily: 3,500 tons [7,830 cubic yards] Yearly Equivalent: [1,092,000 tons] [2,442,953 cubic yards] 4. 2012AVERAGE WASTE QUANTITIES DISPOSED Daily: 604 tons [1,351 cubic yards] 5. LAND USE/CONDITIONAL USE PERMIT Permit No.: 5022‐(5) Effective: 08/08/1972 6. WASTE DISCHARGE REQUIREMENTS Order No.: 93‐062 Effective: 09/27/1993 Order No.: R4‐2006‐0007 Effective: 01/19/2006 Order No.: R4‐2009‐0088 Effective: 07/16/2009 Order No.: R4‐2011‐0052 Effective: 03/03/2011 7. FOC GRANT DATE – None 8. PERMITTED WASTE TYPES ‐ Solid waste 9. FUTURE LAND USE ‐ Open space 10. RESTRICTIONS ‐ Origin of waste is limited to that generated in the Calabasas Wasteshed as defined by Los Angeles County
Ordinance No. 91‐0003. 11. REMARKS/STATUS ‐ Limited to the Calabasas Wasteshed as defined by Los Angeles County Ordinance No. 91‐0003. Note: Calculated or assumed quantities are shown in brackets.

2012 Annual Report Los Angeles County Countywide Integrated Waste Management Plan
50
ChiquitaCanyonLandfill
1. FACILITY INFORMATION Owner: Chiquita Canyon, LLC, a subsidiary of Operator: Waste Connections Inc. Waste Connections, Inc.
Address: 29201 Henry Mayo Drive, Valencia 91355 (Los Angeles County unincorporated area) Operating Days: Monday‐Saturday SWFP No.: 19‐AA‐0052 SWFP Issue Date: 07/07/2008 Last 5‐year Review Date: 12/01/2006 5‐year Review Due Date: 12/01/2011
2. REMAINING PERMITTED CAPACITY (as of December 31, 2012) Remaining Permitted Capacity: [3,972,886 tons] [6,019,524 cubic yards] Estimated Remaining Life: 2 years (based on maximum permitted rate of disposal of 6,000 tpd) In‐Place Density: 0.66 tons/cubic yard 3. MAXIMUM PERMITTED DAILY CAPACITY Daily: 6,000 tons [9,091 cubic yards] Yearly Equivalent: [1,560,000 tons] [2,836,364 cubic yards] 4. 2012 AVERAGE WASTE QUANTITIES DISPOSED Daily: 2,970 tons [4,500 cubic yards] 5. LAND USE/CONDITIONAL USE PERMIT
Permit No.: 89‐081(5) Effective: 05/20/1997 Expiration: 11/24/2019 or upon completion of approved filled design, whichever is sooner.
6. WASTE DISCHARGE REQUIREMENTS Order No.: 93‐062 Effective: 09/27/1993 Order No.: 98‐086 Effective: 11/02/1998 Order No.: R4‐2006‐0007 Effective: 01/19/2006 Order No.: R4‐2011‐0052 Effective: 03/03/2011 7. FOC GRANT DATE ‐ 02/19/1998 8. PERMITTED WASTE TYPES ‐ Solid waste 9. FUTURE LAND USE ‐ Open space 10. RESTRICTIONS ‐ Landfill cannot accept biosolids (water and wastewater sludge). There is no wasteshed restriction on origin of
waste. 11. REMARKS/STATUS ‐ On December 5, 2008, Republic Services, Inc. merged with Allied Waste Industries, Inc. Due to the merger,
Republic Services must divest Chiquita Canyon Landfill. On February 6, 2009, Republic Services and Waste Connections signed a definitive agreement providing for the sale of the Chiquita Canyon Landfill to Waste Connections, Inc. LUP limits waste disposal to 30,000 tons per week.
Note: Calculated or assumed quantities are shown in brackets.

2012 Annual Report Los Angeles County Countywide Integrated Waste Management Plan
51
ProposedExpansion
ChiquitaCanyonLandfillExpansion
1. FACILITY TYPE ‐ Class III landfill 2. OWNER/OPERATOR – Chiquita Canyon, LLC, a subsidiary of Waste Connections, Inc. 3. LOCATION ‐ 29201 Henry Mayo Drive, Valencia 91355 (Los Angeles County Unincorporated Area) 4. SIZE Increase in Proposed Disposal Area: 143 acres (Total 400 acres) Increase in Total Acreage of Site: 0 acres (Total 639 acres) Increase in Vertical Elevation: 143 feet 5. PROPOSED VOLUMETRIC CAPACITY Daily: 12,000 tons [20,000 cubic yards] Weekly: 60,000 tons [100,000 tons] Yearly Equivalent: [3,120,000 tons] [5,200,000 cubic yards] Additional Facility Capacity: [53,312,400tons] 88,854,000 cubic yards In‐Place Density: 0.6 tons/cubic yard 6. LAND USE/CONDITIONAL USE PERMIT – Effective: 05/09/1997 Expiration: 11/24/2019. 7. LIFE EXPECTANCY – An additional of 26 years based on 2011 average daily disposal of 4,264 tpd or 9 years based on the maximum
permitted rate of disposal of 12,000 tpd. 8. EXPANSION OPTIONS ‐ Proposed horizontal and vertical expansion of disposal area. The final elevation of the site increases from
1430’ to 1573’. 9. POST‐CLOSURE USES ‐ Open space 10. On December 5, 2008, Republic Services, Inc. merged with Allied Waste Industries, Inc, and was required to divest Chiquita
Canyon Landfill. On February 6, 2009, Republic Services and Waste Connections signed an agreement providing for the sale of the Chiquita Canyon Landfill to Waste Connections, Inc. Subsequently, Waste Connections, Inc. applied for a new CUP to increase the daily disposal capacity to 12,000 tpd. The County of Los Angeles Department of Regional Planning prepared a Notice of Preparation and circulated it for public comments from November 28, 2011 to February 13, 2012. On June 5, 2013, the County of Los Angeles Department of Regional Planning initiated the CEQA process on behalf of Waste Connections, Inc. for the landfill expansion and circulated the Draft Environmental Impact Report for County agencies’ reviews and comments from June 5, 2013 to August 5, 2013.
Note: Calculated or assumed quantities are shown in brackets.

2012 Annual Report Los Angeles County Countywide Integrated Waste Management Plan
52
CommerceRefuse‐to‐EnergyFacility(CREF)
1. FACILITY INFORMATION Owner: Commerce Refuse‐to‐Energy Authority (City of Operator: County Sanitation District No. 2 Commerce and County Sanitation District No. 2 of Los Angeles County of Los Angeles County)
Address: 5926 Sheila Street, Commerce, CA 90040 Operating Days: Monday‐Sunday SWFP No.: 19‐AA‐0506 SWFP Issue Date: 07/09/1997
Last 5‐year Review Date: 08/15/2007 5‐year Review Due Date: 08/15/2012
2. MAXIMUM PERMITTED DAILY CAPACITY Daily: 1,000 tons (SWFP Requirement) Weekly: 2,800 tons (SWFP Requirement) 3. 2012 AVERAGE WASTE QUANTITIES Daily Received: 363 tpd Daily Processed: 360 tpd 4. LAND USE/CONDITIONAL USE PERMIT – Not Applicable 5. WASTE DISCHARGE REQUIREMENTS ‐ Not Applicable 6. PERMITTED WASTE TYPES ‐ Solid waste 7. FOC GRANT DATE – 10/20/1983 8. FUTURE LAND USE ‐ Not applicable 9. RESTRICTIONS ‐ Facility requires high energy content waste. The City of Commerce Planning Commission made a written
determination that the facility is consistent with the City’s Plan, and the adjacent zoning and surrounding land use is compatible with its operation.

2012 Annual Report Los Angeles County Countywide Integrated Waste Management Plan
53
LancasterLandfillandRecyclingCenter
1. FACILITY INFORMATION Owner: Waste Management of California, Inc. Operator: Waste Management of California, Inc. Address: 600 East Avenue "F", Lancaster 93535 Operating Days: Monday‐Saturday
(Los Angeles County Unincorporated Area) SWFP No.: 19‐AA‐0050 SWFP Issue Date: 02/19/2013 Last 5‐year Review Date: 08/18/2011 5‐year Review Due Date: 02/19/2018
2. REMAINING PERMITTED CAPACITY (as of December 31, 2012) Remaining Permitted Capacity: 12,273,633 tons 14,490,712 cubic yards
Estimated Remaining Life: 13 years (based on maximum permitted rate of disposal of 3,000 tpd) In‐Place Density: 0.80 tons/cubic yard
3. MAXIMUM PERMITTED DAILY CAPACITY Daily: 3,000 tons [3,750 cubic yards]
Yearly Equivalent: [936,000 tons] [1,170,000 cubic yards] 4. 2012 AVERAGE WASTE QUANTITIES DISPOSED Daily: 690 tons [812 cubic yards] 5. LAND USE/CONDITIONAL USE PERMIT Permit No.: 03‐170‐(5) Effective: 12/14/2011 Expiration: 12/14/2041 6. WASTE DISCHARGE REQUIREMENTS Order No.: 6‐00‐55 Effective: 06/14/2000 7. FOC GRANT DATE ‐ 04/20/2000 8. PERMITTED WASTE TYPES ‐ Solid waste 9. FUTURE LAND USE ‐ Open space 10. RESTRICTIONS ‐ The Landfill cannot accept more than 10 tpd of biosolids (sewage sludge). There is no wasteshed restriction on
origin of waste. Note: Calculated or assumed quantities are shown in brackets.

2012 Annual Report Los Angeles County Countywide Integrated Waste Management Plan
54
Out‐of‐CountyLandfill
MesquiteRegionalLandfill
1. FACILITY INFORMATION Owner: County of Los Angeles Sanitation District 2 Operator: County of Los Angeles Sanitation District 2 of Los Angeles County Address: 6502 E Hwy 78, Brawley 92227 Operating Days: Not yet operational SWFP No.: 13‐AA‐0026 SWFP Issue Date: 04/08/97 Last 5‐year Review Date: 10/03/2011 5‐year Review Due Date: 10/03/2016 2. REMAINING PERMITTED CAPACITY (as of December 31, 2012) Remaining Permitted Capacity: [600,000,000 tons] [1,000,000,000 cubic yards] Estimated Remaining Life: 100 years In‐Place Density: 0.60 tons/cubic yard 3. MAXIMUM PERMITTED CAPACITY Daily: 20,000 tons [33,333 cubic yards] Yearly Equivalent: [7.3 million tons] [12.2 million cubic yards] 4. 2012 AVERAGE WASTE QUANTITIES DISPOSED Daily: Not yet operational 5. LAND USE/CONDITIONAL USE PERMIT Permit No.: NO. 060003 Effective: 04/27/2011 Expiration: To Be Determined 6. WASTE DISCHARGE REQUIREMENTS Order No.: R7‐2009‐0003 Effective: 06/18/2009 7. PERMITTED WASTE TYPES ‐ Solid Waste 8. FUTURE LAND USE – Disposal 9. RESTRICTIONS/CURRENT STATUS
In February 2007, the Sanitation Districts submitted an application to Imperial County to amend the Mesquite Regional Landfill CUP for the receipt of up to 4,000 tpd of municipal solid waste by truck. Once the waste‐by‐rail system is operational, the ability to receive waste by truck will provide operational flexibility with the ability to ramp up until enough tonnage is received to make up a unit train. Imperial County Planning and Development Services issued a Notice of Availability of the Final Subsequent EIR on October 6, 2010. The Board of Supervisors held a public hearing on the project on April 5, 2011, and subsequently approved the CUP. The Sanitation Districts also obtained a revised Solid Waste Facility Permit (SWFP) from CalRecycle/Local Enforcement Agency on October 1, 2011 for truck haul and other entitlements granted by the new CUP.
Note: Calculated or assumed quantities are shown in brackets.

2012 Annual Report Los Angeles County Countywide Integrated Waste Management Plan
55
PebblyBeachLandfill
1. FACILITY INFORMATION Owner: City of Avalon Operator: Seagull Sanitation Systems (Republic Services, Inc.) Address: 1 Dump Road, Avalon 90704 Operating Days: Monday‐Sunday (Los Angeles County Unincorporated Area) SWFP No.: 19‐AA‐0061 SWFP Issue Date: 04/10/2001 Last 5‐year Review Date: 05/03/2015 5‐year Review Due Date: 05/03/2010 2. REMAINING PERMITTED CAPACITY (as of December 31, 2012) Remaining Permitted Capacity: [93,066 tons] 104,568 cubic yards Estimated Remaining Life: 16 years (based on Land Use Permit Restriction) In‐Place Density: 0.89 tons/cubic yard 3. MAXIMUM PERMITTED DAILY CAPACITY Daily: 49 tons [55 cubic yards] Yearly Equivalent: [17,885 tons] [20,095 cubic yards] 4. 2012 AVERAGE WASTE QUANTITIES DISPOSED Daily: 8 tons [9 cubic yards] 5. LAND USE/CONDITIONAL USE PERMIT Permit No.: 96‐162‐(4) Effective: 07/29/1998 Expiration: 07/29/2028 6. WASTE DISCHARGE REQUIREMENTS Order No.: R4‐2002‐0058 Effective: 02/28/2002 7. FOC GRANT DATE ‐ 01/21/1999 8. PERMITTED WASTE TYPES ‐ Solid waste 9. FUTURE LAND USE ‐ Open space 10. RESTRICTIONS ‐ There is no wasteshed restriction on origin of waste. However, due to its location on Santa Catalina Island, only
the City of Avalon and adjacent unincorporated County areas have access to this facility. Note: Calculated or assumed quantities are shown in brackets.

2012 Annual Report Los Angeles County Countywide Integrated Waste Management Plan
56
PuenteHillsLandfill
1. FACILITY INFORMATION
Owner: County Sanitation District No. 18 of Operator: County Sanitation District 2 of Los Angeles County Los Angeles County
Address: 13130 Crossroads Parkway South, Industry 91746 Operating Days: Monday‐Saturday (Los Angeles County Unincorporated Area) SWFP No.: 19‐AA‐0053 SWFP Issue Date: 06/08/2010 Last 5‐year Review Date: 7/11/2008 5‐year Review Due Date: 06/08/2015 2. REMAINING PERMITTED CAPACITY (as of December 31, 2012) Remaining Permitted Capacity: 6,096,969 tons [11,085,398 cubic yards] Estimated Remaining Life: 1 year (based on Land Use Permit Restriction) Aggregate Density: 0.55 tons/cubic yard 3. MAXIMUM PERMITTED DAILY CAPACITY Daily: 13,200 tons [24,000 cubic yards] Yearly Equivalent: [4,118,400 tons] [7,488,000 cubic yards] 4. 2012 AVERAGE WASTE QUANTITIES DISPOSED Daily: 6,625 tons [12,045 cubic yards] 5. LAND USE/CONDITIONAL USE PERMIT Permit No.: 02‐027‐(4) Effective: 12/18/2002 Expiration: 10/31/2013 6. WASTE DISCHARGE REQUIREMENTS Order No.: 93‐062 Effective: 09/27/1993, amended by: Order No.: R4‐2006‐0007 Effective: 01/19/2006 7. FOC GRANT DATE ‐ 02/20/2003 8. PERMITTED WASTE TYPES ‐ Solid waste 9. FUTURE LAND USE ‐ Open space and recreational use 10. RESTRICTIONS ‐ Limited to 13,200 tpd of solid waste, 11,700 tpd of soil, and 33,000 tpw of beneficial reuse material. The Landfill
can only accept treated incinerator ash, and biosolids sewage (sludge) from the operator’s wastewater treatment facilities. The County of Los Angeles Regional Planning Commission granted a new Conditional Use Permit on December 18, 2002 and the limited life of the project to October 31, 2013.
Note: Calculated or assumed quantities are shown in brackets.

2012 Annual Report Los Angeles County Countywide Integrated Waste Management Plan
57
SanClementeLandfill
1. FACILITY INFORMATION
Owner: U.S. Department of the Navy Operator: U.S. Department of the Navy Address: Naval Auxiliary Landing Field, Operating Days: 2 days/week (Tuesday and Thursday) San Clemente Island 92135
SWFP No.: 19‐AA‐0063 SWFP Issue Date: 11/19/2002 Last 5‐year Review Date: 01/07/2008 5‐year Review Due Date: 01/07/2013
2. REMAINING PERMITTED CAPACITY (as of December 31, 2012) Remaining Permitted Capacity: [39,735 tons] 317,882 cubic yards (based on 12/9/2011) Estimated Remaining Life: 20 years (based on the current SWFP estimated closure date) In‐Place Density: 0.125 tons/cubic yard 3. MAXIMUM PERMITTED DAILY CAPACITY Daily: 10 tons [80 cubic yards] Yearly Equivalent: [1,040 tons] [8,320 cubic yards] 4. 2012 AVERAGE WASTE QUANTITIES DISPOSED Daily: 2 ton [16 cubic yards] 5. LAND USE/CONDITIONAL USE PERMIT – Not Applicable 6. WASTE DISCHARGE REQUIREMENTS – Not Applicable 7. FOC GRANT DATE – None 8. PERMITTED WASTE TYPES ‐ Solid waste 9. FUTURE LAND USE ‐ Open space 10. RESTRICTIONS ‐ This landfill is used solely by the U.S. Department of the Navy. SWFP is still under review by the CalRecycle as they
address new Title 27 methane monitoring requirements. Note: Calculated or assumed quantities are shown in brackets.

2012 Annual Report Los Angeles County Countywide Integrated Waste Management Plan
58
SchollCanyonLandfill
1. FACILITY INFORMATION
Owner: City of Glendale & County of Los Angeles Operator: County Sanitation Districts 2 of Los Angeles County Address: 3001 Scholl Canyon Road, Glendale, CA 91206 Operating Days: Monday‐Saturday
SWFP No.: 19‐AA‐0012 SWFP Issue Date: 12/13/2011 Last 5‐year Review Date: 12/03/2009 5‐year Review Due Date: 12/03/2014
2. REMAINING PERMITTED CAPACITY (as of December 31, 2012) Remaining Permitted Capacity: 3,407,178 tons 7,010,654 cubic yards Estimated Remaining Life: 16 years (based on average daily disposal of [675 tpd], 312 days per year) In‐Place Density: 0.486 tons/cubic yard 3. MAXIMUM PERMITTED DAILY CAPACITY Daily: 3,400 tons [6,996 cubic yards] Yearly Equivalent: [1,060,800 tons] [2,182,716 cubic yards] 4. 2012 AVERAGE WASTE QUANTITIES DISPOSED Daily: [675 tons] [1,389 cubic yards] 5. LAND USE/CONDITIONAL USE PERMIT Permit No.: 6668‐U (Zoning Variance) Effective: 11/27/1978 Expiration: Completion of Project 6. WASTE DISCHARGE REQUIREMENTS Order No.: 01‐132 Effective: 09/19/1988; Order No.: R4‐2011‐0052 Effective: 03/03/2011 7. FOC GRANT DATE ‐ None 8. PERMITTED WASTE TYPES ‐ Solid waste 9. FUTURE LAND USE ‐ Open space 10. RESTRICTIONS ‐ The use of the Landfill is restricted by the City of Glendale Ordinance 4780 to the County of Los Angeles Cities of
Glendale, La Canada Flintridge, Pasadena, South Pasadena, San Marino, and Sierra Madre; and the Los Angeles County unincorporated areas of Altadena, La Crescenta, Montrose; the unincorporated area bordered by the incorporated cities of San Gabriel, Rosemead, Temple City, Arcadia and Pasadena; and the unincorporated area immediately to the north of the City of San Marino bordered by the City of Pasadena on the west, north, and east sides.
Note: Calculated or assumed quantities are shown in brackets.

2012 Annual Report Los Angeles County Countywide Integrated Waste Management Plan
59
ProposedExpansion
SchollCanyonLandfillExpansion
1. FACILITY TYPE ‐ Class III landfill 2. OWNER: City of Glendale & County of Los Angeles OPERATOR: County Sanitation Districts 2 of Los Angeles County 3. LOCATION ‐ 3001 Scholl Canyon Road, Glendale, CA 91206 4. SIZE Increase in Proposed Disposal Area: 0 acres Increase in Total Acreage of Site: Variation 1: None Variation 2: To Be Determined Increase in Vertical Elevation: Variation 1: None Variation 2: To Be Determined 5. PROPOSED VOLUMETRIC CAPACITY Daily: 3,400 tons [7,556 cubic yards] Yearly Equivalent: [1,060,800 tons] [2,271,520 cubic yards] Additional Facility Capacity: Variation 1: 5.0 million tons (vertical expansion only): Variation 2: 6.0 million tons (horizontal and vertical expansion) In‐Place Density: 0.486 tons/cubic yard 6. ADDITIONAL LIFE DUE TO EXPANSION Variation 1:
[5 years] based on 5.0 million tons of remaining disposal capacity, at 3,400 tpd, and 312 operating days/year (based on permitted capacity); or
[21 years] based on 5.0 million tons of remaining disposal capacity, at 754 tpd, and 312 operating days/year (based on 2012 Average Daily Rate).
Variation 2:
[6 years] based on 6.0 million tons, at 3,400 tpd, and 312 operating days/year (based on permitted capacity); or [26 years] based on 6.0 million tons, at 754 tpd, and 312 operating days/year (based on 2012 Average Daily Rate). 7. EXPANSION OPTIONS ‐ The potential expansion of this Landfill is recognized in the Joint Powers Authority governing the
operation of the site; however, details on the expansion have not been finalized. The currently proposed expansion consists of two variations: Variation 1 (vertical expansion only) and Variation 2 (vertical and horizontal expansion). The Landfill would continue to be permitted to receive 3,400 tpd of non‐hazardous solid waste, and all resource and material recovery programs will continue to be implemented.
8. POST‐CLOSURE USES ‐ Park, recreation, and roadway purposes; or for the implementation of solid waste management
alternatives or other facilities related to the operation of a sanitary landfill on the premises. 9. REMARKS/STATUS ‐ It is estimated that once the permitted capacity is exhausted, approximately 6 million tons of potentially
available capacity would remain at the site.
Note: Calculated or assumed quantities are shown in brackets.

2012 Annual Report Los Angeles County Countywide Integrated Waste Management Plan
60
SoutheastResourceRecoveryFacility(SERRF)
1. FACILITY INFORMATION Owner: City of Long Beach Operator: Monterey Pacific Power Corporation
Address: 120 Pier South Avenue, Long Beach 90802 Operating Days: Monday‐Friday (receive) Monday‐Sunday (process)
SWFP No.: 19‐AK‐0083 SWFP Issue Date: 03/03/1998 Last 5‐year Review Date: 08/27/2009 5‐year Review Due Date: 08/27/2014
2. MAXIMUM PERMITTED DAILY CAPACITY Daily: 2,240 tons (SWFP Requirement) Yearly: 500,000 tons (Environmental Protection Agency requirement) 3. 2012 AVERAGE WASTE QUANTITIES Daily Received: 1,510 tpd Daily Processed: 1,509 tpd 4. LAND USE/CONDITIONAL USE PERMIT Permit No.: HDP‐84174 5. WASTE DISCHARGE REQUIREMENTS ‐ Not Applicable 6. PERMITTED WASTE TYPES ‐ Solid waste 7. FOC GRANT DATE ‐ 09/18/1997 8. FUTURE LAND USE ‐ Not applicable 9. RESTRICTIONS ‐ There is no wasteshed or restriction on origin of waste.

2012 Annual Report Los Angeles County Countywide Integrated Waste Management Plan
61
SunshineCanyonCity/CountyLandfill
1. FACILITY INFORMATION Owner: Republic Services, Inc. Operator: Republic Services, Inc. Address: 14747 San Fernando Road, Sylmar 91342 Operating Days: Monday‐Saturday SWFP No.: 19‐AA‐2000 SWFP Issue Date: 07/07/2008 Last 5‐year Review Date: 07/07/2008 5‐year Review Due Date: 07/07/2013 2. REMAINING PERMITTED CAPACITY (as of December 31, 2012) Remaining Permitted Capacity: 74,367,562 tons 96,393,470 cubic yards Estimated Remaining Life: 20 years (based on maximum permitted rate of disposal of 12,100 tpd)
In‐Place Density: 0.77 tons/cubic yard 3. MAXIMUM PERMITTED DAILY CAPACITY Daily: 12,100 tons [15,714 cubic yards] Yearly Equivalent: [3,775,200 tons] [4,902,857 cubic yards] 4. 2012 AVERAGE WASTE QUANTITIES DISPOSED Daily: 7,221 tons [9,378 cubic yards] 5. LAND USE/CONDITIONAL USE PERMIT Permit No.:00‐194‐(5) Effective: 05/24/2007 Expiration: 02/06/2037 6. WASTE DISCHARGE REQUIREMENTS Order No.: 93‐062 Effective: 09/27/1993 Order No.: R4‐2006‐0007 Effective: 01/19/2006 Order No.: R4‐2007‐0064 Effective: 12/06/2007 Order No.: R4‐2008‐0088 Effective: 10/02/2008 Order No.: R4‐2011‐0052 Effective: 03/03/2011 7. FOC GRANT DATE – 12/18/2008 8. PERMITTED WASTE TYPES ‐ Solid waste 9. FUTURE LAND USE ‐ Open space 10. RESTRICTIONS ‐ The Landfill cannot accept incinerator ash or biosolids (sewage sludge). The Landfill is prohibited from accepting
any solid waste generated outside the County. 11. REMARKS/STATUS ‐ On December 31, 2008, operations in the Sunshine Canyon County Landfill and the Sunshine Canyon City
Landfill were combined into one to what is known as the Sunshine Canyon City/County Landfill. Note: Calculated or assumed quantities are shown in brackets.

2012 Annual Report Los Angeles County Countywide Integrated Waste Management Plan
62
Whittier(SavageCanyon)Landfill
1. FACILITY INFORMATION Owner: City of Whittier Operator: City of Whittier Address: 13919 E. Penn St., Whittier, CA 90602 Operating Days: Monday‐Saturday
SWFP No.: 19‐AH‐0001 SWFP Issue Date: 02/28/1995 Last 5‐year Review Date: 01/27/2009 5‐year Review Due Date: 01/27/2014
2. REMAINING PERMITTED CAPACITY (as of December 31, 2012) Remaining Permitted Capacity: 3,556,023 tons [5,926,705 cubic yards]
Estimated Remaining Life: 13 years (based on the current SWPF estimated closure date) In‐Place Density: 0.6 tons/cubic yard
3. MAXIMUM PERMITTED DAILY CAPACITY Daily: 350 tons [584 cubic yards]
Yearly Equivalent: 109,200 tons [182,000 cubic yards] 4. 2012AVERAGE WASTE QUANTITIES DISPOSED Daily: 240 tons [400 cubic yards] 5. LAND USE/CONDITIONAL USE PERMIT Permit No.: City Resolution No. 4907 Effective: 08/23/1977 Expiration: Completion of project 6. WASTE DISCHARGE REQUIREMENTS Order No. 93‐062 Effective: 09/27/1993 Order No.: R4‐2006‐0007 Effective: 01/19/2006 Order No.: R4‐2006‐0080 Effective: 10/24/2006 Order No.: R4‐2011‐0052 Effective: 03/03/2011 7. FOC GRANT DATE – 11/30/1978 8. PERMITTED WASTE TYPES ‐ Mixed municipal, Construction/demolition, Industrial, Green Materials, and Inert waste. 9. FUTURE LAND USE ‐ Open space 10. RESTRICTIONS ‐ Hazardous, radioactive, liquid, or medical waste are all prohibited per Chapter 6.1, Division 20 of California Health
and Safety Code.
Note: Calculated or assumed quantities are shown in brackets.

2012 Annual Report Los Angeles County Countywide Integrated Waste Management Plan
63
ProposedExpansion
Whittier(SavageCanyon)LandfillExpansion
1. FACILITY TYPE ‐ Class III landfill 2. OWNER/OPERATOR ‐ City of Whittier 3. LOCATION ‐ 13919 E. Penn St., Whittier, CA 90602 4. SIZE Increase in Proposed Disposal Area: 0 acres Increase in Total Acreage of Site: 0 acres Increase in Vertical Elevation: To Be Determined 5. PROPOSED VOLUMETRIC CAPACITY Daily: 350 tons [584 cubic yards] Yearly Equivalent: 109,200 tons [182,000 cubic yards] Additional Facility Capacity: [2.63 million tons] 4.4 million cubic yards In‐Place Density: 0.6 tons/cubic yard 6. LIFE EXPECTANCY – An additional 35 years based on the 2011 average daily disposal of 241 tpd or 24 years based on the
maximum permitted rate of disposal of 350 tpd. 7. EXPANSION OPTIONS – See No. 4 for details 8. POST‐CLOSURE USES ‐ Open Space 9. REMARKS/STATUS ‐ Whittier Landfill is owned and operated by the City of Whittier. The City Public Works Department is
proposing to increase the site capacity from approximately 8.1 million cubic yards, as identified in the current SWFP issued on February 28, 1995, to 12.5 million cubic yards. The Local Enforcement Agency received an application for Solid Waste Facility Permit revision on March 2, 2012.
Note: Calculated or assumed quantities are shown in brackets.

2012 Annual Report Los Angeles County Countywide Integrated Waste Management Plan
64
Appendix E‐2 Tables

Solid Waste Location Permitted LUP 2012 Annual Disposal RemainingFacility Operation Maximum Life
Facility Permit City or Daily CommentsNumber Unincoporated Area Capacity (b)
Million Million (a) Yearsdays/week Tons Tons In-County Out-of-County Total In-County Out-of-County Total Tons Cubic Yards
Sunshine Canyon City/County 19-AA-2000 Los Angeles/ Unincorporated Area 6 12,100 2.217 0.000 2.217 7,107 0 7,107 96.39 20
The combined Sunshine Canyon City/County Landfill became effective December 31, 2008, based on a memorandum of understanding between the City and County of Los Angeles.
Waste-to-Energy (Transformation) Facilities
Commerce RefuseTo-Energy Facility
Southeast ResourceRecovery Facility
Permitted Inert Landfills
NOTES: Abbreviation:LUP Land Use Permit or Conditional Use PermitSWFP Solid Waste Facility Permit
FOOTNOTES:
(a) Conversion factor based on in-place solid waste density is provided by landfill operators, otherwise a conversion factor of 1,200 lb/cy was used for Class III landfills. (b) Remaing Life is based on either the 2012 average daily disposal tonnage or the facility's permit expiration date.(c) Based on the Solid Waste Facility Permit limit of 2,800 tons per week, expressed as a daily average, six days per week. (d) Based on EPA limit of 500,000 tons per year, expressed as a daily average, six days per week. (e) Tonnage expressed as a daily average, six days per week.
Source: Los Angeles County Department of Public Works, August 2013
Out-of-County Disposal Los Angeles County Waste Exported in 2012 to Out-of-County Class III Disposal Facilities = 1,844,175 tons or 5,911 tpd-6
TOTAL 0.054 1720.0890.035
Limited to the City of Burbank use only.
0.32
2. Estimated Remaining Permitted Capacity based on landfill owner/operator's response in a written survey conducted by Los Angeles County Department of Public Works in May 2013 as well as site-specific permit criteria established by local land use agencies,
2012 ANNUAL REPORTLOS ANGELES COUNTY COUNTYWIDE INTEGRATED WASTE MANAGEMENT PLAN
APPENDIX E-2 TABLE 1REMAINING PERMITTED DISPOSAL CAPACITY OF EXISTING SOLID WASTE DISPOSAL FACILITIES IN LOS ANGELES COUNTY
1,000
(See Note 1)(See Note 1)
68
0
34
Limited to the Scholl Canyon Wasteshed as defined by City of Glendale Ordinance No. 4780.
6,500
0.089 1720.054
Long Beach
AzusaAzusa Land Reclamation 19-AA-0013
---
6,500
3,240
0.0356
TOTAL 0.041
7 0.433
---
0.035
TOTAL 6.239
(c) 466.64
(d) 1,601.96
---
208 20,205
308
1,499
0.065 6.304
1,386
0.096Commerce19-AA-0506
11319-AK-0083
326
2,240
0.006
41,749 19,997
1,825
129.19
(e)
0.468
1,6950.570
Assumed to remain operational during the 15-year planning period.
52.13
By Court Order, on October 2, 1996, the California Regional Water Quality Control Board-Los Angeles region ordered the Azusa Land Reclamation Landfill to stop accepting Municipal Solid Waste. Permitted daily capacity of 6,500 tons per day consists of 6,000 tons per day of refuse and 500 tons per day of inert waste. Facility currently accepts inert waste only.
2,068.60
─
─131
0.04
11.09
3.56 5.93
74.37
3.41
114
286114 52.13
286 718
64.13
64.13
Limited to use by City of Whittier and waste haulers contracted with the City of Whittier.
Assumed to remain operational during the 15-year planning period. ─
New CUP became effective on December 14,2011, which allowed usage of the remaining design capacity of 12.3 million tons.
LUP expires July 29, 2028.
Landfill owned and operated by the U.S. Navy.
Proposed expansion pending. LUP limits waste disposal to 30,000 tons per week.
Limited to the Calabasas Wasteshed as defined by Los Angeles County Ordinance No. 91-0003.12.34
13
188
LUP limits waste disposal to 13,200 tons per day. The closure date is scheduled for October 31, 2013.
6.02
20
16
367.00
7.01
0.011
6
5
0.021
3,500
6,000 6,000
0.000
6
240
Chiquita Canyon
San Clemente
19-AA-0012
19-AA-0040
19-AA-0056
19-AA-0063
19-AA-0052
Burbank
Unincorporated Area
Burbank
Calabasas
19-AA-0050
19-AA-0061
19-AA-0053
Unincorporated Area
Unincorporated Area
Unincorporated Area
Unincorporated Area
Glendale/Unincorporated AreaScholl Canyon
Pebbly Beach
Puente Hills
Lancaster
San Clemente Island
822
6 13,200
6
0.024
0.00349
13,200
0.003 0.00049
2.144
7
3,000 0.0050.2085,100 0.213
2.168
0.906
--- 0.033
0.1873,500
30
41
16
2
13
16
1
2.95
14.49
5.51
3.97
12.27
0.09
6.10
0.2526
633
The City of Palmdale approved the expansion and combined Antelope Valley Landfills #1 & #2 on September 19, 2011. The estimated remaining capacity of 16.09 million tons includes an addition of 9 million tons as a result of the expansion.
599
107 5.36
SWFP
(See Note 2)
0.004
Estimated Remaining Permitted
0.256 16.9114
Maximum DailyCapacity
2012 Average Daily Disposal(Million Tons)
1,800 1,800
tpd-6
19.95
Capacity (as of December 31, 2012)
0.033
0.197
682
6,950
2,9710.927
15
0.109
2,903
667
9 0
6,872 78
107
Antelope Valley 808
1. Disposal quantities are based on actual tonnages reported by owners/operators of permitted solid waste disposal facilities to the Los Angeles County Department of Public Works' Solid Waste Information Management System (www.LACountySWIMS.org.)
7 777.73
2,669.94
0.211
Whittier (Savage Canyon) 19-AH-0001
0.529
0.000
---Whittier 6
---
3,447.67
18
0
0.102
2 0.000
0.078
19-AA-5624 Palmdale
---9.6
2500.078
675
0.000
6
0 250
1
675
0 1
3,400
12,100
350
0.000 0.000
0.211

(cubic yards)3 (tpd-6)3 (cubic yards) (tpd-6) (million cubic yards) (million tons)
Atkinson Brick Company N/A Los Angeles 6 N/A N/A 178 223 0.06 0.07
Chandler's Palos Verdes Sand & Gravel 19-AE-0004 Rolling Hills Estates 6 1,282 1,603 225 282 0.07 0.09
Durbin Inert Debris Engineered Fill Site 19-AA-1111 Irwindale 5 3,200 4,000 172 215 0.02 0.03
Hanson Aggregates (Livingston-Graham) 19-AA-00444 Irwindale 6 526 657 0 0 0.00 0.00
Lower Azusa Reclamation Project 19-AA-0868 Arcadia 6 3,205 4,006 1,696 2,120 0.53 0.66
Montebello Land & Water Co. 19-AA-0019 Montebello 6 0 1 0 0 0.00 0.00
Nu-Way Arrow 19-AA-1074 Irwindale 6 2,000 2,500 967 1,208 0.30 0.38
Peck Road Gravel Pit 19-AA-0838 Monrovia 6 1,120 1,400 0 0 0.00 0.00
Reliance Landfill 19-AA-0854 Irwindale 6 5,608 7,010 775 969 0.24 0.30
Sun Valley 19-AR-1160 Los Angeles 6 1,215 1,519 1,066 1,333 0.33 0.42
United Rock 19-AA-0046 Irwindale 6 3,077 3,846 0 0 0.00 0.00
TOTAL 21,233 26,541 5,080 6,350 1.55 1.94NOTES: 1. Disposal quantities for 2012 are based on actual tonnages reported by owners/operators through the Solid Waste Management Fee invoice receipt. 2. Conversion factor based on in-place solid waste density if provided by landfill operators, otherwise a conversion factor of 2,500 lb/cy was used. 3. Derived from the permit values noted in the CalRecycle Website as of April 2013. 4. Operator submitted an Inactive Notification to LEA on August 2007. The facility was still in-active based on the January 23, 2013 inspection.
Source: Los Angeles County Department of Public Works, August 2013
DISPOSAL CAPACITY OF INERT DEBRIS ENGINEERED FILL OPERATIONS IN LOS ANGELES COUNTY
APPENDIX E-2 TABLE 2
LOS ANGELES COUNTY COUNTYWIDE INTEGRATED WASTE MANAGEMENT PLAN2012 ANNUAL REPORT
2012 Average Daily Disposal 1 2012 Annual Disposal 2
FacilitySolid Waste
Facility Permit LocationOperation days/week
SWFP Maximum Daily Capacity

El Sobrante Landfill Riverside County NO 60 miles 6,179 4,000 2640 6 16,054 179 33 $35.12 per ton $5 per tonUSA Waste Services of California, Inc.
Frank R. Bowerman Sanitary Landfill6 Orange County NO 45 miles 7,123 1,500 158 6 11,500 119 41 $55.37 per ton 0
O.C. Waste and RecyclingOlinda Alpha Sanitary Landfill6
Orange County NO 30 miles 7,633 1,500 1878 6 8,000 27 9 $55.37 per ton 0O.C. Waste and Recycling
Prima Deshecha Sanitary Landfill6 Orange County NO 60 miles 1,678 1,500 60 6 4,000 74 55 $55.37 per ton 0O.C. Waste and Recycling
Simi Valley Landfill & Recycling Center Ventura County NO 50 miles 2,124 850 766 7 6,000 94 40 $58.00 per ton 0
Waste Management of California, Inc.
Mesquite Regional Landfill Imperial County YES 210 miles 12,000 20,000 582 85 $1-$5 per tonCounty Sanitation District No. 2 of Los Angeles County
TOTAL 21,350 5502
NOTES: 1. Distance is measured from Downtown Los Angeles, California. 2. Estimated quantity based on the Disposal Reporting System information from the respective Counties. 3. Waste exported to other Out of County landfills accounts for another 409 tons per day. Total Waste exported in 2012 is approximately 5,911 tons per day. 4. Estimated quantity provided by landfill operators in tons, otherwise a conversion factor of 1,200 lb/cy was used. 5. Tipping fees are based on current waste disposal fees provided by landfill operators.
Source: Los Angeles County Department of Public Works, August 2013
6. Remaining Permitted Disposal Capacity for Frank R. Bowerman Sanitary Landfill, Olinda Alpha Sanitary Landfill, and Prima Deshecha Sanitary Landfill were provided by OC Waste and Recycling Landfill Capacity Data Report as of June 30, 2012.
Remaining Design Life
(years)
Tipping Fees5
—
Permitted Daily
Disposal (tpd-6)
Import Surcharge
Potential Available Disposal
Capacity from Los Angeles
County (tpd)
Remaining Permitted Disposal Capacity
(million tons)4
—
Landfill can accept up to 11,054 tpd from other counties, includingLos Angeles County. Remaining capacity and design life are basedon the SWFP which was approved by CalRecycle on August 18,2009.
FacilityLocation
Owner/OperatorRail Access
Distance from Los Angeles County1
Operationdays/week Comments
2012 ANNUAL REPORTLOS ANGELES COUNTY COUNTYWIDE INTEGRATED WASTE MANAGEMENT PLAN
OUT-OF-COUNTY LANDFILLS CURRENTLY AVAILABLE FOR USE BY JURISDICTIONS IN LOS ANGELES COUNTYAPPENDIX E-2 TABLE 3
2012 Average Daily Disposal
Rate (tpd-6)
2012 Average Disposal from Los Angeles County2,3
(tpd-6)
Waste Management received all necessary permits to increase the daily maximum disposal tonnage from 3,000 tpd to 6,000 tpd.
Not yet operational. Permitted to reserve up to 1,000 tpd of availablecapacity for Imperial County. Up to 4,000 tpd may be transported bytruck haul.
The County of Orange has three import waste agreements with waste hauling companies to import waste into Orange County. Olinda AlphaLandfill's waste import agreement will expire on June 30, 2016. FrankR. Bowerman and Prima Desecha Landfills' waste import agreementwill end on December 31, 2015.
— —

POPULATION EMPLOYMENT(persons) (millions of persons) (persons) (millions of persons) (dollars) (billions of dollars)
2012 9,948,000 10 3,840,100 4 114,000,000,000 114.0
2013 10,021,000 10 3,896,400 4 116,600,000,000 116.6
2014 10,104,000 10 3,974,200 4 119,600,000,000 119.6
2015 10,187,000 10 4,050,300 4 122,500,000,000 122.5
2016 10,265,000 10 4,111,600 4 125,300,000,000 125.3
2017 10,339,000 10 4,156,900 4 127,900,000,000 127.9
2018 10,412,000 10 4,188,600 4 130,700,000,000 130.7
2019 10,485,000 10 4,213,500 4 133,500,000,000 133.5
2020 10,557,000 11 4,236,400 4 137,300,000,000 137.3
2021 10,629,000 11 4,255,700 4 137,700,000,000 137.7
2022 10,702,000 11 4,277,200 4 139,600,000,000 139.6
2023 10,777,000 11 4,305,100 4 141,800,000,000 141.8
2024 10,852,000 11 4,342,400 4 144,700,000,000 144.7
2025 10,928,000 11 4,384,700 4 145,800,000,000 145.8
2026 11,004,000 11 4,427,100 4 148,800,000,000 148.8
2027 11,080,000 11 4,468,800 4 151,800,000,000 151.8
Source: UCLA Anderson Longterm Forecast for Los Angeles County, dated July 2012.
LOS ANGELES COUNTY COUNTYWIDE INTEGRATED WASTE MANAGEMENT PLAN2012 ANNUAL REPORT
YEAR
POPULATION, EMPLOYMENT, AND REAL TAXABLE SALES IN LOS ANGELES COUNTY
APPENDIX E-2 TABLE 4
REAL TAXABLE SALES

A B C D E F G H I JPROJECTED AVAILABLE CLASS III LANDFILL
TOTAL PERCENT TOTAL TRANSFORMATION & TRANSFORMATION DISPOSAL NEEDGENERATION DIVERSION DIVERSION CLASS III LANDFILL CAPACITY ANNUAL CUMULATIVE (YEAR'S END)
YEAR TONS (ASSUMED) TONS DISPOSAL (TONS) TONS TONS CUBIC YARDS TONS CUBIC YARDS
2012 21,530,206 60% 12,918,124 8,612,083 645,600 7,966,483 13,277,471 7,966,483 13,277,4712013 21,900,137 60% 13,140,082 8,760,055 645,600 8,114,455 13,524,091 16,080,937 26,801,5622014 22,357,705 60% 13,414,623 8,943,082 645,600 8,297,482 13,829,137 24,378,419 40,630,6992015 22,803,001 60% 13,681,800 9,121,200 645,600 8,475,600 14,126,000 32,854,020 54,756,7002016 23,202,826 60% 13,921,696 9,281,131 645,600 8,635,531 14,392,551 41,489,550 69,149,2512017 23,546,415 60% 14,127,849 9,418,566 645,600 8,772,966 14,621,610 50,262,516 83,770,8602018 23,873,090 60% 14,323,854 9,549,236 645,600 8,903,636 14,839,393 59,166,152 98,610,2542019 24,183,298 60% 14,509,979 9,673,319 645,600 9,027,719 15,046,199 68,193,871 113,656,4522020 24,569,938 60% 14,741,963 9,827,975 645,600 9,182,375 15,303,959 77,376,247 128,960,4112021 24,670,525 60% 14,802,315 9,868,210 645,600 9,222,610 15,371,017 86,598,856 144,331,4272022 24,899,088 60% 14,939,453 9,959,635 645,600 9,314,035 15,523,392 95,912,892 159,854,8192023 25,168,209 60% 15,100,925 10,067,283 645,600 9,421,683 15,702,806 105,334,575 175,557,6252024 25,517,190 60% 15,310,314 10,206,876 645,600 9,561,276 15,935,460 114,895,851 191,493,0852025 25,731,750 60% 15,439,050 10,292,700 645,600 9,647,100 16,078,500 124,542,951 207,571,5852026 26,101,533 60% 15,660,920 10,440,613 645,600 9,795,013 16,325,022 134,337,964 223,896,6072027 26,469,621 60% 15,881,773 10,587,849 645,600 9,942,249 16,570,414 144,280,213 240,467,022
NOTES:1.2.
3.
4.
Source: County of Los Angeles Department of Public Works, August 2013
2012 ANNUAL REPORTLOS ANGELES COUNTY COUNTYWIDE INTEGRATED WASTE MANAGEMENT PLAN
APPENDIX E-2 TABLE 5LOS ANGELES COUNTY SOLID WASTE DISPOSAL CAPACITY
Waste generation (Column B) is calculated using CalRecycle's Adjustment Methodology, utilizing employment, population, and taxable sales projections from UCLA Anderson Long-term Forecast.
Columns H and J are based on Columns G and I, respectively, using an in-place waste density of 1,200 lb/cy.
Waste generation for 2012 is based on actual in-County and out-of-County transformation and Class III landfill disposal by jurisdictions in Los Angeles County. A 60 percent diversion rate is assumed. Thesetonnages DO NOT include inert waste disposed at permitted inert landfills.
The 2012 transformation and Class III landfill disposal quantity (first figure under Column E) is based on tonnages reported by permitted solid waste disposal facility operators in Los Angeles County and exportquantities reported by other counties to County of Los Angeles Department of Public Works as part of the 2012 Disposal Quantity Reporting data.

2012 Annual Report Los Angeles County Countywide Integrated Waste Management Plan
Appendix E‐3 Comparison of Daily Disposal Demand and SB 1016 Limit

Year Generation (Annual Tons) Population Per Capita Generation
(Lbs/Resident/Day)
2003 23,798,794 9,767,000 13.35
2004 23,933,735 9,793,000 13.39
2005 24,623,753 9,786,000 13.792006 23,614,933 9,738,000 13.29
13.45
50%
6.73
1.35
Year Disposal(Annual Tons) Population
Per Capita Disposal without Transformation Credit
(Lbs/Resident/Day)2012 8,612,083 9,948,000 4.74
Transformation(Annual Tons)
Per CapitaDisposal with
Transformation Credit(Lbs/Resident/Day)
528,765 4.45
Yes
(Generation)*(2000 lb/ton)(Population)*(365 days)
Source: Los Angeles County Department of Public Works, August 2013
2012 ANNUAL REPORTLOS ANGELES COUNTY COUNTYWIDE INTEGRATED WASTE MANAGEMENT PLAN
BASE YEAR PROJECTIONS BASED ON SB 1016 LIMIT
Per Capita Disposal Limit = (Four-Year Avg of Generation)*(1-Diversion Requirement Level)
Per Capita Disposal Limit:
Per Capita Transformation Credit Cap ( =10% x 13.45):
Transformation Credit
(Lbs/Resident/Day)
0.29
APPENDIX E-3
Is the per capita disposal less than the per capita disposal limit?
Note: Per Capita Generation =
Four-year Average of Generation:
Diversion Requirement Level:

Year Total Diversion Total Los Angeles SB 1016 SB 1016 SB 1016 MinimumAnnual Rate2 Annual County Per Capita Per Capita Annual Diversion RateWaste Status Quo Waste Population3 Disposal Disposal Disposal Equivalent
Generation1 Disposal Limit2 Limit To Meet SB 1016
(yearly)A B C = A*(1 - B) D E = (C*2000lb/ton)/(D*365 days) F G = (D*F*365days)/(2000lb/ton) I = (1 - G/A)*100
(tons) (Residents) (lb/res/day) (lb/res/day) (tons)
Footnotes:1. Waste Generation is estimated using CalRecycle's Adjustment Methodology, utilizing population projection, employment and taxable sales projections from UCLA Long term Forecast, August 2013.2. Per Capita Disposal Limit is based on 2003-2006 Base Year Projections on SB 1016 Limit.3. Los Angeles Countywide Population Projection (UCLA, Long Term Forecast of Los Angeles County, August 2013)
Source: Los Angeles County Department of Public Works, August 2013
12,218,3826.73
4.906
4.954
4.992
5.025
DailyDisposalDemand
4.7442012 21,530,206 8,612,08360%
21,900,137 8,760,05560%
10,021,000
SB1016DisposalLimit
2012 ANNUAL REPORTLOS ANGELES COUNTY COUNTYWIDE INTEGRATED WASTE MANAGEMENT PLAN
COMPARISON OF DAILY DISPOSAL DEMAND AND SB 1016 DISPOSAL LIMITAPPENDIX E-3
Status Quo
2016 23,202,826 9,281,13160%
10,187,0002015 22,803,001 9,121,20060%
10,265,000
9,948,000
4.790
4.8902014 22,357,705 8,943,08260%
10,021,0002013
47%6.73 12,877,939
13,328,698
6.73 12,788,279
46%
46%
6.73 12,511,928
6.73 12,607,730
12,966,371
43%
45%
46%
47%
6.73
2020
23,873,090 9,549,23660%
6.73 12,698,61810,339,0002017
10,485,0002019 5.055
9,418,56660%
10,412,0002018
23,546,415
24,183,298 9,673,31960%
24,569,938 9,827,97560%
11,080,000 6.73
10,852,000 6.73
5.161
5.236
10,557,000 6.735.101
10,777,000
10,702,000
48%
5.087
5.099
5.119
13,144,464
49%13,608,733
6.73
47%
47%
47%
48%
13,515,388 48%
2021
2023
2022 24,899,088 9,959,63560%
6.73 13,054,80410,629,00060%
13,236,58125,168,209 10,067,28360%
24,670,525 9,868,210
2027 26,469,621 10,587,84960%
6.73 13,422,04310,928,000
2024 25,517,190 10,206,87660%
25,731,750 10,292,7002025
5.154
60%
2026 26,101,533 60% 10,440,613 11,004,000 5.199 6.73
6.73
6.73 12,308,043
44%
45%
12,308,043

2012 Annual Report Los Angeles County Countywide Integrated Waste Management Plan
Appendix E‐4 Disposal Capacity Analysis Scenarios

• • Current Available Out-of-County Disposal Capacity
1 2 3 4 5 6 7 8 9 10 11 Total
R R R R RYear Waste Diversion Total Imports Daily Class III Antelope Burbank Calabasas Chiquita Lancaster Pebbly Beach Puente Hills San Clemente Scholl Sunshine Whittier Daily Export Available Class III Landfill
Generation Rate Daily from Available Landfill Valley City/County(Savage Canyon) Available Need Daily Daily DisposalRate1 Disposal Other Capacity from Daily Combined Capacity2 Out-of-County Capacity
Demand Counties Transformation Disposal Maximum Permitted Daily Capacity (tpd-6) from Disposal ShortfallFacilities Demand Expected Average Daily Tonnage (tpd-6) Class III Capacity (Reserve)
Remaining Capacity at Year's End (Million Tons) LandfillsA B C=A(1-B) D E F=C+D-E G H=F-G I J=H-I
(tpd-6) (tpd-6) (tpd-6) (tpd-6) (tpd-6) (tpd-6) (tpd-6) (tpd-6) (tpd-6)2012 69,007 60% 27,603 452 1,695 26,360 1,800 240 3,500 6,000 3,000 49 13,200 10 3,400 11,000 350 36,640 (10,280) 5,911 ─
808 107 599 2,903 667 9 6,872 1 675 7,107 250 16.9 3.0 5.5 4.0 12.3 0.1 6.1 0.04 3.4 74.4 3.6
2013 70,193 60% 28,077 500 2,069 26,508 1,800 240 3,500 6,000 3,000 49 13,200 10 3,400 11,000 350 36,650 (10,141) 6,200 (16,341)900 107 602 2,919 700 9 7,000 1.28 679 8,000 251
16.6 2.9 5.3 3.1 12.1 0.09 CP 0.04 3.2 71.9 3.52014 71,659 60% 28,664 700 2,069 27,295 1,800 240 3,500 6,000 3,000 49 10 3,400 11,000 350 23,499 3,797 6,200 (2,403)
1,000 111 620 4,000 800 10 1.32 699 9,000 259 16.3 2.9 5.1 1.8 11.8 0.09 0.04 3.0 69.1 3.4
2015 73,087 60% 29,235 700 2,069 27,866 1,800 240 3,500 6,000 3,000 49 10 3,400 11,000 350 23,534 4,332 6,200 (1,868)1,100 113 633 4,500 900 10 1.35 713 10,000 264
16.0 2.8 4.9 0.4 11.5 0.08 0.04 2.8 65.9 3.32016 74,368 60% 29,747 700 2,069 28,379 1,800 240 3,500 6,000 3,000 49 10 3,400 11,000 350 23,566 4,813 6,200 (1,387)
1,200 115 644 5,000 1,000 10 1.37 726 11,000 269 15.6 2.8 4.7 CC 11.2 0.08 0.04 2.5 62.5 3.2
2017 75,469 60% 30,188 700 2,069 28,819 1,800 240 3,500 3,000 49 10 3,400 11,000 350 17,593 11,226 6,200 5,0261,300 117 654 1,100 10 1.39 738 11,000 273
15.2 2.8 4.5 10.9 0.08 0.04 2.3 59.1 3.12018 76,516 60% 30,607 700 2,069 29,238 1,800 240 3,500 3,000 49 10 3,400 11,000 350 17,620 11,618 6,200 5,418
1,400 118 664 1,200 10 1.41 748 11,000 277 14.8 2.7 4.3 10.5 0.07 0.04 2.1 55.6 3.1
2019 77,511 60% 31,004 700 2,069 29,636 1,800 240 3,500 3,000 49 10 3,400 11,000 350 17,644 11,991 6,200 5,7911,500 120 673 1,200 10 1.43 759 11,000 281
14.3 2.7 4.1 CP 10.1 0.07 0.04 1.8 52.2 3.02020 78,750 60% 31,500 700 2,069 30,131 1,800 240 3,500 3,000 49 10 3,400 11,000 350 17,675 12,456 6,200 6,256
1,600 122 684 1,200 11 1.46 771 11,000 285 13.8 2.7 3.9 9.7 0.07 0.04 1.6 48.8 2.9
2021 79,072 60% 31,629 700 2,069 30,260 1,800 240 3,500 3,000 49 10 3,400 11,000 350 17,683 12,577 6,200 6,3771,700 123 687 1,200 11 1.46 775 11,000 287
13.3 2.6 3.7 9.4 0.06 0.04 1.3 45.4 2.82022 79,805 60% 31,922 700 2,069 30,553 1,800 240 3,500 3,000 49 10 3,400 11,000 350 17,701 12,852 6,200 6,652
1,800 124 694 1,200 11 1.48 782 11,000 289 12.7 2.6 3.5 9.0 0.06 0.03 1.1 41.9 2.7
2023 80,667 60% 32,267 700 2,069 30,898 1,800 240 3,500 3,000 49 10 3,400 11,000 350 17,723 13,175 6,200 6,9751,800 125 702 1,200 11 1.50 791 11,000 293
12.1 2.5 3.3 8.6 0.06 0.03 0.9 38.5 2.62024 81,786 60% 32,714 700 2,069 31,346 1,800 240 3,500 3,000 49 10 3,400 11,000 350 17,751 13,595 6,200 7,395
1,800 127 712 1,200 11 1.52 802 11,000 297 11.6 2.5 3.0 8.2 0.05 0.03 0.6 35.1 2.5
2025 82,474 60% 32,989 700 2,069 31,621 1,800 240 3,500 3,000 49 10 3,400 11,000 350 17,768 13,853 6,200 7,6531,800 128 718 1,200 11 1.53 809 11,000 300
11.0 2.5 CP 7.9 0.05 0.03 0.4 31.6 2.42026 83,659 60% 33,464 700 2,069 32,095 1,800 240 3,000 49 10 3,400 11,000 350 17,068 15,026 6,200 8,826
1,800 130 1,200 11 1.55 821 11,000 304 10.5 2.4 7.5 0.05 0.03 0.1 28.2 2.3
2027 84,839 60% 33,935 700 2,069 32,567 1,800 240 3,000 49 10 3,400 11,000 350 17,087 15,480 6,200 9,2801,800 132 1,200 11 1.58 834 11,000 308
9.9 2.4 7.1 0.04 0.03 CC 24.8 2.2ASSUMPTIONS:
1. Waste Generation is estimated using CalRecycle's Adjustment Methodology, utilizing population projection, employment and real taxable sales projections from UCLA's Longterm Forecast, August 2013.2. Total Daily Available Capacity from Class III Landfills is calculated based on Maximum Permitted Daily Capacity (in blue text) for facilities without a restricted wasteshed or Expected Average Daily Tonnage for facilities with a restricted wasteshed.
LEGEND:CC/CP -Closure due to exhausted capacity (CC) or permit expiration (CP)
E -Expansion may become effectiveR -Restricted wasteshed
Source: Los Angeles County Department of Public Works, August 2013.
2012 ANNUAL REPORT
IN-COUNTY CLASS III LANDFILLS
Existing In-County Class III Landfills and Transformation Facilities
SCENARIO I - STATUS QUOAPPENDIX E-4
LOS ANGELES COUNTY COUNTYWIDE INTEGRATED WASTE MANAGEMENT PLAN

• • •
1 2 3 4 5 6 7 8 9 10 11 Total
R R R R RYear Waste Diversion Total Imports Daily Class III Antelope Burbank Calabasas Chiquita Lancaster Pebbly Beach Puente Hills San Clemente Scholl Sunshine Whittier Daily Export Available Class III Landfill
Generation Rate Daily from Available Landfill Valley City/County (Savage Canyon) Available Need Daily Daily DisposalRate1 Disposal Other Capacity from Daily Combined Capacity2 Out-of-County Capacity
Demand Counties Transformation Disposal from Disposal ShortfallFacilities Demand Class III Capacity (Reserve)
LandfillsA B C=A(1-B) D E F=C+D-E G H=F-G I J=H-I
(tpd-6) (tpd-6) (tpd-6) (tpd-6) (tpd-6) (tpd-6) (tpd-6) (tpd-6) (tpd-6)2012 69,007 60% 27,603 452 1,695 26,360 1,800 240 3,500 6,000 3,000 49 13,200 10 3,400 11,000 350 36,640 (10,280) 5,911 ─
808 107 599 2,903 667 9.3 6,872 1.28 675 7,107 250 16.9 3.0 5.5 4.0 12.3 0.09 6.10 0.04 3.4 74.4 3.6
2013 70,193 60% 28,077 500 2,069 26,508 1,800 240 3,500 6,000 3,000 49 13,200 10 3,400 11,000 350 36,650 (10,141) 6,200 (16,341) 900 107 602 2,919 700 9 7,000 1.28 679 8,000 251 16.6 2.9 5.3 3.1 12.1 0.09 CP 0.04 3.2 71.9 3.5
2014 71,659 60% 28,664 700 2,069 27,295 1,800 240 3,500 6,000 3,000 49 10 3,400 11,000 350 23,499 3,797 6,200 (2,403) 1,000 111 620 3,006 800 10 1.32 699 9,000 259 16.3 2.9 5.1 2.1 11.8 0.09 0.04 3.0 69.1 3.4
2015 73,087 60% 29,235 700 2,069 27,866 1,800 240 3,500 6,000 3,000 49 10 3,400 11,000 350 23,534 4,332 6,200 (1,868) 1,100 113 633 3,069 900 10 1.35 713 10,000 264 16.0 2.8 4.9 1.2 11.5 0.08 0.04 2.8 65.9 3.3
2016 74,368 60% 29,747 700 2,069 28,379 1,800 240 3,500 6,000 3,000 49 10 3,400 11,000 350 23,566 4,813 6,200 (1,387) 1,200 115 644 3,125 1,000 10 1.37 726 11,000 269 15.6 2.8 4.7 0.2 11.2 0.08 0.04 2.5 62.5 3.2
2017 75,469 60% 30,188 700 2,069 28,819 1,800 240 3,500 6,000 3,000 49 10 3,400 11,000 350 23,593 5,226 6,200 (974) 1,300 117 654 3,174 1,100 10 1.39 738 11,000 273 15.2 2.8 4.5 CC 10.9 0.08 0.04 2.3 59.1 3.1
2018 76,516 60% 30,607 700 2,069 29,238 1,800 240 3,500 3,000 49 10 3,400 11,000 350 17,620 11,618 6,200 5,418 1,400 118 664 1,200 10 1.41 748 11,000 277 14.8 2.7 4.3 10.5 0.07 0.04 2.1 55.6 3.1
2019 77,511 60% 31,004 700 2,069 29,636 1,800 240 3,500 3,000 49 10 3,400 11,000 350 17,644 11,991 6,200 5,791 1,500 120 673 1,200 10 1.43 759 11,000 281 14.3 2.7 4.1 CP 10.1 0.07 0.04 1.8 52.2 3.0
2020 78,750 60% 31,500 700 2,069 30,131 1,800 240 3,500 3,000 49 10 3,400 11,000 350 17,675 12,456 6,200 6,256 1,600 122 684 1,200 11 1.46 771 11,000 285 13.8 2.7 3.9 9.7 0.07 0.04 1.6 48.8 2.9
2021 79,072 61% 30,838 700 2,069 29,470 1,800 240 3,500 3,000 49 10 3,400 11,000 350 17,634 11,836 6,200 5,636 1,700 119 669 1,200 10 1.43 754 11,000 279 13.3 2.6 3.7 9.4 0.06 0.04 1.4 45.4 2.8
2022 79,805 62% 30,326 700 2,069 28,957 1,800 240 3,500 3,000 49 10 3,400 11,000 350 17,602 11,355 6,200 5,155 1,800 117 658 1,200 10 1.40 741 11,000 274 12.7 2.6 3.5 9.0 0.06 0.04 1.1 41.9 2.7
2023 80,667 63% 29,847 700 2,069 28,478 1,800 240 3,500 3,000 49 10 3,400 11,000 350 17,572 10,906 6,200 4,706 1,800 115 647 1,200 10 1.38 729 11,000 270 12.1 2.6 3.3 8.6 0.06 0.03 0.9 38.5 2.6
2024 81,786 64% 29,443 700 2,069 28,074 1,800 240 3,500 3,000 49 10 3,400 11,000 350 17,547 10,527 6,200 4,327 1,800 114 638 1,200 10 1.36 719 11,000 266 11.6 2.5 3.1 8.2 0.06 0.03 0.7 35.1 2.5
2025 82,474 65% 28,866 700 2,069 27,497 1,800 240 3,500 3,000 49 10 3,400 11,000 350 17,511 9,986 6,200 3,786 1,800 111 624 1,200 10 1.33 704 11,000 260 11.0 2.5 CP 7.9 0.05 0.03 0.4 31.6 2.5
2026 83,659 65% 29,281 700 2,069 27,912 1,800 240 3,000 49 10 3,400 11,000 350 16,903 11,009 6,200 4,809 1,800 113 1,200 10 1.35 714 11,000 264 10.5 2.4 7.5 0.05 0.03 0.2 28.2 2.4
2027 84,839 65% 29,693 700 2,069 28,325 1,800 240 3,000 49 10 3,400 11,000 350 17,045 11,280 6,200 5,080 1,800 240 1,200 10 1.37 725 11,000 268 9.9 2.4 7.1 0.0 0.03 0.00 24.8 2.3
ASSUMPTIONS:1. Waste Generation is estimated using CalRecycle's Adjustment Methodology, utilizing population projection, employment and real taxable sales projections from UCLA's Longterm Forecast, August 2013.2. Total Daily Available Capacity from Class III Landfills is calculated based on Maximum Permitted Daily Capacity (in blue text) for facilities without a restricted wasteshed or Expected Average Daily Tonnage for facilities with a restricted wasteshed.
LEGEND:CC/CP -Closure due to exhausted capacity (CC) or permit expiration (CP)
E -Expansion may become effectiveR -Restricted wasteshed
Source: Los Angeles County Department of Public Works, August 2013.
Remaining Capacity at Year's End (Million Tons)
IN-COUNTY CLASS III LANDFILLS
Maximum Permitted Daily Capacity (tpd-6)
Current Available Out-of-County Disposal CapacityExisting In-County Class III Landfills and Transformation Facilities Increase In Diversion (up to 65% by 2025)
SCENARIO II - INCREASE IN DIVERSION RATE (Up to 65% by 2025)APPENDIX E-4
LOS ANGELES COUNTY COUNTYWIDE INTEGRATED WASTE MANAGEMENT PLAN2012 ANNUAL REPORT
Expected Average Daily Tonnage (tpd-6)

• • ••
1 2 3 4 5 6 7 8 9 10 11 Total
R R R R RYear Waste Diversion Total Imports Daily Maximum Class III Antelope Burbank Calabasas Chiquita Lancaster Pebbly Beach Puente Hills San Clemente Scholl Sunshine Whittier Daily Export Available Class III Landfill
Generation Rate Daily from Available Alternative Landfill Valley City/County (Savage Canyon) Available Need Out-of-County Daily DisposalRate1 Disposal Other Capacity from Technology Daily Combined Capacity2 Disposal Capacity
Demand Counties Transformation Capacity Disposal from Capacity ShortfallFacilities Demand Class III (Reserve)
LandfillsA B C=A(1-B) D E F G=C+D-E-F H I=G-H J K=I-J
(tpd-6) (tpd-6) (tpd-6) (tpd-6) (tpd-6) (tpd-6) (tpd-6) (tpd-6) (tpd-6) (tpd-6)2012 69,007 60% 27,603 452 1,695 0 26,360 1,800 240 3,500 6,000 3,000 49 13,200 10 3,400 11,000 350 36,640 (10,280) 5,911 ─
808 107 599 2,903 667 9.3 6,872 1.28 675 7,541 250 16.9 3.0 5.5 4.0 12.3 0.09 6.1 0.04 3.4 74.4 3.6
2013 70,193 60% 28,077 500 2,069 0 26,508 1,800 240 3,500 6,000 3,000 49 13,200 10 3,400 11,000 350 36,650 (10,141) 6,200 (16,341) 900 107 602 2,919 700 9 7,000 1.28 679 8,000 251 16.6 2.9 5.3 3.1 12.1 0.09 CP 0.04 3.2 71.9 3.5
2014 71,659 60% 28,664 700 2,069 0 27,295 1,800 240 3,500 6,000 3,000 49 10 3,400 11,000 350 23,499 3,797 6,200 (2,403) 1,000 111 620 3,006 800 10 1.32 699 9,000 259 16.3 2.9 5.1 2.1 11.8 0.09 0.04 3.0 69.1 3.4
2015 73,087 60% 29,235 700 2,069 0 27,866 1,800 240 3,500 6,000 3,000 49 10 3,400 11,000 350 23,534 4,332 6,200 (1,868) 1,100 113 633 3,069 900 10 1.35 713 10,000 264 16.0 2.8 4.9 1.2 11.5 0.08 0.04 2.8 65.9 3.3
2016 74,368 60% 29,747 700 2,069 0 28,379 1,800 240 3,500 6,000 3,000 49 10 3,400 11,000 350 23,566 4,813 6,200 (1,387) 1,200 115 644 3,125 1,000 10 1.37 726 11,000 269 15.6 2.8 4.7 0.2 11.2 0.08 0.04 2.5 62.5 3.2
2017 75,469 60% 30,188 700 2,069 1,300 27,519 1,800 240 3,500 6,000 3,000 49 10 3,400 11,000 350 23,513 4,007 6,200 (2,193) 1,300 112 625 3,031 1,100 10 1.33 704 11,000 261 15.2 2.8 4.5 CC 10.9 0.08 0.04 2.3 59.1 3.1
2018 76,516 60% 30,607 700 2,069 1,300 27,938 1,800 240 3,500 3,000 49 10 3,400 11,000 350 17,539 10,399 6,200 4,199 1,400 113 634 1,200 10 1.35 715 11,000 265 14.8 2.7 4.3 10.5 0.07 0.04 2.1 55.6 3.1
2019 77,511 60% 31,004 700 2,069 1,300 28,336 1,800 240 3,500 3,000 49 10 3,400 11,000 350 17,563 10,772 6,200 4,572 1,500 115 643 1,200 10 1.37 725 11,000 268 14.3 2.7 4.1 CP 10.1 0.07 0.04 1.9 52.2 3.0
2020 78,750 60% 31,500 700 2,069 1,300 28,831 1,800 240 3,500 3,000 49 10 3,400 11,000 350 17,594 11,237 6,200 5,037 1,600 117 655 1,200 10 1.40 738 11,000 273 13.8 2.7 3.9 9.7 0.07 0.04 1.6 48.8 2.9
2021 79,072 61% 30,838 700 2,069 2,300 27,170 1,800 240 3,500 3,000 49 10 3,400 11,000 350 17,491 9,679 6,200 3,479 1,700 110 617 1,200 10 1.31 695 11,000 257 13.3 2.6 3.7 9.4 0.07 0.04 1.4 45.4 2.8
2022 79,805 62% 30,326 700 2,069 2,300 26,657 1,800 240 3,500 3,000 49 10 3,400 11,000 350 17,459 9,198 6,200 2,998 1,800 108 605 1,200 9 1.29 682 11,000 253 12.7 2.6 3.6 9.0 0.06 0.04 1.2 41.9 2.7
2023 80,667 63% 29,847 700 2,069 2,300 26,178 1,800 240 3,500 3,000 49 10 3,400 11,000 350 17,429 8,749 6,200 2,549 1,800 106 594 1,200 9 1.27 670 11,000 248 12.1 2.6 3.4 8.6 0.06 0.03 1.0 38.5 2.7
2024 81,786 64% 29,443 700 2,069 2,300 25,774 1,800 240 3,500 3,000 49 10 3,400 11,000 350 17,404 8,370 6,200 2,170 1,800 104 585 1,200 9 1.25 660 11,000 244 11.6 2.5 3.2 8.2 0.06 0.03 0.8 35.1 2.6
2025 82,474 65% 28,866 700 2,069 2,300 25,197 1,800 240 3,500 3,000 49 10 3,400 11,000 350 17,368 7,829 6,200 1,629 1,800 102 572 1,200 9 1.22 645 11,000 239 11.0 2.5 CP 7.9 0.05 0.03 0.6 31.6 2.5
2026 83,659 65% 29,281 700 2,069 2,300 25,612 1,800 240 3,000 49 10 3,400 11,000 350 16,812 8,800 6,200 2,600 1,800 104 1,200 9 1.24 656 11,000 243 10.5 2.5 7.5 0.05 0.03 0.4 28.2 2.4
2027 84,839 65% 29,693 700 2,069 2,300 26,025 1,800 240 3,000 49 10 3,400 11,000 350 16,829 9,196 6,200 2,996 1,800 105 1,200 9 1.26 666 11,000 247 9.9 2.4 7.1 0.05 0.03 C 24.8 2.4
ASSUMPTIONS:1. Waste Generation is estimated using CalRecycle's Adjustment Methodology, utilizing population projection, employment and real taxable sales projections from UCLA's Longterm Forecast, August 2013.2. Total Daily Available Capacity from Class III Landfills is calculated based on Maximum Permitted Daily Capacity (in blue text) for facilities without a restricted wasteshed or Expected Average Daily Tonnage for facilities with a restricted wasteshed.
LEGEND:CC/CP -Closure due to exhausted capacity (CC) or permit expiration (CP)
E -Expansion may become effectiveR -Restricted wasteshed
Source: Los Angeles County Department of Public Works, August 2013.
LOS ANGELES COUNTY COUNTYWIDE INTEGRATED WASTE MANAGEMENT PLAN2012 ANNUAL REPORT
Remaining Capacity at Year's End (Million Tons)Expected Average Daily Tonnage (tpd-6)
IN-COUNTY CLASS III LANDFILLS
Existing In-County Class III Landfills and Transformation Facilities Current Available Out-of-County Disposal Capacity Increase In Diversion Rate (up to 65% by 2025)
Maximum Permitted Daily Capacity (tpd-6)
Utilization of Alternative Technology Capacity (Up to 2,300 tpd by 2021)
SCENARIO III - UTILIZATION OF ALTERNATIVE TECHNOLOGY CAPACITY (UP TO 2,300 TPD BY 2021)APPENDIX E-4

• • •• •
1 2 3 4 5 6 7 8 9 10 11 Total
R R R R RYear Waste Diversion Total Imports Daily Maximum Class III Antelope Burbank Calabasas Chiquita Lancaster Pebbly Beach Puente Hills San Clemente Scholl Sunshine Whittier Daily Export Available Class III Landfill
Generation Rate Daily from Available Alternative Landfill Valley City/County (Savage Canyon) Available Need Daily Daily DisposalRate1 Disposal Other Capacity from Technology Daily Combined Capacity2 Out-of-County Capacity
Demand Counties Transformation Capacity Disposal from Disposal ShortfallFacilities Demand Class III Capacity (Reserve)
LandfillsA B C=A(1-B) D E F G=C+D-E-F H I=G-H J K=I-J
(tpd-6) (tpd-6) (tpd-6) (tpd-6) (tpd-6) (tpd-6) (tpd-6) (tpd-6) (tpd-6) (tpd-6)2012 69,007 60% 27,603 452 1,695 0 26,360 1,800 240 3,500 6,000 3,000 49 13,200 10 3,400 11,000 350 36,640 (10,280) 5,911 ─
808 107 599 2,903 667 9.3 6,872 1.28 675 7,541 250 16.9 3.0 5.5 4.0 12.3 0.09 6.10 0.04 3.4 74.4 3.6
2013 70,193 60% 28,077 500 2,069 0 26,508 1,800 240 3,500 6,000 3,000 49 13,200 10 3,400 11,000 350 36,650 (10,141) 6,200 (16,341) 900 107 602 2,919 700 9 7,000 1.28 679 8,000 251 16.6 2.9 5.3 3.1 12.1 0.09 CP 0.04 3.2 71.9 3.5
2014 71,659 60% 28,664 700 2,069 0 27,295 1,800 240 3,500 6,000 3,000 49 10 3,400 11,000 350 23,499 3,797 6,200 (2,403) 1,000 111 620 4,000 800 10 1.32 699 9,000 259 16.3 2.9 5.1 1.8 11.8 0.09 0.04 3.0 69.1 6.0 E
2015 73,087 60% 29,235 700 2,069 0 27,866 1,800 240 3,500 6,000 3,000 49 10 3,400 11,000 350 23,534 4,332 6,200 (1,868) 1,100 113 633 5,000 900 10 1.35 713 10,000 264 16.0 2.8 4.9 0.3 11.5 0.08 0.04 2.8 65.9 5.9
2016 74,368 60% 29,747 700 2,069 0 28,379 1,800 240 3,500 12,000 3,000 49 10 3,400 11,000 350 29,566 (1,187) 6,200 (7,387) 1,200 115 644 6,000 1,000 10 1.37 726 11,000 269 15.6 2.8 4.7 57.9 E 11.2 0.08 0.04 2.5 62.5 5.9
2017 75,469 60% 30,188 700 2,069 1,300 27,519 1,800 240 3,500 12,000 3,000 49 10 3,400 11,000 350 29,513 (1,993) 6,200 (8,193) 1,300 112 625 7,000 1,100 10 1.33 704 11,000 261 15.2 2.8 4.5 55.7 10.9 0.08 0.04 2.3 59.1 5.8
2018 76,516 60% 30,607 700 2,069 1,300 27,938 1,800 240 3,500 12,000 3,000 49 10 3,400 11,000 350 29,539 (1,601) 6,200 (7,801) 1,400 113 634 8,000 1,200 10 1.35 715 11,000 265 14.8 2.7 4.3 53.2 10.5 0.07 0.04 2.1 55.6 5.7
2019 77,511 60% 31,004 700 2,069 1,300 28,336 1,800 240 3,500 12,000 3,000 49 10 3,400 11,000 350 29,563 (1,228) 6,200 (7,428) 1,500 115 643 9,000 1,200 10 1.37 725 11,000 268 14.3 2.7 4.1 50.4 10.1 0.07 0.04 1.9 52.2 5.6
2020 78,750 60% 31,500 700 2,069 1,300 28,831 1,800 240 3,500 12,000 3,000 49 10 3,400 11,000 350 29,594 (763) 6,200 (6,963) 1,600 117 655 10,000 1,200 10 1.40 738 11,000 273 13.8 2.7 3.9 47.3 9.7 0.07 0.04 7.6 E 48.8 5.5
2021 79,072 61% 30,838 700 2,069 2,300 27,170 1,800 240 3,500 12,000 3,000 49 10 3,400 11,000 350 29,491 (2,321) 6,200 (8,521) 1,700 110 617 11,000 1,200 10 1.31 695 11,000 257 13.3 2.6 3.7 43.8 9.4 0.07 0.04 7.4 45.4 5.5
2022 79,805 62% 30,326 700 2,069 2,300 26,657 1,800 240 3,500 12,000 3,000 49 10 3,400 11,000 350 29,459 (2,802) 6,200 (9,002) 1,800 108 605 12,000 1,200 9 1.29 682 11,000 253 12.7 2.6 3.6 40.1 9.0 0.06 0.04 7.2 41.9 5.4
2023 80,667 63% 29,847 700 2,069 2,300 26,178 1,800 240 3,500 12,000 3,000 49 10 3,400 11,000 350 29,429 (3,251) 6,200 (9,451) 1,800 106 594 12,000 1,200 9 1.27 670 11,000 248 12.1 2.6 3.4 36.4 8.6 0.06 0.03 7.0 38.5 5.3
2024 81,786 64% 29,443 700 2,069 2,300 25,774 1,800 240 3,500 12,000 3,000 49 10 3,400 11,000 350 29,404 (3,630) 6,200 (9,830) 1,800 104 585 12,000 1,200 9 1.25 660 11,000 244 11.6 2.5 3.2 32.6 8.2 0.06 0.03 6.8 35.1 5.2
2025 82,474 65% 28,866 700 2,069 2,300 25,197 1,800 240 3,500 12,000 3,000 49 10 3,400 11,000 350 29,368 (4,171) 6,200 (10,371) 1,800 102 572 12,000 1,200 9 1.22 645 11,000 239 11.0 2.5 CP 28.9 7.9 0.05 0.03 6.6 31.6 5.1
2026 83,659 65% 29,281 700 2,069 2,300 25,612 1,800 240 12,000 3,000 49 10 3,400 11,000 350 28,812 (3,200) 6,200 (9,400) 1,800 104 12,000 1,200 9 1.24 656 11,000 243 10.5 2.5 25.1 7.5 0.05 0.03 6.38 28.2 5.1
2027 84,839 65% 29,693 700 2,069 2,300 26,025 1,800 240 12,000 3,000 49 10 3,400 11,000 350 28,829 (2,804) 6,200 (9,004) 1,800 105 12,000 1,200 9 1.26 666 11,000 247 9.9 2.4 21.4 7.1 0.05 0.03 6.17 24.8 5.0
ASSUMPTIONS:1. Waste Generation is estimated using CalRecycle's Adjustment Methodology, utilizing population projection, employment and real taxable sales projections from UCLA's Longterm Forecast, August 2013.2. Total Daily Available Capacity from Class III Landfills is calculated based on Maximum Permitted Daily Capacity (in blue text) for facilities without a restricted wasteshed or Expected Average Daily Tonnage for facilities with a restricted wasteshed.
LEGEND:CC/CP -Closure due to exhausted capacity (CC) or permit expiration (CP)
E -Expansion may become effectiveR -Restricted wasteshed
Source: Los Angeles County Department of Public Works, August 2013
SCENARIO IV - IN-COUNTY CLASS III LANDFILLS EXPANSIONSAPPENDIX E-4
LOS ANGELES COUNTY COUNTYWIDE INTEGRATED WASTE MANAGEMENT PLAN2012 ANNUAL REPORT
Remaining Capacity at Year's End (Million Tons)Expected Average Daily Tonnage (tpd-6)
Existing In-County Class III Landfills &Transformation FacilitiesProposed Expansions of In-County Class III Landfills
Maximum Permitted Daily Capacity (tpd-6)
Current Available Out-of-County Disposal CapacityUtilization of Alternative Technology Capacity (up to 2,300 tpd by 2021)
IN-COUNTY CLASS III LANDFILLS
Increase In Diversion Rate (up to 65% by 2025)

• • •• •
1 2 3 4 5 6 7 8 9 10 11 Total
R R R R RYear Waste Diversion Total Imports Daily Maximum Class III Antelope Burbank Calabasas Chiquita Lancaster Pebbly Beach Puente Hills San Clemente Scholl Sunshine Whittier Daily Export Available Class III Landfill
Generation Rate Daily from Available Alternative Landfill Valley City/County (Savage Canyon) Available Need Daily Daily DisposalRate1 Disposal Other Capacity from Technology Daily Combined Capacity2 Out-of-County Capacity
Demand Counties Transformation Capacity Disposal from Disposal ShortfallFacilities Demand Class III Capacity (Reserve)
LandfillsA B C=A(1-B) D E F G=C+D-E-F H I=G-H J K=I-J
(tpd-6) (tpd-6) (tpd-6) (tpd-6) (tpd-6) (tpd-6) (tpd-6) (tpd-6) (tpd-6) (tpd-6)2012 69,007 60% 27,603 452 1,695 0 26,360 1,800 240 3,500 6,000 3,000 49 13,200 10 3,400 11,000 350 36,640 (10,280) 5,911 ─
808 107 599 2,903 667 9 6,872 1.28 675 7,541 250 16.9 3.0 5.5 4.0 12.3 0.09 6.10 0.04 3.4 74.4 3.6
2013 70,193 60% 28,077 500 2,069 0 26,508 1,800 240 3,500 6,000 3,000 49 13,200 10 3,400 11,000 350 36,650 (10,141) 6,200 (16,341) 900 107 602 2,919 700 9 7,000 1.28 679 8,000 251 16.6 2.9 5.3 3.1 12.1 0.09 CP 0.04 3.2 71.9 3.5
2014 71,659 60% 28,664 700 2,069 0 27,295 3,600 240 3,500 6,000 3,000 49 10 3,400 11,000 350 25,299 1,997 7,500 (5,503) 1,000 111 620 4,000 800 10 1.32 699 9,000 259 16.3 2.9 5.1 1.8 11.8 0.09 0.04 3.0 69.1 6.0 E
2015 73,087 60% 29,235 700 2,069 0 27,866 3,600 240 3,500 12,000 3,000 49 10 3,400 11,000 350 31,334 (3,468) 10,000 (13,468) 1,100 113 633 5,000 900 10 1.35 713 10,000 264 16.0 2.8 4.9 0.3 12.3 0.08 0.04 2.8 65.9 5.9
2016 74,368 60% 29,747 700 2,069 0 28,379 3,600 240 3,500 12,000 3,000 49 10 3,400 11,000 350 31,366 (2,987) 10,000 (12,987) 1,200 115 644 6,000 1,000 10 1.37 726 11,000 269 15.6 2.8 4.7 57.9 E 12.0 0.08 0.04 2.5 62.5 5.9
2017 75,469 60% 30,188 700 2,069 1,300 27,519 3,600 240 3,500 12,000 3,000 49 10 3,400 11,000 350 31,313 (3,793) 10,000 (13,793) 1,300 112 625 7,000 1,100 10 1.33 704 11,000 261 15.2 2.8 4.5 55.7 11.7 0.08 0.04 2.3 59.1 5.8
2018 76,516 60% 30,607 700 2,069 1,300 27,938 3,600 240 3,500 12,000 3,000 49 10 3,400 11,000 350 31,339 (3,401) 10,000 (13,401) 1,400 113 634 8,000 1,200 10 1.35 715 11,000 265 14.8 2.7 4.3 53.2 11.3 0.07 0.04 2.1 55.6 5.7
2019 77,511 60% 31,004 700 2,069 1,300 28,336 3,600 240 3,500 12,000 3,000 49 10 3,400 11,000 350 31,363 (3,028) 10,000 (13,028) 1,500 115 643 9,000 1,200 10 1.37 725 11,000 268 14.3 2.7 4.1 50.4 10.9 0.07 0.04 1.9 52.2 5.6
2020 78,750 60% 31,500 700 2,069 1,300 28,831 3,600 240 3,500 12,000 3,000 49 10 3,400 11,000 350 31,394 (2,563) 12,000 (14,563) 1,600 117 655 10,000 1,200 10 1.40 738 11,000 273 13.8 2.7 3.9 47.3 10.6 0.07 0.04 7.6 E 48.8 5.5
2021 79,072 61% 30,838 700 2,069 2,300 27,170 3,600 240 3,500 12,000 3,000 49 10 3,400 11,000 350 31,291 (4,121) 12,000 (16,121) 1,700 110 617 11,000 1,200 10 1.31 695 11,000 257 13.3 2.6 3.7 43.8 10.2 0.07 0.04 7.4 45.4 5.5
2022 79,805 62% 30,326 700 2,069 2,300 26,657 3,600 240 3,500 12,000 3,000 49 10 3,400 11,000 350 31,259 (4,602) 12,000 (16,602) 1,800 108 605 12,000 1,200 9 1.29 682 11,000 253 12.7 2.6 3.6 40.1 9.8 0.06 0.04 7.2 41.9 5.4
2023 80,667 63% 29,847 700 2,069 2,300 26,178 3,600 240 3,500 12,000 3,000 49 10 3,400 11,000 350 31,229 (5,051) 12,000 (17,051) 1,800 106 594 12,000 1,200 9 1.27 670 11,000 248 12.1 2.6 3.4 36.4 9.4 0.06 0.03 7.0 38.5 5.3
2024 81,786 64% 29,443 700 2,069 2,300 25,774 3,600 240 3,500 12,000 3,000 49 10 3,400 11,000 350 31,204 (5,430) 12,000 (17,430) 1,800 104 585 12,000 1,200 9 1.25 660 11,000 244 11.6 2.5 3.2 32.6 9.1 0.06 0.03 6.8 35.1 5.2
2025 82,474 65% 28,866 700 2,069 2,300 25,197 3,600 240 3,500 12,000 3,000 49 10 3,400 11,000 350 31,168 (5,971) 12,000 (17,971) 1,800 102 572 12,000 1,200 9 1.22 645 11,000 239 11.0 2.5 CP 28.9 8.7 0.05 0.03 6.6 31.6 5.1
2026 83,659 65% 29,281 700 2,069 2,300 25,612 3,600 240 12,000 3,000 49 10 3,400 11,000 350 30,612 (5,000) 12,000 (17,000) 1,800 104 12,000 1,200 9 1.24 656 11,000 243 10.5 2.5 25.1 8.3 0.05 0.03 6.4 28.2 5.1
2027 84,839 65% 29,693 700 2,069 2,300 26,025 3,600 240 12,000 3,000 49 10 3,400 11,000 350 30,629 (4,604) 12,000 (16,604) 1,800 105 12,000 1,200 9 1.26 666 11,000 247 9.9 2.4 21.4 7.9 0.05 0.03 6.2 24.8 5.0
ASSUMPTIONS:1. Waste Generation is estimated using CalRecycle's Adjustment Methodology, utilizing population projection, employment and real taxable sales projections from UCLA's Longterm Forecast, August 2013.2. Total Daily Available Capacity from Class III Landfills is calculated based on Maximum Permitted Daily Capacity (in blue text) for facilities without a restricted wasteshed or Expected Average Daily Tonnage for facilities with a restricted wasteshed.
LEGEND:CC/CP -Closure due to exhausted capacity (CC) or permit expiration (CP)
E -Expansion may become effectiveR -Restricted wasteshed
Source: Los Angeles County Department of Public Works, August 2013.
IN-COUNTY CLASS III LANDFILLS
Maximum Permitted Daily Capacity (tpd-6)
Remaining Capacity at Year's End (Million Tons)Expected Average Daily Tonnage (tpd-6)
Utilization of Alternative Technology Capacity (up to 2,300 tpd by 2021)
APPENDIX E-4
LOS ANGELES COUNTY COUNTYWIDE INTEGRATED WASTE MANAGEMENT PLAN2012 ANNUAL REPORT
Increase In Available Out-of-County Disposal CapacityCurrent Available Out-of-County Disposal Capacity Increase In Diversion Rate (up to 65% by 2025)Existing In-County Class III Landfills & Transformation Facilities
SCENARIO V - INCREASE IN AVAILABLE OUT-OF-COUNTY DISPOSAL CAPACITY

• • Proposed Expansions of In-County Class III Landfil •• •
1 2 3 4 5 6 7 8 9 10 11 Total
R R R R RYear Waste Diversion Total Imports Daily Maximum Class III Antelope Burbank Calabasas Chiquita Lancaster Pebbly Beach Puente Hills San Clemente Scholl Sunshine Whittier Daily Export Available Class III Landfill
Generation Rate Daily from Available Alternative Landfill Valley City/County (Savage Canyon) Available Need Daily Daily DisposalRate1 Disposal Other Capacity from Technology Daily Combined Capacity2 Out-of-County Capacity
Demand Counties Transformation Capacity Disposal from Disposal ShortfallFacilities Demand Class III Capacity (Reserve)
LandfillsA B C=A(1-B) D E F G=C+D-E-F H I=G-H J K=I-J
(tpd-6) (tpd-6) (tpd-6) (tpd-6) (tpd-6) (tpd-6) (tpd-6) (tpd-6) (tpd-6) (tpd-6)2012 69,007 60% 27,603 452 1,695 0 26,360 1,800 240 3,500 6,000 3,000 49 13,200 10 3,400 11,000 350 36,640 (10,280) 5,911 ─
808 107 599 2,903 667 9.3 6,872 1.28 675 7,541 250 16.9 3.0 5.5 4.0 12.3 0.09 6.10 0.04 3.4 74.4 3.6
2013 70,193 61% 27,375 500 2,069 0 25,807 1,800 240 3,500 6,000 3,000 49 13,200 10 3,400 11,000 350 36,606 (10,799) 6,200 (16,999) 900 105 586 2,842 700 9 7,000 1.25 661 8,000 244 16.6 2.9 5.3 3.1 12.1 0.09 CP 0.04 3.2 71.9 3.5
2014 71,659 63% 26,514 700 2,069 0 25,145 1,800 240 3,500 6,000 3,000 49 10 3,400 11,000 350 23,365 1,781 7,500 (5,719) 1,000 102 571 4,000 800 9 1.22 644 9,000 238 16.3 2.9 5.2 1.8 11.8 0.09 0.04 3.0 69.1 6.0 E
2015 73,087 65% 25,580 700 2,069 0 24,212 1,800 240 3,500 12,000 3,000 49 10 3,400 11,000 350 29,307 (5,095) 10,000 (15,095) 1,100 98 550 5,000 900 9 1.17 620 10,000 229 16.0 2.9 5.0 0.3 12.3 0.08 0.04 2.8 65.9 6.0
2016 74,368 67% 24,541 700 2,069 0 23,173 1,800 240 3,500 12,000 3,000 49 10 3,400 11,000 350 29,242 (6,069) 10,000 (16,069) 1,200 94 526 6,000 1,000 8 1.12 593 11,000 220 15.6 2.8 4.8 57.9 E 12.0 0.08 0.04 2.6 62.5 5.9
2017 75,469 69% 23,395 700 2,069 1,300 20,727 1,800 240 3,500 12,000 3,000 49 10 3,400 11,000 350 29,090 (8,363) 10,000 (18,363) 1,300 84 471 7,000 1,100 7 1.00 531 11,000 196 15.2 2.8 4.7 55.7 11.7 0.08 0.04 2.5 59.1 5.8
2018 76,516 71% 22,190 700 2,069 1,300 19,521 1,800 240 3,500 12,000 3,000 49 10 3,400 11,000 350 29,015 (9,494) 10,000 (19,494) 1,400 79 443 8,000 1,200 7 0.94 500 11,000 185 14.8 2.8 4.5 53.2 11.3 0.08 0.04 2.3 55.6 5.8
2019 77,511 73% 20,928 700 2,069 1,300 18,259 1,800 240 3,500 12,000 3,000 49 10 3,400 11,000 350 28,936 (10,677) 10,000 (20,677) 1,500 74 415 9,000 1,200 6 0.88 467 11,000 173 14.3 2.8 4.4 50.4 10.9 0.08 0.04 2.2 52.2 5.7
2020 78,750 75% 19,687 700 2,069 1,300 17,019 1,800 240 3,500 12,000 3,000 49 10 3,400 11,000 350 28,859 (11,840) 12,000 (23,840) 1,600 69 386 10,000 1,200 6 0.82 436 11,000 161 13.8 2.7 4.3 47.3 10.6 0.07 0.04 8.0 E 48.8 5.7
2021 79,072 75% 19,768 700 2,069 2,300 16,099 1,800 240 3,500 12,000 3,000 49 10 3,400 11,000 350 28,802 (12,702) 12,000 (24,702) 1,700 65 366 11,000 1,200 6 0.78 412 11,000 153 13.3 2.7 4.2 43.9 10.2 0.07 0.04 7.9 45.4 5.6
2022 79,805 75% 19,951 700 2,069 2,300 16,283 1,800 240 3,500 12,000 3,000 49 10 3,400 11,000 350 28,813 (12,531) 12,000 (24,531) 1,800 66 370 12,000 1,200 6 0.79 417 11,000 154 12.7 2.7 4.1 40.1 9.8 0.07 0.04 7.8 41.9 5.6
2023 80,667 75% 20,167 700 2,069 2,300 16,498 1,800 240 3,500 12,000 3,000 49 10 3,400 11,000 350 28,827 (12,328) 12,000 (24,328) 1,800 67 375 12,000 1,200 6 0.80 422 11,000 156 12.1 2.7 3.9 36.4 9.4 0.07 0.04 7.6 38.5 5.5
2024 81,786 75% 20,446 700 2,069 2,300 16,778 1,800 240 3,500 12,000 3,000 49 10 3,400 11,000 350 28,844 (12,066) 12,000 (24,066) 1,800 68 381 12,000 1,200 6 0.81 429 11,000 159 11.6 2.6 3.8 32.6 9.1 0.07 0.04 7.5 35.1 5.5
2025 82,474 75% 20,618 700 2,069 2,300 16,950 1,800 240 3,500 12,000 3,000 49 10 3,400 11,000 350 28,855 (11,905) 12,000 (23,905) 1,800 69 385 12,000 1,200 6 0.82 434 11,000 161 11.0 2.6 CP 28.9 8.7 0.06 0.04 7.4 31.6 5.4
2026 83,659 75% 20,915 700 2,069 2,300 17,246 1,800 240 12,000 3,000 49 10 3,400 11,000 350 28,482 (11,236) 12,000 (23,236) 1,800 70 12,000 1,200 6 0.83 441 11,000 163 10.5 2.6 25.1 8.3 0.06 0.04 7.2 28.2 5.4
2027 84,839 75% 21,210 700 2,069 2,300 17,541 1,800 240 12,000 3,000 49 10 3,400 11,000 350 28,493 (10,952) 12,000 (22,952) 1,800 71 12,000 1,200 6 0.85 449 11,000 166 9.9 2.6 21.4 7.9 0.06 0.03 7.1 24.8 5.3
ASSUMPTIONS:1. Waste Generation is estimated using CalRecyle's Adjustment Methodology, utilizing population projection, employment and real taxable sales projections from UCLA's Longterm Forecast, August 2013.2. Total Daily Available Capacity from Class III Landfills is calculated based on Maximum Permitted Daily Capacity (in blue text) for facilities without a restricted wasteshed or Expected Average Daily Tonnage for facilities with a restricted wasteshed.
LEGEND:CC/CP -Closure due to exhausted capacity (CC) or permit expiration (CP)
E -Expansion may become effectiveR -Restricted wasteshed
Source: Los Angeles County Department of Public Works, August 2013.
2012 ANNUAL REPORT
Maximum Permitted Daily Capacity (tpd-6)
Remaining Capacity at Year's End (Million Tons)Expected Average Daily Tonnage (tpd-6)
IN-COUNTY CLASS III LANDFILLS
Maximizing Diversion Rate up to 75% by 2020Existing In-County Class III Landfills & Transformation FacilitiesIncrease In Available Out-of-County Disposal Capacity Utilization of Alternative Technology Capacity (up to 2,300 tpd by 2021)
SCENARIO VI - MAXIMIZING DIVERSION RATE (UP TO 75% BY 2020, COMPLIES WITH AB 341 GOAL)APPENDIX E-4
LOS ANGELES COUNTY COUNTYWIDE INTEGRATED WASTE MANAGEMENT PLAN

• • •• •
1 2 3 4 5 6 7 8 9 10 11 Total
R R R R R
Year Waste Diversion Total Imports Daily Maximum Class III Antelope Burbank Calabasas Chiquita Lancaster Pebbly Beach Puente Hills San Clemente Scholl Sunshine Whittier Daily Export Available Class III LandfillGeneration Rate Daily from Available Alternative Landfill Valley City/County (Savage Canyon) Available Need Daily Daily Disposal
Rate1 Disposal Other Capacity from Technology Daily Combined Capacity2 Out-of-County CapacityDemand Counties Transformation Capacity Disposal from Disposal Shortfall
Facilities Demand Class III Capacity (Reserve)Landfills
A B C=A(1-B) D E F G=C+D-E-F H I=G-H J K=I-J(tpd-6) (tpd-6) (tpd-6) (tpd-6) (tpd-6) (tpd-6) (tpd-6) (tpd-6) (tpd-6) (tpd-6)
2012 69,007 60% 27,603 452 1,695 0 26,360 1,800 240 3,500 6,000 3,000 49 13,200 10 3,400 11,000 350 36,640 (10,280) 5,911 ─ 808 107 599 2,903 667 9.3 6,872 1.28 675 7,541 250 16.9 3.0 5.5 4.0 12.3 0.09 6.10 0.04 3.4 74.4 3.6
2013 70,193 60% 28,077 500 2,069 0 26,508 1,800 240 3,500 6,000 3,000 49 13,200 10 3,400 11,000 350 36,650 (10,141) 6,200 (16,341) 900 107 602 2,919 700 9 7,000 1.28 679 8,000 251 16.6 2.9 5.3 3.1 12.1 0.09 CP 0.04 3.2 71.9 3.5
2014 71,659 60% 28,664 700 2,069 0 27,295 1,800 240 3,500 6,000 3,000 49 10 3,400 11,000 350 23,499 3,797 7,500 (3,703) 1,000 111 620 4,000 800 10 1.32 699 9,000 259 16.3 2.9 5.1 1.8 11.8 0.09 0.04 3.0 69.1 6.0 E
2015 73,087 60% 29,235 700 2,069 0 27,866 1,800 240 3,500 12,000 3,000 49 10 3,400 11,000 350 29,534 (1,668) 10,000 (11,668) 1,100 113 633 5,000 900 10 1.35 713 10,000 264 16.0 2.8 4.9 0.3 12.3 0.08 0.04 2.8 65.9 5.9
2016 74,368 60% 29,747 700 2,069 0 28,379 1,800 240 3,500 12,000 3,000 49 10 3,400 11,000 350 29,566 (1,187) 10,000 (11,187) 1,200 115 644 6,000 1,000 10 1.37 726 11,000 269 15.6 2.8 4.7 57.9 E 12.0 0.08 0.04 2.5 62.5 5.9
2017 75,469 60% 30,188 700 2,069 1,800 27,019 1,800 240 3,500 12,000 3,000 49 10 3,400 11,000 350 29,481 (2,462) 10,000 (12,462) 1,300 109 614 7,000 1,100 10 1.31 692 11,000 256 15.2 2.8 4.5 55.7 11.7 0.08 0.04 2.3 59.1 5.8
2018 76,516 60% 30,607 700 2,069 1,900 27,338 1,800 240 3,500 12,000 3,000 49 10 3,400 11,000 350 29,501 (2,163) 10,000 (12,163) 1,400 111 621 8,000 1,200 10 1.32 700 11,000 259 14.8 2.7 4.4 53.2 11.3 0.07 0.04 2.1 55.6 5.7
2019 77,511 60% 31,004 700 2,069 2,000 27,636 1,800 240 3,500 12,000 3,000 49 10 3,400 11,000 350 29,520 (1,884) 10,000 (11,884) 1,500 112 628 9,000 1,200 10 1.34 707 11,000 262 14.3 2.7 4.2 50.4 10.9 0.07 0.04 1.9 52.2 5.6
2020 78,750 60% 31,500 700 2,069 2,100 28,031 1,800 240 3,500 12,000 3,000 49 10 3,400 11,000 350 29,544 (1,513) 12,000 (13,513) 1,600 114 637 10,000 1,200 10 1.36 717 11,000 266 13.8 2.7 4.0 47.3 10.6 0.07 0.04 7.6 E 48.8 5.5
2021 79,072 61% 30,838 700 2,069 3,200 26,270 1,800 240 3,500 12,000 3,000 49 10 3,400 11,000 350 29,435 (3,165) 12,000 (15,165) 1,700 106 597 11,000 1,200 9 1.27 672 11,000 249 13.3 2.6 3.8 43.8 10.2 0.07 0.04 7.4 45.4 5.5
2022 79,805 62% 30,326 700 2,069 3,300 25,657 1,800 240 3,500 12,000 3,000 49 10 3,400 11,000 350 29,397 (3,739) 12,000 (15,739) 1,800 104 583 12,000 1,200 9 1.24 657 11,000 243 12.7 2.6 3.6 40.1 9.8 0.06 0.04 7.2 41.9 5.4
2023 80,667 63% 29,847 700 2,069 3,400 25,078 1,800 240 3,500 12,000 3,000 49 10 3,400 11,000 350 29,361 (4,282) 12,000 (16,282) 1,800 102 570 12,000 1,200 9 1.21 642 11,000 238 12.1 2.6 3.4 36.4 9.4 0.06 0.03 7.0 38.5 5.3
2024 81,786 64% 29,443 700 2,069 3,500 24,574 1,800 240 3,500 12,000 3,000 49 10 3,400 11,000 350 29,329 (4,755) 12,000 (16,755) 1,800 100 558 12,000 1,200 9 1.19 629 11,000 233 11.6 2.5 3.2 32.6 9.1 0.06 0.03 6.8 35.1 5.2
2025 82,474 65% 28,866 700 2,069 3,500 23,997 1,800 240 3,500 12,000 3,000 49 10 3,400 11,000 350 29,293 (5,296) 12,000 (17,296) 1,800 97 545 12,000 1,200 8 1.16 614 11,000 227 11.0 2.5 CP 28.9 8.7 0.05 0.03 6.6 31.6 5.2
2026 83,659 65% 29,281 700 2,069 3,500 24,412 1,800 240 12,000 3,000 49 10 3,400 11,000 350 28,765 (4,353) 12,000 (16,353) 1,800 99 12,000 1,200 9 1.18 625 11,000 231 10.5 2.5 25.1 8.3 0.05 0.03 6.5 28.2 5.1
2027 84,839 65% 29,693 700 2,069 3,500 24,825 1,800 240 12,000 3,000 49 10 3,400 11,000 350 28,781 (3,956) 12,000 (15,956) 1,800 101 12,000 1,200 9 1.20 635 11,000 235 9.9 2.5 21.4 7.9 0.05 0.03 6.3 24.8 5.0
ASSUMPTIONS:1. Waste Generation is estimated using CalRecycle's Adjustment Methodology, utilizing population projection, employment and real taxable sales projections from UCLA's Longterm Forecast, August 2013.2. Total Daily Available Capacity from Class III Landfills is calculated based on Maximum Permitted Daily Capacity (in blue text) for facilities without a restricted wasteshed or Expected Average Daily Tonnage for facilities with a restricted wasteshed.
LEGEND:CC/CP -Closure due to exhausted capacity (CC) or permit expiration (CP)
E -Expansion may become effectiveR -Restricted wasteshed
Source: Los Angeles County Department of Public Works, August 2013.
SCENARIO VII - INCREASE IN ALTERNATIVE TECHNOLOGY CAPACITY (UP TO 3,500 TPD BY 2024)APPENDIX E-4
LOS ANGELES COUNTY COUNTYWIDE INTEGRATED WASTE MANAGEMENT PLAN2012 ANNUAL REPORT
Maximum Permitted Daily Capacity (tpd-6)Expected Average Daily Tonnage (tpd-6)
Remaining Capacity at Year's End (Million Tons)
Existing In-County Class III Landfills & Transformation Facilities Proposed Expansions of In-County Class III Increase In Diversion Rate up to 65% by 2025Increase In Available Out-of-County Disposal Capacity Increase In Alternative Technology Capacity (up to 3,500 tpd by 2024)
IN-COUNTY CLASS III LANDFILLS

• • Proposed Expansions of In-County Class III Landfills •• •
1 2 3 4 5 6 7 8 9 10 11 Total
R R R R R
Year Waste Diversion Total Imports Daily Maximum Class III Antelope Burbank Calabasas Chiquita Lancaster Pebbly Beach Puente Hills San Clemente Scholl Sunshine Whittier Daily Export Available Class III LandfillGeneration Rate Daily from Available Alternative Landfill Valley City/County (Savage Canyon) Available Need Daily Daily Disposal
Rate1 Disposal Other Capacity from Technology Daily Combined Capacity2 Out-of-County CapacityDemand Counties Transformation Capacity Disposal from Disposal Shortfall
Facilities Demand Class III Capacity (Reserve)Landfills
A B C=A(1-B) D E F G=C+D-E-F H I=G-H J K=I-J(tpd-6) (tpd-6) (tpd-6) (tpd-6) (tpd-6) (tpd-6) (tpd-6) (tpd-6) (tpd-6) (tpd-6)
2012 69,007 60% 27,603 452 1,695 0 26,360 1,800 240 3,500 6,000 3,000 49 13,200 10 3,400 11,000 350 36,640 (10,280) 5,911 ─ 808 107 599 2,903 667 9.3 6,872 1.28 675 7,541 250 16.9 3.0 5.5 4.0 12.3 0.09 6.10 0.04 3.4 74.4 3.6
2013 70,193 60% 28,077 500 2,069 0 26,508 1,800 240 3,500 6,000 3,000 49 13,200 10 3,400 11,000 350 36,650 (10,141) 6,200 (16,341) 900 107 602 2,919 700 9 7,000 1.28 679 8,000 251 16.6 2.9 5.3 3.1 12.1 0.09 CP 0.04 3.2 71.9 3.5
2014 71,659 60% 28,664 700 2,069 0 27,295 1,800 240 3,500 6,000 3,000 49 10 3,400 11,000 350 23,499 3,797 7,500 (3,703) 1,000 111 620 4,000 800 10 1.32 699 9,000 259 16.3 2.9 5.1 1.8 11.8 0.09 0.04 3.0 69.1 6.0 E
2015 73,087 60% 29,235 700 2,069 0 27,866 1,800 240 3,500 12,000 3,000 49 10 3,400 11,000 350 29,534 (1,668) 10,000 (11,668) 1,100 113 633 5,000 900 10 1.35 713 10,000 264 16.0 2.8 4.9 0.3 12.3 0.08 0.04 2.8 65.9 5.9
2016 74,368 60% 29,747 700 2,069 0 28,379 1,800 240 3,500 12,000 3,000 49 10 3,400 11,000 350 29,566 (1,187) 11,000 (12,187) 1,200 115 644 6,000 1,000 10 1.37 726 11,000 269 15.6 2.8 4.7 57.9 E 12.0 0.08 0.04 2.5 62.5 5.9
2017 75,469 60% 30,188 700 2,069 1,300 27,519 1,800 240 3,500 12,000 3,000 49 10 3,400 11,000 350 29,513 (1,993) 12,000 (13,993) 1,300 112 625 7,000 1,100 10 1.33 704 11,000 261 15.2 2.8 4.5 55.7 11.7 0.08 0.04 2.3 59.1 5.8
2018 76,516 60% 30,607 700 2,069 1,300 27,938 1,800 240 3,500 12,000 3,000 49 10 3,400 11,000 350 29,539 (1,601) 13,000 (14,601) 1,400 113 634 8,000 1,200 10 1.35 715 10,500 265 14.8 2.7 4.3 53.2 11.3 0.07 0.04 2.1 55.8 5.7
2019 77,511 60% 31,004 700 2,069 1,300 28,336 1,800 240 3,500 12,000 3,000 49 10 3,400 11,000 350 29,563 (1,228) 14,000 (15,228) 1,500 115 643 9,000 1,200 10 1.37 725 11,000 268 14.3 2.7 4.1 50.4 10.9 0.07 0.04 1.9 52.4 5.6
2020 78,750 60% 31,500 700 2,069 1,300 28,831 1,800 240 3,500 12,000 3,000 49 10 3,400 11,000 350 29,592 (761) 15,000 (15,761) 1,600 117 655 10,000 1,200 8 1.40 738 11,000 273 13.8 2.7 3.9 47.3 10.6 0.07 0.04 7.6 E 48.9 5.5
2021 79,072 61% 30,838 700 2,069 2,300 27,170 1,800 240 3,500 12,000 3,000 49 10 3,400 11,000 350 29,489 (2,319) 16,000 (18,319) 1,700 110 617 11,000 1,200 8 1.31 695 11,000 257 13.3 2.6 3.7 43.8 10.2 0.07 0.04 7.4 45.5 5.5
2022 79,805 62% 30,326 700 2,069 2,300 26,657 1,800 240 3,500 12,000 3,000 49 10 3,400 11,000 350 29,457 (2,800) 17,000 (19,800) 1,800 108 605 12,000 1,200 7 1.29 682 11,000 253 12.7 2.6 3.6 40.1 9.8 0.06 0.04 7.2 42.1 5.4
2023 80,667 63% 29,847 700 2,069 2,300 26,178 1,800 240 3,500 12,000 3,000 49 10 3,400 11,000 350 29,426 (3,248) 18,000 (21,248) 1,800 106 594 12,000 1,200 7 0.50 670 11,000 248 12.1 2.6 3.4 36.4 9.4 0.06 0.04 7.0 38.6 5.3
2024 81,786 64% 29,443 700 2,069 2,300 25,774 1,800 240 3,500 12,000 3,000 49 10 3,400 11,000 350 28,922 (3,148) 19,000 (22,148) 1,800 104 585 12,000 1,200 7 0.50 300 11,000 125 11.6 2.5 3.2 32.6 9.1 0.06 0.03 6.9 35.2 5.3
2025 82,474 65% 28,866 700 2,069 2,300 25,197 1,800 240 3,500 12,000 3,000 49 10 3,400 11,000 350 28,845 (3,648) 19,000 (22,648) 1,800 40 572 12,000 1,200 7 0.50 300 11,000 125 11.0 2.5 CP 28.9 8.7 0.06 0.03 6.8 31.8 5.2
2026 83,659 65% 29,281 700 2,069 2,300 25,612 1,800 240 12,000 3,000 49 10 3,400 11,000 350 28,273 (2,661) 19,000 (21,661) 1,800 40 12,000 1,200 7 0.50 300 11,000 125 10.5 2.5 25.1 8.3 0.06 0.03 6.7 28.3 5.2
2027 84,839 65% 29,693 700 2,069 2,300 26,025 1,800 240 12,000 3,000 49 10 3,400 11,000 350 28,268 (2,243) 19,000 (21,243) 1,800 40 12,000 1,200 2 0.50 300 11,000 125 9.9 2.5 21.4 7.9 0.05 0.03 6.6 24.9 5.1
ASSUMPTIONS:1. Waste Generation is estimated using CalRecycle's Adjustment Methodology, utilizing population projection, employment and real taxable sales projections from UCLA's Longterm Forecast, August 2013.2. Total Daily Available Capacity from Class III Landfills is calculated based on Maximum Permitted Daily Capacity (in blue text) for facilities without a restricted wasteshed or Expected Average Daily Tonnage for facilities with a restricted wasteshed.
LEGEND:CC/CP -Closure due to exhausted capacity (CC) or permit expiration (CP)
E -Expansion may become effectiveR -Restricted wasteshed
Source: Los Angeles County Department of Public Works, August 2013.
Remaining Capacity at Year's End (Million Tons)
Full Utilization of Out-of-County Disposal Capacity
IN-COUNTY CLASS III LANDFILLS
Maximum Permitted Daily Capacity (tpd-6)Expected Average Daily Tonnage (tpd-6)
Utilization of Alternative Technology Capacity (up to 2,300 tpd by 2021)
LOS ANGELES COUNTY COUNTYWIDE INTEGRATED WASTE MANAGEMENT PLAN2012 ANNUAL REPORT
Existing In-County Class III Landfills & Transformation Facilities Increase In Diversion Rate up to 65% by 2025SCENARIO VIII - FULL UTILIZATION OF OUT-OF-COUNTY DISPOSAL CAPACITY
APPENDIX E-4

• • Proposed Expansions of In-County Class III Landfills •• •
1 2 3 4 5 6 7 8 9 10 11 Total
R R R R R
Year Waste Diversion Total Imports Daily Maximum Class III Antelope Burbank Calabasas Chiquita Lancaster Pebbly Beach Puente Hills San Clemente Scholl Sunshine Whittier Daily Export Available Class III LandfillGeneration Rate Daily from Available Alternative Landfill Valley City/County (Savage Canyon) Available Need Daily Daily Disposal
Rate1 Disposal Other Capacity from Technology Daily Capacity2 Out-of-County CapacityDemand Counties Transformation Capacity Disposal from Disposal Shortfall
Facilities Demand Class III Capacity (Reserve)Landfills
A B C=A(1-B) D E F G=C+D-E-F H I=G-H J K=I-J(tpd-6) (tpd-6) (tpd-6) (tpd-6) (tpd-6) (tpd-6) (tpd-6) (tpd-6) (tpd-6) (tpd-6)
2012 69,007 60% 27,603 452 1,695 0 26,360 1,800 240 3,500 6,000 3,000 49 13,200 10 3,400 11,000 350 36,640 (10,280) 5,911 ─ 808 107 599 2,903 667 9.3 6,872 1.28 675 7,541 250 16.9 3.0 5.5 4.0 12.3 0.09 6.10 0.04 3.4 74.4 3.6
2013 70,193 61% 27,375 500 2,069 0 25,807 1,800 240 3,500 6,000 3,000 49 13,200 10 3,400 11,000 350 36,606 (10,799) 6,200 (16,999) 900 105 586 2,842 700 9 7,000 1.25 661 8,000 244 25.6 2.9 5.3 3.1 12.1 0.09 CP 0.04 3.2 71.9 3.5
2014 71,659 63% 26,514 700 2,069 0 25,145 1,800 240 3,500 6,000 3,000 49 10 3,400 11,000 350 23,365 1,781 7,500 (5,719) 1,000 102 571 4,000 800 9 1.22 644 9,000 238 25.3 2.9 5.2 1.8 11.8 0.09 0.04 3.0 69.1 6.0 E
2015 73,087 65% 25,580 700 2,069 0 24,212 1,800 240 3,500 12,000 3,000 49 10 3,400 11,000 350 29,307 (5,095) 10,000 (15,095) 1,100 98 550 5,000 900 9 1.17 620 10,000 229 24.9 2.9 5.0 0.3 12.3 0.08 0.04 2.8 65.9 6.0
2016 74,368 67% 24,541 700 2,069 0 23,173 1,800 240 3,500 12,000 3,000 49 10 3,400 11,000 350 29,242 (6,069) 11,000 (17,069) 1,200 94 526 6,000 1,000 8 1.12 593 11,000 220 24.6 2.8 4.8 57.9 E 12.0 0.08 0.04 2.6 62.5 5.9
2017 75,469 69% 23,395 700 2,069 0 22,027 1,800 240 3,500 12,000 3,000 49 10 3,400 11,000 350 29,171 (7,144) 12,000 (19,144) 1,300 89 500 7,000 1,100 8 1.07 564 11,000 209 24.2 2.8 4.7 55.7 11.7 0.08 0.04 2.4 59.1 5.8
2018 76,516 71% 22,190 700 2,069 600 20,221 1,800 240 3,500 12,000 3,000 49 10 3,400 11,000 350 28,992 (8,771) 13,000 (21,771) 1,400 82 459 8,000 1,200 7 0.98 518 11,000 125 23.7 2.8 4.5 53.2 11.3 0.08 0.04 2.3 55.6 5.8
2019 77,511 73% 20,928 700 2,069 700 18,859 1,800 240 3,500 12,000 3,000 49 10 3,400 11,000 350 28,737 (9,878) 14,000 (23,878) 1,500 76 428 9,000 1,200 7 0.50 300 11,000 125 23.3 2.7 4.4 50.4 10.9 0.08 0.04 2.2 52.2 5.8
2020 78,750 75% 19,687 700 2,069 800 17,519 1,800 240 3,500 12,000 3,000 49 10 3,400 11,000 350 28,701 (11,182) 15,000 (26,182) 1,600 71 398 10,000 1,200 6 0.50 300 11,000 125 22.8 2.7 4.3 47.3 10.6 0.07 0.04 8.1 E 48.8 5.7
2021 79,072 75% 19,768 700 2,069 900 17,499 1,800 240 3,500 12,000 3,000 49 10 3,400 11,000 350 28,700 (11,201) 16,000 (27,201) 1,700 71 397 11,000 1,200 6 0.50 300 11,000 125 22.2 2.7 4.1 43.9 10.2 0.07 0.04 8.0 45.4 5.7
2022 79,805 75% 19,951 700 2,069 1,000 17,583 1,800 240 3,500 12,000 3,000 49 10 3,400 11,000 350 28,702 (11,119) 16,000 (27,119) 1,800 71 399 12,000 1,200 6 0.50 300 11,000 125 21.7 2.7 4.0 40.1 9.8 0.07 0.04 7.9 41.9 5.6
2023 80,667 75% 20,167 700 2,069 1,800 16,998 1,800 240 3,500 12,000 3,000 49 10 3,400 11,000 350 28,644 (11,645) 16,000 (27,645) 1,800 30 386 12,000 1,200 2 0.50 300 11,000 125 21.1 2.7 3.9 36.4 9.4 0.07 0.04 7.8 38.5 5.6
2024 81,786 75% 20,446 700 2,069 2,800 16,278 1,800 240 3,500 12,000 3,000 49 10 3,400 11,000 350 28,627 (12,349) 16,000 (28,349) 1,800 30 370 12,000 1,200 2 0.50 300 11,000 125 20.5 2.7 3.8 32.6 9.1 0.07 0.04 7.7 35.1 5.6
2025 82,474 75% 20,618 700 2,069 3,000 16,250 1,800 240 3,500 12,000 3,000 49 10 3,400 11,000 350 28,627 (12,377) 16,000 (28,377) 1,800 30 369 12,000 1,200 2 0.50 300 11,000 125 20.0 2.7 CP 28.9 8.7 0.07 0.04 7.6 31.6 5.5
2026 83,659 75% 20,915 700 2,069 3,000 16,546 1,800 240 12,000 3,000 49 10 3,400 11,000 350 28,258 (11,711) 16,000 (27,711) 1,800 30 12,000 1,200 2 0.50 300 11,000 125 19.4 2.6 25.1 8.3 0.07 0.04 7.5 28.2 5.5
2027 84,839 75% 21,210 700 2,069 3,000 16,841 1,800 240 12,000 3,000 49 10 3,400 11,000 350 28,258 (11,416) 16,000 (27,416) 1,800 30 12,000 1,200 2 0.50 300 11,000 125 18.9 2.6 21.4 7.9 0.07 0.04 7.4 24.8 5.4
ASSUMPTIONS:1. Waste Generation is estimated using CalRecycle's Adjustment Methodology, utilizing population projection, employment and real taxable sales projections from UCLA's Longterm Forecast, August 2013.2. Total Daily Available Capacity from Class III Landfills is calculated based on Maximum Permitted Daily Capacity (in blue text) for facilities without a restricted wasteshed or Expected Average Daily Tonnage for facilities with a restricted wasteshed.
LEGEND:CC/CP -Closure due to exhausted capacity (CC) or permit expiration (CP)
E -Expansion may become effectiveR -Restricted wasteshed
Source: Los Angeles County Department of Public Works, August 2013.
Remaining Capacity at Year's End (Million Tons)
Full Utilization of Out-of-County Disposal Capacity
IN-COUNTY CLASS III LANDFILLS
Maximum Permitted Daily Capacity (tpd-6)Expected Average Daily Tonnage (tpd-6)
Increase In Alternative Technology Capacity (up to 3,000 tpd by 2025)
LOS ANGELES COUNTY COUNTYWIDE INTEGRATED WASTE MANAGEMENT PLAN2012 ANNUAL REPORT
Existing In-County Class III Landfills & Transformation Facilities Maximizing Diversion Rate up to 75% by 2020SCENARIO IX - BEST CASE (ALL SOLID WASTE MANAGEMENT OPTIONS CONSIDERED BECOME AVAILABLE)
APPENDIX E-4

2012 Annual Report Los Angeles County Countywide Integrated Waste Management Plan
Appendix E‐5 Map of Transfer and Processing Facilities

2012 Annual Report Los Angeles County Countywide Integrated Waste Management Plan
PermittedLargeVolumeSolidWasteTransferandProcessingFacilitiesinLosAngelesCountyin2012
Material Recovery Facility (Dirty)
Facility Name Location Address Permitted
Capacity (tpd) Avg. Daily
Tonnage (tpd)
1 Athens Services 14048 East Valley Boulevard, Industry, 91746 5,000 2,539
2 Athens Sun Valley MRF 11121 Pendleton Street, Sun Valley, 91352 1,500 145
3 California Waste Services, LLC 621 West 152nd Street, Gardena, 90247 1,000 300
4 City Terrace Recycling Transfer Station 1511‐1525 Fishburn Avenue, City Terrace, 90063 700 280
5 Community Recycling & Resource Recovery, Inc. 9147 De Garmo Avenue, Sun Valley, 91352 1,119 (a) 41
6 Downey Area Recycling & Transfer 9770 Washburn Road, Downey, 90241 5,000 382
7 East Los Angeles Recycling And Transfer 1512 North Bonnie Beach Place, City Terrace, 90063 700 542
8 Falcon Refuse Center, Inc. 3031 East "I" Street, Wilmington, 90744 3,500 404
9 Grand Central Recycling & Transfer Station 999 Hatcher Boulevard, Industry, 91744 5,000 1,800
10 Puente Hills Materials Recovery Facility 2808 Workman Mill Road, Whittier, 90601 4,400 132
11 Waste Management South Gate Transfer Station 4489 Ardine Street, South Gate, 90280 2,000 323
12 Waste Resource Recovery 357 West Compton Boulevard, Gardena, 90248 500 236
Total 30,419 7,124
Material Recovery Facility (Clean)
Facility Name Location Address Permitted
Capacity (tpd) Avg. Daily
Tonnage (tpd)
1 Allan Company Baldwin Park 14604‐14618 Arrow Highway, Baldwin Park, 91706 960 54
2 City Fibers – West Valley Plant 16714 Schoenborn Street, Los Angeles, 91343 350 n/a
3 City Fibers ‐ LA Plant No. 2 2545 East 25th Street Los Angeles, 90058 300 n/a
4 Los Angeles Express Materials Rec. Fac. 6625 Stanford Avenue, Los Angeles, 90001 260 (a) 142
5 Pico Rivera MRF 8405 Loch Lomand Drive, Pico Rivera, 91660 327 (a) 159
6 Sun Valley Paper Stock MRF and TS 8701 North San Fernando Road, Sun Valley, 91352 1,250 620
Total 3,447 975
Footnote: (a) – Average Daily Tonnages are based on 2011 Annual Report.

2012 Annual Report Los Angeles County Countywide Integrated Waste Management Plan
Construction and Demolition/Processing2
Facility Name Location Address Permitted
Capacity (tpd) Avg. Daily
Tonnage (tpd)
1 Construction and Demolition Recycling 9309 Rayo Avenue, South Gate, 90280 3,000 n/a
2 Looney Bins/East Valley Diversion 11616 Sheldon Street, Sun Valley, 91352 750 261
3 Looney Bins/Downtown Diversion 2424 Olympic Boulevard, Los Angeles, 90021 1,500 396
Total 5,250 657 Composting/Chipping and Grinding Facility2
Facility Name Location Address
Permitted Capacity (tpd)
Avg. Daily Tonnage (tpd)
1 American Reclamation Chipping and Grinding 4560 Doran Street, Los Angeles, 90039 500 59
2 Burbank Green Waste Transfer Operation 3000 Bel Aire Drive, Burbank, 91504 200 74
3 Evergreen Recycling, Inc. 8700 Crocker St., Los Angeles, 90003 100 n/a
4 Foothill Soils, Inc. 22925 Coltrane Ave, Newhall, 91325 200 30
5 Greencycle, Inc. 12815 E. Imperial Hwy., Santa Fe Springs, 90670 135 n/a
6 GS Brothers, Inc. 20331 South Main Street, Carson, 90745 100 n/a
7 GWS, Inc. 10120 Miller Avenue, South Gate, 90280 200 8
8 Harbor Mulching Facility 1400 N Gaffey St., San Pedro, 90731 120 n/a
9 Lopez Canyon Environmental Center 11950 Lopez Canyon Road, Los Angeles, 91342 12,499 n/a
10 North Hills Recycling, Inc. 11700 Blucher Avenue, Granada Hills, 91345 1,000 385
11 Norwalk Industries Green Waste Operation 13780 East Imperial Highway, Santa Fe Springs, 90670 200 n/a
12 Ornales Wood Recovery, Inc. 6635 W. Avenue F, Lancaster, 93536 150 n/a
13 Pomona Municipal Chipping & Grinding Operation 1730 E. First St., Pomona, 91766 100 80
14 Recycled Wood Products 1313 E. Phillipes Blvd., Pomona, 91766 200 n/a
15 RJ’s Alondra Chipping and Grinding Operation 355 W Alondra Blvd., Gardena, CA 90248 200 150
16 RJ`s Chipping and Grinding Operation 1135 East Florence Avenue, Inglewood, 90302 200 150
Total 16,104 936
Notes: 1. Facilities listed are permitted by the CalRecycle as “Large Volume Transfer/Processing” or “Direct Transfer” Facilities with a permitted daily capacity of at least 100 tpd. 2. Facilities listed are permitted by CalRecycle with a minimum of 100 tpd of permitted capacity or maximum average allowed intake. If capacity is in cubic yards, a conversion factor is assumed as follows: 240 lbs/cubic yard for Composting/Chipping and Grinding facilities; 900 lbs/cubic yard for Transformation/Processing facilities; and 1,200 lbs/cubic yard for Composting/Chipping and Grinding facilities.
3. “n/a” mean Not Available. Footnote: (a) Average Daily Tonnages are based on 2011 Annual Report.

CASTAIC
AS
UZ
A
C HAE
YTI
CE
RV
LU
C
B
G
N
O
L
FAIRMONT
CO
PI
CO
RIV
ER
A
CO
MM
ER
CE
SA
NTA
FE
EL
MO
NT E
ROLLING
HILLS
P A L O S
SEQUIT
DEL REY
MO
NT
EB
EL
LO
PASADENA
D O W N E Y
I R W I N DA L E
CO
MARINA
LA
WN
DA
LEMANHATTAN
PT DUME
ARTE
SIA
CE
RR
I TO
S
NORTHWEST
SEAL COVE
HARBOR
P A L M D A L E
QUARTZHILL
CO
GORMAN
CATALINAHARBOR
AVALON
PT VICENTE
PT FERMIN
ESTATES
HILLS
RO
LL
ING
LOM
ITA
CO
CO
CO
ESTATESS
V
RD
E
E
PA
LO
S
ROCKY
V E R D ES
OH
RA
NC
CO
HILLSIGNAL
L A K E W O O D
CO
BELL
FLO
WE
R
HAWAIIANGARDENS
CO
UD
NI
ST
RY
CO
CO
CO
INDUSTRY
W E S T C O V I N A
CL
AR
EM
ON
T
SA
MI
D
ARODNELG
CO
CO
CO
CO
CO
CO
CO
CO
CO
CO
CO
HILLS
AINOM
CO
CO
CO
CO
CO
CO
CO
C A L A B A S A S
PT
MALIBU PT
C I T YO F
M A L I B U
WESTLAKE
VILLAGE
AGOURA HILLSCO HILLS
HIDDEN
BE
AH
C
HE
RM
OS
A
BE
AC
H
HAWTHORNE
T O R R A N C E
CO
CUDAHY
B E L L
CO
CO
GARDENSBELL
WH
I TT
I ER
CO
LYNWOOD
PARKHUNTINGTON
BELLAMWY
OO
D
D
UA
RT
E
BRADBURY
CO
CO
TEMPLE CITY
ELM
ONTE
SOUTH
SOUTH
P A S A D E N A
CO
CO
B U R B A N K
FLINTRIDG
E
LACAN
ADA
SANMARIN
O
AR
CA
DI
A
CO
BALDW
INPARK
SAUGUS
P A L M D A L E
L A N C A S T E R
NORWALK
HEIGHTSLA HABRA
SPR
ING
S
PARAMOUNT
GA
RD
EN
A
RE
DO
ND
O
INGLEWOOD
EL SEGUNDO
BEACH
PT LOSANGELES
BEVERLY
W
SE
THOLLYWOOD
C
SANTA
SOL E SLEGNA
SAN
FERNA
NDO
LA
VE
RN
E
NA
S
P O M O N A
W A L N U T
S A N T A C L A R I T A
LAPU
ENTE
RO
EM
EA
DS
MONTEREY PARK
V E R N O N
CO
DI A
MO
ND
BA
R
L AM
I RA D
A
SIERRA MADRE
M O N R O V I A
COVINAA L H A M B R A
SA
NG
AB
RIE
L
G L E N D A L E
SOUTHGATE
C O M P T O N
C A R S O N
CO
VENTURA
COUNTY
VE
NT
UR
A
CO
UN
TY
KERN
CO
UN
TY
SA
NB
ER
NA
RD
INO
CO
UN
TY
SA
N
BE
RN
AR
DIN
O
COUNTY
COUNTY
OR
AN
GE
AV
AV
AV
BV
AV FOOT HILL
GR
AN
DAV
HY
BV
BASE LINE RD
AV
TO
WN
E
HY
HU
GH
ES
BV
DR
ST
ST
ST
BVN
N
RD
BV
FELIZ
LOS
AV
BV
AV
RD
6TH
PY
SAN
BVC
AN
YO
N
HYRD
RD
HY
ANGELES
MT
RE
D
BOX
PY
BV
TUJUNGARD
BV
HY
HY
RD
BV
BV
BV
ARTESIA
MAGICW
OO
DM
AN
AV
WY
BV
LA
BV
VA
NN
UY
S
RD
RD
BA
RBV
BVR
D
VALLEY
BV
BV
BV
MA
GN
OLIA
AV
BVST
VI N
EL
AN
DAV
AVTA
MP
A
MOUNTAIN
BV
DR
COLORADO HUNTINGTON
RD
LIVE
ST
RD
AV C-6-LANCASTER RD
AVENUE
260
TH
ST
W
RD
TH
RE
EP
OIN
TS
RD
OAK
LANCASTER
PINE
CANYON
RDFA
IRM
ONT
RES
RD
RD
FR
AN
CIS
QU
ITO
CANYON
OLD
BV
SHERMAN
BA
LB
OA
FA
LLB
RO
OK
AV
MAYO
DR
LYONS AV
RD
SA
ND
WE
ST
THE
RD
SAN
AR
RO
YO
RD
ARROWAV
DR
FOOTHILL
FOOTHILLSAN
FERNAN
DO
BV
RD
ROSCOE
BV
DEVONSHIRE
HY
HY
AZU
SA
WIL
SHIRE
RD
RD
KANAN
SUNSET
BV
COAST
ELIZABETH
RD
BV
AV
MT
ALOSTA
BV
LAK
E
BV
ST
IMPERIAL
MT
RD
BL
VENTURA
BLVICTORY
WY
CARSON
COAST
25THST
AL
AM
ITO
SA
V
AV
BV
MA
IN
B ST
ST
ST
ARTESIA
BV
NO
RW
ALK
FIRESTONE
AT
LA
NT
IC
BV
BV
BV
HYLEFFINGWELL
RD
BV
CO
LIM
A
OFFCU
T
RD
NO
RW
ALK
RD
BV
AV
AV
ST CARSON
7TH
AT
LA
NT
IC
WILLOW
BV HY
ST
ST
W30T
H
AVENUE P
170
TH
ST
W
HILL
RD
HY
BIGPINES
AVENUE
LANCASTER
RD
I
J
GAVENUE
110
TH
ST
W
AVENUE
10T
H
10
TH
ST
E
ST
W
AVENUE M
LAKE
RD
RD
RD
60T
HS
TW
AVENUE
AVENUE
ST
E
ST
E
ST
E
L
140
TH
90T
H
50
TH
47T
HS
TE
PEARBLOSSOM
PEARBLOSSOM
HY
HY
HY
ANTELOPE
ST
E165
TH
PALMDALE
SIE
RR
A
BV
AVENUE P
240
TH
ST
E
AVENUE O
HY
D
87
TH
ST
E
E
FORTTEJO
N
RD
170
TH
ST
E
BO
B'S
GAP
RD
VALYERM
O
RD
HY
RD
RD
RD
PACIFIC
DE
CK
ER
MU
LH
OL
LAN
D
RD
LA
KE
MULHOLLAND
VIR
GE
NE
SLA
S
CA
NY
ON
MA
LIB
U
MULHOLLAND
VALLE
Y
CI R
CLE
SU
NL
AN
D
TUXFORD
HILL
GLE
ND
ALE VE
RD
UG
O
HUNTINGTON
MIS
SIO
N
MAIN
PE
CK
GABRIEL
BALD
Y
BOUQUET
SOLEDAD CANYON
SIE
RR
A
SE
CO
CY
N
FER
NAN
DO
VALENCIA
RDSA
N
CA
NY
ON
MU
NZ
RA
NC
H
CANYON
BIG
CR
ES
TAN
GELE
S
FOREST
GLE
ASON ANGELES
CREST
FOOT
AV
WILSON
PACIFIC
SEPULVEDA
HA
WTH
OR
NE
WE
STE
RN
WIL
MIN
GT
ON
BIG
RO
CK
CREEK
BROADWAY
VALLEYMAIN
HA
CIE
ND
A FULLERTO
N
LITTLE
TU
JU
NG
A
DIA
MO
ND
MISSION
GRAN
D
BREA
CN
BREA
CNMANCHESTER
BR
EA
ROSECRANS
OCEAN
ALA
MED
A
RO
SE
ME
AD
CRYS
TAL
LA
KE
CA
NY
ON
SPUNKY
CA
NY
ON
GODDE
KA
NA
ND
UM
E
TO
PAN
GA
SUNSET
CA
NY
ON
WHITTIER
LINCOLN
HENRY
TEM
PLIN
LAS TUNAS DR
SLAUSON
GLE
NDOR
A
AV
LANCASTER
GORMAN POST RD AV C-15-LANCASTER RD
ST
GA
FF
EY
SE
PU
LVE
DA
PA
CIF
ICAV
LA
KE
WO
OD
BV
!(
!(
SANTACATALINA
ISLAND
SANCLEM
ENTE
ISLAND
Note: These islands are not to scalenor at their true location.
53
33
§̈¦5
§̈¦5
§̈¦10
§̈¦10
§̈¦10 §̈¦10
§̈¦105
§̈¦105
§̈¦710
§̈¦110
§̈¦605
§̈¦605
§̈¦405
§̈¦405
§̈¦405
§̈¦210
§̈¦210
§̈¦710
§̈¦110
£¤101 £¤101
£¤101
}2
}71
}91}91
}90
}60
}60
}60
}57
}57
}14
}14
}170
}210
}110
}134
}118
}57
51
49 60
52
26
46
59
45
58
44
32
1
50
48
56
55
43
38
40
39
54
47
27
34
42
37
14
12
7
11
16
22
35
9
30
5
29
19
4
31
8 13
28
57
20
17
41
18
15
23
6
36
24
2
3
25
21
10
2 Central LA Recycling & Transfer Station2201 Washington Boulevard, Los Angeles, 90034
3 Carson Transfer Station & Materials Recovery Facility321 West Francisco Street, Carson, 90745
5 Downey Area Recycling & Transfer9770 Washburn Road, Downey, 90241
6 Grand Central Recycling & Transfer Station999 Hatcher Boulevard, City of Industry, 91744
8 American Waste Transfer Station1449 West Rosecrans Avenue, Gardena, 90247
9 Falcon Refuse Center, Inc. (Allied/BFI Waste Systems, Falcon)3031 East "I" Street, Wilmington, 90744
11 Paramount Resource Recycling Facility7230 Petterson Lane, Paramount, 90723
12 South Gate Transfer Station9530 South Garfield Avenue, South Gate, 90280
13 Compton Recycling & Transfer Station (Allied/BFI Waste Systems,Compton)2509 West Rosecrans Avenue, Compton, 90220
14 Southern California Disposal Company Recycling & Transfer Station1908 Frank Street, Santa Monica, 90404
15 Waste Management South Gate Transfer4489 Ardine Street, South Gate, 90280
16 Mission Road Recycling & Transfer Station840 South Mission Road, Los Angeles, 90033
17 Bradley East Transfer Station9227 Tujunga Avenue, Sun Valley, 91352
18 Athens Sun Valley Materials Recycling & Transfer Station11121 Pendleton Street, Sun Valley, 91352
19 Bel-Art Waste Transfer Station2501 East 68th Street, Long Beach, 90805
20 EDCO Recycling and Transfer2755 California Avenue, Signal Hill, 90755
22 Innovative Waste Control4133 Bandini Boulevard, Vernon, 90023
23 Sun Valley Paper Stock Materials Recovery Facility & Transfer Station8701 North San Fernando Road, Sun Valley, 91352
24 Community Recycling & Resource Recovery, Inc.9147 De Garmo Avenue, Sun Valley, 91352
25 California Waste Services, LLC621 West 152nd Street, Gardena, 90247
27 Allan Company Baldwin Park14604-14618 Arrow Highway, Baldwin Park, 91706
31 Angelus Western Paper Fibers, Inc.2474 Porter Street, Los Angeles, 90021
33 Culver City Transfer/Recycling Station9255 West Jefferson Boulevard, Culver City, 90232
35 Granada Hills Street Maintenance District Yard10210 Etiwanda Avenue, Northridge, 91325
36 East Street Maintenance District Yard452 San Fernando Road, Los Angeles, 90065
37 Southwest Street Maintenance District Yard5860 South Wilton Place, Los Angeles, 90047
38 City Fibers - West Valley Plant16714 Schoenborn Street, Los Angeles, 91343
39 Pico Rivera MRF8405 Loch Lomand Drive, Pico Rivera, 91660
40 City Fibers - LA Plant #22545 East 25th Street, Los Angeles, 90058
41 Mission Recycling/West Coast Recycling1326 East Ninth Street, Pomona, 91766
42 Van Nuys Street Maintenance District Yard15145 Oxnard Street, Van Nuys, 91411
43 Los Angeles Express Materials Rec. Fac.6625 Stanford Avenue, Los Angeles, 90001
47 Mission Recycling/West Coast Recycling1341 East Mission Boulevard, Pomona, 91766
53 Pomona Municipal Direct Transfer Facility1730 East First Street, Pomona, 91766
54 Western District Satellite Yard6000 West Jefferson Boulevard, Los Angeles, 90016
57 Norwalk Transfer Station13780 East Imperial Highway, Santa Fe Springs, 90670
0 6
Miles
RE
F:
\\p
wgis
file\G
IS_S
erv
ice
s\M
PM
GIS
\pro
ject
s\m
pm
\gis
ma
ps\w
k_3
110\p
erm
itte
d_ts
mrf
_2
01
2re
v.m
xdD
ate
:07
/25
/20
13
Survey/Mapping and Property Management Division, Mapping and GIS Services Section
Permitted Large Volume Solid WasteTransfer and Processing Facilities
in Los Angeles County in 2012
FACILITY NAME AND ADDRESSNO. CAPACITY (Tpd)
5,500
5,300
5,000
5,000
4,032
3,500
2,450
2,200
2,160
2,112
2,000
1,785
1,640
1,500
1,500
1,500
1,250
1,250
1,119
1,000
960
700
500
460
460
460
350
327
300
300
300
260
200
150
149
113
PERMITTED CAPACITY (Tpd)
100 - 499
500 - 999
1000 - 1999
2000 - 3999
4000 +
·
PERMITTED
4 Athens Services14048 East Valley Boulevard, Industry, 91746
7 Puente Hills Materials Recovery Facility2808 Workman Mill Road, Whittier, 90601
29 City Terrace Recycling Transfer Station1511-1525 Fishburn Avenue, City Terrace, 90063
30 East Los Angeles Recycling And Transfer1512 North Bonnie Beach Place, City Terrace, 90063
34 Waste Resource Recovery357 West Compton Boulevard, Gardena, 90248
5,000
4,400
700
700
500
3,000
1,500
750
10 Construction and Demolition Recycling9309 Rayo Avenue, South Gate, 90280
21 Looney Bins/Downtown Diversion2424 Olympic Boulevard, Los Angeles, 90021
28 Looney Bins/East Valley Diversion11616 Sheldon Street, Sun Valley, 91352
1 Lopez Canyon Environmental Center11950 Lopez Canyon Road, Los Angeles, 91342
26 North Hills Recycling, Inc.11700 Blucher Avenue, Granada Hills, 91345
32 American Reclamation Chipping & Grinding4560 Doran Street, Los Angeles, 90039
44 Burbank Green Waste Transfer Operation3000 Bel Aire Drive, Burbank, 91504
45 Foothill Soils, Inc.22925 Coltrane Avenue, Newhall, 91325
46 GWS, Inc.10120 Miller Avenue, South Gate, 90280
48 Norwalk Industries Green Waste Operation13780 East Imperial Highway, Santa Fe Springs, 90670
49 Recycled Wood Products1313 East Phillipes Boulevard, Pomona 91766
50 RJ's Alondra Chipping & Grinding Operation355 West Alondra Boulevard, Gardena, 90248
51 RJ's Chipping & Grinding Operation1135 East Florence Avenue, Inglewood 90302
52 Ornales Wood Recovery, Inc.6635 West Avenue F, Lancaster, 93536
55 Greencycle, Inc.12815 East Imperial Highway, Santa Fe Springs, 90670
56 Harbor Mulching Facility1400 North Gaffey Street, San Pedro, 90731
58 Evergreen Recycling, Inc.8700 Crocker Street, Los Angeles, 90003
59 GS Brothers, Inc.20331 South Main Street, Carson, 90745
60 Pomona Municipal Chipping & Grinding Operation1730 East First Street, Pomona, 91766
12,499
1,000
500
200
200
200
200
200
200
200
150
135
120
100
100
100
NOTES:1 - Facilities listed are permitted by the CalRecycle as “Large
Volume Transfer/Processing” or “Direct Transfer” Facilitieswith daily capacity of 100 tpd or more.
2 - Permitted capacity is based on the Max. Permitted Throughputas specified in the Solid Waste Facility Permit. If capacity is incubic yards, a conversion factor is assumed as follows:240 lbs/cubic yard for Composting/Chipping and Grinding facilities;900 lbs/cubic yard for Transformation/Processing facilities;and 1,200 lbs/cubic yard for Construction and Demolition/Processingfacilities.
3 - Tpd is tons per day based on 6 operating days a week,312 days a year.
Facilities located in the County unincorporated areas.
Construction and Demolition/Processing facilities.
Composting/Chipping and Grinding facilities.
X
*
)
X
*
)
X
*
)
X
*
)
X
X
)
)
)
)
)
)
)
)
)
)
)
)
)
X
X

2012 Annual Report Los Angeles County Countywide Integrated Waste Management Plan
Appendix E‐6 Map of Landfills

&>
!
!
!
!
!
!
!
!
!
!
"
"
VENTURA
COUNTY
VENTURA
COUNTY
KERN
COUN
TYSA
NBE
RNAR
DINO
COUN
TY
SAN
BERN
ARDI
NO
COUNTY
COUNTY
ORAN
GE
AV
AV
AV
BV
AV FOO T HILL
GRAN
DAV
HY
BV
BASE LINE RD
AVTO
WNE
HY
HUGHES
BVDR
ST
STST
BVN
N
RD
BV
FELIZLOS
AV
BV
AV
RD
6TH
PY
SAN
BV
CAN
YON
HYRD
RD
HY
ANG ELES
MT
RED
BO X
PY
BV
TUJUNG ARD
BV
HY
HY
RD
BV
BV
BV
ART ESIA
MAG IC
WOO
DMAN
AV
WY
BVLA
BV
VAN
NUY
S
RD
RD
BAR
BV
BV
RD
VALLEY
BV
BV
BV
MAG
NOLI
AAV
BVST
VINE
LAND
AV
AVTA
MPA
MO UNTAIN
BV
DR
COLO RADO HUNTING TO N
RD
LIVEST
RD
AV C-6 -LANCASTER RD
AVENUE
260T
HST
W
RD
THRE
EPOI
NTS
RD
OAK
LANCASTER
PINE
CAN YO N
RDFAIRMO NT
RES RD
RD
FRAN
CISQ
UITO
CAN YO N
OLD
BV
SHERM AN
BALB
OA
FALL
BROO
KAV
MAYO
DR
LYO NS AV
RD
SAND
WEST
THE
RD
SAN
ARR
OYO
RD
ARR OWAV
DRFOO TH ILL
FOO TH ILLSAN
FERNANDO
BV
RD
ROSCO E
BV
DEVO NSHIRE
HY
HY
AZUS
A
WILSHIRE
RD
RD
KANAN
SUN SET
BV
COAST
EL IZ ABET H
RD
BV
AV
MT
AL OSTA
BV
LAKE
BV
ST
IM PERIAL
MT
RD
BL
VENT URA
BLVICTO RY
WY
CAR SO N
COAST
25THST
ALAM
ITO
S AV
AV
BVMA
IN
B ST
ST
ST
ART ESIA
BV
NORW
ALK
FIREST ONE
ATL A
N TIC
BV
BV
BV
HYLEFF ING WELLRD
BV
COLIMA
OFF
CUT
RD
NORW
ALK
RD
BV
AV
AV
ST CAR SO N
7TH
ATLA
NTI
C
WILLOW
BV HY
ST
ST W
30TH
AVENUE P
170T
HST
W
HILL
RD
HY
BIG PINES
AVENUE
LANCASTERRD
IJ
GAVENUE
110T
HST
W
AVENUE
10TH
10 T
HST
E
ST W
AVENUE M
LAKE
RD
RD
RD
60TH
ST W
AVENUE
AVENUE
ST E
ST E
ST E
L
140T
H
90TH
50 T
H47
TH S
T E
PEARBLO SSO M
PEARBLO SSO M
HY
HY
HY
ANT ELO PE
ST E
165T
H
PALM DALE
SIERR
A
BV
AVENUE P
240T
H ST
E
AVENUE O
HY
D
87 T
HST
E
E
FOR T TEJON
RD
170T
HST
EBO
B'S GAP
RD
VALYERMO
RD
HYRD
RD
RD
PACIF IC
DEC
KER
MUL H
OLL A
N D RD
LAKE
MUL HOLL AN D
VIRG E
N ES
LAS
CAN Y
O NMA
LIBU
MUL HOLL AN D
VALLE
YCI
RCLE
SUN
LAND
TUXF ORD
HILL
GLEN
DALE VE
RDU
GO
HUNTING TO N
MISSIO
N
MAIN
PECK
GABRIEL
BALD
Y
BO UQU ET
SO LEDAD CAN YO N
SIERR
A
SECO
CYN
FERN
ANDO
VALENCIA
RDSAN
CAN Y
O N
MUN Z R
ANCH
CAN YO N
BIG
CRES
TAN
G ELES
FOR EST
GLEASON ANG ELES
CREST
FOO T
AV
WILSON
PACIF IC
SEPULVEDA
HAW
THO
RNE
WES
TERN W
ILM
ING
TON
BIG
ROCK CREEK
BRO ADWAY
VALLEYMAIN
HAC I
ENDA
FULL ERTON
LIT TL E
TUJU
NGA
DIAMON D
MISSIO N
GRANDBREA
CN
BREA
CNMANCH EST ER
BREA
ROSECRANS
OCEAN
ALAM
EDA
ROSE
MEAD
CRYSTALLA
KE
CAN
YON
SPUNKY
CAN YON
GOD DE
KANA
NDU
ME
TOPA
NGA
SUN SET
CAN
YON
WHITT IERLINC OLN
HEN RY
TEMPL IN
LAS TU NAS DR
SL AU SO N
GLENDO RA
AV
LANCASTER
GOR MAN PO ST RD AV C-1 5-LANCASTER RD
STGA
FFEY
SEPU
LVED
A
PACI
FIC
AV
LAKE
WOO
D
BV
E
CASTA IC
GORMAN
CO
CO
CO
ASUZA
CO
SA
MID
NA
S
LA
ARODNELG
CO
C HAE
ACINOMATNASYTIC
ER
V LU C
CO
CO
P A L M D A L E
L A N C A S T E R
P A L M D A L E
B
GN
O
L
C A R
S O N
CO
FAIRMONT
SLEGNASOL
CO
WESTLAKE CO
CO
CO
CO
CO
COCO
CO
C A L A B A S A S
SAUGUS
CO
VILLAGE
MONROVIA
ALHAMBRA
BELL
FLOWER
AG OURA HILLS
HIDDENHILLS
CO
CO
CO
CO
COCO
CO
QUARTZ HILL
B U R B A N KG L E N D A L E
P A S A D E N A
PASADENASOUTH
MO NTER EY PARK
WHITT IER
CO
P I C
O R
I V E
R AM O
N T E
B E L L
O
C O M M E R C E
CO
G A
R D
E N
A
D O W N E Y
SAN TAFE
SPR ING S
CO
HAWTHORNE
LAWND
ALE
EL SEG UN DO
V E R N O N
AM WY O O DB E L L
SOUTH GAT E
SAN M AR IN O
SAN
GAB
RIE
L
E L M O N T E
A R
C A
D I
A
I R W I N D A L E
COVINA
W E S T C O V I N ACO
CO
D
UA
RT
E
P O M O N A
C L A
R E
M O
N T
VERNE
W A L N U T
DIAMO
ND B
AR
UDNI
S T RY
LA PUENTE
LA H ABRAHEIG HTS
W H I T T I E R
NORWALK
L A K E W O O D
LA M IR ADA
SANT
A CLA
RITA
SAN
FERNANDO
W
S
E
THO LLY WO O D
BE VE R LY HIL LS
CO
CO
CO
CO
BELL
CU DA HY
C O M P T O N
HERM
OSA
BEAC
H
R E
D O
N D
O
BE
AC
H
T O R R A N C E
ESTATESS
V
RD
PA
LO
S
EE
LOMI TA
RO LLINGHI LLS
COCO
CO
ROLL
ING
HI LLS
ESTATES
RA N C
H O P A L O S V E R D E S
LYNW OO D
PARAM OUNT
CO
ART ESIA
C E R R I T
O S
IN D US TRY
BALD WIN PARK
RO
EM
EA
DS
TEMPLE CITY
BRA DB UR Y
CO
CO
C I T Y O F M A L I B U
LA CANAD A-
FL INTRIDG E
SIER RA M AD RE
MANHATTANBEACH
SIG NA LHILL
HU NTIN G TO NPAR K
BELLGARDENS
CO
CO
SO U THEL MO N TE
INGL EWOO D
HAW AIIANGA RD EN S
PT FE RM IN
PT VIC EN TE
PALO SVER DE S
PT
MA LIBU PT
PT D UM E
SEQ U ITPT
MA RIN ADEL R EY
CATA LINAHAR BO R
AVA LO N
NO RT HW ESTHAR BO R
SEA L CO VE
CO
5
3
4
12
4
4
SANTA CATALINA ISLAND
SAN CLEMENTE
ISLAND
A N G E L E S N A T I O N A L F O R E S T
A N G E L E S N A T I O N A L F O R E S T
LOS PADRES
NATIONAL FOREST
EDWARDS AIR FORCE BASE
§̈¦5
§̈¦5
§̈¦10§̈¦10
§̈¦10 §̈¦10
§̈¦105
§̈¦105
§̈¦710
§̈¦110
§̈¦605
§̈¦605
§̈¦405
§̈¦405
§̈¦405
§̈¦210
§̈¦210
£¤101£¤101
£¤101
}2
}71
}91}91
}90
}60
}60
}60}57
}14
}14
}170
}210
}134
}118
§̈¦710
§̈¦110
}57
}57
}110
WASTE DISPOSAL BY JURISDICTION OF ORIGINAT PERMITTED MUNICIPAL SOLID WASTE FACILITIES
IN LOS ANGELES COUNTY2012
REF:
\\p
wgisf
ile\G
IS_S
ervic
es\M
PMGI
S\pr
oject
s\epd
\Land
fill\D
ispos
al_by
_Jur
isdict
ion_
2012
.mxd
DA
TE: 0
7/15
/201
3
Surv ey/M apping & P roperty M anagem ent D iv is ion, Mapping & GIS Serv ic es S ec tion
P A C I F I C O C E A N
0 4 8 12MILES
NOTE : T hes e is lands are not to s ca le nor a t thei r true loc ation.
4SAN CLEMENTE LANDFILL
400 tons
LEGEND! Class III Landfill - County Unincorporated&> Class III Landfill - City / County! Class III Landfill - Other Cities" Transformation Facility
Supervisorial District Boundary
Based on total tonnages disposed January thru December 2012(includes imported waste).Total tonnages rounded to nearest thousand except SanClemente Landfill which is rounded to nearest hundred.Los Angeles County Solid Waste Information ManagementSystem - July 2013 (www.LACountySWIMS.org)
NOTES:
Source:
PEBBLY BEACH LANDFILL3,000 tons
SOUTHEAST RESOURCERECOVERY FACILTY
432,000 tons
SAVAGE CANYON LANDFILL78,000 tons
COMMERCEREFUSE-TO-ENERGY FACILITY
96,000 tons
PUENTE HILLS LANDFILL2,144,000 tons
SCHOLL CANYON LANDFILL211,000 tons
BURBANK LANDFILL33,000 tons
SUNSHINE CANYONCITY/COUNTY LANDFILL
2,217,000 tons
CHIQUITA CANYON LANDFILL906,000 tons
CALABASAS LANDFILL187,000 tons
ANTELOPE VALLEY LANDFILL252,000 tons
LANCASTER LANDFILL208,000 tons
AVALON100%
LOS ANGELESCOUNTY
100%
BURBANK100%
SANTA FESPRINGS
18%
WHITTIER61%
BELLFLOWER12%
NORWA LK4%
OTHERS5%
OTHERS40%
SANTA MONICA12%
CITYOF LOS
ANGELES35%
COMMERCE7%
REDONDO BEACH6%
LOSANGELESCOUNTY
19%
PALMDALE33%
OTHERS3%
CITY OFLOS ANGELES
37%
LANCASTER8%
PASADENA46%
GLENDALE43%
OTHERS3%
SOUTHPASADENA
1%LOS ANGELES
COUNTY7%
CITY OF LOSANGELES
39%LANCASTER
39%
OTHERS6% PALMDALE
6%
LOS ANGELESCOUNTY
10%
CITY OFLOS ANGELES
58%
LOSANGELESCOUNTY
17%CALABASAS
11%
MALIBU9%
OTHERS5%
OTHERS34%
LONG BEACH47%
CITY OFLOS ANGELES
8%
TORRANCE7%
SANTAMONICA
4%
CITY OFLOS ANGELES
62%
LOSANGELESCOUNTY
10%TORRANCE3%
COMPTON 3%
OTHERS22%
CITY OFLOS ANGELES
56%
OTHERS21%
LOS ANGELESCOUNTY
6%
SANTACLARITA
13%
CULVER CITY4%
LOS ANGELESCOUNTY
14%
CITY OFLOS ANGELES
18%
CARSON8%
LONG BEACH3%
OTHERS57%


![Drone Swarms for Sensing-of-Sensing...be created, including wearable SWIMs, 2D plotter SWIMs (Fig. 2), robotic arms, and 3D plotter SWIMs [20]. These methods are effective in many](https://img.dokumen.tips/doc/110x75/604b3bcd6cea755ad748e3fb/drone-swarms-for-sensing-of-sensing-be-created-including-wearable-swims-2d.jpg)