Embed Size (px)
Citation preview

COTTON, TEXTILE AND APPAREL SECTOR INVESTMENT PROFILE
UGANDA

© s
hutte
rsto
ck.c
om

COTTON, TEXTILE AND APPAREL SECTOR INVESTMENT PROFILE
UGANDA
2016

4
CTA
SE
CTO
R IN
VES
TME
NT
PR
OFI
LE: U
GA
ND
A
ACKNOWLEDGEMENTS
This profile has been produced under the framework of Supporting Indian Trade and Investment for Africa (SITA) project, funded by the Department for International Development, Government of the United Kingdom and implemented by the International Trade Centre. SITA is a South-South Trade and Investment project aimed at improving competitiveness of select value chains; and increasing investment in five Eastern African countries through partnerships with institutions and businesses from India.
Special contributions to writing this report have been provided by:
Cotton Development Organization
Uganda Textile Manufacturers Association
Uganda Revenue Authority
African Cotton and Textile Industries Federation
Quality Assurance:
International Trade Centre (ITC), Trade Facilitation and Policy for Business Section (TFPB)TCA Ranganathan, External consultant, Rajesh Aggarwal, Chief (TFPB), Andrew Huelin, Associate Programme Advisor (TFPB)
Author: Joseph Nyagari
Design: Iva Stastny Brosig, Design plus
Editor: Vanessa Finaughty
The views expressed in this report are those of the authors and do not represent the official position of the International Trade Centre, Uganda Investment Authority and the Government of the United Kingdom. The images used in this profile may not always reflect accurately the country context.
© International Trade Centre 2016

5
CTA
SE
CTO
R IN
VES
TME
NT
PR
OFI
LE: U
GA
ND
A
Table of Contents
UGANDA: AN OVERVIEW 7
WHY UGANDA? 9UGANDA: A STRATEGIC COUNTRY FOR INVESTORS 9
FULLY LIBERALISED ECONOMY 9
SECURE INVESTMENT LOCATION 10
ATTRACTIVE EXPORT INCENTIVES 10
FOREIGN EXCHANGE LIBERALISATION 10
DUTY AND VAT EXEMPTIONS 10
MARKET ACCESS 10
LOGISTICS & CONNECTIVITY 10
NATIONAL SINGLE WINDOW FOR TRADE FACILITATION 11
VALUE-ADDED TAX (VAT) ON EXPORTS 11
DUTY DRAWBACK 11
MANUFACTURING UNDER BOND 11
OTHER INCENTIVES 11
FOREIGN DIRECT INVESTMENT IN UGANDA FROM 2006–2013 (US$ MILLION) 11
BANKING AND CREDIT AVAILABILITY 12
STRONG FINANCIAL SECTOR 12
SUSTAINABLE DEBT POLICY 13
TRADE PERFORMANCE AND MANAGEMENT OF CURRENCY DEPRECIATION 13
MANAGEMENT OF INFLATION 14
THE SOUTHERN AFRICAN TAXATION POLICY 15
GROWTH OF INTRAREGIONAL TRADE 15
EAC OVERVIEW 17MAJOR TRADE ARRANGEMENTS UNDER EAC 17
EAC–EU economic partnership agreement
EAC–US trade and investment partnership agreement
EAC, COMESA and SADC tripartite arrangement
INDUSTRY OVERVIEW 19COTTON VALUE CHAIN IN UGANDA: SNAPSHOT 20
GINNING SUBSECTOR 21
DOMESTIC UTILISATION & LINT EXPORTS 22
TEXTILE SUBSECTOR 22
INVESTMENT OPPORTUNITIES 23
USEFUL CONTACTS 24
ANNEXES 25ANNEX 1: GETTING STARTED – A BRIEF GUIDE 25
ANNEX 2: INSTITUTIONAL SUPPORT FOR INVESTORS 26
5
CTA
SE
CTO
R IN
VES
TME
NT
PR
OFI
LE: U
GA
ND
A

© th
inks
tock
.com
Abbreviations & Acronyms
FDI foreign direct investmentEAC East African CommunityEFU energy, fuel & utilitiesURA Uganda Revenue AuthorityCET common external tariffNCTTCA Northern Corridor Transit and Transport Coordination AuthorityACP-EU Cotonou AgreementAGOA African Growth and Opportunity ActSADC Southern African Development CommunityCOMESA Common Market for Eastern and Southern AfricaREC regional economic communitiesFOB/FOT free on board/free on truckIBP industrial & business parks
List of Figures
FIGURE 1: AFDB, STATISTICS DEPARTMENT AEO 9
FIGURE 2: WORLD INVESTMENT REPORT 11
FIGURE 3: IMF/WORLD BANK DEBT SUSTAINABILITY AND RISK ANALYSIS 13
FIGURE 4: LIST OF SUPPLYING MARKETS FOR A PRODUCT IMPORTED BY UGANDA 13
FIGURE 5: LIST OF IMPORTING MARKETS FOR A PRODUCT EXPORTED BY UGANDA 13
FIGURE 6: UGANDA BALANCE OF TRADE 14
FIGURE 7: UGANDA INFLATION RATE 14
FIGURE 8: COTTON PRODUCTION IN UGANDA 20
FIGURE 9: COTTON CONSUMPTION IN UGANDA 22
FIGURE 10: LIST OF IMPORTING MARKETS FOR A PRODUCT GROUP EXPORTED BY UGANDA 23
List of Tables
TABLE 1: TAXES APPLICABLE IN UGANDA 7
TABLE 2: COMPARISON OF KEY FACTORS OF PRODUCTION AMONG KENYA, UGANDA, ETHIOPIA AND TANZANIA 8
TABLE 3: UGANDAN TEXTILE MANUFACTURERS’ PROCESS 12
6
CTA
SE
CTO
R IN
VES
TME
NT
PR
OFI
LE: U
GA
ND
A

7
CTA
SE
CTO
R IN
VES
TME
NT
PR
OFI
LE: U
GA
ND
A
Uganda: An Overview
GDP Composition
Agriculture Industry Services
50%
23%
27%
Uganda at a glance
� GDP per capita (nominal): US$ 714.6 (2014)
� GDP growth: 4.8% (2014)
� Inflation rate: 4.3% (consumer price) (2014)
� Currency: Ugandan shillings (UGX)
� Major business sectors: Agriculture, industry, services
� Other major cities: Gulu, Lira, Jinja, Mbarara, Mbale
� Major religious belief(s): Christianity, Islam
� Major languages: English (official language), Swahili, Luganda (major)
� Major trade associations: � The Cotton Development Organisation (CDO)
� Uganda Ginners & Cotton Exporters Association (UGCEA)
� Uganda Cotton Seed Processors’ Association (UCOPA)
� Uganda Manufacturers Association (UMA)
� Top companies: Southern Range Nyanza, Phoenix Logistics, Fine Spinners Ltd
� Major international trade agreements: East Africa Community (EAC), Interim Economic Partnership Agreement
*Source: UIA, 2013; World Bank, 2015
© s
hutte
rsto
ck.c
om
Key facts
Capital: Kampala
Land area: 199,807.7 km2
Population: 37.78 mm (2014)
0–14 years: 48.30%
15–64 years: 49.20%
Labour force (over 15 years):
15.11 mm (2014)
Population growth: 3.3% (2014)
Youth literacy rate (15–24 years):
Male: 85.8% (2012)
Female: 81.7% (2012)
Urban population: 15.8% (2014)
GDP (nominal): US$ 27 bn (2014)
FDI inflow: US$ 1.15 bn (2014)
Exports: 18.4% of GDP (2014)
Major exports: Coffee, fish, tea, cotton, flowers, horticulture, gold
Imports: 28.5% of GDP (2014)
Major imports: Capital equipment, vehicles, petroleum, medical supplies, cereals
Exchange rate (per US$):
UGX 3,339.6 (2015 est.)
Govt. expenditure: US$ 4.34 bn (2015 est.)
Govt. revenue: US$ 3.29 bn (2015 est.)
*Source: UIA, 2013; World Bank, 2015; CIA, 2016

8
CTA
SE
CTO
R IN
VES
TME
NT
PR
OFI
LE: U
GA
ND
A
© s
hutte
rsto
ck.c
om
8
CTA
SE
CTO
R IN
VES
TME
NT
PR
OFI
LE: U
GA
ND
A

9
CTA
SE
CTO
R IN
VES
TME
NT
PR
OFI
LE: U
GA
ND
A
Why Uganda?
UGANDA: A STRATEGIC COUNTRY FOR INVESTORS
The Republic of Uganda is advantageously situated in Sub-Saharan Africa’s core within the East African region. Uganda is bordered by the Republic of South Sudan in the north, the Republic of Kenya in the east, the Democratic Republic of the Congo in the west, the United Republic of Tanzania in the south, and the Republic of Rwanda and the Republic of Burundi in the south-west. This locality gives it a strong base for regional investment and trade.
Uganda has plentiful rainfall and boasts rich soils and favourable temperatures. Several crops are organically grown. In addition, Uganda enjoys ample natural resources, such as regular rainfall, fertile soils, small deposits of gold, copper and other minerals, and recently found oil.
FULLY LIBERALISED ECONOMY
Uganda has had good growth performance when many parts of the world were experiencing an uncertain future.
� All sectors liberalised for marketing and investment;
� Free outflow and inflow of capital; � 100% foreign ownership of investment permissible;
� Economy ranked the eighth freest out of the 46 Sub-Saharan Africa countries by the 2013 Index of Economic Freedom.
In the late 1980s, Uganda was one of the first Sub-Saharan African countries to get on board with liberalization and pro-market policies. In the 1990s and 2000s, real gross domestic product (GDP) growth was in the region of 7% per year. However, from 2006 onwards, Uganda saw more economic instability and GDP growth declined to an average of 5%. The country’s economy is predicted to grow at a rate of roughly 6.5% in 2016, and may well continue to grow into the future, as the large infrastructure programme and oil investments increase construction activities. Uganda continues to benefit from a monetary and fiscal policy stance concentrated on containing the pressures of inflation, while safeguarding exchange rate and debt stability, thereby offering an enabling macroeconomic environment for growth.
Figure 1: AfDB, statistics department AEO
12
10
8
6
4
2
02005 2006 2007 2008 2009 2010 2011 2012 2013 2014(e) 2015(p) 2016(p)
Real GDP growth (%) East Africa (%) Africa (%)
Source: African Economic Outlook, 2015.

10
CTA
SE
CTO
R IN
VES
TME
NT
PR
OFI
LE: U
GA
ND
A
SECURE INVESTMENT LOCATION
Uganda provides an open and secure climate for foreign investment. This is guaranteed under the Investment Code of 1991 and the constitution of 1995. Uganda is also a signatory to key global business and investment protocols like:
� Multilateral Investment Guarantee Agency (MIGA);
� The Islamic Corporation for the Insurance of Investment and Export Credit (ICIEC);
� Overseas Private Investment Corporation (OPIC) of the United States of America;
� International Centre for Settlement of Investment Disputes (ICSID);
� Convention on the Recognition and Enforcement of Foreign Arbitral Awards (CREFAA).
Below are some agreements in place.
� Agreement on Trade-Related Investment Measures (TRIMS)
� General Agreement on Trade in Services (GATS)
� Agreement on Trade-Related Aspects of Intellectual Property Rights (TRIPS)
Robust economic growth and an increasing youth population have catalysed foreign direct investment (FDI) inflow in the last few years and Uganda is among the top 10 FDI recipients in Africa.
Currently, Uganda is among the best locations in Africa to locate investment. Uganda has also recently become an important source of FDI to other countries, especially the South Sudan and Rwanda.
ATTRACTIVE EXPORT INCENTIVES
Together with an exceptional growth performance record, Uganda offers private sectors a competitive incentive regime to boost foreign exchange earnings. Some of these incentives are listed below. (Please also see Investment incentive regime.)
FOREIGN EXCHANGE LIBERALISATION
The country’s foreign exchange regime is completely liberalised and exporters are permitted to keep 100% of their foreign exchange earnings accumulating from their export transactions. For details, contact Bank of Uganda or any commercial bank.
DUTY AND VAT EXEMPTIONS
Exports are tax exempt (zero rated). This is intended to cut exporters’ costs and make exports from Uganda more competitive – refer to Uganda Revenue Authority (URA).
MARKET ACCESS
Uganda boasts a unique locality at the core of Sub-Saharan Africa, providing it with a strong base for regional investment and trade.
The Ugandan Government strongly advocates global economic integration, because it increases trade volume and presents other economic prospects. As a COMESA and EAC member, Uganda has been a hands-on supporter of regional integration. The country has adopted a free trade agreement and a common external tariff (CET) under the EAC Common Market Agreement.
Uganda is also a functional member of the Transport Coordination Authority (NCTTCA) and the Northern Corridor Transit, through which it is connected with Rwanda, Burundi, the Republic of Kenya, South Sudan and the Democratic Republic of the Congo.
Furthermore, Ugandan commodities enter the USA and European Union markets quota- and duty-free under the African Growth and Opportunity Act (AGOA) and the Cotonou Agreement (ACP–EU).
LOGISTICS & CONNECTIVITY
Uganda has three lake ports (Entebbe, Jinja and Port Bell (Lake Victoria)), one international airport (Entebbe International Airport) and a narrow gauge rail of 1,244 km 1,000-m gauge from the Kenyan coastal town of Mombasa. In addition, a standard gauge railway is being constructed from the neighbouring Kenya with the view of extending to Uganda, Rwanda and the Democratic Republic of the Congo.

11
CTA
SE
CTO
R IN
VES
TME
NT
PR
OFI
LE: U
GA
ND
A
NATIONAL SINGLE WINDOW FOR TRADE FACILITATION
Implementation of a Ugandan national single-window system is on course for completion during 2016 and is expected to result in a 30% decrease in transaction costs and time related to processing documentation for key exports and imports at Uganda’s trade regulatory agencies.
VALUE-ADDED TAX (VAT) ON EXPORTS
All services and goods exports are zero rated for VAT. Nevertheless, exporters must be registered for VAT. This allows them to reclaim VAT expended on inputs used when processing and producing exports. For more information, contact Uganda Revenue Authority.
DUTY DRAWBACK
The basis for duty drawback is to make it possible for manufacturers and other exporters to be competitive in foreign markets without having to incorporate costs of duty paid on imported inputs in the final export price, or imported inputs. This enables exports to draw back as much as 100% of duties paid on material inputs imported to generate for export. For additional information, contact Uganda Revenue Authority.
MANUFACTURING UNDER BOND
This scheme permits manufacturers to obtain a custom license to hold and utilize imported raw materials meant for manufacture for export in safe locations without taxes being paid. It creates an availability of working capital, which would otherwise have had to be used for paying duties right after importation.
OTHER INCENTIVES
Other incentives are available from Uganda Revenue Authority under the Investment Code Act as administered under the Income Tax Act 1997, for export-focussed investment endeavours. For more information, contact Uganda Revenue Authority.
FOREIGN DIRECT INVESTMENT IN UGANDA FROM 2006–2013 (US$ MILLION)
Figure 2: World Investment Report
2006 2007 2008 2009 2010 2011 2012 2013
1400
1200
1000
800
600
400
200
0
Source: UNCTAD – World Investment Report, 2014
© s
hutte
rsto
ck.c
om
© s
hutte
rsto
ck.c
om
12
CTA
SE
CTO
R IN
VES
TME
NT
PR
OFI
LE: U
GA
ND
A
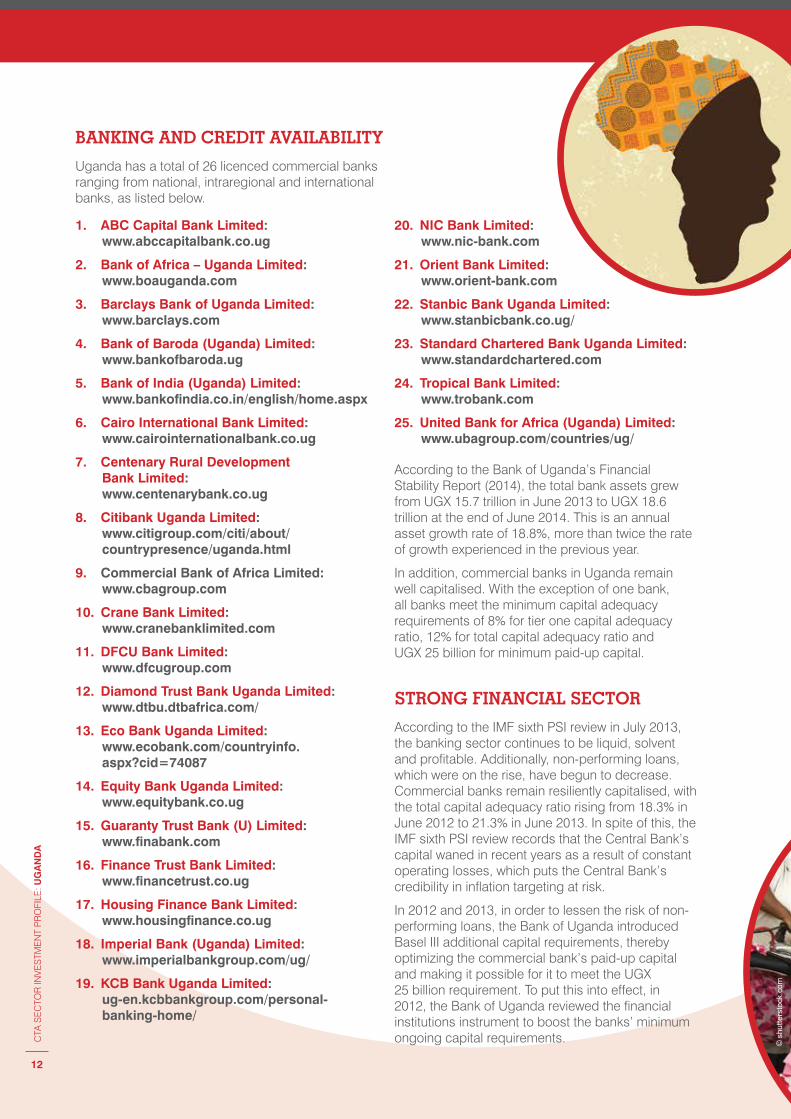
BANKING AND CREDIT AVAILABILITY
Uganda has a total of 26 licenced commercial banks ranging from national, intraregional and international banks, as listed below.
1. ABC Capital Bank Limited: www.abccapitalbank.co.ug
2. Bank of Africa – Uganda Limited: www.boauganda.com
3. Barclays Bank of Uganda Limited: www.barclays.com
4. Bank of Baroda (Uganda) Limited: www.bankofbaroda.ug
5. Bank of India (Uganda) Limited: www.bankofindia.co.in/english/home.aspx
6. Cairo International Bank Limited: www.cairointernationalbank.co.ug
7. Centenary Rural Development Bank Limited: www.centenarybank.co.ug
8. Citibank Uganda Limited: www.citigroup.com/citi/about/countrypresence/uganda.html
9. Commercial Bank of Africa Limited: www.cbagroup.com
10. Crane Bank Limited: www.cranebanklimited.com
11. DFCU Bank Limited: www.dfcugroup.com
12. Diamond Trust Bank Uganda Limited: www.dtbu.dtbafrica.com/
13. Eco Bank Uganda Limited: www.ecobank.com/countryinfo.aspx?cid=74087
14. Equity Bank Uganda Limited: www.equitybank.co.ug
15. Guaranty Trust Bank (U) Limited: www.finabank.com
16. Finance Trust Bank Limited: www.financetrust.co.ug
17. Housing Finance Bank Limited: www.housingfinance.co.ug
18. Imperial Bank (Uganda) Limited: www.imperialbankgroup.com/ug/
19. KCB Bank Uganda Limited: ug-en.kcbbankgroup.com/personal-banking-home/
20. NIC Bank Limited: www.nic-bank.com
21. Orient Bank Limited: www.orient-bank.com
22. Stanbic Bank Uganda Limited: www.stanbicbank.co.ug/
23. Standard Chartered Bank Uganda Limited: www.standardchartered.com
24. Tropical Bank Limited: www.trobank.com
25. United Bank for Africa (Uganda) Limited: www.ubagroup.com/countries/ug/
According to the Bank of Uganda’s Financial Stability Report (2014), the total bank assets grew from UGX 15.7 trillion in June 2013 to UGX 18.6 trillion at the end of June 2014. This is an annual asset growth rate of 18.8%, more than twice the rate of growth experienced in the previous year.
In addition, commercial banks in Uganda remain well capitalised. With the exception of one bank, all banks meet the minimum capital adequacy requirements of 8% for tier one capital adequacy ratio, 12% for total capital adequacy ratio and UGX 25 billion for minimum paid-up capital.
STRONG FINANCIAL SECTOR
According to the IMF sixth PSI review in July 2013, the banking sector continues to be liquid, solvent and profitable. Additionally, non-performing loans, which were on the rise, have begun to decrease. Commercial banks remain resiliently capitalised, with the total capital adequacy ratio rising from 18.3% in June 2012 to 21.3% in June 2013. In spite of this, the IMF sixth PSI review records that the Central Bank’s capital waned in recent years as a result of constant operating losses, which puts the Central Bank’s credibility in inflation targeting at risk.
In 2012 and 2013, in order to lessen the risk of non-performing loans, the Bank of Uganda introduced Basel III additional capital requirements, thereby optimizing the commercial bank’s paid-up capital and making it possible for it to meet the UGX 25 billion requirement. To put this into effect, in 2012, the Bank of Uganda reviewed the financial institutions instrument to boost the banks’ minimum ongoing capital requirements. ©
shu
tters
tock
.com
13
CTA
SE
CTO
R IN
VES
TME
NT
PR
OFI
LE: U
GA
ND
A
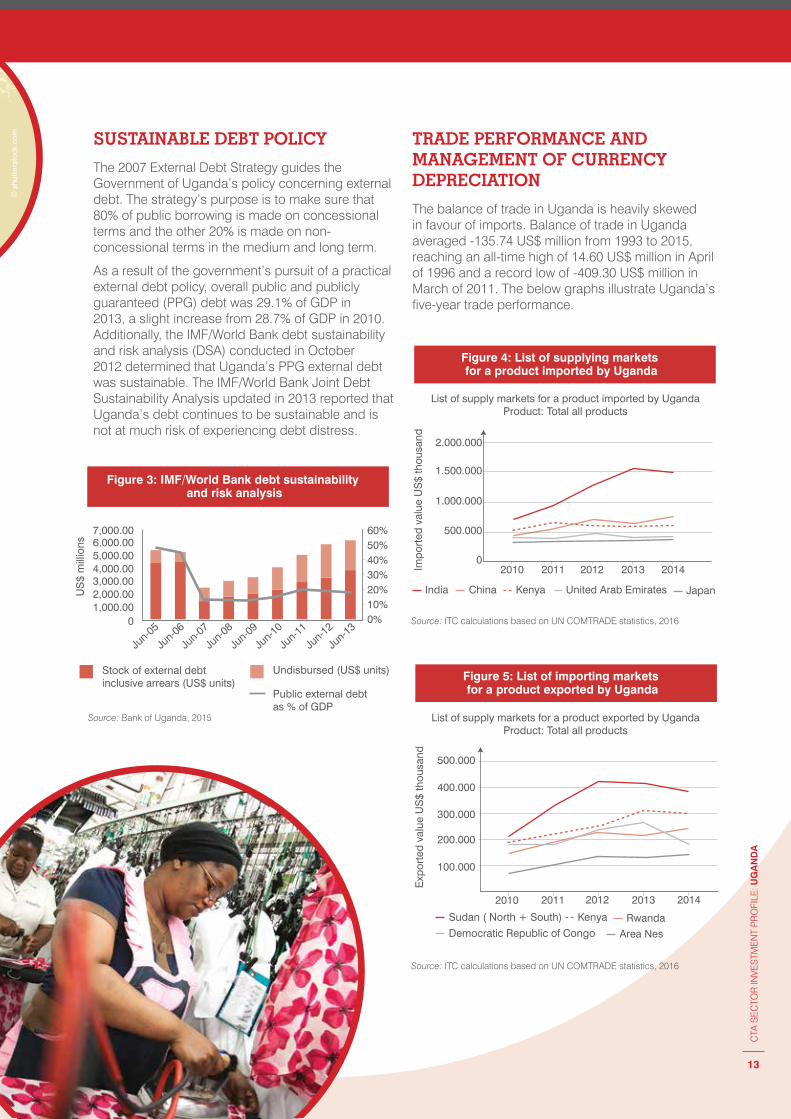
SUSTAINABLE DEBT POLICY
The 2007 External Debt Strategy guides the Government of Uganda’s policy concerning external debt. The strategy’s purpose is to make sure that 80% of public borrowing is made on concessional terms and the other 20% is made on non-concessional terms in the medium and long term.
As a result of the government’s pursuit of a practical external debt policy, overall public and publicly guaranteed (PPG) debt was 29.1% of GDP in 2013, a slight increase from 28.7% of GDP in 2010. Additionally, the IMF/World Bank debt sustainability and risk analysis (DSA) conducted in October 2012 determined that Uganda’s PPG external debt was sustainable. The IMF/World Bank Joint Debt Sustainability Analysis updated in 2013 reported that Uganda’s debt continues to be sustainable and is not at much risk of experiencing debt distress.
TRADE PERFORMANCE AND MANAGEMENT OF CURRENCY DEPRECIATION
The balance of trade in Uganda is heavily skewed in favour of imports. Balance of trade in Uganda averaged -135.74 US$ million from 1993 to 2015, reaching an all-time high of 14.60 US$ million in April of 1996 and a record low of -409.30 US$ million in March of 2011. The below graphs illustrate Uganda’s five-year trade performance.
Figure 3: IMF/World Bank debt sustainability and risk analysis
0
Jun-05
Jun-06
Jun-07
Jun-08
Jun-09
Jun-10
Jun-11
Jun-12
Jun-13
1,000.002,000.003,000.004,000.005,000.006,000.007,000.00
US
$ m
illio
ns
60%50%40%30%20%10%0%
Stock of external debt inclusive arrears (US$ units)
Undisbursed (US$ units)
Public external debt as % of GDP
Figure 4: List of supplying markets for a product imported by Uganda
2010
India
2011 2012 2013 2014
2.000.000
1.500.000
1.000.000
500.000
0
JapanChina Kenya United Arab Emirates
List of supply markets for a product imported by UgandaProduct: Total all products
Impo
rted
val
ue U
S$
thou
sand
Figure 5: List of importing markets for a product exported by Uganda
Sudan ( North + South)
Area NesRwandaKenya
Democratic Republic of Congo
500.000
400.000
300.000
200.000
100.000
2010 2011 2012 2013 2014
List of supply markets for a product exported by UgandaProduct: Total all products
Exp
orte
d va
lue
US
$ th
ousa
nd
Source: Bank of Uganda, 2015
Source: ITC calculations based on UN COMTRADE statistics, 2016
Source: ITC calculations based on UN COMTRADE statistics, 2016
© s
hutte
rsto
ck.c
om

14
CTA
SE
CTO
R IN
VES
TME
NT
PR
OFI
LE: U
GA
ND
A
Uganda’s currency has been struck by depreciation pressures since January 2015 and has fallen about 16% against the dollar, resulting persistently high lending rates and a slow expansion of credit to the private sector, with rates continuing to be above 22% on shilling denominated loans.
Much of the pressure has been fuelled by strong demand from importers.
The government continues to implement a cautious monetary policy, including injecting dollars into the market, in part to counterbalance the possible inflationary pressures that might be caused by the depreciation of the local currency’s value and rising fiscal expenditures.
MANAGEMENT OF INFLATION
Annual headline inflation in Uganda for the year ending September 2015 rose to 7.2% in comparison with the 4.8% recorded for the year ending August 2015. The rise is chiefly attributed to the annual food crops inflation that rose to 10.2% for the year ending September 2015 in comparison with the 1.8% that was recorded for the year ending August 2015.
Similarly, annual core inflation rose to 6.7% for the year ending September 2015 in comparison with 5.5% recorded for the year ending August 2015. The Annual Energy, Fuel & Utilities (EFU) declined to 3.8% for the year ending September 2015 in comparison with 3.9% that was registered at the end of August 2015.1
To stem inflation, the Bank of Uganda has been raising its policy interest rate in order to discourage borrowing. This assists in reducing the aggregate demand growth, thus reducing inflationary pressures.
Figure 6: Uganda balance of trade
US$ millionUganda balance of trade
-240.6
-331.1
-294.1
-236.6
-305.5
-283.9 -283.6
-270.6
-257.3-262.7
-273.2
-234.8
-220
-240
-260
-280
-300
-320
-340Jul 2015Apr 2015Jan 2015Oct 2014
Figure 7: Uganda inflation rate
1.8 1.81.3
1.61.9
3.6
4.9 4.95.4
4.8
7.28
6
4
2
0
2.1
Oct 2014 Jan 2015 Apr 2015 Jul 2015
Source: Trading Economics, Uganda Balance of Trade, 2015
Source: Trading Economics; Bank of Uganda 2015
1 Uganda Bureau of Statistics (2013). Consumer Price Index – September 2013. Press release. Available from www.bou.or.ug/opencms/bou/bou-downloads/press_releases/2015/Sep/Press-Release-September-2015.pdf.

15
CTA
SE
CTO
R IN
VES
TME
NT
PR
OFI
LE: U
GA
ND
A
TAXATION POLICY
All businesses have to be registered with Uganda Revenue Authority (URA). Unincorporated individuals and bodies are required to file a preliminary enquiry form with the closest URA office.
For companies, the below-listed are also mandatory.
� Memorandum and articles of association;
� Completed Internal Revenue Company application form, IR (CO);
� Copies of vending agreement (if an existing company has been bought);
� Names and addresses of shareholders and directors.
Once the above process has been completed, and upon receipt of a file number, the investor can apply for a Tax Identification Number (TIN) from URA by completing TIN application forms.
Table 1: Taxes applicable in Uganda
Indicator Tax (%)
Profit tax 25.2
Labour tax & other contributions 11.3
Other taxes 0.2
Total tax rate (% profit) 36.6
Source: Bank of Uganda, UCDA
GROWTH OF INTRAREGIONAL TRADE
Intraregional trade between the EAC, the Southern African Development Community (SADC) and the Common Market for Eastern and Southern Africa (COMESA) has increased threefold within a 10-year period.
The most recent statistics reveal that the three regional economic communities’ (RECs’) collective intra-trade for 2004 to 2014 rose from US$ 30 billion (around UGX 87 trillion) to US$ 102.6 billion (around UGX 289.7 trillion).
In this period, just COMESA documented growth from US$ 8 billion (around UGX 23.2 trillion) to US$ 22 billion (around UGX 63.8 trillion).2 COMESA comprises Uganda, Rwanda, Burundi, Kenya, the State of Eritrea, the Democratic Republic of Congo, the Federal Democratic Republic of Ethiopia, the Arab Republic of Egypt, the South Sudan, the Union of the Comoros, the Republic of Djibouti, Libya, the Republic of Madagascar, the Republic of Malawi, the Republic of Mauritius, the Republic of Seychelles, the Kingdom of Swaziland, the Republic of Zambia and the Republic of Zimbabwe.
SADC recorded growth from US$ 20 billion (around UGX 58 trillion) to US$ 72 billion (around UGX 208.8 trillion).3 SADC comprises South Africa, Namibia, Botswana, Swaziland, Lesotho, Zimbabwe, Mauritius, Tanzania, Malawi, Madagascar, Zambia and Mozambique.
EAC’s trade growth grew from US$ 2.6 billion (about UGX 7.5 trillion) in 2004 up to US$ 8.6 billion (about 24.9 trillion) in 2014. Uganda, Rwanda, Tanzania, Kenya, Burundi and Rwanda make up the EAC.
© s
hutte
rsto
ck.c
om
2 Dorothy Nakaweesi (2015). Africa Regional Trade Increases. Daily Monitor, 5 March. Available from www.monitor.co.ug/Business/Markets/Africa-regional-trade-increases/-/688606/2642562/-/11emhkmz/-.3 Ibid.

16
CTA
SE
CTO
R IN
VES
TME
NT
PR
OFI
LE: U
GA
ND
A
© s
hutte
rsto
ck.c
om
16
CTA
SE
CTO
R IN
VES
TME
NT
PR
OFI
LE: U
GA
ND
A

17
CTA
SE
CTO
R IN
VES
TME
NT
PR
OFI
LE: U
GA
ND
A
EAC Overview
The five EAC partner states (Uganda, Tanzania, Kenya, Burundi and Rwanda) are currently putting into place an integration programme based on the objective of developing political, social and economic cooperation. With this undertaking, EAC partner states strive to attain stable growth and development that is focussed on enhancing the standards of living and alleviating poverty among its peoples.
The EAC integration process is making headway, with successes of the Common Market (2010) and Customs Union (2005), culminating in the Monetary Union Protocol being signed in November 2013. Laying down the political federation’s foundation is.
Key statistics
� Population: 145.5 million;
� Area: 1.82 million km2;
� GDP (market prices): US$ 147.5 billion (2015);
� GDP per capita: US$ 769.
*Source: EAC; Export Processing Zone Authority
MAJOR TRADE ARRANGEMENTS UNDER EAC
EAC–EU ECONOMIC PARTNERSHIP AGREEMENT
In 2007, the East African Community (EAC) and the EU entered into an interim partnership agreement.
� A steady removal of quotas and duties over a 25-year period;
� Quota- and duty-free access for EAC imports to the EU;
� Exclusive agreements on collaboration in sustainable fishing;
� Rules for settling trade disputes; � New and broadened rules of origin for clothing, fishing and farming.
On this basis, the EAC and the EU are negotiating a broad economic partnership agreement.
EAC–US TRADE AND INVESTMENT PARTNERSHIP AGREEMENT
Currently, a number of EAC member states, including Uganda, enjoy duty-free access to the US market for a wide range of commodities, under the African Growth and Opportunity Act (AGOA).
A comprehensive trade and investment partnership between EAC and the United States of America (USA) is currently under discussion and will cover: agribusiness, energy, trade facilitation and related infrastructure, access to markets and finance, services, strengthening of women in business leadership and supply chain development.
EAC, COMESA AND SADC TRIPARTITE ARRANGEMENT
Since 2008, discussions were ongoing regarding the possible merging of the COMESA, the Southern Africa Development Cooperation (SADC, with 14 members) and the East African Community (EAC, with five members) member states. The Tripartite Free Trade Area (TFTA) was eventually signed in June 2015.
Now, each member state’s assemblies of parliament must ratify it before it can come into effect.

18
CTA
SE
CTO
R IN
VES
TME
NT
PR
OFI
LE: U
GA
ND
A
© s
hutte
rsto
ck.c
om
18
CTA
SE
CTO
R IN
VES
TME
NT
PR
OFI
LE: U
GA
ND
A

19
CTA
SE
CTO
R IN
VES
TME
NT
PR
OFI
LE: U
GA
ND
A
Industry Overview
Value chain development in Uganda is gaining mounting attention as a means of boosting value-added generation and improving production capacities in primary sectors. The country has been fairly successful in gaining access to several global value chains, like those for horticultural, floricultural and fish products. In order to boost these sectors and grow other sectors, the Government of Uganda has committed itself to boosting the competitiveness of doing business by addressing key issues, such as energy, transport and other production costs, as a range of specific policies and institutional frameworks to aid selected value chains’ development.
In relation to its neighbours, Uganda can be described as a fairly competitive destination for investment attraction across various value chains. Below is a comparison of some key factors of production.
Table 2: Comparison of key factors of production among Kenya, Uganda, Ethiopia and Tanzania
Description Kenya Uganda Ethiopia Tanzania
Cost of power US$/kwh 18–20 12–14 3–5 16–18
Minimum wage cost
US$/month 130–150 100–140 40–50 120–140
Sea port Mombasa Via Mombasa Via Djibouti Dar es Salaam
General infrastructure
Score by WEF 3.1 2.3 2.7 2.3
Source: ACTIF Benchmarking Reports, 2016
Uganda has a total installed generation capacity of 810 MW in 2014. The government is also carrying out a feasibility study to cover diverse generation technologies, namely solar photovoltaic (99 MW), hydro (73 MW), natural gas (50 MW) and wind (20 MW). The additional permits issued have brought the total number of projects under feasibility study to 29, with a combined capacity of 341 MW.
With regard to labour, Uganda boasts an abundant availability of relatively well-educated population, with competitive wage rates ranging between US$ 55 and US$ 105 for unskilled labour, and US$ 100 and US$ 140 for skilled labour.
© s
hutte
rsto
ck.c
om

20
CTA
SE
CTO
R IN
VES
TME
NT
PR
OFI
LE: U
GA
ND
A
COTTON VALUE CHAIN IN UGANDA: SNAPSHOT
� Third biggest export crop after tea and coffee;
� Main income source for about 250,000 households (average landholding size <1 ha);
� Thirty-nine buyers/ginners (of which 34 ginneries are privately owned & five are owned by a cooperative);
� At least 95% of lint is exported, mainly to neighbouring countries like Kenya, and to Asia;
� Currently, there are two operational textile firms (Southern Range Nyanza Limited, Phenix Logistics);
� Local apparel/garment production is mainly dominated by small and medium-sized enterprises.
For decades, cotton production has been a major driving force for socioeconomic development in Uganda. Cotton is amongst the major traditional export crops in Uganda. It is grown in several regions, but mostly in the country’s western, northern and eastern regions. It contributes an estimated 10% of the total population’s income (2.5 million inhabitants in the rural regions of the west, north and east). It is also the basic raw material for textile production and, therefore, has a special significance for the growth and development of value-added textile manufacturing industries in the country.
Cotton was initially brought to Uganda in 1903. Cotton production quickly reached more than 300,000 bales (57,000 tons) by 1930, reaching its zenith in 1974 at more than 400,000 bales (76,000 tons). Subsequently, the cotton industry experienced a steep decline and, in 1990, production declined to roughly 23,000 bales (4,370 tons). In the late 1980s and early 1990s, several endeavours were made to recover the industry, but none of these attempts made much difference. In 1994, the industry was liberalised and has since seen some production level recovery.4 Approximately 85% of Ugandan cotton is exported, as little value addition facilities exist locally. The total installed spindleage in Uganda is a meagre 10,000.
Figure 8: Cotton production in Uganda
1924
1928
1932
1936
1940
1944
1948
1952
1956
1960
1964
1968
1972
1976
1980
1984
1988
1992
1996
2000
2004
2008
2012
120
100
80
60
40
20
0
1200
1000
800
600
400
200
0
Intensified research effortsConstruction of Railway link between Uganda & Mombasa portCooperative UnionsIn 1960s, Uganda was 3rd largest cotton Producer in Africa & 5th largest exporter in World
Political turmoil & collapse of Industry
Liberalization of Sectorwith Enactment of CottonDevelopment Act Establishment of CDO,NARO, UGCEA
Cot
ton
lint p
rodu
ctio
n (in
‘000
mt)
Source: IACA (1924-2000) & CDO (2001-2012)
4 Alan Tulip, Peter Ton (2002). Uganda Cotton Sector Organic Cotton: Uganda Case Study. Available from www.uga.edu/internationalpso/ugandatextiles/casestudy.html.

21
CTA
SE
CTO
R IN
VES
TME
NT
PR
OFI
LE: U
GA
ND
A
GINNING SUBSECTOR
� Lint production: 18,751 tons (2012–13);
� Thirty-nine buyers/ginners (37 operational, two dormant);
� Installed ginning capacity is 909,400 bales per annum, but it largely remains underutilised due to low production;
� Predominantly roller ginning (36 roller gins, three saw gins);
� Lint out-turn typically varies between 34% and 36%;
� 100% hand-picked cotton and, thus, exceptional fibre characteristics and quality of lint.
Table 3: Ugandan textile manufacturers’ process
StandardsInternational equivalent (USDA standards)
Major characteristics
Micronaire Strength Staple length
Roller ginned cotton classification
UCON Good middling 3.7–4.3 30–33 29 & above
UCOB Strict middling 3.7–4.3 30–33 28–29
UCOP Middling 4–4.2 28–32 28–29
UCOA Strict low middling 4.0–4.2 28–30 26–27
UCOM Low middling 4–4.2 27–30 26 & below
Saw ginned classification
UCOSA 1 Strict middling 4–4.2 28–30 27 & above
UCOSA 11 Middling 4–4.2 27–30 27 & below
Source: Cotton Standards and Characteristics, CDO Uganda Reports. 2015
Textile manufacturers process the cotton lint into value-added yarn, fabric and garments. The local textile industry consumes less than 3%–5% of the total lint production in the country. Most of the lint is exported. AGOA-related opportunities could help stimulate investment interest, but the high cost of utilities and transport, unreliable power, and import of cheap and second-hand clothing in the domestic market continues to present a barrier for many potential investors to compete sustainably.
© s
hutte
rsto
ck.c
om
© s
hutte
rsto
ck.c
om
22
CTA
SE
CTO
R IN
VES
TME
NT
PR
OFI
LE: U
GA
ND
A
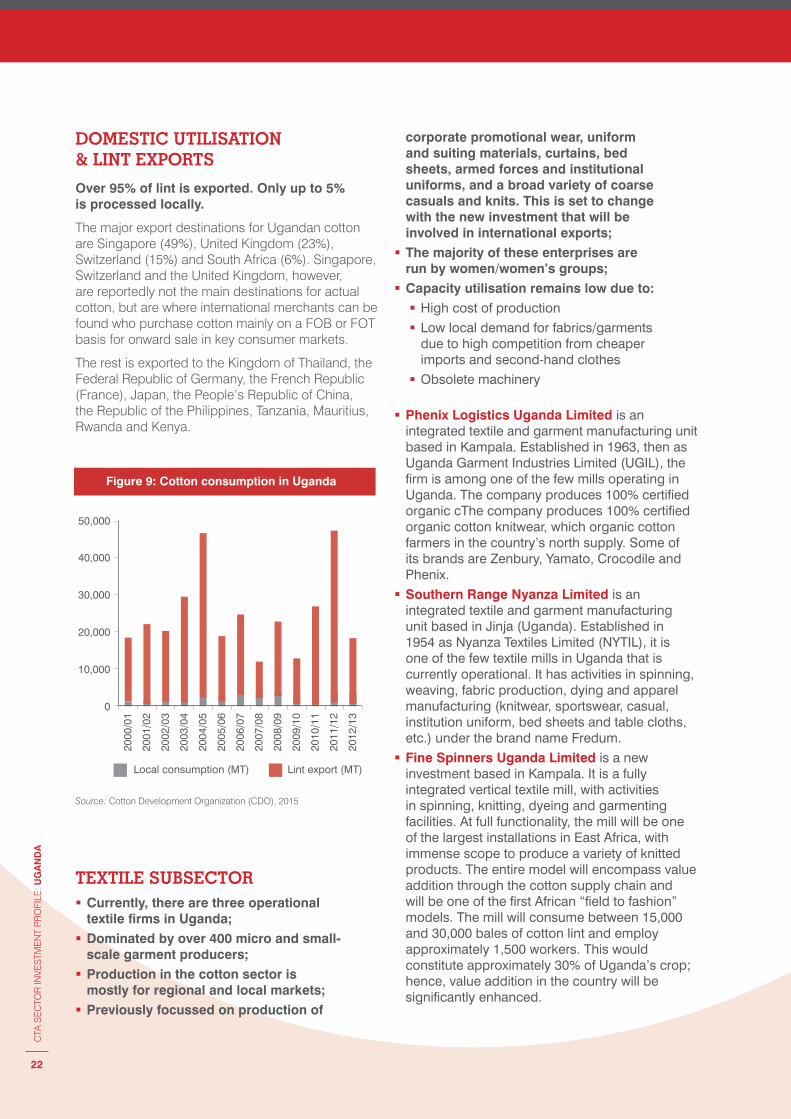
DOMESTIC UTILISATION & LINT EXPORTS
Over 95% of lint is exported. Only up to 5% is processed locally.
The major export destinations for Ugandan cotton are Singapore (49%), United Kingdom (23%), Switzerland (15%) and South Africa (6%). Singapore, Switzerland and the United Kingdom, however, are reportedly not the main destinations for actual cotton, but are where international merchants can be found who purchase cotton mainly on a FOB or FOT basis for onward sale in key consumer markets.
The rest is exported to the Kingdom of Thailand, the Federal Republic of Germany, the French Republic (France), Japan, the People’s Republic of China, the Republic of the Philippines, Tanzania, Mauritius, Rwanda and Kenya.
TEXTILE SUBSECTOR � Currently, there are three operational textile firms in Uganda;
� Dominated by over 400 micro and small-scale garment producers;
� Production in the cotton sector is mostly for regional and local markets;
� Previously focussed on production of
corporate promotional wear, uniform and suiting materials, curtains, bed sheets, armed forces and institutional uniforms, and a broad variety of coarse casuals and knits. This is set to change with the new investment that will be involved in international exports;
� The majority of these enterprises are run by women/women’s groups;
� Capacity utilisation remains low due to: � High cost of production � Low local demand for fabrics/garments due to high competition from cheaper imports and second-hand clothes
� Obsolete machinery
� Phenix Logistics Uganda Limited is an integrated textile and garment manufacturing unit based in Kampala. Established in 1963, then as Uganda Garment Industries Limited (UGIL), the firm is among one of the few mills operating in Uganda. The company produces 100% certified organic cThe company produces 100% certified organic cotton knitwear, which organic cotton farmers in the country’s north supply. Some of its brands are Zenbury, Yamato, Crocodile and Phenix.
� Southern Range Nyanza Limited is an integrated textile and garment manufacturing unit based in Jinja (Uganda). Established in 1954 as Nyanza Textiles Limited (NYTIL), it is one of the few textile mills in Uganda that is currently operational. It has activities in spinning, weaving, fabric production, dying and apparel manufacturing (knitwear, sportswear, casual, institution uniform, bed sheets and table cloths, etc.) under the brand name Fredum.
� Fine Spinners Uganda Limited is a new investment based in Kampala. It is a fully integrated vertical textile mill, with activities in spinning, knitting, dyeing and garmenting facilities. At full functionality, the mill will be one of the largest installations in East Africa, with immense scope to produce a variety of knitted products. The entire model will encompass value addition through the cotton supply chain and will be one of the first African “field to fashion” models. The mill will consume between 15,000 and 30,000 bales of cotton lint and employ approximately 1,500 workers. This would constitute approximately 30% of Uganda’s crop; hence, value addition in the country will be significantly enhanced.
Figure 9: Cotton consumption in Uganda
2000
/01
50,000
40,000
30,000
20,000
10,000
0
2001
/02
2002
/03
2003
/04
2004
/05
2005
/06
2006
/07
2007
/08
2008
/09
2009
/10
2010
/11
2011
/12
2012
/13
Local consumption (MT) Lint export (MT)
Source: Cotton Development Organization (CDO), 2015
23
CTA
SE
CTO
R IN
VES
TME
NT
PR
OFI
LE: U
GA
ND
A
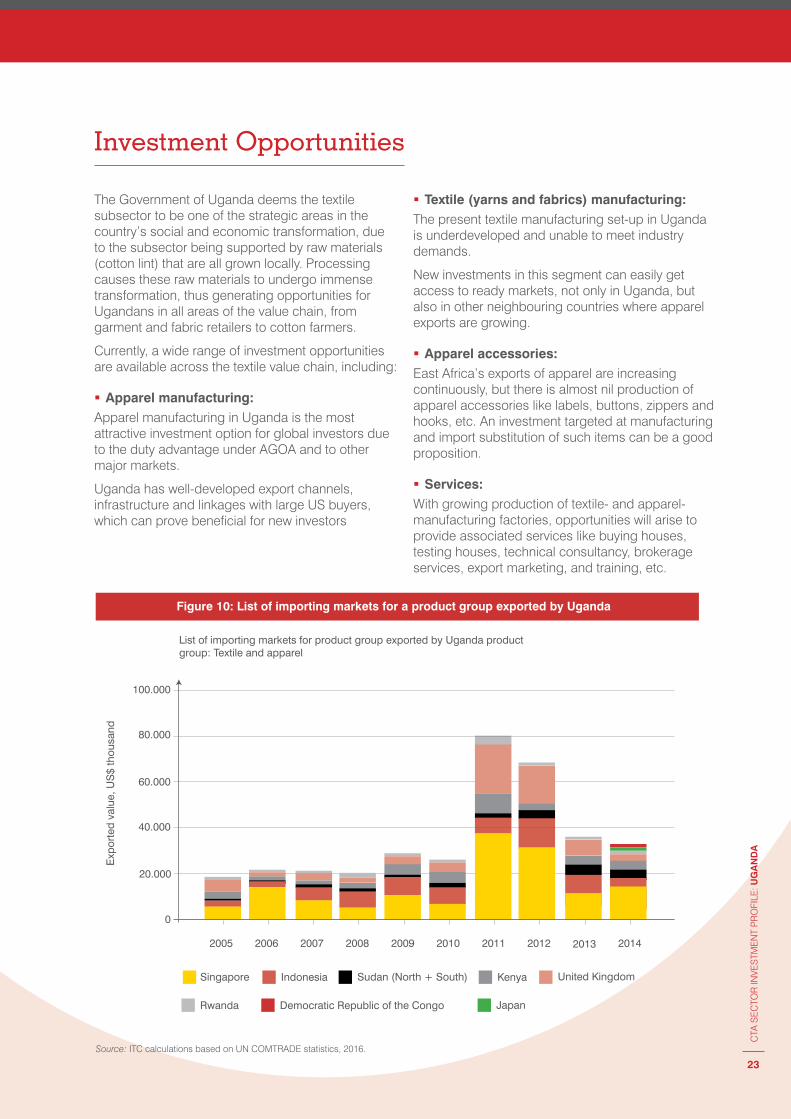
Figure 10: List of importing markets for a product group exported by Uganda
List of importing markets for product group exported by Uganda product group: Textile and apparel
Exp
orte
d va
lue,
US
$ th
ousa
nd
2005
0
20.000
40.000
60.000
80.000
100.000
2006 2007 2008 2009 2010 2011 2012 2013 2014
Indonesia
Rwanda Democratic Republic of the Congo Japan
United KingdomSudan (North + South) KenyaSingapore
Source: ITC calculations based on UN COMTRADE statistics, 2016.
Investment Opportunities
The Government of Uganda deems the textile subsector to be one of the strategic areas in the country’s social and economic transformation, due to the subsector being supported by raw materials (cotton lint) that are all grown locally. Processing causes these raw materials to undergo immense transformation, thus generating opportunities for Ugandans in all areas of the value chain, from garment and fabric retailers to cotton farmers.
Currently, a wide range of investment opportunities are available across the textile value chain, including:
� Apparel manufacturing:Apparel manufacturing in Uganda is the most attractive investment option for global investors due to the duty advantage under AGOA and to other major markets.
Uganda has well-developed export channels, infrastructure and linkages with large US buyers, which can prove beneficial for new investors
� Textile (yarns and fabrics) manufacturing:The present textile manufacturing set-up in Uganda is underdeveloped and unable to meet industry demands.
New investments in this segment can easily get access to ready markets, not only in Uganda, but also in other neighbouring countries where apparel exports are growing.
� Apparel accessories:East Africa’s exports of apparel are increasing continuously, but there is almost nil production of apparel accessories like labels, buttons, zippers and hooks, etc. An investment targeted at manufacturing and import substitution of such items can be a good proposition.
� Services:With growing production of textile- and apparel- manufacturing factories, opportunities will arise to provide associated services like buying houses, testing houses, technical consultancy, brokerage services, export marketing, and training, etc.

24
CTA
SE
CTO
R IN
VES
TME
NT
PR
OFI
LE: U
GA
ND
A
Uganda Revenue Authority (URA)
Central body accountable for all taxes that the Central Government of Uganda collect. Collection and assessment of stipulated revenue, to enforce and administer the laws associated with this revenue and to take care of related matters.
URA Headquarters, Plot m193/m194, Nakawa Industrial Area P.O. Box 7279, Kampala
Telephone: 0800 117 000Email: [email protected]: www.ura.go.ug
Directorate of Citizenship and Immigration Control
The Directorate of Citizenship and Immigration Control is a public service organization under the Ministry of Internal Affairs. The organization handles migration from and to Uganda, including work permits and visas, etc.
Plot 75, Jinja Road P.O. Box 7165/7191, Kampala, Uganda
Telephone: +256 414 595 945Fax: +256 414 348 707Website: www.immigration.go.ug
National Environment Management Authority (NEMA) – environmental compliance
NEMA is involved in developing environmental policies, regulations, laws, guidelines and standards, and advises the Ugandan Government on sensible environment management.
Plot 17/19/21, Jinja Road, NEMA House, Kampala, Uganda
Telephone: +256 414 251 064 +256 414 251 065 +256 414 251 068 Fax: +256 414 257 521Email: [email protected]: www.nemaug.org
Lands Ministry
Responsible for providing national standards and policy direction, and coordinating everything regarding urban development, housing and lands, including land ownership verification.
Plot 13–15 Parliament Avenue P.O. Box 7096, Kampala
Telephone: +256 414 342 931/3 Fax: +256 414 230 891Email: [email protected]: www.mlhud.go.ug
Cotton Development Organisation (CDO)
In Uganda, the manufacturing, processing and marketing of cotton is supervised by the Cotton Development Organisation. The organisation boosts the distribution of high-quality cotton seed and largely enables the cotton industry’s development.
Head Office, Plot 15, Clement Hill Road P.O. Box 7018, Kampala, Uganda
Telephone: +256 414 230 309 / 232 968 Fax: +256 414 232 975Email: [email protected]: http://www.cdouga.org/
Useful Contacts
Uganda Investment Authority (UIA)
A one-stop centre offering free services where investors can register their businesses and get all relevant licenses related to their business under one roof.
The Investment Centre, Plot 22B Lumumba Avenue, TWED Plaza P.O. Box 7418 Kampala, Uganda
Telephone: +256 414 301 000Website: ugandainvest.go.ug
Uganda Registration Services Bureau (URSB)
For registration of business documents, companies and business names, and intellectual property such as copyrights, patents, trademarks, designs and utility models.
Plot 5, George Street, Georgian House P.O. Box 6848, Kampala, Uganda
Telephone: +256 414 233 219Fax: +256 414 250 712Email: [email protected]: www.ursb.go.ug
© s
hutte
rsto
ck.c
om
25
CTA
SE
CTO
R IN
VES
TME
NT
PR
OFI
LE: U
GA
ND
A
Annexes
ANNEX I: GETTING STARTED - A BRIEF GUIDE
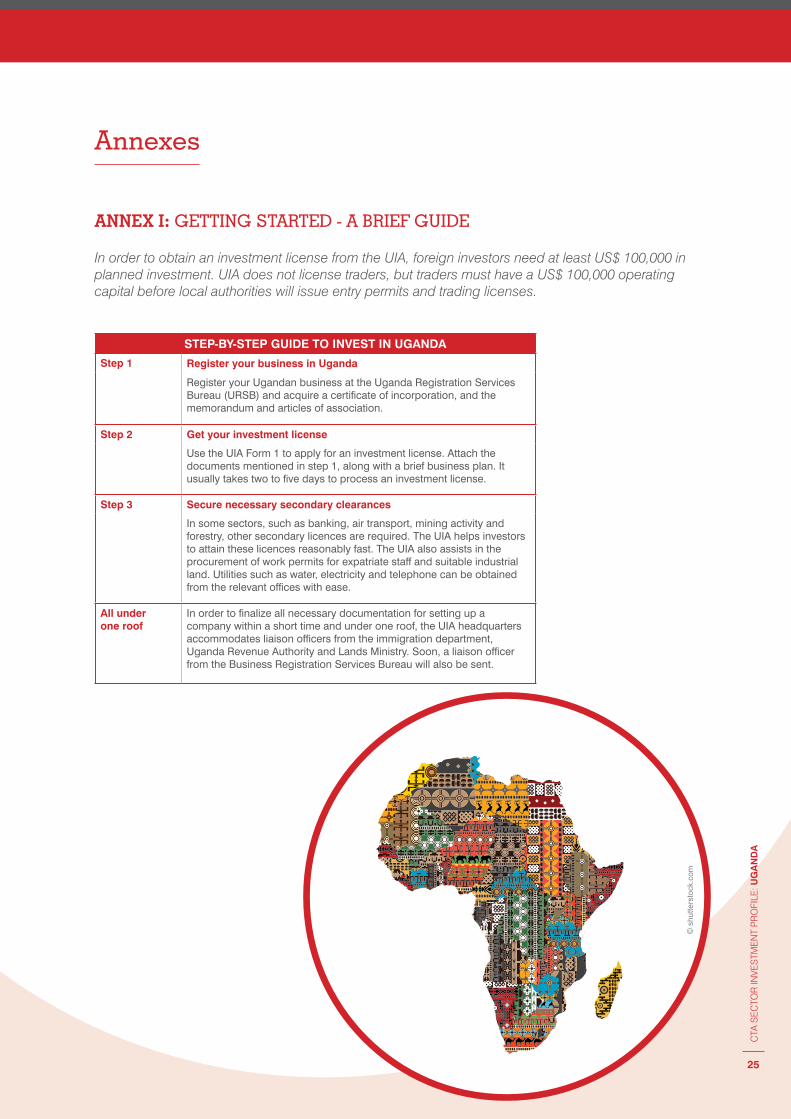
In order to obtain an investment license from the UIA, foreign investors need at least US$ 100,000 in planned investment. UIA does not license traders, but traders must have a US$ 100,000 operating capital before local authorities will issue entry permits and trading licenses.
STEP-BY-STEP GUIDE TO INVEST IN UGANDA
Step 1 Register your business in Uganda
Register your Ugandan business at the Uganda Registration Services Bureau (URSB) and acquire a certificate of incorporation, and the memorandum and articles of association.
Step 2 Get your investment license
Use the UIA Form 1 to apply for an investment license. Attach the documents mentioned in step 1, along with a brief business plan. It usually takes two to five days to process an investment license.
Step 3 Secure necessary secondary clearances
In some sectors, such as banking, air transport, mining activity and forestry, other secondary licences are required. The UIA helps investors to attain these licences reasonably fast. The UIA also assists in the procurement of work permits for expatriate staff and suitable industrial land. Utilities such as water, electricity and telephone can be obtained from the relevant offices with ease.
All under one roof
In order to finalize all necessary documentation for setting up a company within a short time and under one roof, the UIA headquarters accommodates liaison officers from the immigration department, Uganda Revenue Authority and Lands Ministry. Soon, a liaison officer from the Business Registration Services Bureau will also be sent.
©
shu
tters
tock
.com
26
CTA
SE
CTO
R IN
VES
TME
NT
PR
OFI
LE: U
GA
ND
A
ANNEX II: INSTITUTIONAL SUPPORT FOR INVESTORS
INVESTMENT INCENTIVE REGIME
The Uganda Government provides a fair incentives package that offers substantial capital recovery terms, especially for projects that involve considerable investment in machinery and plant and that are expected to generate profits in the longer term.
This includes:
� Start-up cost payable 25% p.a. over four years
� Initial allowance on 50%–75% machinery and plant
� Training expenditure 100% � Scientific research 100% expenditure
� Mineral exploration 100% expenditure
� Depreciation rates 20%–40% of assets range
� Depreciation rate for 5% industrial buildings, hotels, buildings & hospitals
� Initial allowance on 20% industrial and hotel buildings
If they register as investment traders, investors are eligible for a VAT refund on building materials for commercial and industrial buildings.
All expatriates and investors coming to Uganda are eligible for first arrival privileges, which comprise duty exemptions for motor vehicles that have been owned for at least a year, as well as duty exemptions on personal effects.
THE UGANDA INVESTMENT AUTHORITY’S (UIA’S) ONE-STOP SHOP
The Uganda Investment Authority’s one-stop shop is a free service set up in partnership with Uganda Revenue Authority, the Immigration Department and Uganda Registration Bureau Service to facilitate investors who come via UIA with:
� Company registration � Tax information, rights incentives and obligations, registration with Uganda Revenue Authority, clearance of machinery and equipment
� Immigration and issue of work permits where required
INDUSTRIAL AND BUSINESS PARKS
The Ugandan Government is establishing at least 22 industrial and business parks (IBPs) across the country, mainly for job creation and to add value raw materials available locally. This job reaction will enable citizens to acquire new manufacturing and other skills, and trade in new products can be increased, along with further developing those already being produced.5
The foremost IBP that the Uganda Investment Authority (UIA) is setting up is the Kampala Industrial and Business Park, situated 11 km to the east of Kampala, the country’s national capital city. The facility is 2,200 acres and will comprise several industrial clusters and other big projects. Land in the park has already been allocated to more than 200 investors.
Just outside Kampala, Uganda Investment Authority is developing two parks.
� Ten kilometres north-east of Kampala is Bweyogerere Industrial Estate, boasting 45 acres of land. Seven investors have already had land allocated to them.
� Luzira Industrial Park is situated five kilometres east of Kampala. The facility boasts 70 acres of land and is operational, with working infrastructure (water, power and road). Power is in the process of being upgraded to investors’ requirements. Several projects under 15 investors are at different stages of completion.
© s
hutte
rsto
ck.c
om5 Uganda Investment Authority. Industrial and Business Parks. Available from http://gov.ug/content/industrial-and-business-parks

27
CTA
SE
CTO
R IN
VES
TME
NT
PR
OFI
LE: U
GA
ND
A
SITA project implemented by: SITA project funded by:

© s
hutte
rsto
ck.c
om