Embed Size (px)
Citation preview
COTE Top TenNew Measures for Success
9 December 2016
AIA Committee on the Environment Advisory Group members:
Lance Hosey, FAIA, Perkins Eastman
Angie Brooks, FAIA, Brooks Scarpa
Z Smith, AIA, Eskew+Dumez+Ripple

What is COTE?
• One of 21 AIA Knowledge Communities
• “The Committee on the Environment (COTE) works to advance, disseminate, and advocate—to the profession, the building industry, the academy, and the public—design practices that integrate built and natural systems, and enhance both the design quality and environmental performance of the built environment.”
• 13,000 members• Led by a 12-member Advisory
Group
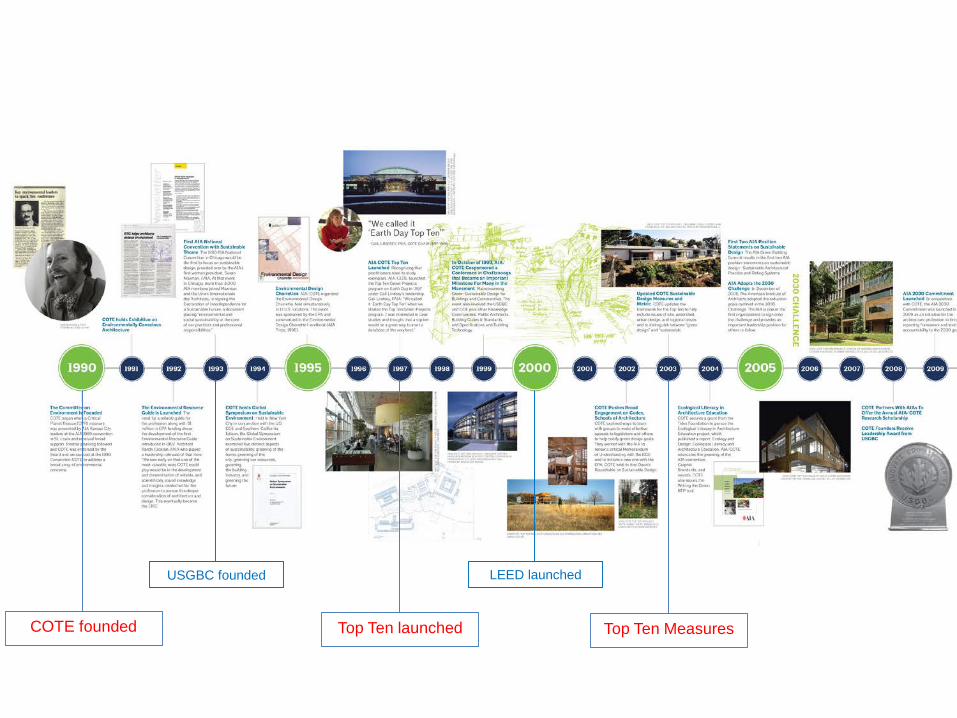
Robert Ivy, FAIA | Chief Executive Officer | May 21, 2013COTE founded Top Ten launched Top Ten Measures
USGBC founded LEED launched
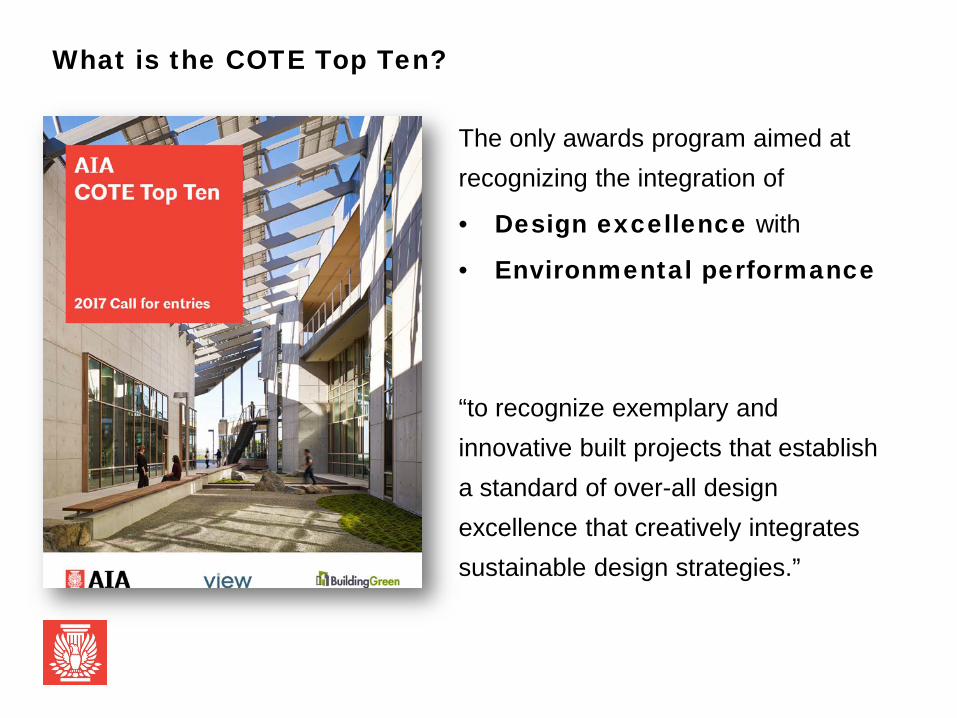
What is the COTE Top Ten?
The only awards program aimed at recognizing the integration of
• Design excellence with
• Environmental performance
“to recognize exemplary and innovative built projects that establish a standard of over-all design excellence that creatively integrates sustainable design strategies.”

10 measures for the COTE Top Ten 2003-2016
123456789
10

What is the COTE Top Ten?
“If it’s not performing,
it’s not beautiful…
…and if it’s not beautiful,
it’s not performing.”
—David Lake
Dixon Water FoundationJosey Pavilion

Sustainability | Design excellence
• COTE Top Ten strives to make environmental considerations and actual performance integral to the practice of architecture
• COTE Top Ten highlights how the design was shaped around the project’s goals and performance criteria
• “Consistently for us, good design means good performance”
Solar Umbrella House

Many projects win both COTE Top Ten and Institute Honor awards
• …and it’s becoming more common (12 COTE Top Ten winners in the last decade won Honor awards).
• “Virtually every design decision made by the integrated design team supported the building’s aggressive net-zero energy target.”
• Design and performance standards are progressively aligning
• Top Ten looks to the future, where they will be one and the same
Step Up on FifthAffordable multi-family housing
David and Lucille Packard Foundation Headquarters
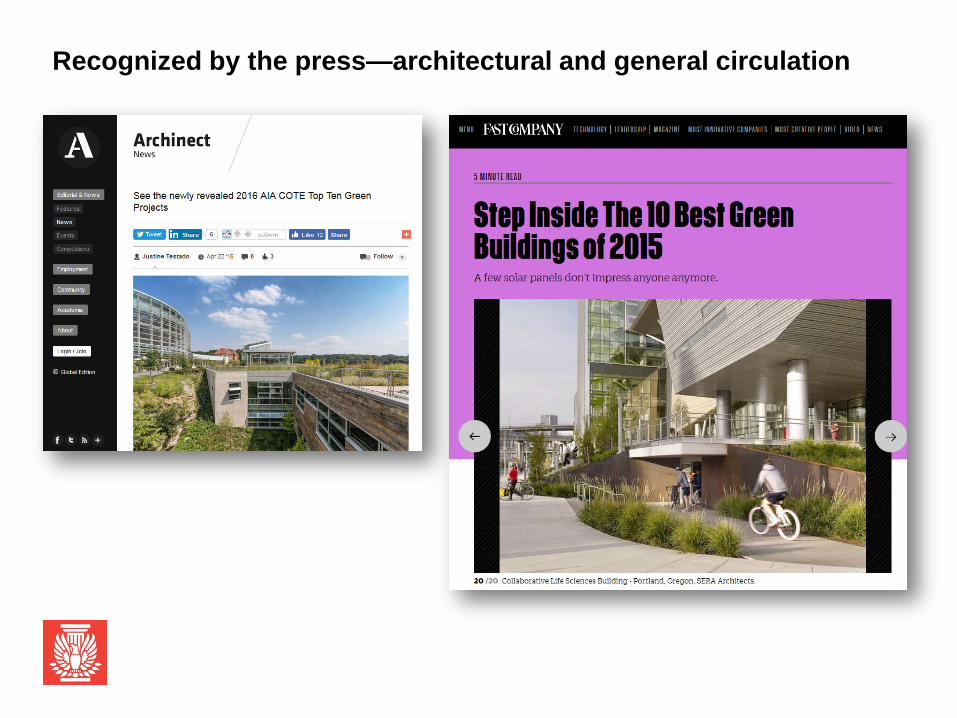
Recognized by the press—architectural and general circulation

Associated awards: Top Ten Plus & Top Ten for Students
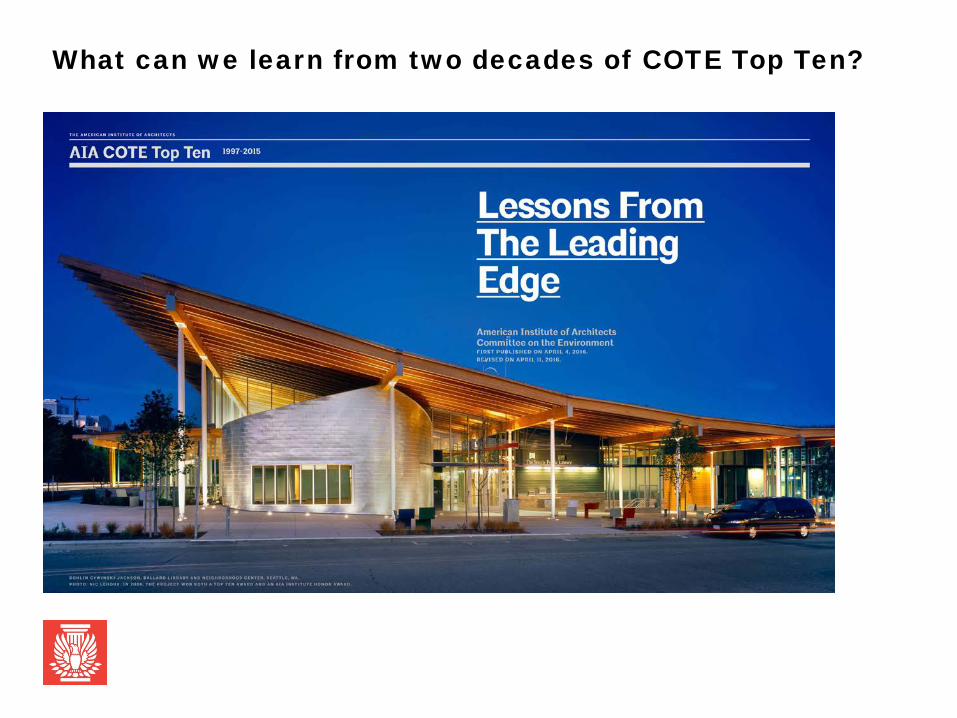
What can we learn from two decades of COTE Top Ten?
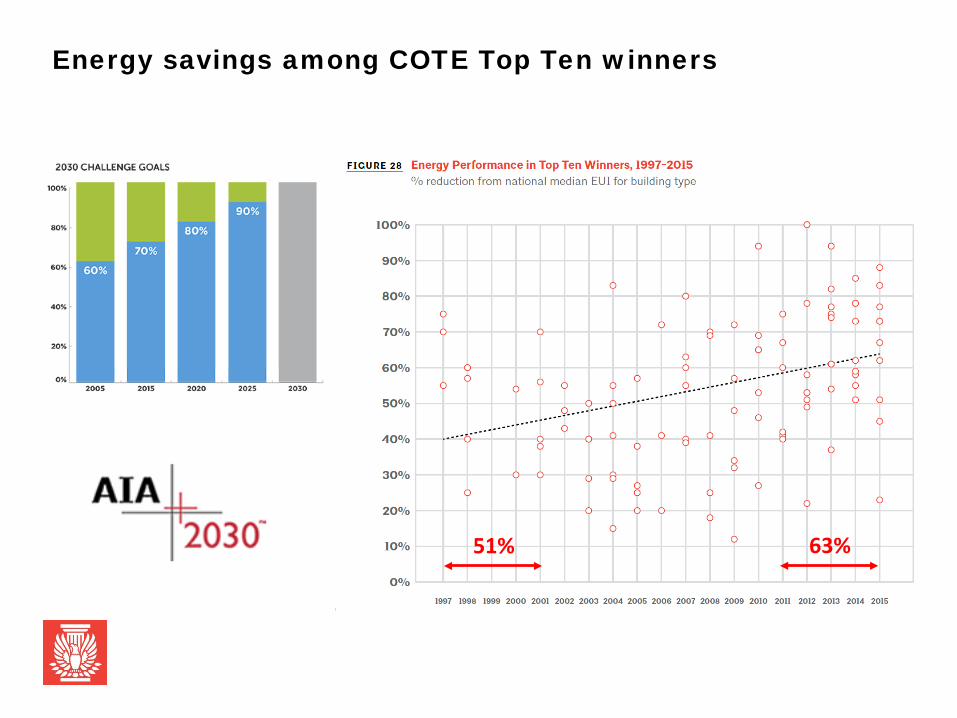
Energy savings among COTE Top Ten winners
51% 63%

Does great performance have to cost more?
Some of the most expensive projects have been only modest energy savers.
Some of the least expensive projects enjoyed significant energy savings.

Sustainability trends impacting practice

Goals for the new COTE Top Ten framework
• Highlight AIA priorities– Energy– Materials– Resilience– Design & Health
• Highlight Economy
• Update metrics
• Reward shift to actual measured performance post-occupancy

Who can submit? When can you submit?
Who?• Firms must sign up for the
AIA 2030 Commitment
When?• Teams are encouraged to
submit after 12 months of occupancy (to promote post-occupancy learning)
• No time limit to submit
New Orleans BioInnovation Center, 2015 COTE Top Ten winnerSubmitted 4 years after occupancy

The new COTE Top Ten measures of sustainable design

Measure 1: Design for Integration
What’s the big idea? How does the project demonstrate the intersection of design excellence and sustainable performance?
Sustainability is essential to design excellence, and vice versa. Describe the project, program, and any unique challenges and opportunities. Specifically explain how the design is shaped around the project’s goals and performance criteria, providing both utility and delight. Give examples of how individual design strategies provide multiple benefits across the full triple bottom line of social, economic, and environmental value.

Measure 1: Design for Integration
Ballard Library, 2006 COTE Top Ten winner

Measure 2: Design for Community
How does this project make the most of its surrounding community, integrate with it, and give back?
Sustainability is inextricably tied to the wellness of communities. Describe specifically how community members, inside and outside the building, benefit from the project. How does this project contribute to creating a walkable, human-scaled community inside and outside the property lines? How were community members engaged during the design and development process? How does the project promote social equity at local, regional, and global scales? Because transportation-related emissions negatively affect public health, describe efforts to reduce carbon in the production of the building.
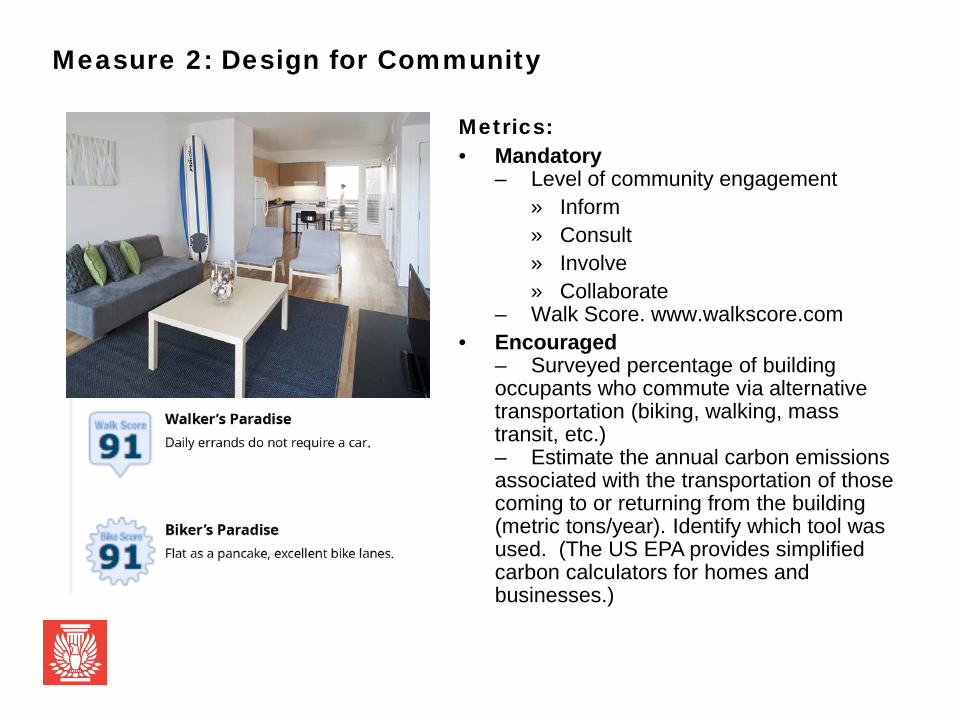
Measure 2: Design for Community
Metrics:• Mandatory
– Level of community engagement» Inform » Consult » Involve » Collaborate
– Walk Score. www.walkscore.com • Encouraged
– Surveyed percentage of building occupants who commute via alternative transportation (biking, walking, mass transit, etc.) – Estimate the annual carbon emissions associated with the transportation of those coming to or returning from the building (metric tons/year). Identify which tool was used. (The US EPA provides simplified carbon calculators for homes and businesses.)

Measure 3: Design for Ecology
How does this project respond, connect, and contribute to the surrounding climate & ecosystem, and build a connection to place?
Sustainable design protects and benefits natural ecosystems and habitat in the presence of human development. How does the site relate or respond to the surrounding ecosystem? How does the project contribute to biodiversity and the preservation or restoration of habitats and ecosystem services?

Measure 3: Design for Ecology
Metrics:• Mandatory– Percentage of the site
area designed to support vegetation (landscape or green roof) __%.
– Percentage of site area supporting vegetation before project the project began __%.
– Percentage of landscaped areas covered by native or climate-appropriate plants supporting native or migratory animals __%.
Measure 4: Design for Water
How does the project use water wisely and handle rainfall responsibly?
Sustainable design conserves and improves the quality of water as a precious resource. Illustrate how various water streams flow through the building and site, including major water conservation and stormwater management strategies. How does the project relate to the regional watershed? Describe strategies to reduce reliance on municipal water sources. Does the project recapture or re-use water?

Measure 4: Design for Water
Metrics:• Mandatory– Predicted annual consumption of potable water (gal) [per
resident, per visitor, per FTE, as appropriate], for all uses, including process water
– Is potable water used for irrigation (after initial plant establishment period)? [YES/NO]
• Encouraged– Actual annual consumption of potable water (gal) [per
resident, per visitor, per FTE, as appropriate], for all uses– Is rainwater captured for use by the project? [YES/NO] If
so, what percentage of water consumed onsite comes from rainwater capture? __%
– Is greywater or blackwater captured for re-use? [YES/NO] If so, what percentage of water consumed onsite comes from greywater / blackwater capture & treatment? __%
– Percent of rainwater (from maximum anticipated 24-hour, 2-year storm event) that can be managed on site
– Metrics of water quality for any stormwater leaving the site.

Measure 5: Design for Economy
How does the design show that higher performance can be cost-effective?
Providing abundance while living within our means is a fundamental challenge of sustainability. How does the project provide “more with less”? Possibilities include “right sizing” the program, cost-effective design decisions, economic performance analysis, economic equity strategies, notable return-on-investment outcomes, contributing to local and disadvantaged economies, etc. Identify any additional first-cost investments and how they are anticipated to improve life-cycle costs and longer-term economic performance.

Measure 5: Design for Economy
Metrics: • Mandatory– Cost per square foot
• Encouraged– Comparable cost per square foot for other,
similar buildings in the region. List source.
– Alternate unit cost measures: cost per employee [for a workplace], cost per resident [residential projects]), etc.
– Estimated operating cost reduction (identify baseline) (%)
– Life Cycle Analysis of the costs associated with measures taken to improve performance (e.g., energy cost payback, water savings, measured productivity gains)

Measure 6: Design for Energy
How much energy does the project use, is any of that energy generated on-site from renewable sources, and what’s the net carbon impact?
The burning of fossil fuels to provide energy for buildings is a major component of global GHG emissions, driving climate change. Sustainable design conserves energy while improving building performance, function, comfort, and enjoyment. How did analysis of local climate inform the design challenges & opportunities? Describe any energy challenges associated with the building type, intensity of use, or hours of operation, and how the design responds to these challenges. Describe energy-efficient design intent, including passive design strategies and active systems and technologies. How are these strategies evident in the design, not just the systems?

Measure 6: Design for Energy
Metrics: Use EPA’s Target Finder, AIA’s 2030 Commitment Reporting Tool, or the Architecture 2030 Challenge reference materials to provide comparison baselines for energy use and to convert utility-provided energy consumed into equivalent carbon emission impact. • Mandatory– Predicted Consumed Energy Use Intensity (Site
EUI): kBtu/sf/yr– Total energy use by the facility including energy
purchased from utilities and provided by on-site renewable sources. Predicted Net EUI (kBtu/sf/yr)& Carbon emissions (lb/sf/yr)
– Net purchased energy use (total energy use, less any energy generated on-site from renewable resources).
– Predicted Percent Reduction from National Average EUI for Building Type (__%)
– Predicted Lighting Power Density (W/sf)

Measure 6: Design for Energy
Metrics (continued)
• Strongly Encouraged– Actual Consumed Energy Use Intensity (Site
EUI): kBtu/sf/yr– Total energy use by the facility including energy
purchased from utilities and provided by on-site renewable sources. If available via sub-metering, provide a breakdown by energy end use (e.g., lighting, heating…) via attachment.
– Actual Net EUI (kBtu/sf/yr)& Carbon emissions (lb/sf/yr)
– Net purchased energy use (total energy use, less any energy generated on-site from renewable resources).
– Actual Percent Reduction from National Average EUI for Building Type (__%)

Measure 7: Design for Wellness
How does the project promote the comfort and health of those who spend time in it?
Sustainable design supports comfort, health, and wellness for the people who inhabit or visit buildings. Describe strategies for optimizing daylight, indoor air quality, connections to the outdoors, and thermal, visual, and acoustical comfort for occupants and others inside and outside the building. How does the design promote the health of the occupants? Describe design elements intended to promote activity or exercise, access to healthy food choices, etc. Outline any material health strategies, including any materials selection criteria based on third-party frameworks such as Health Product Declarations (HPDs), Living Building Challenge Red List, EPA chemicals of concern, etc. Include key results on occupant comfort from occupant satisfaction surveys.

Measure 7: Design for Wellness
Metrics:• Mandatory– (Percentage of floor area or percentage of
occupant work stations) with direct views of the outdoors
– (Percentage of floor area or percentage of occupant work stations) within 30’ of operable windows
– (Percentage of floor area or percentage of occupant work stations) achieving adequate light levels without the use of artificial lighting, by simulation or by direct measurement of the finished building, at a typical single point in time (>300 lux at 3pm March 21)
– [Workplaces]: How easily can occupants control their own thermal comfort and lighting?
• How many occupants per thermal zone or thermostat?
• Percentage of occupants who can control their own light levels __%
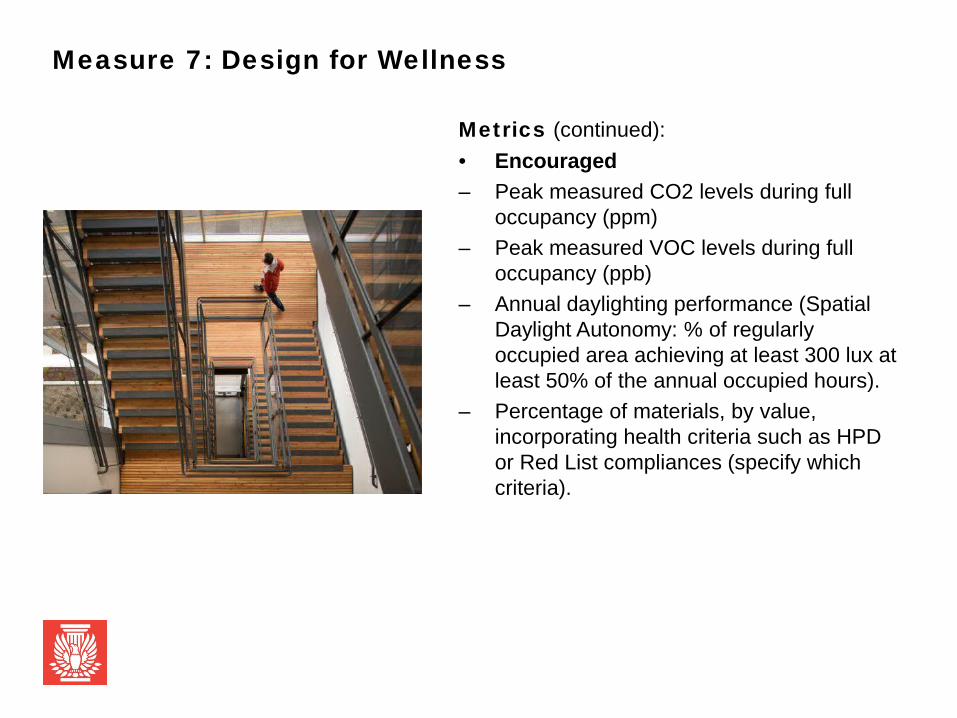
Measure 7: Design for Wellness
Metrics (continued):• Encouraged– Peak measured CO2 levels during full
occupancy (ppm)– Peak measured VOC levels during full
occupancy (ppb)– Annual daylighting performance (Spatial
Daylight Autonomy: % of regularly occupied area achieving at least 300 lux at least 50% of the annual occupied hours).
– Percentage of materials, by value, incorporating health criteria such as HPD or Red List compliances (specify which criteria).

Measure 8: Design for Resources
How were the decisions about the materials used based on an understanding of their impact, especially carbon impact?
Sustainable design includes the informed selection of materials and products to reduce product-cycle environmental impacts while enhancing building performance. Describe efforts to optimize the amount of material used on the project. Outline materials selection criteria and considerations, such as enhancing durability and maintenance and reducing the environmental impacts of extraction, manufacturing, and transportation. Identify any special steps taken during design to make disassembly or re-use easier at the building’s end of life. What other factors helped drive decision-making around material selection on this project?
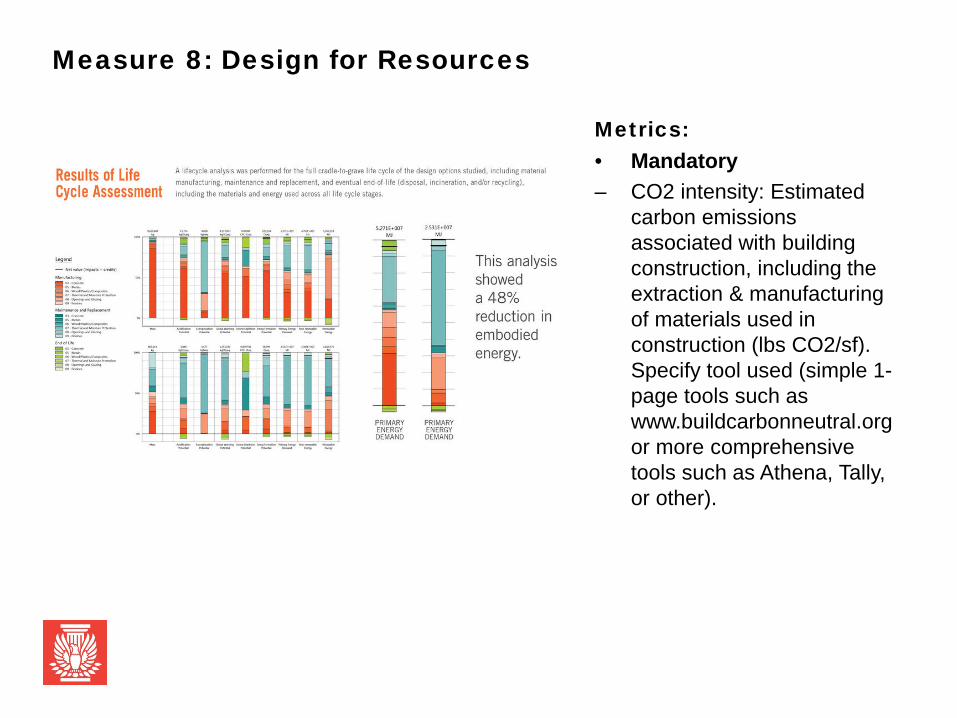
Measure 8: Design for Resources
Metrics:• Mandatory– CO2 intensity: Estimated
carbon emissions associated with building construction, including the extraction & manufacturing of materials used in construction (lbs CO2/sf). Specify tool used (simple 1-page tools such as www.buildcarbonneutral.org or more comprehensive tools such as Athena, Tally, or other).

Measure 8: Design for Resources
Metrics (continued):• Encouraged– LCA: Were other life-cycle assessments (LCAs)
conducted? Y/N. If so, identify tools used and summarize results.
– EPD: Were environmental product declarations (EPDs) collected? Y/N. If so, summarize results.
– Percentage (by weight) of construction waste diverted from landfill
– Percentage of materials reused from existing buildings or other local sources (identify appropriate metric—weight, volume, cost)
– Percentage of recycled content of building materials (by cost)
– Percentage (by cost) of the project materials extracted and manufactured regionally (specify distance).
– Percentage (by cost) of materials used with comprehensive third party certifications (e.g. Declare, Cradle to Cradle – specify which system).

Measure 9: Design for Change
How does the project design anticipate adapting to new uses, adapt to climate change, and support resilient recovery from disasters?
Reuse, adaptability, and resilience are essential to sustainable design, which seeks to maintain and enhance usability, functionality, and value over time. Describe how the project is designed to facilitate adaptation for other uses and/or how an existing building was repurposed. What other uses could this building easily accommodate in 50-100 years? In what ways did the design process take into account climate change over the life of the building? Describe the project’s resilience measures: How does the design anticipate restoring or adapting function in the face of stress or shock, such as natural disasters, blackouts, etc.? How does the project address passive survivability (providing habitable conditions in case of loss of utility power)?

Measure 9: Design for Change
Metrics:• Mandatory– Percentage of project floor area, if any,
that represents adapting existing buildings – Anticipated number of days the project
can maintain function without utility power• Encouraged– Percentage of power needs supportable
by onsite power generation– Carbon emissions saved through adaptive
reuse vs new construction (provide calculations and source)
– LEED Resilience Pilot Credit or other resilience rating system metrics (e.g., RELi)

Measure 10: Design for Discovery
What lessons for better design have been learned through the process of project design, construction, and occupancy?Sustainable design strategies and best practices evolve over time through documented performance and shared knowledge of lessons learned. What lessons for better design have been learned through the process of project design, construction, and occupancy, and how have these been incorporated in subsequent projects? Describe ways the lessons have been shared with a larger audience (publications, lectures, etc.) and any ways the project may have influenced industry practices. Describe the processes used to maintain a long-term relationship between the design team and those occupying and operating the building and identify how both the users and designers benefited. Projects with exemplary actual performance and post-occupancy information will be highlighted among the award recipients as ‘Top Ten Plus’.

Measure 10: Design for Discovery
Metrics:• Mandatory– Has a post-
occupancy evaluation, including surveys of occupant comfort, been performed? (Y/N)
– If so, summarize results.

The new COTE Top Ten measures of sustainable design
Thank you for attendingTo receive LU credit, AIA members must take the survey within 3
business days of this webinar. Credit will be posted to your
transcript within 2 weeks.
Survey link: http://bit.ly/CTTquiz
If you have any questions, email: