Embed Size (px)
Citation preview
2
Section 9
Introduction
Businesses have only 3 options when it comes to increasing profits: lower costs, increase prices or change sales or the sales blend. Section 9 will discuss the determination of costs and product or service pricing.
At the outset it should be noted a number of small and midsized and even large companies do not have a thorough understanding of their product costs nor do some of them have a procedure for analyzing these costs. The control, monitoring and assessing of both organization and product cost drivers is one of the most important functions of management. There is also a direct relationship between a food company’s cost structure and the pricing and profitability of the company’s product or service.
Product or service pricing is considered one of the most critical decisions made in a company. However, a number of small and medium sized companies have no process in place to assess competitive or market pricing nor do they have a pricing strategy or plan. The “opening” or “first price point” for a product or service is probably one of he most important decisions that a company will make. Yet often this decision is based on financial criteria without consideration of factors such as market pricing, line pricing, bundle pricing, penetration pricing tactics, zone pricing, promotional pricing or other pricing strategies.
Cost Management
Costs Defined
In order to understand the impact of various costs on a company’s financial performance, it is first necessary to gain some knowledge of the type of costs associated with a product or service. The knowledge of what makes up these costs is fundamental in determining the product price that is necessary to cover the company’s fixed and variable cost and generate a profit. This information is also required in order to reduce or eliminate some of those while helping the company develop a sustainable competitive advantage in the
marketplace. What is a cost?
A cost is all the money that is spent to manufacture a product or to provide a service. The costs to make a product are usually composed of fixed costs and variable costs. An important cost to consider when making decisions on a product is the opportunity cost.
Opportunity Cost
Is the loss of the benefit that could have been obtained by investing resources (cash, salaries, time) in something else. For example, the opportunity cost of carrying a lot of inventory is
the value that could have been created if some of that inventory cost was invested in marketing or other products. It is the value of the various alternatives that could have been accomplished with the resources expended in the business, product, project or service.
3
Section 1
Fixed Cost
Fixed costs are costs that are not dependent on the level of production or sales, such as monthly salaries, taxes, mortgage payments, or the monthly rent or basic plant maintenance costs.
Variable Cost
Variable costs are costs that change in proportion to the activity of a business. Examples: ingredients, packaging, production line personnel, freight, electricity used to run the production equipment.
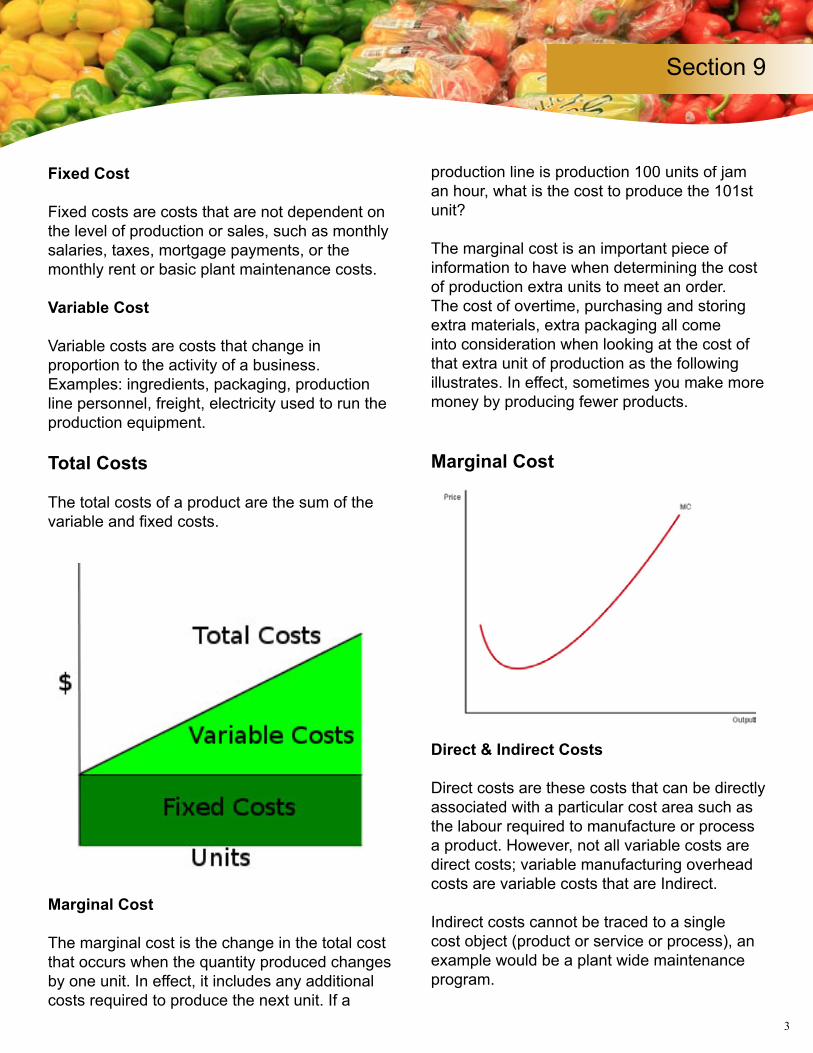
Total Costs
The total costs of a product are the sum of the variable and fixed costs.
Marginal Cost
The marginal cost is the change in the total cost that occurs when the quantity produced changes by one unit. In effect, it includes any additional costs required to produce the next unit. If a
production line is production 100 units of jam an hour, what is the cost to produce the 101st unit?
The marginal cost is an important piece of information to have when determining the cost of production extra units to meet an order. The cost of overtime, purchasing and storing extra materials, extra packaging all come into consideration when looking at the cost of that extra unit of production as the following illustrates. In effect, sometimes you make more money by producing fewer products.
Marginal Cost
Direct & Indirect Costs
Direct costs are these costs that can be directly associated with a particular cost area such as the labour required to manufacture or process a product. However, not all variable costs are direct costs; variable manufacturing overhead costs are variable costs that are Indirect.
Indirect costs cannot be traced to a single cost object (product or service or process), an example would be a plant wide maintenance program.
Section 9
4
Incremental Cost
Incremental cost is the change in cost caused by a particular managerial decision. It can be incurred when a product or service is modified or there is a change to the product design or production process. This cost is often associated with “cost creep” or the changes to the cost of a product or service brought about by, usually seemingly small, revisions.
Incremental costs creep into a company. A new type of letterhead, a small change in ingredients, a change in the quality of tape used on boxes, a seemingly minor change in packaging. Beware of the cost creep.
Overhead Costs (Overhead)
Overheads are costs that are necessary to the continued functioning of the business, such a telephone, rent, postage, administrative payroll, office supplies, benefits, maintenance, and business trips.
Operating Costs
Operating costs are those recurring costs which are related to the operation of a business or the operation of a device, piece of equipment or a facility. There are two categories of operating costs; business operating costs and equipment operating costs.
The Costs vs Volume vs Profitability
The small to medium and even large businesses, in the food sector often do not maximize profitability due to inadequate marginal cost and marginal profit information. An understanding of how marginal costs and marginal profits have a direct effect on profitability is important for price determination and cost improvement practices.
Section 1Section 9
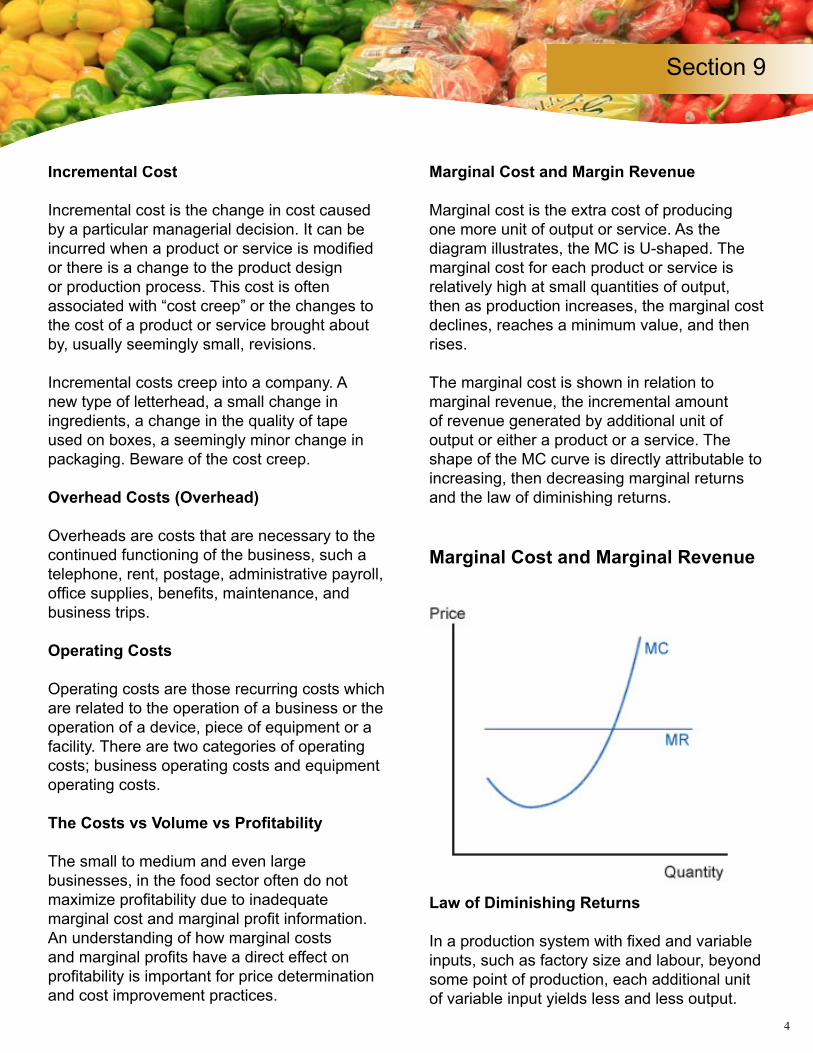
Marginal Cost and Margin Revenue
Marginal cost is the extra cost of producing one more unit of output or service. As the diagram illustrates, the MC is U-shaped. The marginal cost for each product or service is relatively high at small quantities of output, then as production increases, the marginal cost declines, reaches a minimum value, and then rises.
The marginal cost is shown in relation to marginal revenue, the incremental amount of revenue generated by additional unit of output or either a product or a service. The shape of the MC curve is directly attributable to increasing, then decreasing marginal returns and the law of diminishing returns.
Marginal Cost and Marginal Revenue
Law of Diminishing Returns
In a production system with fixed and variable inputs, such as factory size and labour, beyond some point of production, each additional unit of variable input yields less and less output.
5
Section 1
The result at this point is that producing one more additional unit of output costs more and more in variable inputs. The concept is also known as the Law of Diminishing Returns.
The law demonstrates that more is not always better when it comes to production. It is often advisable to outsource additional product needs rather than produce it in house.
Marginal Profit
Marginal profit is the dollar amount by which a food company’s profit increases or decreases when output increases by one unit. Marginal Profit = Marginal Revenue - Marginal Cost.
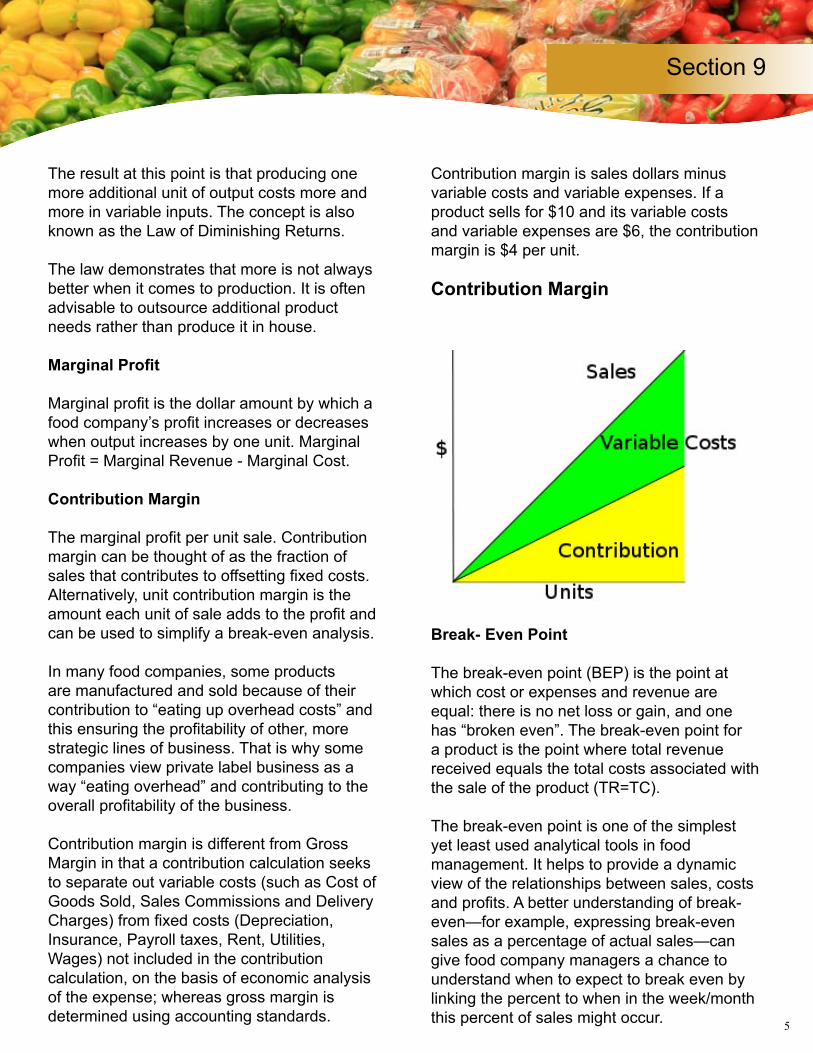
Contribution Margin
The marginal profit per unit sale. Contribution margin can be thought of as the fraction of sales that contributes to offsetting fixed costs. Alternatively, unit contribution margin is the amount each unit of sale adds to the profit and can be used to simplify a break-even analysis.
In many food companies, some products are manufactured and sold because of their contribution to “eating up overhead costs” and this ensuring the profitability of other, more strategic lines of business. That is why some companies view private label business as a way “eating overhead” and contributing to the overall profitability of the business.
Contribution margin is different from Gross Margin in that a contribution calculation seeks to separate out variable costs (such as Cost of Goods Sold, Sales Commissions and Delivery Charges) from fixed costs (Depreciation, Insurance, Payroll taxes, Rent, Utilities, Wages) not included in the contribution calculation, on the basis of economic analysis of the expense; whereas gross margin is determined using accounting standards.
Contribution margin is sales dollars minus variable costs and variable expenses. If a product sells for $10 and its variable costs and variable expenses are $6, the contribution margin is $4 per unit.
Contribution Margin
Break- Even Point
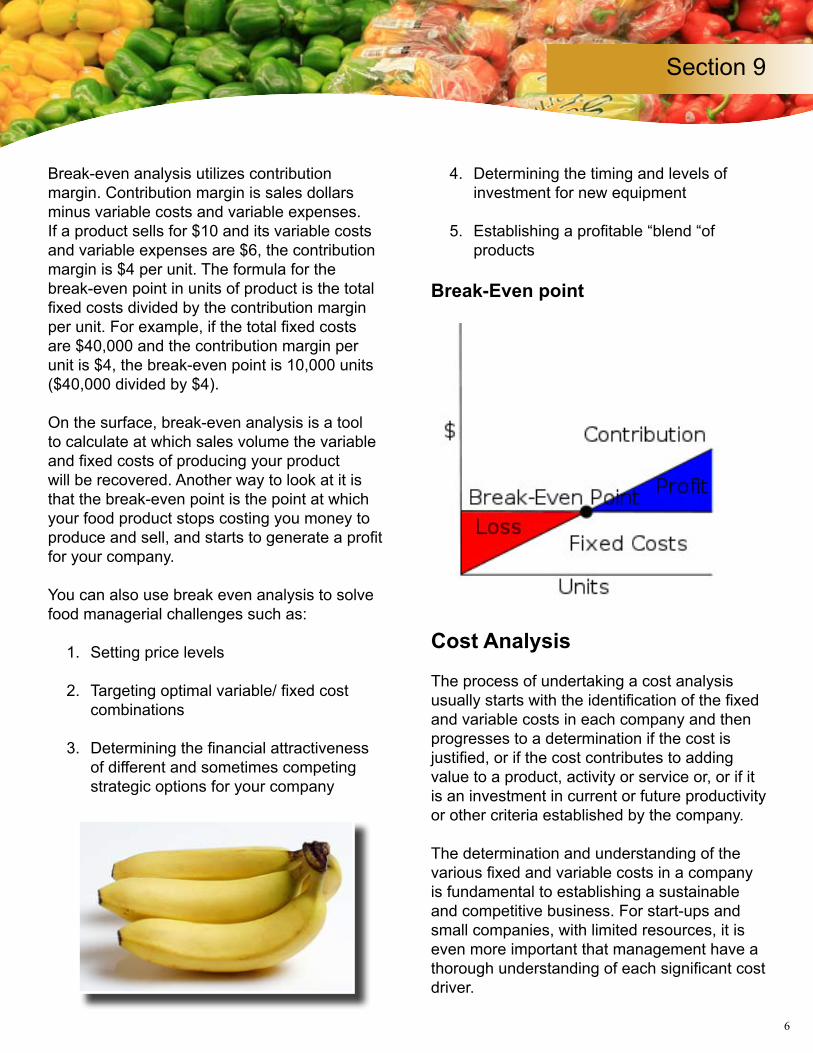
The break-even point (BEP) is the point at which cost or expenses and revenue are equal: there is no net loss or gain, and one has “broken even”. The break-even point for a product is the point where total revenue received equals the total costs associated with the sale of the product (TR=TC).
The break-even point is one of the simplest yet least used analytical tools in food management. It helps to provide a dynamic view of the relationships between sales, costs and profits. A better understanding of break-even—for example, expressing break-even sales as a percentage of actual sales—can give food company managers a chance to understand when to expect to break even by linking the percent to when in the week/month this percent of sales might occur.
Section 9
6
Section 1
Break-even analysis utilizes contribution margin. Contribution margin is sales dollars minus variable costs and variable expenses. If a product sells for $10 and its variable costs and variable expenses are $6, the contribution margin is $4 per unit. The formula for the break-even point in units of product is the total fixed costs divided by the contribution margin per unit. For example, if the total fixed costs are $40,000 and the contribution margin per unit is $4, the break-even point is 10,000 units ($40,000 divided by $4).
On the surface, break-even analysis is a tool to calculate at which sales volume the variable and fixed costs of producing your product will be recovered. Another way to look at it is that the break-even point is the point at which your food product stops costing you money to produce and sell, and starts to generate a profit for your company.
You can also use break even analysis to solve food managerial challenges such as:
1. Setting price levels
2. Targeting optimal variable/ fixed cost combinations
3. Determining the financial attractiveness of different and sometimes competing strategic options for your company
4. Determining the timing and levels of investment for new equipment
5. Establishing a profitable “blend “of products
Break-Even point
Cost Analysis
The process of undertaking a cost analysis usually starts with the identification of the fixed and variable costs in each company and then progresses to a determination if the cost is justified, or if the cost contributes to adding value to a product, activity or service or, or if it is an investment in current or future productivity or other criteria established by the company.
The determination and understanding of the various fixed and variable costs in a company is fundamental to establishing a sustainable and competitive business. For start-ups and small companies, with limited resources, it is even more important that management have a thorough understanding of each significant cost driver.
Section 9
7
Section 1
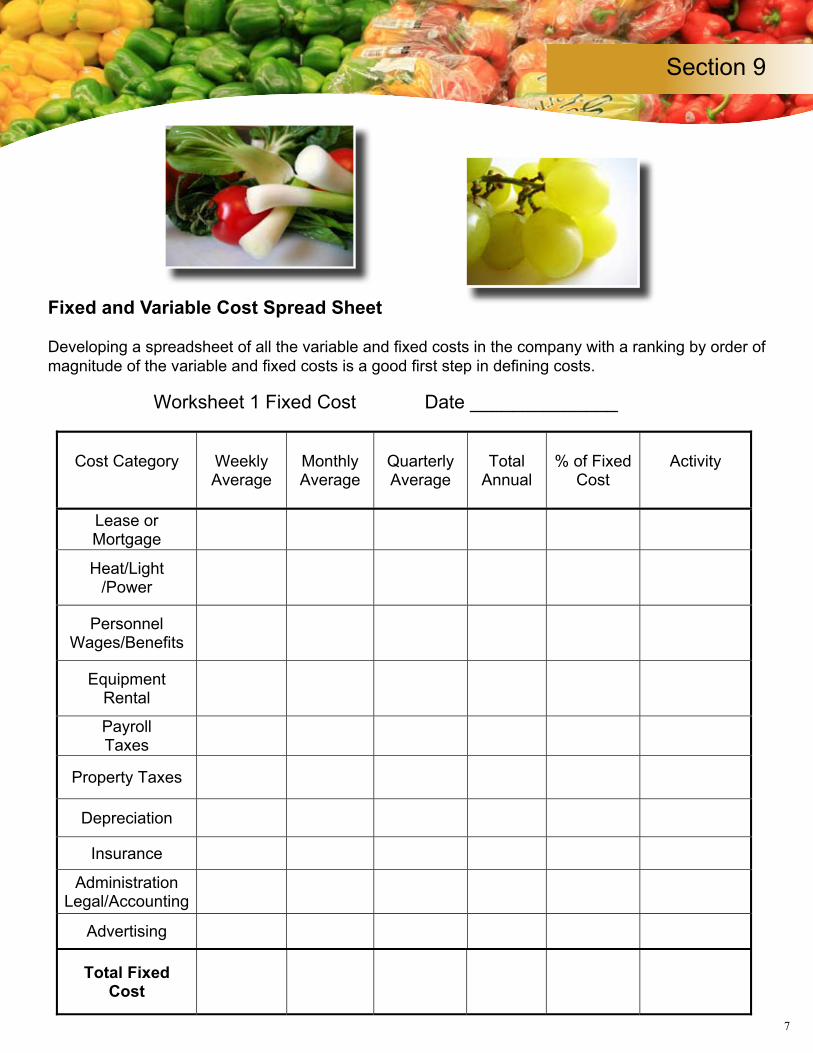
Fixed and Variable Cost Spread Sheet
Developing a spreadsheet of all the variable and fixed costs in the company with a ranking by order of magnitude of the variable and fixed costs is a good first step in defining costs.
Section 9
8
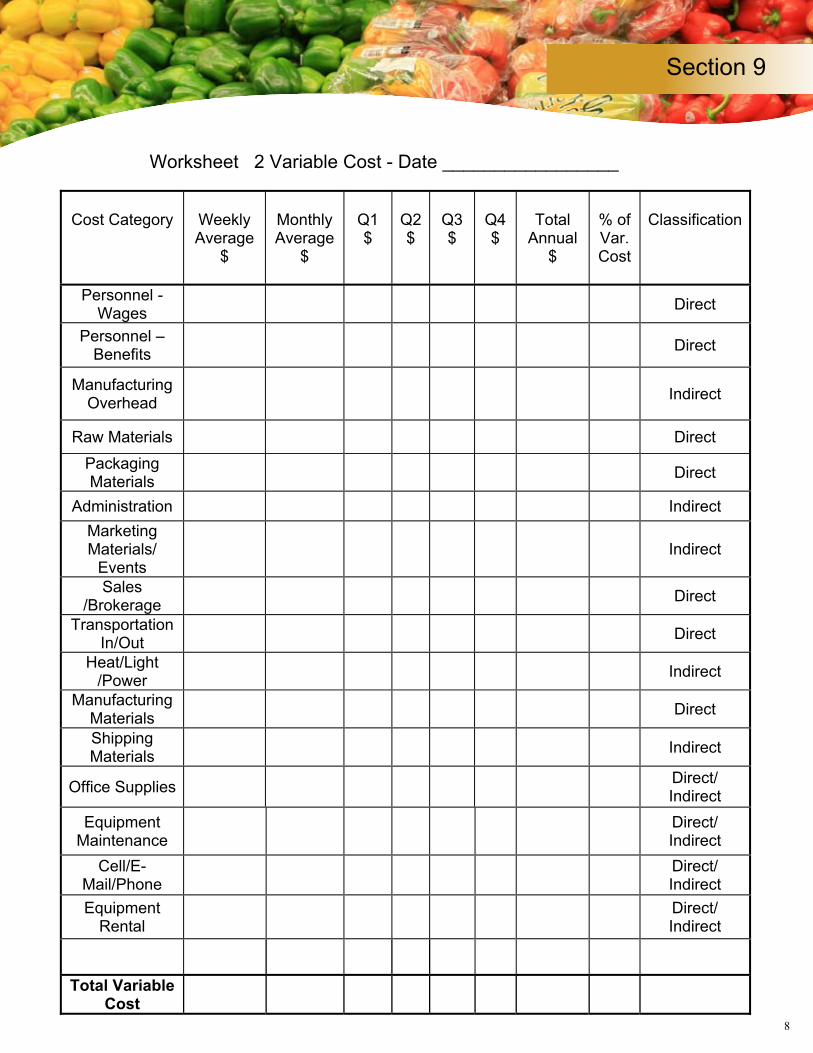
Fixed and Variable Cost Spread Sheet
Developing a spreadsheet of all the variable and fixed costs in the company with a ranking by order of magnitude of the variable and fixed costs is a good first step in defining costs.
Worksheet 1 Fixed Cost Date ______________
Cost Category WeeklyAverage
MonthlyAverage
QuarterlyAverage
TotalAnnual
% of Fixed Cost
Activity
Lease or Mortgage
Heat/Light/Power
PersonnelWages/Benefits
EquipmentRental
PayrollTaxes
Property Taxes
Depreciation
Insurance
AdministrationLegal/Accounting
Advertising
Total Fixed Cost
8
Section 1Section 9
9
Worksheet 2 Variable Cost - Date _________________
Cost Category WeeklyAverage
$
MonthlyAverage
$
Q1$
Q2$
Q3$
Q4$
TotalAnnual
$
% of Var.Cost
Classification
Personnel - Wages Direct
Personnel – Benefits Direct
ManufacturingOverhead Indirect
Raw Materials DirectPackagingMaterials Direct
Administration IndirectMarketingMaterials/
Events Indirect
Sales/Brokerage Direct
TransportationIn/Out Direct
Heat/Light/Power Indirect
ManufacturingMaterials Direct
ShippingMaterials Indirect
Office Supplies Direct/Indirect
EquipmentMaintenance
Direct/Indirect
Cell/E-Mail/Phone
Direct/Indirect
EquipmentRental
Direct/Indirect
Total Variable Cost
9
Section 1Section 9
10
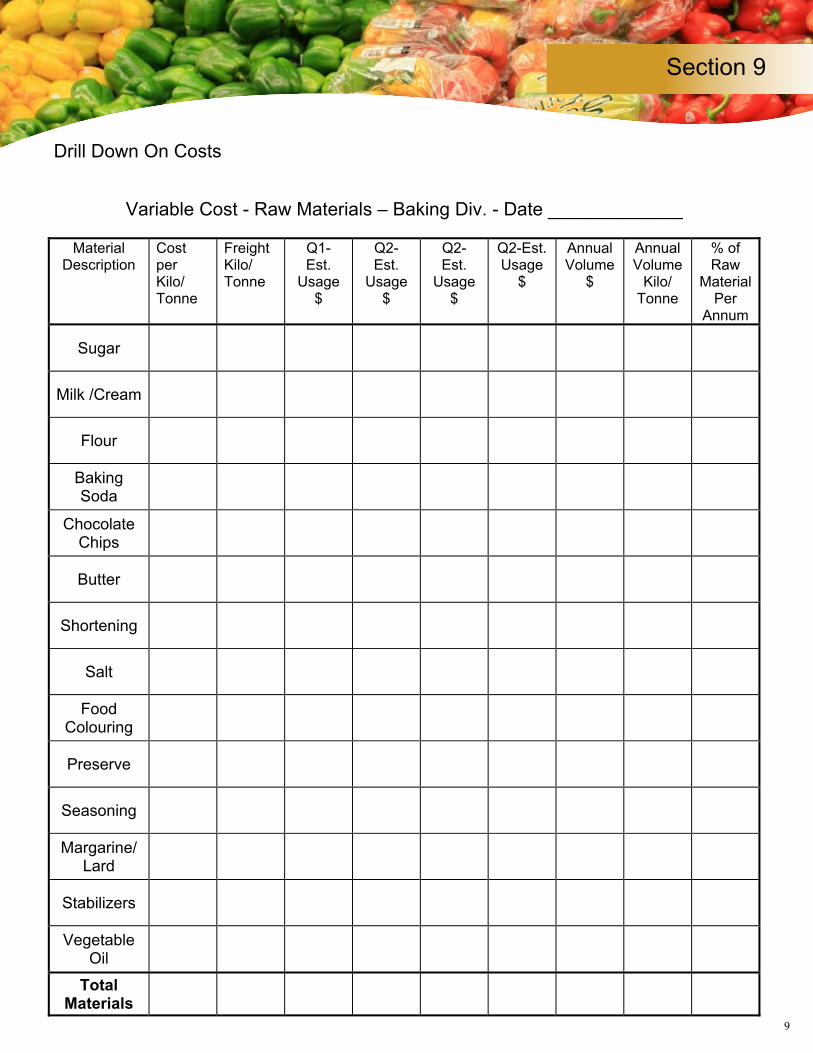
Drill Down On Costs
Variable Cost - Raw Materials – Baking Div. - Date _____________
MaterialDescription
CostperKilo/Tonne
FreightKilo/Tonne
Q1-Est.
Usage$
Q2-Est.
Usage$
Q2-Est.
Usage$
Q2-Est.Usage
$
AnnualVolume
$
AnnualVolume
Kilo/Tonne
% of Raw
MaterialPer
Annum
Sugar
Milk /Cream
Flour
BakingSoda
ChocolateChips
Butter
Shortening
Salt
FoodColouring
Preserve
Seasoning
Margarine/Lard
Stabilizers
VegetableOil
TotalMaterials
10
Section 1Section 9
11
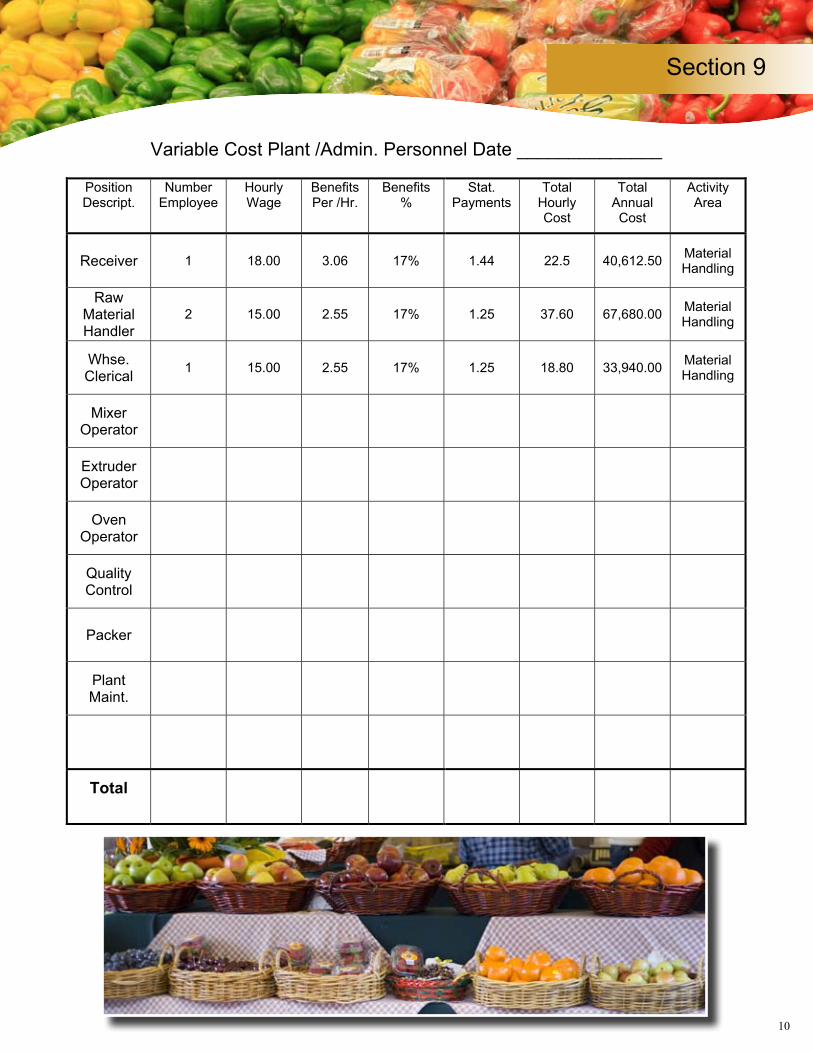
Variable Cost Plant /Admin. Personnel Date ______________
PositionDescript.
Number Employee
Hourly Wage
BenefitsPer /Hr.
Benefits%
Stat.Payments
TotalHourly Cost
TotalAnnualCost
Activity Area
Receiver 1 18.00 3.06 17% 1.44 22.5 40,612.50 MaterialHandling
RawMaterialHandler
2 15.00 2.55 17% 1.25 37.60 67,680.00 MaterialHandling
Whse.Clerical 1 15.00 2.55 17% 1.25 18.80 33,940.00 Material
Handling
MixerOperator
ExtruderOperator
OvenOperator
QualityControl
Packer
PlantMaint.
Total
11
Section 1
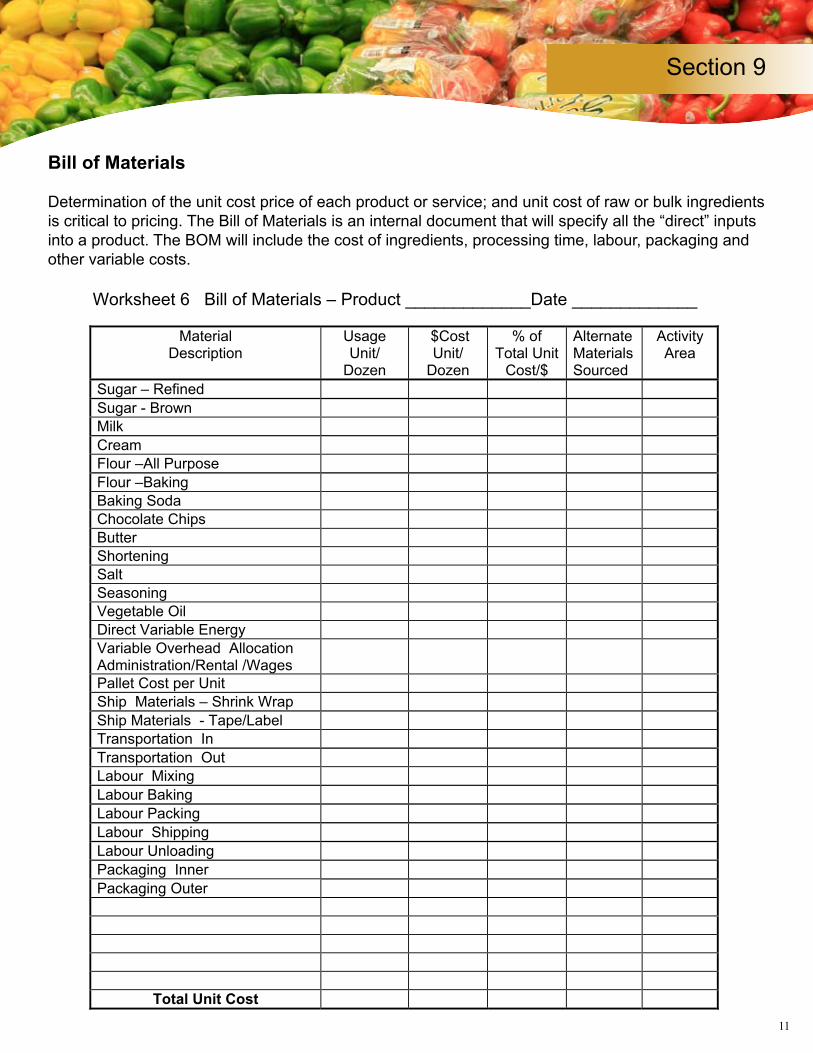
Bill of Materials
Determination of the unit cost price of each product or service; and unit cost of raw or bulk ingredients is critical to pricing. The Bill of Materials is an internal document that will specify all the “direct” inputs into a product. The BOM will include the cost of ingredients, processing time, labour, packaging and other variable costs.
Section 9
12
Bill of MaterialsDetermination of the unit cost price of each product or service; and unit cost of raw or bulk ingredients is critical to pricing. The Bill of Materials is an internal document that will specify all the “direct” inputs into a product. The BOM will include the cost of ingredients, processing time, labour, packaging and other variable costs.
Worksheet 6 Bill of Materials – Product _____________Date _____________
MaterialDescription
UsageUnit/
Dozen
$Cost Unit/
Dozen
% of Total Unit
Cost/$
AlternateMaterialsSourced
ActivityArea
Sugar – Refined
Sugar - Brown Milk
Cream Flour –All Purpose
Flour –Baking Baking Soda Chocolate Chips Butter Shortening Salt Seasoning Vegetable Oil Direct Variable Energy Variable Overhead AllocationAdministration/Rental /Wages
Pallet Cost per Unit Ship Materials – Shrink Wrap
Ship Materials - Tape/Label Transportation In
Transportation Out Labour Mixing
Labour Baking
Labour Packing
Labour Shipping
Labour Unloading
Packaging Inner
Packaging Outer
Total Unit Cost
12
Section 1
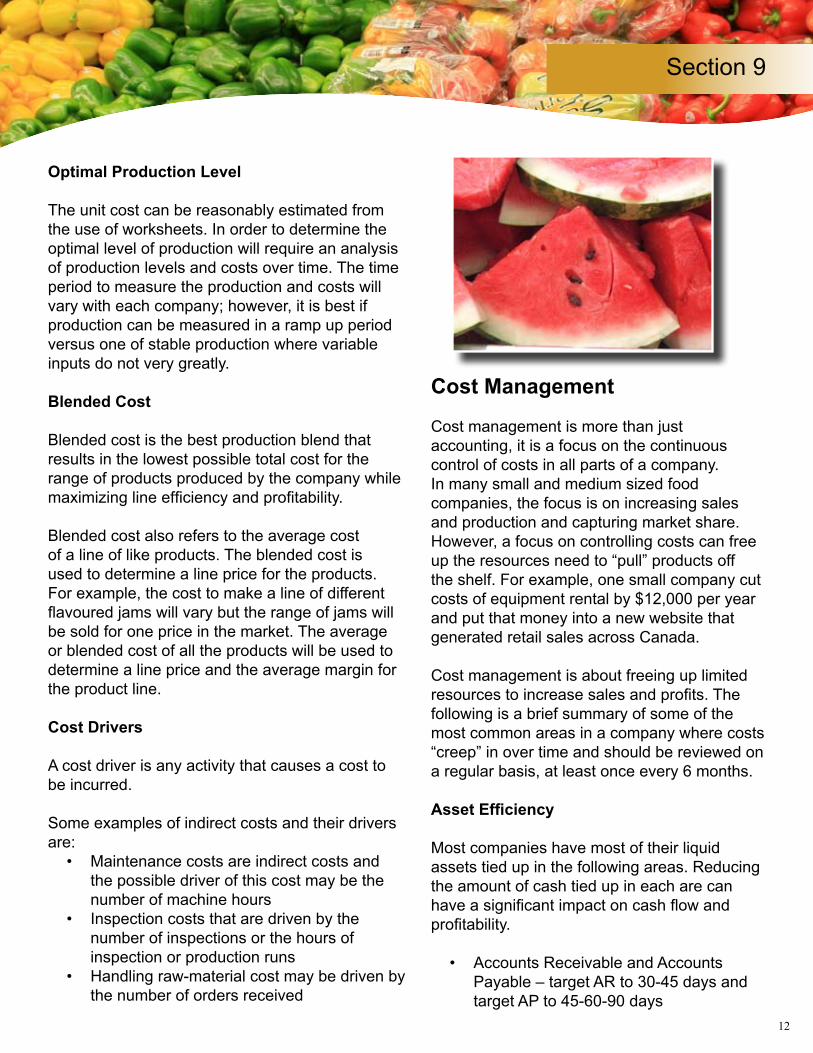
Optimal Production Level
The unit cost can be reasonably estimated from the use of worksheets. In order to determine the optimal level of production will require an analysis of production levels and costs over time. The time period to measure the production and costs will vary with each company; however, it is best if production can be measured in a ramp up period versus one of stable production where variable inputs do not very greatly.
Blended Cost
Blended cost is the best production blend that results in the lowest possible total cost for the range of products produced by the company while maximizing line efficiency and profitability.
Blended cost also refers to the average cost of a line of like products. The blended cost is used to determine a line price for the products. For example, the cost to make a line of different flavoured jams will vary but the range of jams will be sold for one price in the market. The average or blended cost of all the products will be used to determine a line price and the average margin for the product line.
Cost Drivers
A cost driver is any activity that causes a cost to be incurred.
Some examples of indirect costs and their drivers are:
• Maintenance costs are indirect costs and the possible driver of this cost may be the number of machine hours
• Inspection costs that are driven by the number of inspections or the hours of inspection or production runs
• Handling raw-material cost may be driven by the number of orders received
Cost Management
Cost management is more than just accounting, it is a focus on the continuous control of costs in all parts of a company. In many small and medium sized food companies, the focus is on increasing sales and production and capturing market share. However, a focus on controlling costs can free up the resources need to “pull” products off the shelf. For example, one small company cut costs of equipment rental by $12,000 per year and put that money into a new website that generated retail sales across Canada.
Cost management is about freeing up limited resources to increase sales and profits. The following is a brief summary of some of the most common areas in a company where costs “creep” in over time and should be reviewed on a regular basis, at least once every 6 months.
Asset Efficiency
Most companies have most of their liquid assets tied up in the following areas. Reducing the amount of cash tied up in each are can have a significant impact on cash flow and profitability.
• Accounts Receivable and Accounts Payable – target AR to 30-45 days and target AP to 45-60-90 days
Section 9
13
Section 1
• Finished Good Inventory – review levels against order fill rates. How long does the inventory sit in stock; target annual stock turns
• Raw Materials Inventory – what levels are required to meet production needs; is there a Just in Time program in place and what are the terms of sale
Transaction Costs
Companies often do not know what it costs to mail an envelop, service a customer by phone or issue an invoice. Transaction costs are notorious for creeping up over time. The first step is to determine what it costs to perform some of the following:
• Customer Service – review CS costs per customer, costs of order input and service. order size, service requirements. management time, system time.
• Invoicing – can cost $21.00 to issuance an invoice
• Accounts Payable – can cost $20-$60 to pay an invoice
• Purchasing – issuance of purchase orders, reconciliation of orders, tracking and monitoring of orders
Portfolio Management
Not all products deliver the same margin or net profits to a company. Some products are highly profitable while others have a strategic need to “fill out the assortment”. Consider implementing the following on a monthly basis. It may take a company a period of time to develop the systems or procedures to obtain the information but the time is well spent and the return on investment will be considerable.
• Review the cost, margins, volume and profitability of each product or service
• Rank each product or service according to margin, profitability and opportunity
• Consider the position of each product or service in relation to the “total” product or service offering
• Eliminate redundant, non-profitable or non-strategic products or services
Strategic and Counter Sourcing
Many companies get caught in the sourcing trap. Suppliers become comfortable to work with and relationships are developed. Many companies do not have back up sourcing plans if the primary source for a material goes out of business or is purchased by a competitor. Consider implementing the following, as a means of reducing risk and keeping the costs in line with the market.
• Alternate sourcing on all primary inputs for products or services
• Implement 3 sourcing model – Primary, backup and alternate sourcing for all primary inputs
• Consider longer run sourcing contracts on strategic inputs
• Develop new sourcing model for all inputs with the objective or review or finding one new primary source per annum
Section 9
14
Section 1Section 9
Outsourcing
Every food company has their own core competency or they would not be in business. However, that does not mean that their competency extends to every aspect of running a business. Consider outsourcing to control costs by allowing accessing other company’s competency.
• Review current operations and procedures with the view to outsourcing non-core competence functions
• Outsourcing can usually be readily implemented in Accounting, Payroll, Sales, Human Resources, IT and Computer Services, Maintenance (non-equipment), Office Equipment, Formulations, Package Design, Marketing Materials, Advertising and Personnel (Contract)
Review and Eliminate Unprofitable ProductsIn many food companies the adage is “more is better”. Product line creep is a common problem and many companies continue to make products well beyond their natural market life cycle or strategic need. Remember Pareto’s principle: 20% of the products drive 80% of the profits.
• Review the processes involved in multiple product lines
• Outsource, when necessary, cost engineering reviews of the product lines
• Eliminate products or product lines that do not meet established financial or strategic criteria
Vendor Program Review
Many food companies rarely, usually due to a lack of time, review vendor programs with a view to reducing costs. Reducing costs does not necessarily mean reducing prices. It means working with vendors to eliminate unnecessary costs. The costs could be in the way the inputs are delivered, packaged. Costs can often be reduced by asking a few questions. Often the response is “We did not think that was important to you.”
• Review primary vendor programs for input costs, terms of sale, volume reductions, standardization of products, freight costs, marketing allowances, defect product return policies, stocking programs
• Review primary and secondary vendors once per annum, backup vendors once per 18 months or as needed
Cost Reductions – Where to Start?
The most difficult part of any cost control process is getting started. Once the cost
information has been obtained, categorized and sorted, the next phase is looking at areas of saving. A quarterly review of the primary cost areas and an ongoing focus on cost improvement through staff programs, vendor programs and other programs will assist in
15
Section 1Section 9
developing a cost reduction or cost control culture in the company.
The development of a company culture that encourages the development of cost control processes and procedures and constant improvement will not be successful without a champion at the outset. Management buy- in is critical to the development of any cost reduction or cost control program.
Each company will adopt its own cost reduction review methodology however consideration should be given to the various phases of the process.
Develop a Plan
A team should be set up to establish the ongoing objectives of the Cost Reduction Program. It is important to indicate to all employees that not only is their input critical to the process, but that the benefits of the program will be shared in some manner with the employees. The plan can include:
1. Continuous Improvement Suggestions- which must be responded to immediately
2. Bonuses for suggestions that are implemented
3. Sharing of information on costs and process – trust is key to the success of the program
4. The development of champions and leaders in the company
5. Realistic and achievable targets6. Establishing a culture
Organization and Communication
The team should assign responsibilities and accountability, set goals (such as a cost review of one area per quarter or per month.) Assign responsibility for review and responding to suggestions for cost improvement. Set up monthly staff meeting to keep everyone up to speed.
Use the Cost Information
Use current information and drill down deeper for additional costs. The pursuit and understanding of additional cost information is the key to the process.
Review all assumptions on costs, at the outset focus on the top 3 or 4 costs in each area. Focus on the larger cost areas at first then drill down to the second and third levels.
Validate all the cost assumptions. Do not assume that “the cost is the cost”.
Talk to employees – Share the Savings
Talk to the employees because the employees usually know a particular function better than anyone else in the company. The first line of improvement will always come from employees – when encouraged and supported. Sharing the savings and acknowledgement, will encourage the development of a cost conscious culture.
16
Section 1Section 9
Talk to Vendors – Share the Savings
Reducing cost does not mean demanding a lower price at the expense of the vendor. In a value system, it means working with each member of a value system to mutually improve profits and margins. Discussion should be ongoing on processes, impediments to cost reductions, working with the vendor’s value chain to reduce costs, improving linkages between the companies, and sharing information. Trust is the critical factor in working with vendors to improve the costs of all inputs.
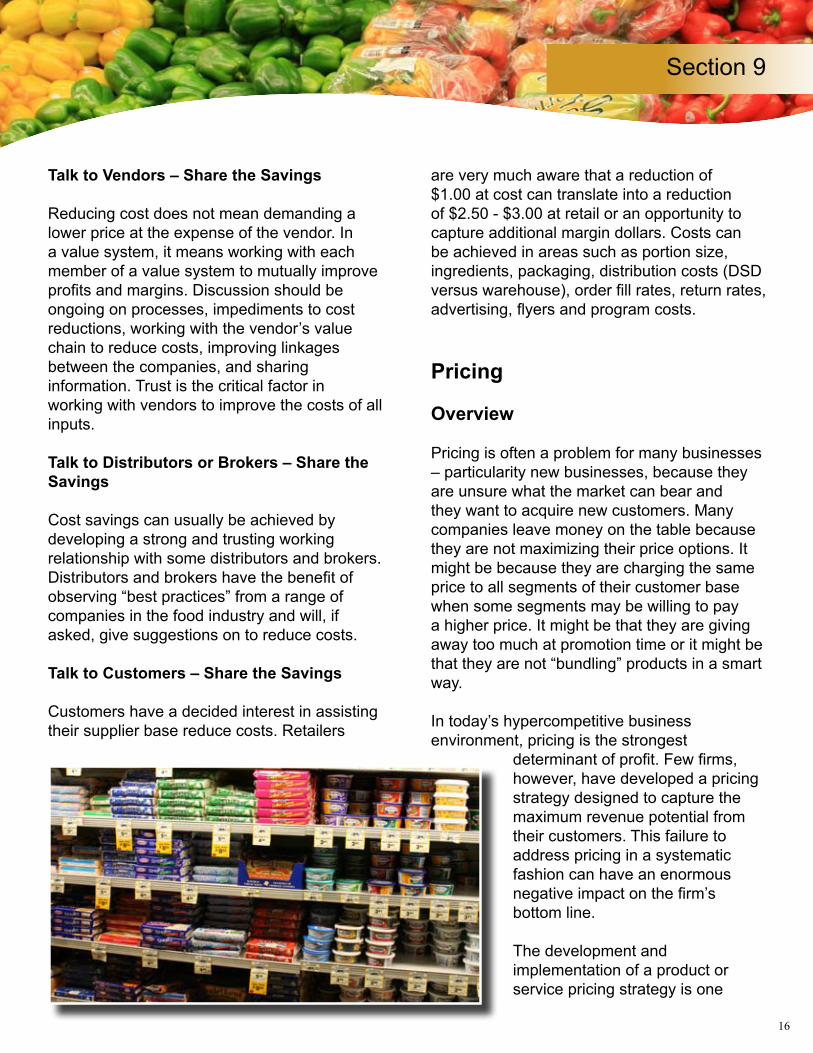
Talk to Distributors or Brokers – Share the Savings
Cost savings can usually be achieved by developing a strong and trusting working relationship with some distributors and brokers. Distributors and brokers have the benefit of observing “best practices” from a range of companies in the food industry and will, if asked, give suggestions on to reduce costs.
Talk to Customers – Share the Savings
Customers have a decided interest in assisting their supplier base reduce costs. Retailers
are very much aware that a reduction of $1.00 at cost can translate into a reduction of $2.50 - $3.00 at retail or an opportunity to capture additional margin dollars. Costs can be achieved in areas such as portion size, ingredients, packaging, distribution costs (DSD versus warehouse), order fill rates, return rates, advertising, flyers and program costs.
Pricing
Overview
Pricing is often a problem for many businesses – particularity new businesses, because they are unsure what the market can bear and they want to acquire new customers. Many companies leave money on the table because they are not maximizing their price options. It might be because they are charging the same price to all segments of their customer base when some segments may be willing to pay a higher price. It might be that they are giving away too much at promotion time or it might be that they are not “bundling” products in a smart way.
In today’s hypercompetitive business environment, pricing is the strongest
determinant of profit. Few firms, however, have developed a pricing strategy designed to capture the maximum revenue potential from their customers. This failure to address pricing in a systematic fashion can have an enormous negative impact on the firm’s bottom line.
The development and implementation of a product or service pricing strategy is one
17
Section 1Section 9
of the most important actions a company can make. The focus of this section is to examine product or service pricing from a number of perspectives and to present the participants with various options in determining and setting prices for the various channels of distribution.
The market will ultimately determine the product price of any good or service. This section will focus on how to determine the market price for a new, existing, replacement or brand extension product.
Pricing Strategies and the Marketing Mix
Pricing strategies are a sometimes overlooked part of the marketing mix. Pricing normally has a significant impact on profit and so should be given the same consideration as promotion and advertising strategies. A higher or lower price can dramatically change both gross margins and sales volume. This can indirectly affects other costs by reducing storage costs, or creating opportunities for volume discounts with suppliers. Pricing is a key strategic tool for gaining share, differentiation, and maintaining profitability.
Pricing effects other marketing mix elements such as product features, channel of distribution (place) decisions and promotion planning and budgeting. The value equation in a purchase is related to price but also about
to the emotional and benefits and attributes that are resident in a product.
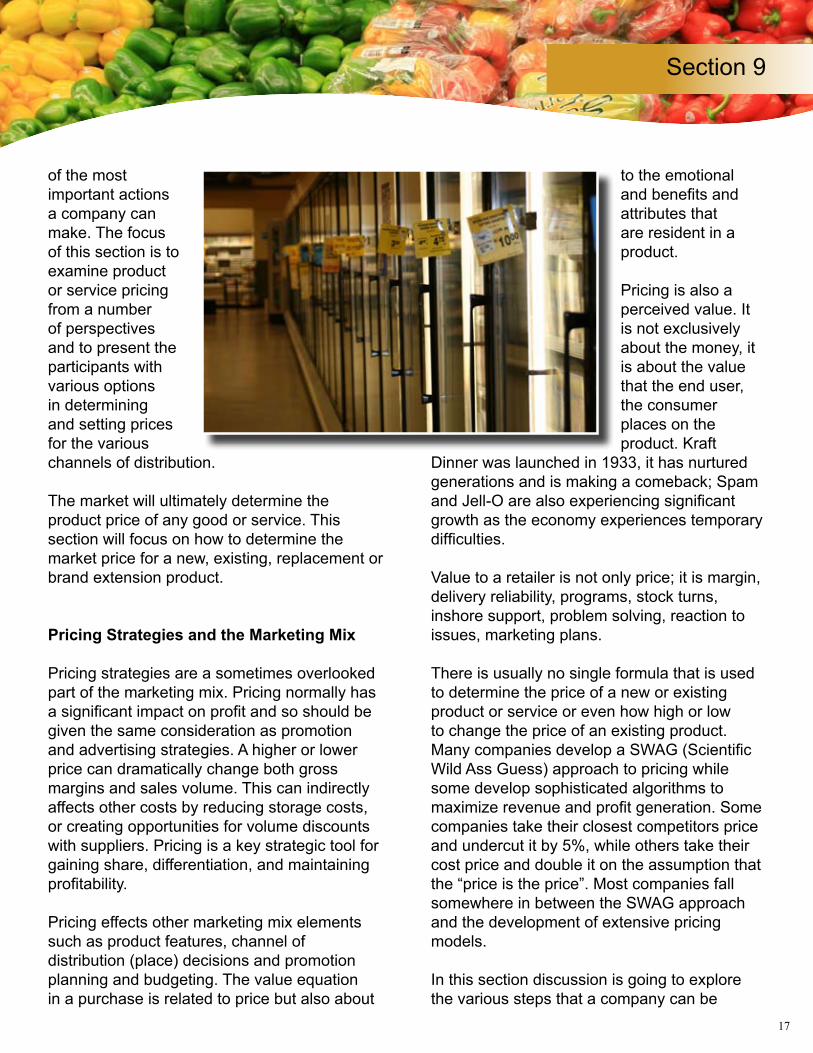
Pricing is also a perceived value. It is not exclusively about the money, it is about the value that the end user, the consumer places on the product. Kraft
Dinner was launched in 1933, it has nurtured generations and is making a comeback; Spam and Jell-O are also experiencing significant growth as the economy experiences temporary difficulties.
Value to a retailer is not only price; it is margin, delivery reliability, programs, stock turns, inshore support, problem solving, reaction to issues, marketing plans.
There is usually no single formula that is used to determine the price of a new or existing product or service or even how high or low to change the price of an existing product. Many companies develop a SWAG (Scientific Wild Ass Guess) approach to pricing while some develop sophisticated algorithms to maximize revenue and profit generation. Some companies take their closest competitors price and undercut it by 5%, while others take their cost price and double it on the assumption that the “price is the price”. Most companies fall somewhere in between the SWAG approach and the development of extensive pricing models. In this section discussion is going to explore the various steps that a company can be
18
Section 1Section 9
undertaken by companies in order to determine the initial price of a product or service. These steps are as follows:
1. Cost Determination – include fixed and variable costs
2. Marketing Strategy – market analysis, competitive pricing analysis, segmentation, targeting and positioning
3. Pricing Strategy – Market Penetration, skimming, margin capture or other primary and secondary strategies
4. Wholesale and Retail Program Fees and Costs
5. Competitive Pricing and Distribution Analysis
6. Forecast Demand – estimate the possible impact of price on demand and determine the overall market demand for direct competitors and the demand for substitutable products in units and dollars
7. Marketing Mix – Product, distribution and promotional strategies and tactics
8. Setting the Price– based on the above, determine list, and wholesale pricing options based on target retail prices
Cost Determination
Pricing without elementary cost data is usually done at a company’s peril.
Marketing Strategy
Marketing strategy was covered in previous sections however a review of
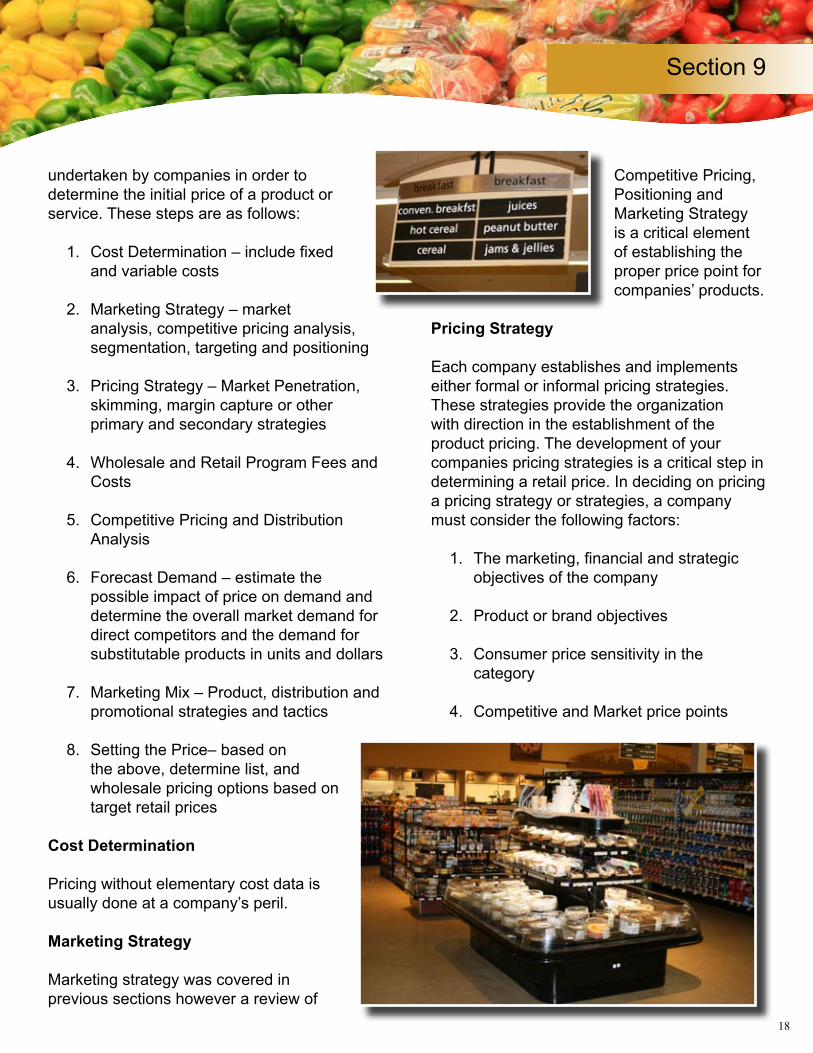
Competitive Pricing, Positioning and Marketing Strategy is a critical element of establishing the proper price point for companies’ products.
Pricing Strategy
Each company establishes and implements either formal or informal pricing strategies. These strategies provide the organization with direction in the establishment of the product pricing. The development of your companies pricing strategies is a critical step in determining a retail price. In deciding on pricing a pricing strategy or strategies, a company must consider the following factors:
1. The marketing, financial and strategic objectives of the company
2. Product or brand objectives
3. Consumer price sensitivity in the category
4. Competitive and Market price points
19
Section 1Section 9
5. Company resource available to support a marketing and pricing strategy
Pricing Strategies can fall into two categories; Primary Strategies and Secondary Strategies.
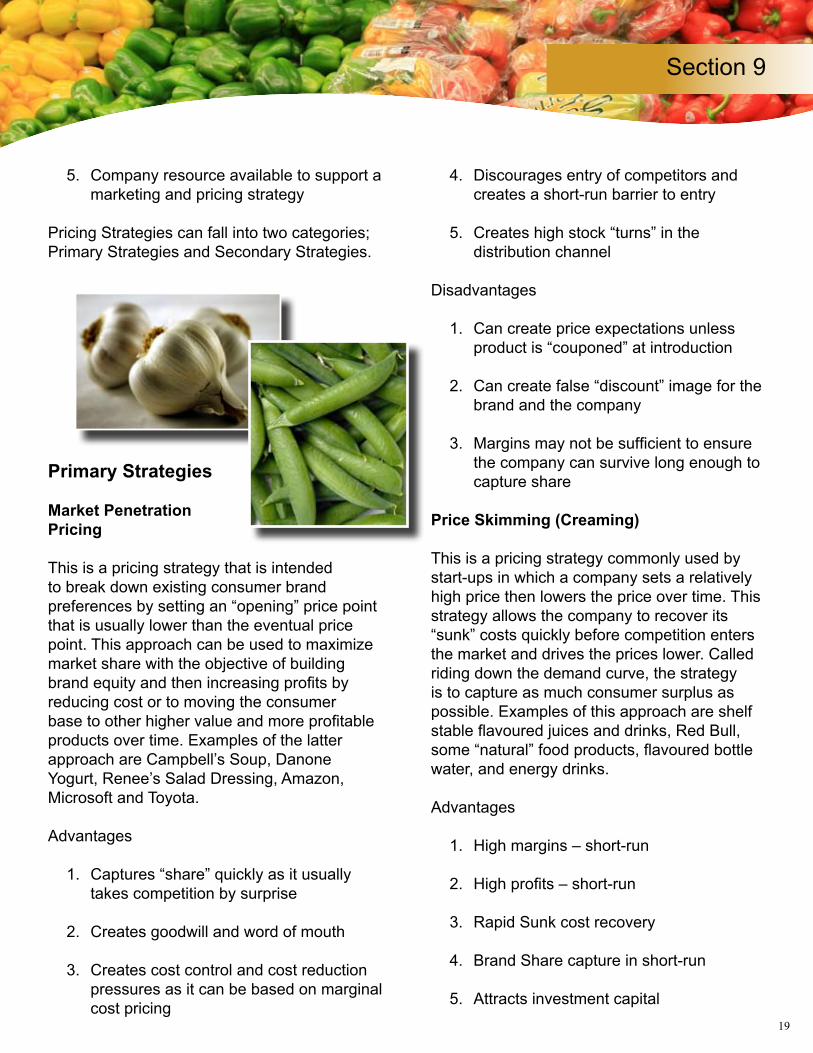
Primary Strategies
Market Penetration Pricing
This is a pricing strategy that is intended to break down existing consumer brand preferences by setting an “opening” price point that is usually lower than the eventual price point. This approach can be used to maximize market share with the objective of building brand equity and then increasing profits by reducing cost or to moving the consumer base to other higher value and more profitable products over time. Examples of the latter approach are Campbell’s Soup, Danone Yogurt, Renee’s Salad Dressing, Amazon, Microsoft and Toyota.
Advantages
1. Captures “share” quickly as it usually takes competition by surprise
2. Creates goodwill and word of mouth
3. Creates cost control and cost reduction pressures as it can be based on marginal cost pricing
4. Discourages entry of competitors and creates a short-run barrier to entry
5. Creates high stock “turns” in the distribution channel
Disadvantages
1. Can create price expectations unless product is “couponed” at introduction
2. Can create false “discount” image for the brand and the company
3. Margins may not be sufficient to ensure the company can survive long enough to capture share
Price Skimming (Creaming)
This is a pricing strategy commonly used by start-ups in which a company sets a relatively high price then lowers the price over time. This strategy allows the company to recover its “sunk” costs quickly before competition enters the market and drives the prices lower. Called riding down the demand curve, the strategy is to capture as much consumer surplus as possible. Examples of this approach are shelf stable flavoured juices and drinks, Red Bull, some “natural” food products, flavoured bottle water, and energy drinks.
Advantages
1. High margins – short-run
2. High profits – short-run
3. Rapid Sunk cost recovery
4. Brand Share capture in short-run
5. Attracts investment capital
20
Section 1Section 9
Disadvantages
1. Effective only when facing an inelastic demand curve – volume is not related to price, when prices rise there is no change in demand
2. Price changes by one producer will be matched by another
3. Market dominance will usually be obtained by a low cost producer that that pursues a penetration strategy
4. Inventory turns are usually low thus the need to ensure retailers have high margins
5. Encourages new competitors
6. Results in slow market growth and slow capture of new users which allows competitors time to move into the market
7. Negative perception of brand and
product if prices lowered to quickly
8. Could lead to inefficiency as there is no incentive to control costs
Market Stability
This pricing strategy is used to ensure the stability of prices in a market and to forestall or control a price war
by competing on non-price considerations such as new products, improved products, taste, packaging, nutrition, portion size and positioning. Companies will usually “follow the industry” and will rarely engage in aggressive
pricing to capture long-run share. Examples of this strategy are evident in the bakery, confection, cookie, dairy, and ready-to-eat industries.
Advantages
1. Stable margins and revenue
2. Predictable share in each category of product
3. Non-price competition and few price wars
Disadvantages
1. Vulnerable to new entrants, imports and house brands
2. Vulnerable to change consumer preferences
3. Margin erosion due to changes in input costs
4. Margin capture is limited in the short-run
Margin Capture
This strategy is used for specialty products where it is anticipated that the sales volumes will be low or intermittent or seasonal or unpredictable. Pricing will not ride down the demand curve, but is kept at a set rate. Examples will be products such as local
21
Section 1Section 9
specialty ethnic sauces, regional sausages or prepared foods, exotic specialty ice-cream.
Advantages
1. Create perception of quality and specialty by price point
2. Margins permit limited growth and expansion
3. Margins provide a safety net for limited sales in slow periods
4. Brand value can be high due to margins and
Disadvantages
1. Few economies of scale
2. Limited market penetration
3. Difficult to grow market
4. Vulnerable to lower cost competition
Differentiation
This pricing strategy is a common strategy used to create market awareness and establish a position in the market. It can vary from being the low-cost leader to the high price leader. Based on the value equation either strategy can prove effective. Loblaw’s house brand products clearly differentiate by price point. “No Name” products are opening price point, PC products are mid-range, Blue Menu are upper mid range and Presidents Choice occupy price points equal to or above national brands. In other examples, organic dairy products have redefined dairy price points
and imported bottled water has created a clear differentiation between domestic and imported water. Advantages
1. Can create and open up market space between a brand and a competitor
2. Strategy can apply at any point on the price point continuum however it is most effective at either end of the price point range
3. Can create barriers to entry
Disadvantages
1. Low cost price differentiation could have a negative impact on the value of the brand
2. Can create price expectations with both consumers and retailers that are difficult to change
3. By itself is not an effective long term strategy as there is always another
22
Section 1Section 9
lower cost competitor or higher priced competitor with a stronger value equation
4. Can encourage new entrants into the market
Secondary Objectives
Standard or Uniform List Price
Same price list is used for all customers. Some companies have a range of price lists, often called “dial a deal” that usually creates business and legal problems.
F.O.B. (Plant/Ex Factory/Warehouse /Store)
Free on Board. Ownership is transferred as soon as the product leaves the designated point.
Zone Pricing
Retail strategy to set local prices to match competition. A Standard Price list keeps company’s “honest” and prevents recriminations in the trade.
Bundle Pricing
Practice of bundling a group of like products together to create a market bundle for discounts and other purposes.
Line Pricing
The practice of charging one price for family products; soups, yogurt, dairy products are line priced. Usually the price chosen is designed to balance margins.
Competitor or Follow the Leader Pricing
Involves using the price of competitor’s products to determine price. Usually practiced by small or fringe companies in an industry with 2 or 3 dominant players. Price cannot be used in the marketing mix and is essentially controlled by competition.
Survival Pricing
Products are sold at cost in order to generate cash flow. Not a practice for sustainability but sometimes very useful to generate immediate cash.
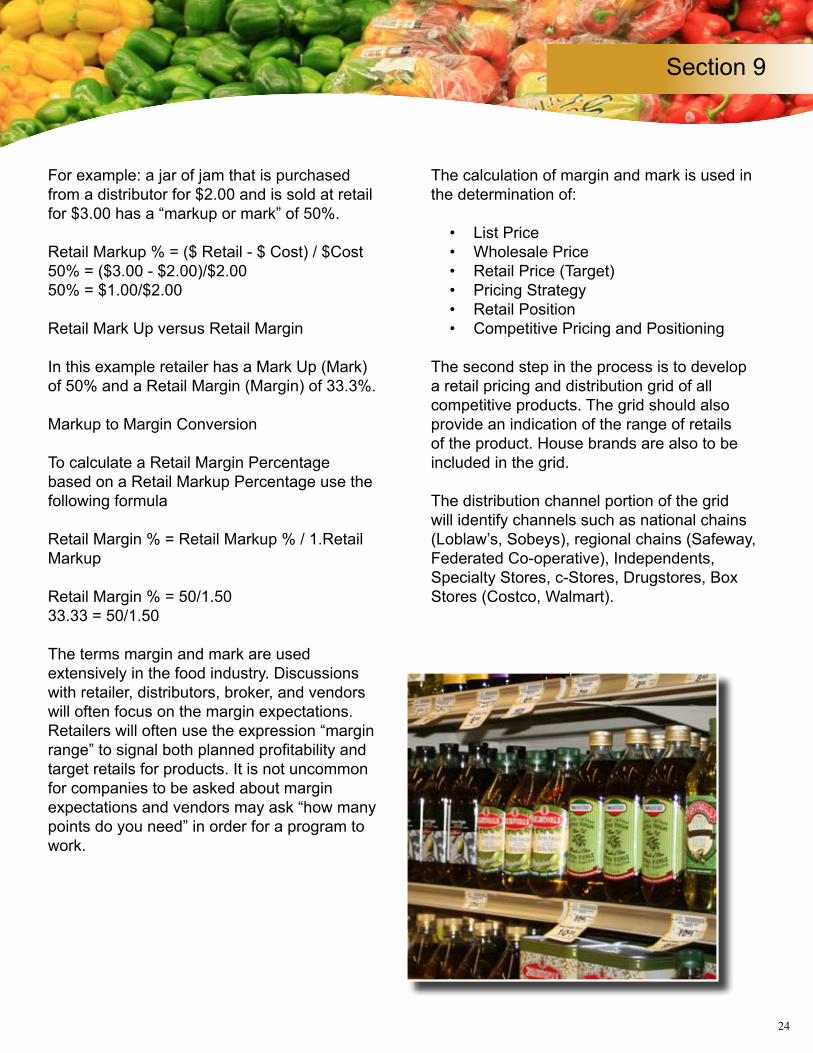
Competitive Pricing /Distribution Analysis
Unfortunately, most competitors will not readily provide you with their pricing strategy and wholesale price list, cost information or their volume pricing and discount programs. However, there is a process that can provide you with an “aisle” estimate of a competitors pricing to a retailers.
The first step in the process is to learn the difference between
23
Section 1Section 9
margin and markup in a retail environment. At the outset, it is useful to remember that retailers and manufactures take “margin dollars” to the bank, not “markup percentages”.
Retail Margin
Retail margin is the amount of gross profit made when a product is sold. Retailers will often use the expression “how many points” can they make on a particular product. In retail there are two criteria that supersede all others, margins and turns.
The determination of margin is quite straightforward. For example, a jar of Saskatoon Berry jam that is purchased from a distributor for $2.00 and is sold at retail for
$3.00 has a “margin of 33.3% based on the following formula.
Margin % = ($ Retail - $ Cost) / $ Retail
To Calculate a Retail Price at a Specific Retail Margin
Cost Price / (100-Planned margin)
$2.00 / (1.00-.333)$2.00/ (.667) = $3.00 ($2.9985)
Retail Price at 33% margin = $3.00/$2.99.
To Calculate the Wholesale Price that a Distributor is charging a Retailer, and assuming a Retail Margin of 33.3%, use the following formula.
$3.00 X (1.00-.333)$3.00 X.667 = $2.00Wholesale Price to the Retailer = $2.00
To Calculate the List Price that a Supplier is charging a Distributor and assuming a Distributor Margin of 25%use the following formula.
$2.00 X (1.00-.25)$2.00/.75 = $1.50 List Price =$1.50
To Calculate the Cost Price of a product that a Supplier is charging a Distributor and assuming a Margin of 25% use the following formula.
$1.50 X (1.00-.25)$1.50 X.75 = $1.125Cost Price = $1.125
Retail Markup
Retail Markup is the difference between the cost of a good or service and its selling price or a percentage added to the cost to get the selling price.
24
Section 1Section 9
For example: a jar of jam that is purchased from a distributor for $2.00 and is sold at retail for $3.00 has a “markup or mark” of 50%.
Retail Markup % = ($ Retail - $ Cost) / $Cost50% = ($3.00 - $2.00)/$2.0050% = $1.00/$2.00
Retail Mark Up versus Retail Margin
In this example retailer has a Mark Up (Mark) of 50% and a Retail Margin (Margin) of 33.3%.
Markup to Margin Conversion
To calculate a Retail Margin Percentage based on a Retail Markup Percentage use the following formula
Retail Margin % = Retail Markup % / 1.Retail Markup
Retail Margin % = 50/1.5033.33 = 50/1.50
The terms margin and mark are used extensively in the food industry. Discussions with retailer, distributors, broker, and vendors will often focus on the margin expectations. Retailers will often use the expression “margin range” to signal both planned profitability and target retails for products. It is not uncommon for companies to be asked about margin expectations and vendors may ask “how many points do you need” in order for a program to work.
The calculation of margin and mark is used in the determination of:
• List Price• Wholesale Price • Retail Price (Target)• Pricing Strategy• Retail Position • Competitive Pricing and Positioning
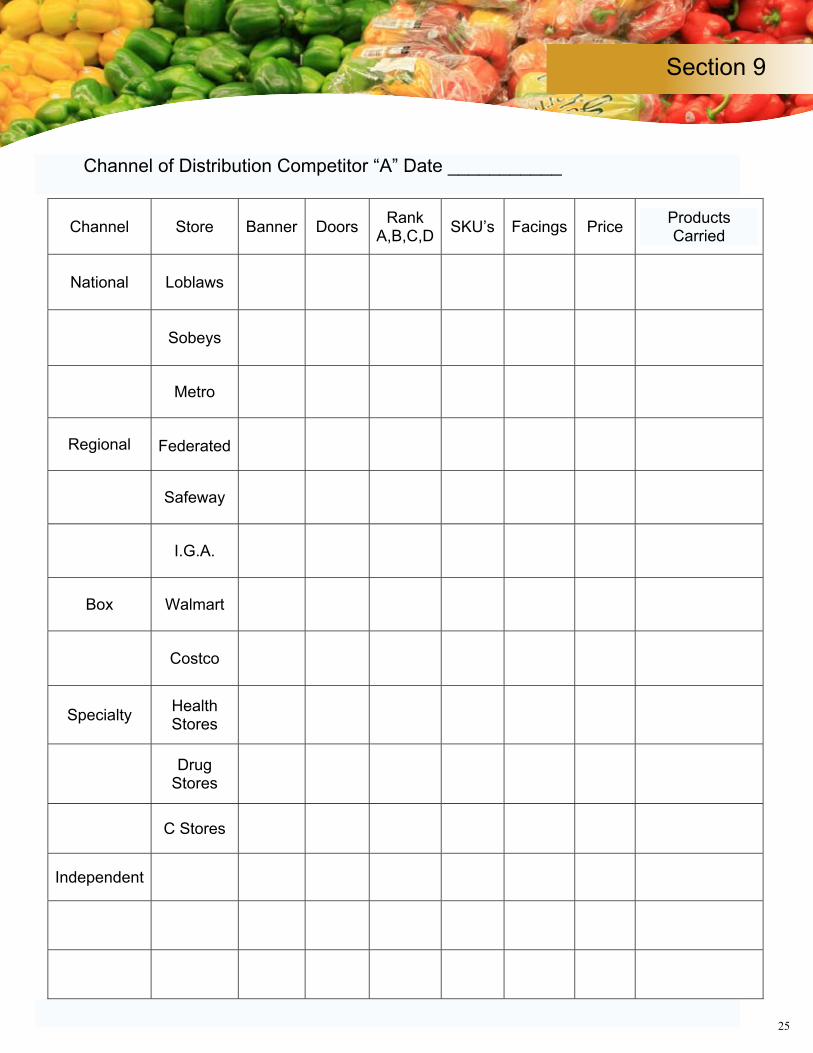
The second step in the process is to develop a retail pricing and distribution grid of all competitive products. The grid should also provide an indication of the range of retails of the product. House brands are also to be included in the grid.
The distribution channel portion of the grid will identify channels such as national chains (Loblaw’s, Sobeys), regional chains (Safeway, Federated Co-operative), Independents, Specialty Stores, c-Stores, Drugstores, Box Stores (Costco, Walmart).
25
Section 1Section 9
Channel of Distribution Competitor “A” Date ___________
Channel Store Banner Doors RankA,B,C,D SKU’s Facings Price Products
Carried
National Loblaws
Sobeys
Metro
Regional Federated
Safeway
I.G.A.
Box Walmart
Costco
Specialty HealthStores
DrugStores
C Stores
Independent
26
26
Section 1Section 9
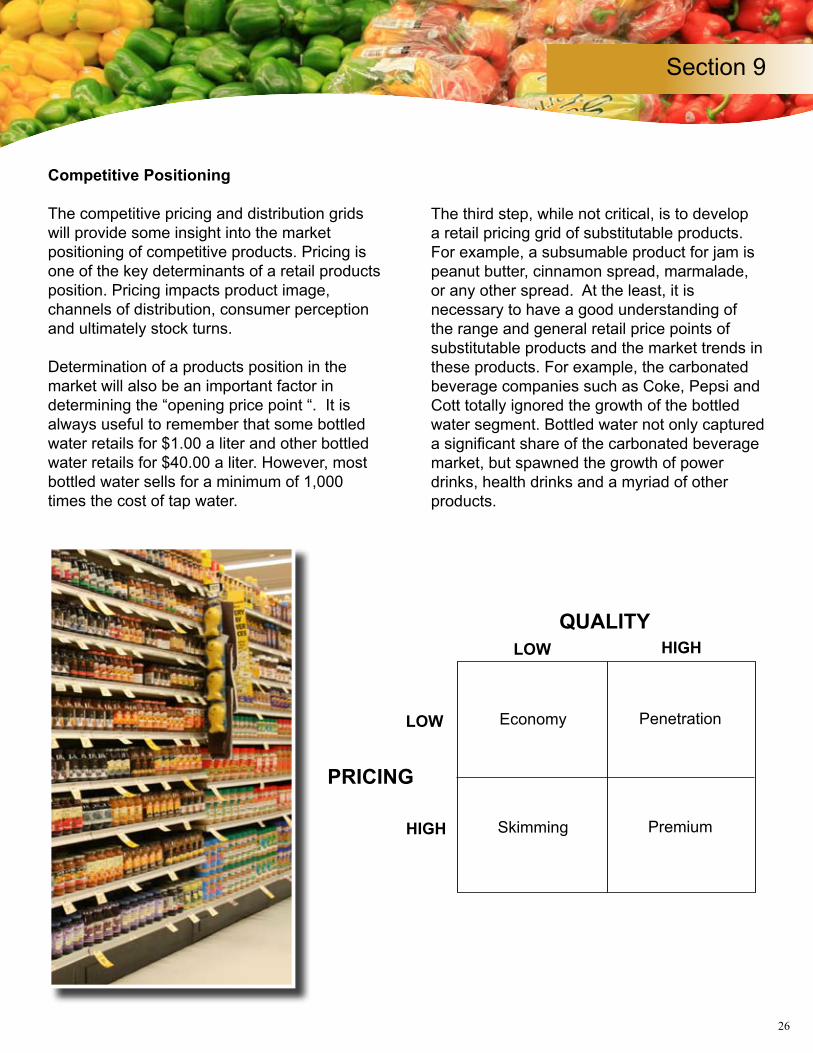
Competitive Positioning
The competitive pricing and distribution grids will provide some insight into the market positioning of competitive products. Pricing is one of the key determinants of a retail products position. Pricing impacts product image, channels of distribution, consumer perception and ultimately stock turns.
Determination of a products position in the market will also be an important factor in determining the “opening price point “. It is always useful to remember that some bottled water retails for $1.00 a liter and other bottled water retails for $40.00 a liter. However, most bottled water sells for a minimum of 1,000 times the cost of tap water.
The third step, while not critical, is to develop a retail pricing grid of substitutable products. For example, a subsumable product for jam is peanut butter, cinnamon spread, marmalade, or any other spread. At the least, it is necessary to have a good understanding of the range and general retail price points of substitutable products and the market trends in these products. For example, the carbonated beverage companies such as Coke, Pepsi and Cott totally ignored the growth of the bottled water segment. Bottled water not only captured a significant share of the carbonated beverage market, but spawned the growth of power drinks, health drinks and a myriad of other products.
QUALITYLOW HIGH
PRICING
LOW
HIGH
Economy Penetration
Skimming Premium
27
Section 1Section 9
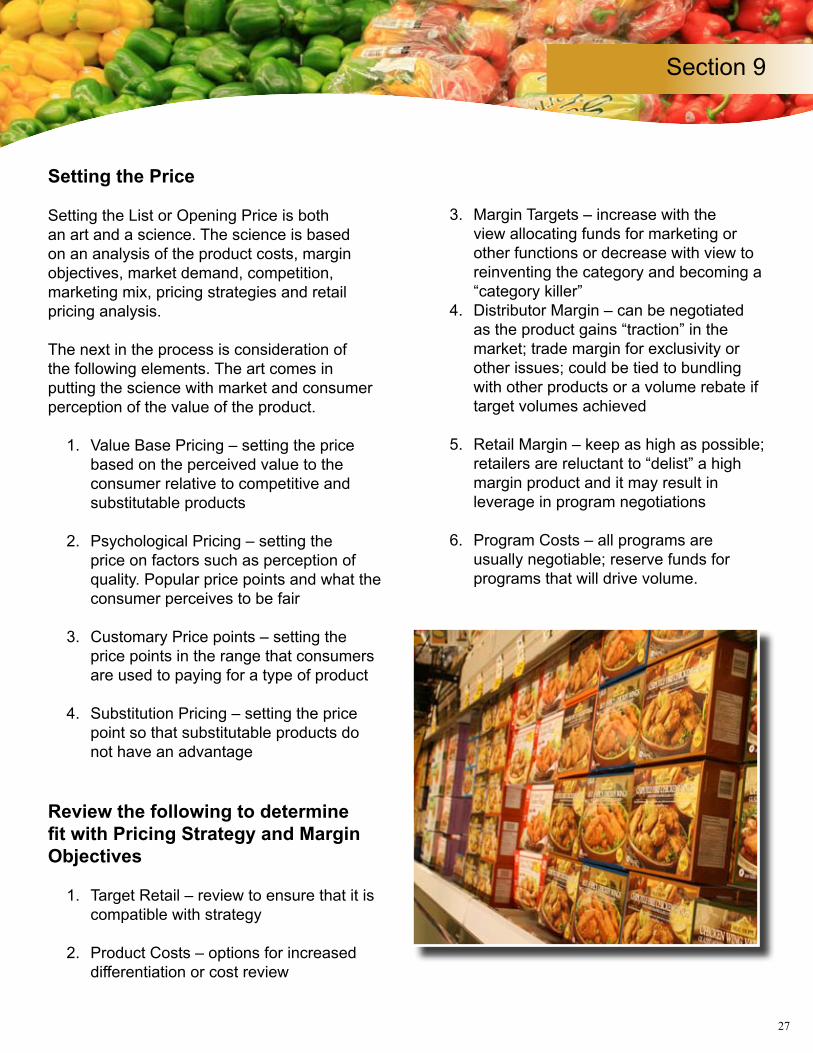
Setting the Price
Setting the List or Opening Price is both an art and a science. The science is based on an analysis of the product costs, margin objectives, market demand, competition, marketing mix, pricing strategies and retail pricing analysis.
The next in the process is consideration of the following elements. The art comes in putting the science with market and consumer perception of the value of the product.
1. Value Base Pricing – setting the price based on the perceived value to the consumer relative to competitive and substitutable products
2. Psychological Pricing – setting the price on factors such as perception of quality. Popular price points and what the consumer perceives to be fair
3. Customary Price points – setting the price points in the range that consumers are used to paying for a type of product
4. Substitution Pricing – setting the price point so that substitutable products do not have an advantage
Review the following to determine fit with Pricing Strategy and Margin Objectives
1. Target Retail – review to ensure that it is compatible with strategy
2. Product Costs – options for increased differentiation or cost review
3. Margin Targets – increase with the view allocating funds for marketing or other functions or decrease with view to reinventing the category and becoming a “category killer”
4. Distributor Margin – can be negotiated as the product gains “traction” in the market; trade margin for exclusivity or other issues; could be tied to bundling with other products or a volume rebate if target volumes achieved
5. Retail Margin – keep as high as possible; retailers are reluctant to “delist” a high margin product and it may result in leverage in program negotiations
6. Program Costs – all programs are usually negotiable; reserve funds for programs that will drive volume.
28
Section 1Section 9
29
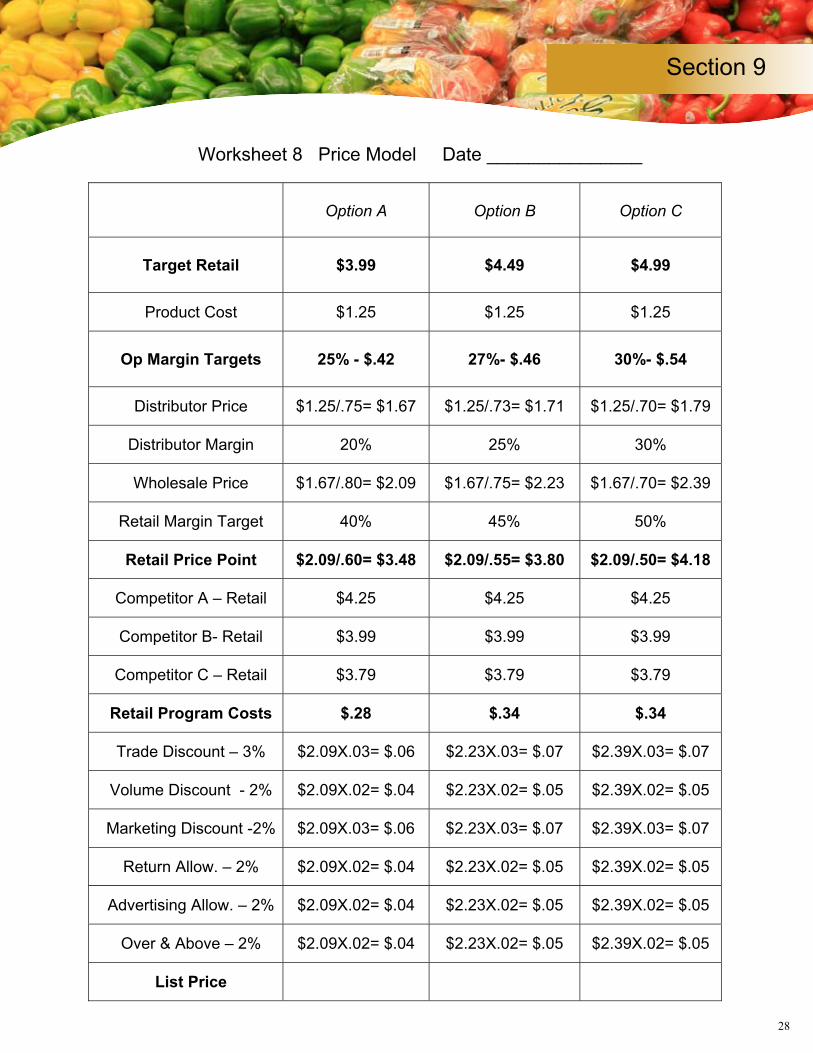
Worksheet 8 Price Model Date _______________
Option A Option B Option C
Target Retail $3.99 $4.49 $4.99
Product Cost $1.25 $1.25 $1.25
Op Margin Targets 25% - $.42 27%- $.46 30%- $.54
Distributor Price $1.25/.75= $1.67 $1.25/.73= $1.71 $1.25/.70= $1.79
Distributor Margin 20% 25% 30%
Wholesale Price $1.67/.80= $2.09 $1.67/.75= $2.23 $1.67/.70= $2.39
Retail Margin Target 40% 45% 50%
Retail Price Point $2.09/.60= $3.48 $2.09/.55= $3.80 $2.09/.50= $4.18
Competitor A – Retail $4.25 $4.25 $4.25
Competitor B- Retail $3.99 $3.99 $3.99
Competitor C – Retail $3.79 $3.79 $3.79
Retail Program Costs $.28 $.34 $.34
Trade Discount – 3% $2.09X.03= $.06 $2.23X.03= $.07 $2.39X.03= $.07
Volume Discount - 2% $2.09X.02= $.04 $2.23X.02= $.05 $2.39X.02= $.05
Marketing Discount -2% $2.09X.03= $.06 $2.23X.03= $.07 $2.39X.03= $.07
Return Allow. – 2% $2.09X.02= $.04 $2.23X.02= $.05 $2.39X.02= $.05
Advertising Allow. – 2% $2.09X.02= $.04 $2.23X.02= $.05 $2.39X.02= $.05
Over & Above – 2% $2.09X.02= $.04 $2.23X.02= $.05 $2.39X.02= $.05
List Price
29
Section 1Section 9
30
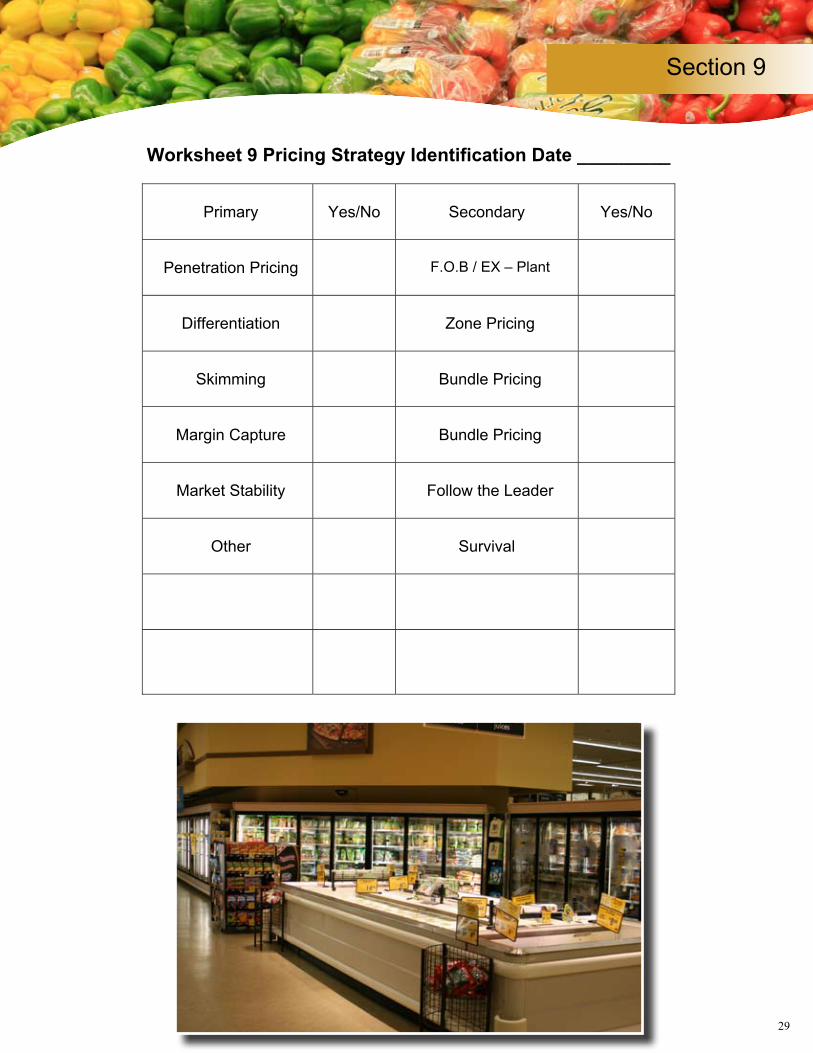
Worksheet 9 Pricing Strategy Identification Date _________
Primary Yes/No Secondary Yes/No
Penetration Pricing F.O.B / EX – Plant
Differentiation Zone Pricing
Skimming Bundle Pricing
Margin Capture Bundle Pricing
Market Stability Follow the Leader
Other Survival
Review the following to determine fit with Pricing Strategy and Margin Objectives.
1. Target Retail – review to ensure that it is compatible with strategy. 2. Product Costs – options for increased differentiation or cost review 3. Margin Targets – increase with the view allocating funds for marketing or other functions or
decrease with view to reinventing the category and becoming a “category killer”. 4. Distributor Margin – can be negotiated as the product gains “traction” in the market; trade
margin for exclusivity or other issues; could be tied to bundling with other products or a volume rebate if target volumes achieved.
5. Retail Margin – keep as high as possible; retailers are reluctant to “delist” a high margin product and it may result in leverage in program negotiations.
6. Program Costs – all programs are usually negotiable; reserve funds for programs that will drive volume.
© Copyright 2010
DISCLAIMERWHILE EVERY EFFORT HAS BEEN MADE TO ENSURE ACCURACY, NONE OF THE SPONSORING AGENCIES OR AUTHORS ACCEPTS RESPONSIBILITY FOR ERRORS OR OMISSIONS. THE PUBLISHER, EDITORS AND ALL CONTRIBUTORS TO THIS PUBLICATION CANNOT BE HELD RESPONSIBLE FOR PUBLICATION ERRORS OR ANY CONSEQUENCES RESULTING FROM THE USE OF THIS PUBLICATION.
ALL RIGHTS RESERVED. NO PART OF THIS PUBLICATION MAY BE REPRODUCED, STORED IN A RETRIEVAL SYSTEM, OR TRANSMITTED IN ANY FORM OR BY ANY MEANS, ELECTRONIC MECHANICAL PHOTOCOPYING, RECORDING OR OTHERWISE, WITHOUT WRITTEN PERMISSION FROM THE AGRICULTURE COUNCIL OF SASKATCHEWAN INC.
www.saskvaluechain.ca
Funding for this project has been provided by Agriculture and Agri-Food Canada through the Canadian Agricultural Adaptation Program (CAAP). In Saskatchewan, this program is delivered by the
Agriculture Council of Saskatchewan.
For additional information pertaining to the Grocery Retail Guide, please contact:
Bryan Kosteroski Value Chain Specialist Agriculture Council of Saskatchewan207-116 Research DriveSaskatoon SaskatchewanCanada S7N 3R3Office (306) 975-6851Cellular (306) 229-8986Email – [email protected] – www.saskvaluechain.ca
The Agriculture Council of Saskatchewan (ACS) Inc. has developed this electronic guide for the Canadian Grocery Retail Industry as part of its continuing efforts to support the agriculture and agri-food industry and develop the capacity and tools for food growers and processors to enter the Canadian grocery retail industry.
The purpose of the guide is to provide food growers and processors with a better understanding of the grocery retail industry and how to tap into business opportunities within it. ACS has engaged Ackerman & Associates, consultants to the grocery retail industry, to help create this powerful reference tool. Ackerman & Associates is an alliance of senior consultants focusing on business strategy support – research, value chain design and implementation – for the grocery retail industry.
Acknowledgements: Terry Ackerman - Principal, Ackerman & Associates