Embed Size (px)
Citation preview
Reno/Sparks Industrial MarketF i r s t Q u a r t e r 2 0 1 8
CoStar Industrial Statistics
Reno/Sparks Industrial Market
©2018 CoStar Group, Inc. CoStar Industrial Statistics A
First Quarter 2018 – Reno/Sparks
Table of ContentsTable of Contents . . . . . . . . . . . . . . . . . . . . . . . . . . . . . . . . . . . . . . . . . . . . . . . . . . . . . . . . . . . . . . . . . AMethodology . . . . . . . . . . . . . . . . . . . . . . . . . . . . . . . . . . . . . . . . . . . . . . . . . . . . . . . . . . . . . . . . . . . . . . BTerms & Definitions. . . . . . . . . . . . . . . . . . . . . . . . . . . . . . . . . . . . . . . . . . . . . . . . . . . . . . . . . . . . . . . . CMarket Highlights & Overview . . . . . . . . . . . . . . . . . . . . . . . . . . . . . . . . . . . . . . . . . . . . . . . . . . . . . . . . 1CoStar Markets . . . . . . . . . . . . . . . . . . . . . . . . . . . . . . . . . . . . . . . . . . . . . . . . . . . . . . . . . . . . . . . . . . . . 3Inventory & Development Analysis. . . . . . . . . . . . . . . . . . . . . . . . . . . . . . . . . . . . . . . . . . . . . . . . . . . . . 4
Inventory & Development AnalysisSelect Top Under Construction PropertiesSelect Top Deliveries
Figures at a Glance. . . . . . . . . . . . . . . . . . . . . . . . . . . . . . . . . . . . . . . . . . . . . . . . . . . . . . . . . . . . . . . . . 7Figures at a Glance by Building Type & MarketHistorical Figures at a Glance
Leasing Activity Analysis. . . . . . . . . . . . . . . . . . . . . . . . . . . . . . . . . . . . . . . . . . . . . . . . . . . . . . . . . . . . . 9Select Top Lease Transactions
Analysis of Individual CoStar Submarket Clusters . . . . . . . . . . . . . . . . . . . . . . . . . . . . . . . . . . . . . . . . 11Airport MarketCarson City County MarketCentral Reno MarketChurchill County MarketDouglas County MarketFernley MarketIncline Village MarketN Outlying Washoe Cty MarketNorth Valleys MarketS Lyon County MarketS Outlying Washoe Cty MarketSouth Reno MarketSparks MarketStorey County MarketWest Reno Market
Reno/Sparks Industrial Market
B CoStar Industrial Statistics ©2018 CoStar Group, Inc.
Reno/Sparks – First Quarter 2018
Reno/Sparks Industrial Market
©2018 CoStar Group, Inc. CoStar Industrial Statistics C
First Quarter 2018 – Reno/Sparks
MethodologyThe CoStar Industrial Statistics calculates Industrial statistics using CoStar Group's base of existing, under construction and under renovation Industrial buildings in each given metropolitan area. All Industrial building types are included, including warehouse, flex / research & development, distribution, manufacturing, industrial showroom, and service buildings, in both single-tenant and multi-tenant buildings, including owner-occupied buildings. CoStar Group's global database includes approximately 119 billion square feet of coverage in 5.4 million properties. All rental rates reported in the CoStar Industrial Report are calculated using the quoted rental rate for each property.
© Copyright 2018 CoStar Group, Inc. All Rights Reserved. Although CoStar makes efforts to ensure the accuracy and reliability of the information contained herein, CoStar makes no guarantee, representation or warranty regarding the quality, accuracy, timeliness or completeness of the information. The publication is provided ‘as is’ and CoStar expressly disclaims any guarantees, representations or warranties of any kind, including those of MERCHANTABILITY AND FITNESS FOR A PARTICULAR PURPOSE.
CoStar Group, Inc.
1331 L ST NW • Washington, DC 20005• (800) 204-5960 • www.costar.com • NASDAQ: CSGP
For information on subscribing to CoStar’s other products and services, please contact us at 1-877-7COSTAR, or visit our web site at www.costar.com
Reno/Sparks Industrial Market
B CoStar Industrial Statistics ©2018 CoStar Group, Inc.
Reno/Sparks – First Quarter 2018
Reno/Sparks Industrial Market
©2018 CoStar Group, Inc. CoStar Industrial Statistics C
First Quarter 2018 – Reno/Sparks
Terms & DefinitionsAvailability Rate: The ratio of available space to total rentable space, calculated by dividing the total available square feet by the total rentable square feet.
Available Space: The total amount of space that is currently being marketed as available for lease in a given time period. It includes any space that is available, regardless of whether the space is vacant, occupied, available for sublease, or available at a future date.
Build-to-Suit: A term describing a particular property, developed specifically for a certain tenant to occupy, with structural features, systems, or improvement work designed specifically for the needs of that tenant. A build-to-suit can be leased or owned by the tenant. In a leased build-to-suit, a tenant will usually have a long term lease on the space.
Buyer: The individual, group, company, or entity that has purchased a commercial real estate asset.
Cap Rate: Short for capitalization rate. The Cap Rate is a calculation that reflects the relationship between one year’s net operating income and the current market value of a particular property. The Cap Rate is calculated by dividing the annual net operating income by the sales price (or asking sales price).
CBD: Abbreviation for Central Business District. (See also: Central Business District)
Central Business District: The designations of Central Business District (CBD) and Suburban refer to a particular geographic area within a metropolitan statistical area (MSA) describing the level of real estate development found there. The CBD is characterized by a high density, well organized core within the largest city of a given MSA.
Class A: A classification used to describe buildings that generally qualify as extremely desirable investment-grade properties and com-mand the highest rents or sale prices compared to other buildings in the same market. Such buildings are well located and provide efficient tenant layouts as well as high quality, and in some buildings, one-of-a-kind floor plans. They can be an architectural or historical landmark designed by prominent architects. These buildings contain a modern mechanical system, and have above-average maintenance and management as well as the best quality materials and workmanship in their trim and interior fittings. They are generally the most attractive and eagerly sought by investors willing to pay a premium for quality.
Class B: A classification used to describe buildings that generally qualify as a more speculative investment, and as such, command lower rents or sale prices compared to Class A properties. Such buildings offer utilitarian space without special attractions, and have ordinary design, if new or fairly new; good to excellent design if an older non-landmark building. These buildings typically have average to good maintenance, management and tenants. They are less appealing to tenants than Class A properties, and may be deficient in a number of respects including floor plans, condition and facilities. They lack prestige and must depend chiefly on a lower price to attract tenants and investors.
Class C: A classification used to describe buildings that generally qualify as no-frills, older buildings that offer basic space and command lower rents or sale prices compared to other buildings in the same market. Such buildings typically have below-average maintenance and management, and could have mixed or low tenant prestige, inferior elevators, and/or mechanical/electrical systems. These build-ings lack prestige and must depend chiefly on a lower price to attract tenants and investors.
Construction Starts: Buildings that began construction during a specific period of time. (See also: Deliveries)
Contiguous Blocks of Space: Space within a building that is, or is able to be joined together into a single contiguous space.
Deliveries: Buildings that complete construction during a specified period of time. In order for space to be considered delivered, a certifi-
cate of occupancy must have been issued for the property.
Delivery Date: The date a building completes construction and receives a certificate of occupancy.
Developer: The company, entity or individual that transforms raw land to improved property by use of labor, capital and entrepreneurial efforts.
Direct Space: Space that is being offered for lease directly from the landlord or owner of a building, as opposed to space being offered in a building by another tenant (or broker of a tenant) trying to sublet a space that has already been leased.
Existing Inventory: The square footage of buildings that have received a certificate of occupancy and are able to be occupied by tenants. It does not include space in buildings that are either planned, under construction or under renovation.
Flex Building: A type of building designed to be versatile, which may be used in combination with office (corporate headquarters), research and development, quasi-retail sales, and including but not limited to industrial, warehouse, and distribution uses. A typical flex building will be one or two stories with at least half of the rentable area being used as office space, have ceiling heights of 16 feet or less, and have some type of drive-in door, even though the door may be glassed in or sealed off.
Full Service Rental Rate: Rental rates that include all operating expenses such as utilities, electricity, janitorial services, taxes and insur-ance.
Gross Absorption: The total change in occupied space over a given period of time, counting space that is occupied but not space that is vacated by tenants. Gross absorption differs from leasing Activity, which is the sum of all space leased over a certain period of time. Unless otherwise noted Gross Absorption includes direct and sublease space.
Growth in Inventory: The change in size of the existing square footage in a given area over a given period of time, generally due to the construction of new buildings.
Industrial Building: A type of building adapted for such uses as the assemblage, processing, and/or manufacturing of products from raw materials or fabricated parts. Additional uses include warehous-ing, distribution, and maintenance facilities. The primary purpose of the space is for storing, producing, assembling, or distributing product.
Landlord Rep: (Landlord Representative) In a typical lease transaction between an owner/landlord and tenant, the broker that represents the interests of the owner/landlord is referred to as the Landlord Rep.
Leased Space: All the space that has a financial lease obligation. It includes all leased space, regardless of whether the space is currently occupied by a tenant. Leased space also includes space being offered for sublease.
Leasing Activity: The volume of square footage that is commit-ted to and signed under a lease obligation for a specific building or market in a given period of time. It includes direct leases, subleases and renewals of existing leases. It also includes any pre-leasing activity in planned, under construction, or under renovation buildings.
Market: Geographic boundaries that serve to delineate core areas that are competitive with each other and constitute a generally accepted primary competitive set of areas. Markets are building-type specific, and are non-overlapping contiguous geographic designations having a cumulative sum that matches the boundaries of the entire Region (See also: Region). Markets can be further subdivided into Submarkets. (See also: Submarkets)
Multi-Tenant: Buildings that house more than one tenant at a given time. Usually, multi-tenant buildings were designed and built to accommodate many different floor plans and designs for different
Reno/Sparks Industrial Market
D CoStar Industrial Statistics ©2018 CoStar Group, Inc.
Reno/Sparks – First Quarter 2018 First Quarter 2018 – Reno/Sparks
Reno/Sparks Industrial Market
©2018 CoStar Group, Inc. CoStar Industrial Statistics 1
tenant needs. (See also: Tenancy).
Net Absorption: The net change in occupied space over a given period of time. Unless otherwise noted Net Absorption includes direct and sublease space.
Net Rental Rate: A rental rate that excludes certain expenses that a tenant could incur in occupying office space. Such expenses are expected to be paid directly by the tenant and may include janitorial costs, electricity, utilities, taxes, insurance and other related costs.
New Space: Sometimes called first generation space, refers to space that has never been occupied and/or leased by a tenant.
Occupied Space: Space that is physically occupied by a tenant. It does not include leased space that is not currently occupied by a tenant.
Office Building: A type of commercial building used exclusively or primarily for office use (business), as opposed to manufacturing, warehousing, or other uses. Office buildings may sometimes have other associated uses within part of the building, i.e., retail sales, finan-cial, or restaurant, usually on the ground floor.
Owner: The company, entity, or individual that holds title on a given building or property.
Planned/Proposed: The status of a building that has been announced for future development but not yet started construction.
Preleased Space: The amount of space in a building that has been leased prior to its construction completion date, or certificate of occupancy date.
Price/SF: Calculated by dividing the price of a building (either sales price or asking sales price) by the Rentable Building Area (RBA).
Property Manager: The company and/or person responsible for the day-to-day operations of a building, such as cleaning, trash removal, etc. The property manager also makes sure that the various systems within the building, such as the elevators, HVAC, and electrical systems, are functioning properly.
Quoted Rental Rate: The asking rate per square foot for a par-ticular building or unit of space by a broker or property owner. Quoted rental rates may differ from the actual rates paid by tenants following the negotiation of all terms and conditions in a specific lease.
RBA: Abbreviation for Rentable Building Area. (See also: Rentable Building Area)
Region: Core areas containing a large population nucleus, that together with adjacent communities have a high degree of economic and social integration. Regions are further divided into market areas, called Markets. (See also: Markets)
Relet Space: Sometimes called second generation or direct space, refers to existing space that has previously been occupied by another tenant.
Rentable Building Area: (RBA) The total square footage of a building that can be occupied by, or assigned to a tenant for the purpose of determining a tenant’s rental obligation. Generally RBA includes a percentage of common areas including all hallways, main lobbies, bathrooms, and telephone closets.
Rental Rates: The annual costs of occupancy for a particular space quoted on a per square foot basis.
Sales Price: The total dollar amount paid for a particular property at a particular point in time.
Sales Volume: The sum of sales prices for a given group of buildings in a given time period.
Seller: The individual, group, company, or entity that sells a particular commercial real estate asset.
SF: Abbreviation for Square Feet.
Single-Tenant: Buildings that are occupied, or intended to be occupied by a single tenant. (See also: Build-to-suit and Tenancy)
Sublease Space: Space that has been leased by a tenant and is being offered for lease back to the market by the tenant with the lease obligation. Sublease space is sometimes referred to as sublet space.
Submarkets: Specific geographic boundaries that serve to delin-eate a core group of buildings that are competitive with each other and constitute a generally accepted primary competitive set, or peer group. Submarkets are building type specific (office, industrial, retail, etc.), with distinct boundaries dependent on different factors relevant to each building type. Submarkets are non-overlapping, contiguous geographic designations having a cumulative sum that matches the boundaries of the Market they are located within (See also: Market).
Suburban: The Suburban and Central Business District (CBD) des-ignations refer to a particular geographic area within a metropolitan statistical area (MSA). Suburban is defined as including all office inven-tory not located in the CBD. (See also: CBD)
Tenancy: A term used to indicate whether or not a building is occu-pied by multiple tenants (See also: Multi-tenant) or a single tenant. (See also: Single-tenant)
Tenant Rep: Tenant Rep stands for Tenant Representative. In a typical lease transaction between an owner/landlord and tenant, the broker that represents the interests of the tenant is referred to as a Tenant Rep.
Time On Market: A measure of how long a currently available space has been marketed for lease, regardless of whether it is vacant or occupied.
Under Construction: Buildings in a state of construction, up until they receive their certificate of occupancy. In order for CoStar to consider a building under construction, the site must have a concrete foundation in place. Abbreviated UC.
Vacancy Rate: A measurement expressed as a percentage of the total amount of physically vacant space divided by the total amount of existing inventory. Under construction space generally is not included in vacancy calculations.
Vacant Space: Space that is not currently occupied by a tenant, regardless of any lease obligation that may be on the space. Vacant space could be space that is either available or not available. For example, sublease space that is currently being paid for by a tenant but not occupied by that tenant, would be considered vacant space. Likewise, space that has been leased but not yet occupied because of finish work being done, would also be considered vacant space.
Weighted Average Rental Rate: Rental rates that are cal-culated by factoring in, or weighting, the square footage associated with each particular rental rate. This has the effect of causing rental rates on larger spaces to affect the average more than that of smaller spaces. The weighted average rental rate is calculated by taking the ratio of the square footage associated with the rental rate on each individual available space to the square footage associated with rental rates on all available spaces, multiplying the rental rate by that ratio, and then adding together all the resulting numbers. Unless specifically specified otherwise, rental rate averages include both Direct and Sublet available spaces.
Year Built: The year in which a building completed construction and was issued a certificate of occupancy.
YTD: Abbreviation for Year-to-Date. Describes statistics that are cumulative from the beginning of a calendar year through whatever time period is being studied.
Reno/Sparks Industrial Market
D CoStar Industrial Statistics ©2018 CoStar Group, Inc.
Reno/Sparks – First Quarter 2018 First Quarter 2018 – Reno/Sparks
Reno/Sparks Industrial Market
©2018 CoStar Group, Inc. CoStar Industrial Statistics 1
Overview
Reno/Sparks’s Vacancy Decreases to 6.5% Net Absorption Positive 496,119 SF in the Quarter
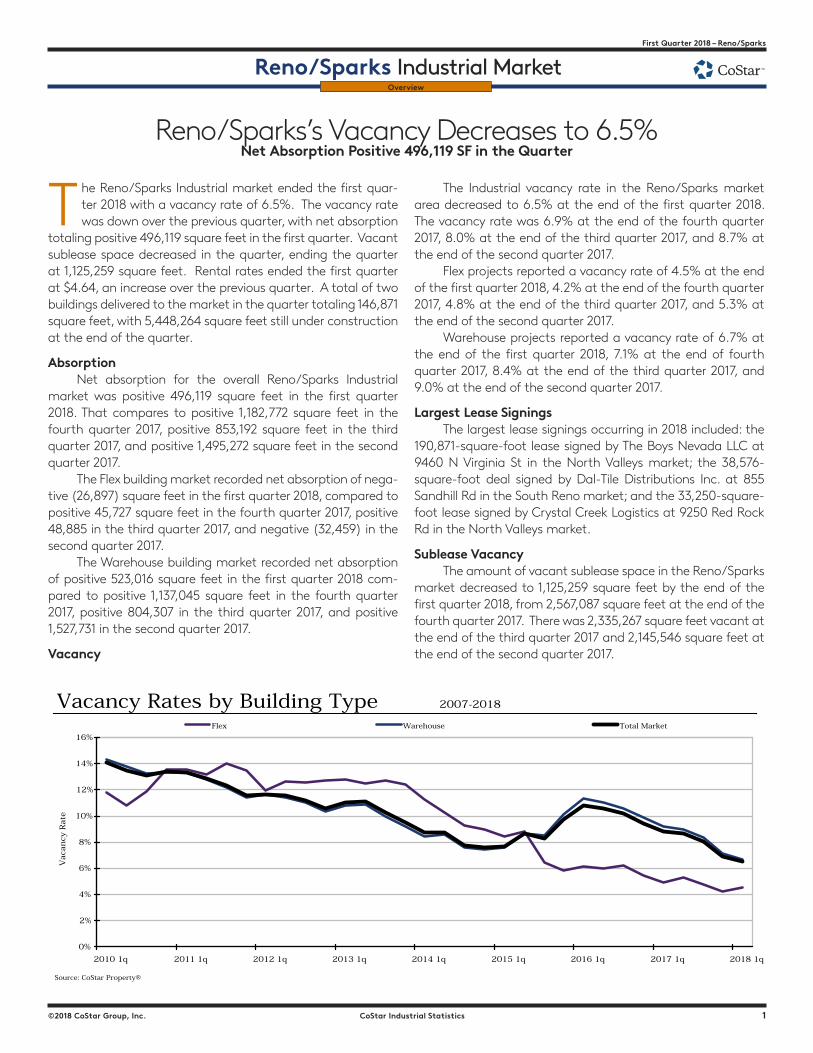
The Reno/Sparks Industrial market ended the first quar-ter 2018 with a vacancy rate of 6.5%. The vacancy rate was down over the previous quarter, with net absorption
totaling positive 496,119 square feet in the first quarter. Vacant sublease space decreased in the quarter, ending the quarter at 1,125,259 square feet. Rental rates ended the first quarter at $4.64, an increase over the previous quarter. A total of two buildings delivered to the market in the quarter totaling 146,871 square feet, with 5,448,264 square feet still under construction at the end of the quarter.
AbsorptionNet absorption for the overall Reno/Sparks Industrial
market was positive 496,119 square feet in the first quarter 2018. That compares to positive 1,182,772 square feet in the fourth quarter 2017, positive 853,192 square feet in the third quarter 2017, and positive 1,495,272 square feet in the second quarter 2017.
The Flex building market recorded net absorption of nega-tive (26,897) square feet in the first quarter 2018, compared to positive 45,727 square feet in the fourth quarter 2017, positive 48,885 in the third quarter 2017, and negative (32,459) in the second quarter 2017.
The Warehouse building market recorded net absorption of positive 523,016 square feet in the first quarter 2018 com-pared to positive 1,137,045 square feet in the fourth quarter 2017, positive 804,307 in the third quarter 2017, and positive 1,527,731 in the second quarter 2017.
Vacancy
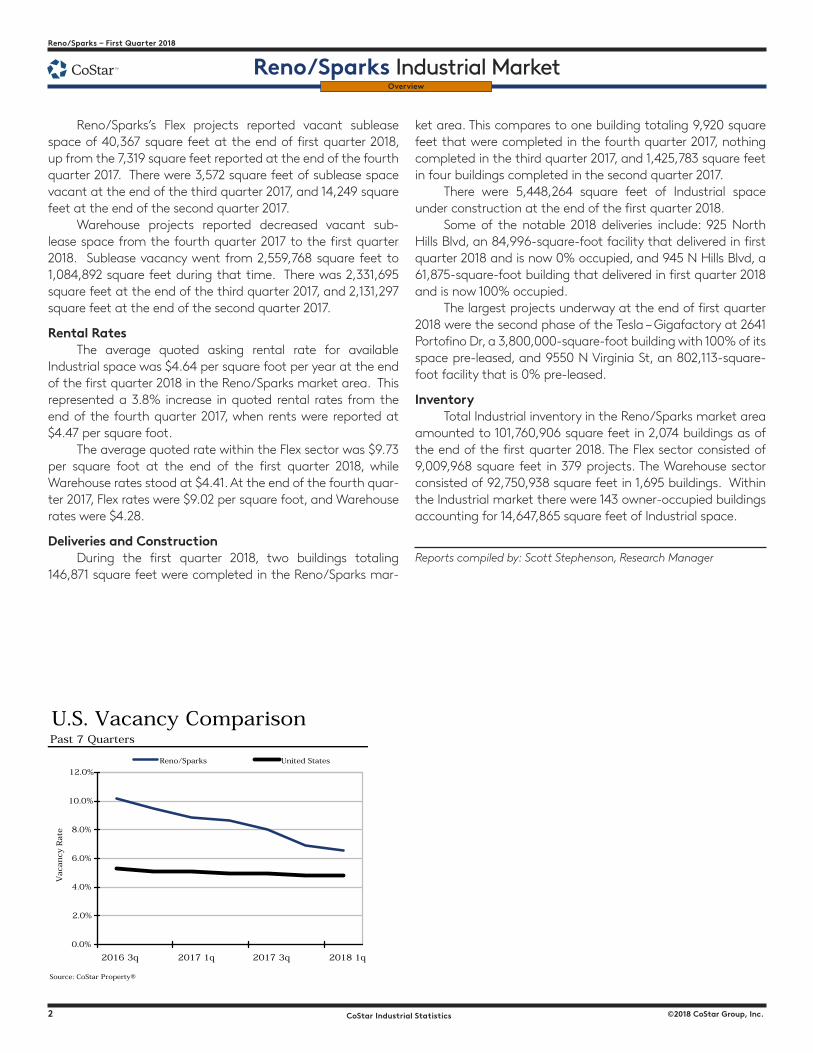
The Industrial vacancy rate in the Reno/Sparks market area decreased to 6.5% at the end of the first quarter 2018. The vacancy rate was 6.9% at the end of the fourth quarter 2017, 8.0% at the end of the third quarter 2017, and 8.7% at the end of the second quarter 2017.
Flex projects reported a vacancy rate of 4.5% at the end of the first quarter 2018, 4.2% at the end of the fourth quarter 2017, 4.8% at the end of the third quarter 2017, and 5.3% at the end of the second quarter 2017.
Warehouse projects reported a vacancy rate of 6.7% at the end of the first quarter 2018, 7.1% at the end of fourth quarter 2017, 8.4% at the end of the third quarter 2017, and 9.0% at the end of the second quarter 2017.
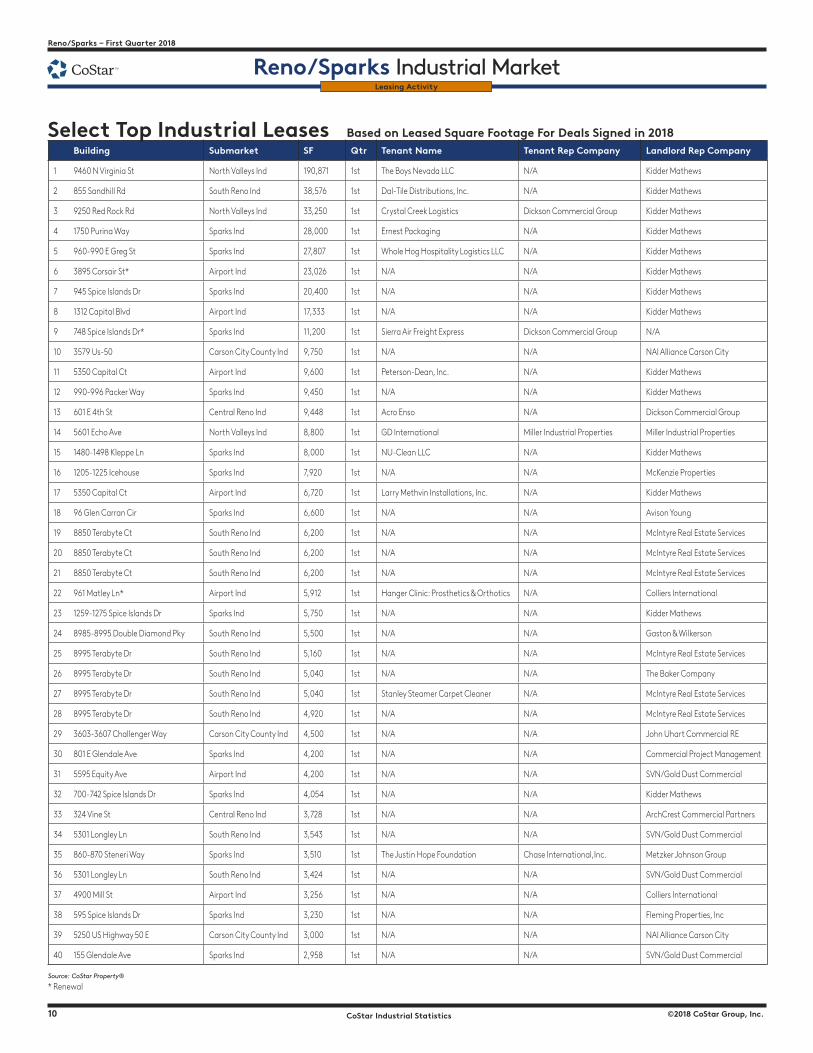
Largest Lease SigningsThe largest lease signings occurring in 2018 included: the
190,871-square-foot lease signed by The Boys Nevada LLC at 9460 N Virginia St in the North Valleys market; the 38,576-square-foot deal signed by Dal-Tile Distributions Inc. at 855 Sandhill Rd in the South Reno market; and the 33,250-square-foot lease signed by Crystal Creek Logistics at 9250 Red Rock Rd in the North Valleys market.
Sublease VacancyThe amount of vacant sublease space in the Reno/Sparks
market decreased to 1,125,259 square feet by the end of the first quarter 2018, from 2,567,087 square feet at the end of the fourth quarter 2017. There was 2,335,267 square feet vacant at the end of the third quarter 2017 and 2,145,546 square feet at the end of the second quarter 2017.
Vacancy Rates by Building Type 2007-2018
Source: CoStar Property®
Absorption & Deliveries U.S. Vacancy ComparisonPast 7 Quarters Past 7 Quarters
Source: CoStar Property® Source: CoStar Property®
0%
2%
4%
6%
8%
10%
12%
14%
16%
2010 1q 2011 1q 2012 1q 2013 1q 2014 1q 2015 1q 2016 1q 2017 1q 2018 1q
Vaca
ncy
Rate
Flex Warehouse Total Market
3.5
2.2
0.6
1.5
0.9
1.2
0.5
3.5
1.6
0.0
1.4
0.0 0.00.1
0.0
0.5
1.0
1.5
2.0
2.5
3.0
3.5
4.0
2016 3q 2017 1q 2017 3q 2018 1q
Millions
SF
Net Absorption Deliveries
0.0%
2.0%
4.0%
6.0%
8.0%
10.0%
12.0%
2016 3q 2017 1q 2017 3q 2018 1q
Vaca
ncy
Rate
Reno/Sparks United States
2 CoStar Industrial Statistics ©2018 CoStar Group, Inc.
Reno/Sparks � First Quarter 2018
Reno/Sparks Industrial MarketFirst Quarter 2018 – Reno/Sparks
Reno/Sparks Industrial Market
©2018 CoStar Group, Inc. CoStar Industrial Statistics 3
Overview
Reno/Sparks’s Flex projects reported vacant sublease space of 40,367 square feet at the end of first quarter 2018, up from the 7,319 square feet reported at the end of the fourth quarter 2017. There were 3,572 square feet of sublease space vacant at the end of the third quarter 2017, and 14,249 square feet at the end of the second quarter 2017.
Warehouse projects reported decreased vacant sub-lease space from the fourth quarter 2017 to the first quarter 2018. Sublease vacancy went from 2,559,768 square feet to 1,084,892 square feet during that time. There was 2,331,695 square feet at the end of the third quarter 2017, and 2,131,297 square feet at the end of the second quarter 2017.
Rental RatesThe average quoted asking rental rate for available
Industrial space was $4.64 per square foot per year at the end of the first quarter 2018 in the Reno/Sparks market area. This represented a 3.8% increase in quoted rental rates from the end of the fourth quarter 2017, when rents were reported at $4.47 per square foot.
The average quoted rate within the Flex sector was $9.73 per square foot at the end of the first quarter 2018, while Warehouse rates stood at $4.41. At the end of the fourth quar-ter 2017, Flex rates were $9.02 per square foot, and Warehouse rates were $4.28.
Deliveries and ConstructionDuring the first quarter 2018, two buildings totaling
146,871 square feet were completed in the Reno/Sparks mar-
ket area. This compares to one building totaling 9,920 square feet that were completed in the fourth quarter 2017, nothing completed in the third quarter 2017, and 1,425,783 square feet in four buildings completed in the second quarter 2017.
There were 5,448,264 square feet of Industrial space under construction at the end of the first quarter 2018.
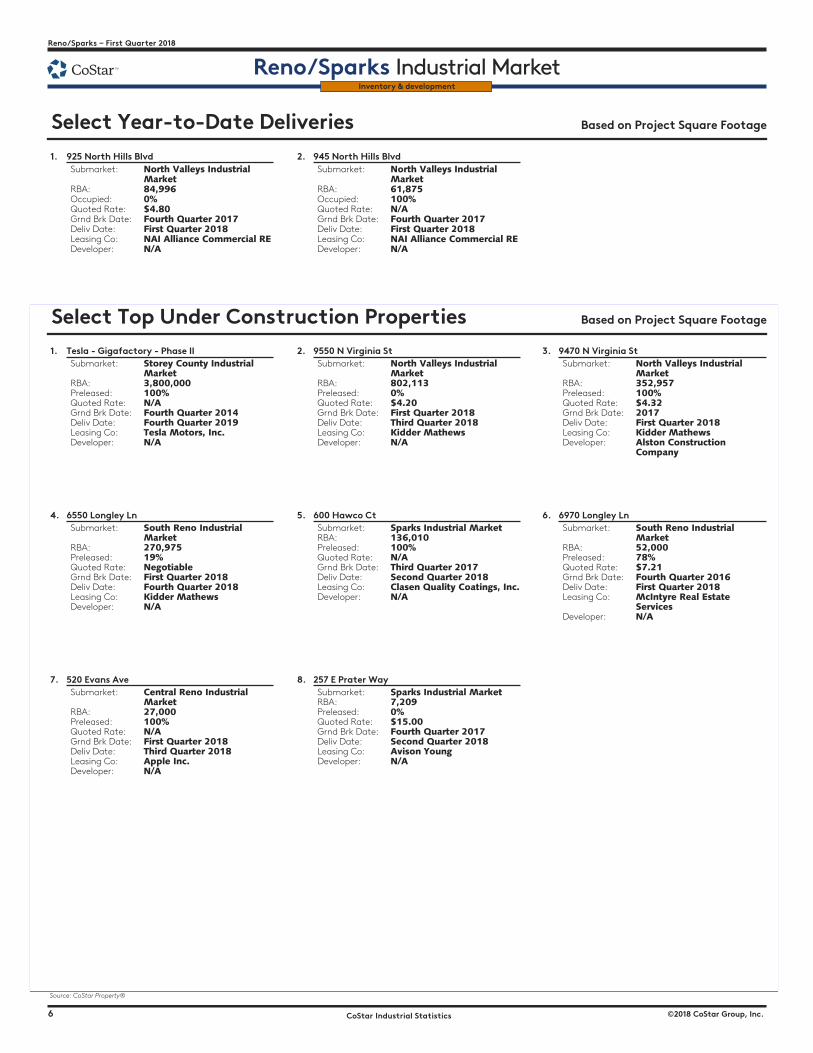
Some of the notable 2018 deliveries include: 925 North Hills Blvd, an 84,996-square-foot facility that delivered in first quarter 2018 and is now 0% occupied, and 945 N Hills Blvd, a 61,875-square-foot building that delivered in first quarter 2018 and is now 100% occupied.
The largest projects underway at the end of first quarter 2018 were the second phase of the Tesla – Gigafactory at 2641 Portofino Dr, a 3,800,000-square-foot building with 100% of its space pre-leased, and 9550 N Virginia St, an 802,113-square-foot facility that is 0% pre-leased.
InventoryTotal Industrial inventory in the Reno/Sparks market area
amounted to 101,760,906 square feet in 2,074 buildings as of the end of the first quarter 2018. The Flex sector consisted of 9,009,968 square feet in 379 projects. The Warehouse sector consisted of 92,750,938 square feet in 1,695 buildings. Within the Industrial market there were 143 owner-occupied buildings accounting for 14,647,865 square feet of Industrial space.
Reports compiled by: Scott Stephenson, Research Manager
Vacancy Rates by Building Type 2007-2018
Source: CoStar Property®
Absorption & Deliveries U.S. Vacancy ComparisonPast 7 Quarters Past 7 Quarters
Source: CoStar Property® Source: CoStar Property®
0%
2%
4%
6%
8%
10%
12%
14%
16%
2010 1q 2011 1q 2012 1q 2013 1q 2014 1q 2015 1q 2016 1q 2017 1q 2018 1q
Vaca
ncy
Rate
Flex Warehouse Total Market
3.5
2.2
0.6
1.5
0.9
1.2
0.5
3.5
1.6
0.0
1.4
0.0 0.00.1
0.0
0.5
1.0
1.5
2.0
2.5
3.0
3.5
4.0
2016 3q 2017 1q 2017 3q 2018 1q
Millions
SF
Net Absorption Deliveries
0.0%
2.0%
4.0%
6.0%
8.0%
10.0%
12.0%
2016 3q 2017 1q 2017 3q 2018 1q
Vaca
ncy
Rate
Reno/Sparks United States
2 CoStar Industrial Statistics ©2018 CoStar Group, Inc.
Reno/Sparks � First Quarter 2018
Reno/Sparks Industrial MarketFirst Quarter 2018 – Reno/Sparks
Reno/Sparks Industrial Market
©2018 CoStar Group, Inc. CoStar Industrial Statistics 3
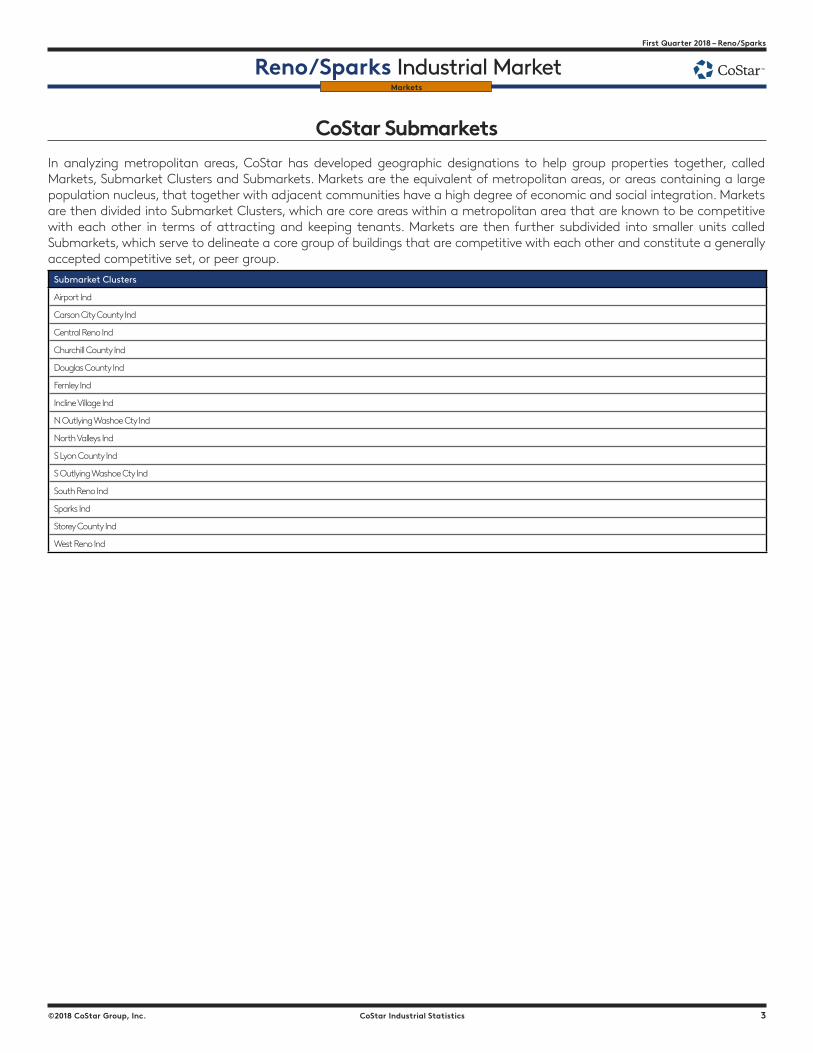
CoStar SubmarketsIn analyzing metropolitan areas, CoStar has developed geographic designations to help group properties together, called Markets, Submarket Clusters and Submarkets. Markets are the equivalent of metropolitan areas, or areas containing a large population nucleus, that together with adjacent communities have a high degree of economic and social integration. Markets are then divided into Submarket Clusters, which are core areas within a metropolitan area that are known to be competitive with each other in terms of attracting and keeping tenants. Markets are then further subdivided into smaller units called Submarkets, which serve to delineate a core group of buildings that are competitive with each other and constitute a generally accepted competitive set, or peer group.
Markets
Submarket Clusters
Airport Ind
Carson City County Ind
Central Reno Ind
Churchill County Ind
Douglas County Ind
Fernley Ind
Incline Village Ind
N Outlying Washoe Cty Ind
North Valleys Ind
S Lyon County Ind
S Outlying Washoe Cty Ind
South Reno Ind
Sparks Ind
Storey County Ind
West Reno Ind
4 CoStar Industrial Statistics ©2018 CoStar Group, Inc.
Reno/Sparks � First Quarter 2018
Reno/Sparks Industrial MarketFirst Quarter 2018 – Reno/Sparks
Reno/Sparks Industrial Market
©2018 CoStar Group, Inc. CoStar Industrial Statistics 5
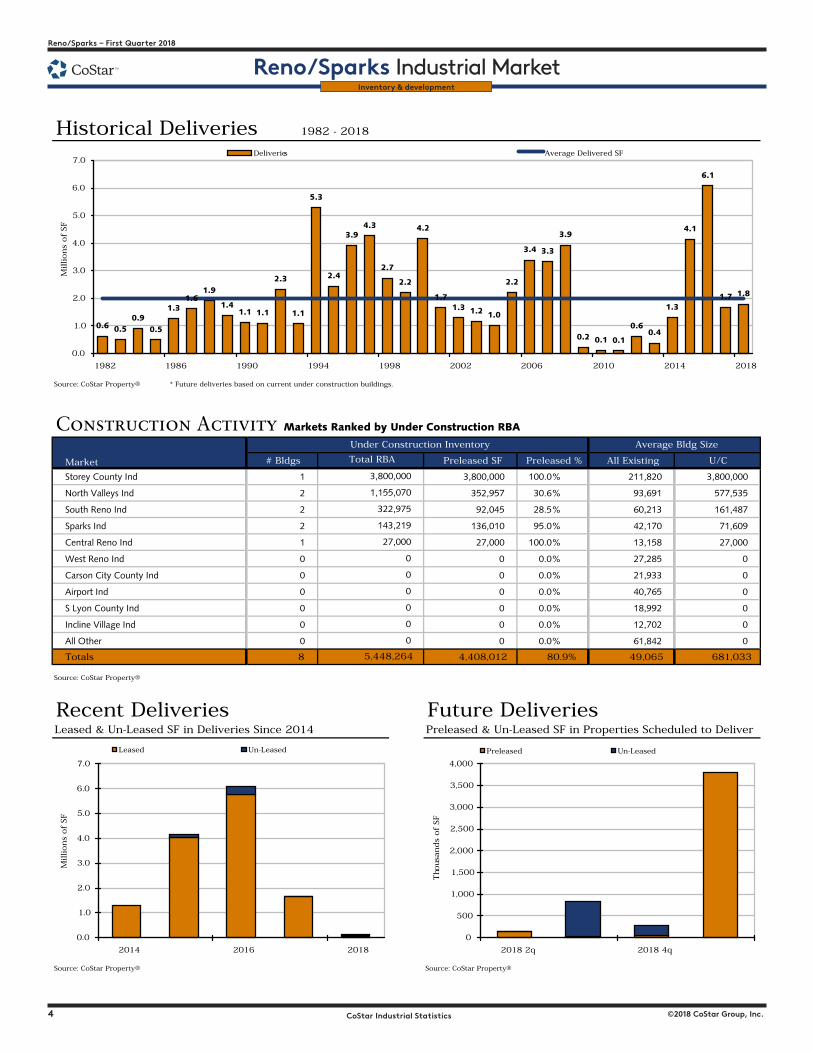
Historical Deliveries 1982 - 2018
Source: CoStar Property® * Future deliveries based on current under construction buildings.
Construction Activity Markets Ranked by Under Construction RBA
# Bldgs Preleased SF Preleased % All Existing U/C
Storey County Ind 1 3,800,000 100.0% 211,820 3,800,000
North Valleys Ind 2 352,957 30.6% 93,691 577,535
South Reno Ind 2 92,045 28.5% 60,213 161,487
Sparks Ind 2 136,010 95.0% 42,170 71,609
Central Reno Ind 1 27,000 100.0% 13,158 27,000
West Reno Ind 0 0 0.0% 27,285 0
Carson City County Ind 0 0 0.0% 21,933 0
Airport Ind 0 0 0.0% 40,765 0
S Lyon County Ind 0 0 0.0% 18,992 0
Incline Village Ind 0 0 0.0% 12,702 0
All Other 0 0 0.0% 61,842 0
Totals 8 4,408,012 80.9% 49,065 681,033
Source: CoStar Property®
Recent Deliveries Future Deliveries Leased & Un-Leased SF in Deliveries Since 2014 Preleased & Un-Leased SF in Properties Scheduled to Deliver
Source: CoStar Property® Source: CoStar Property®
0
3,800,000
5,448,264
1,155,070
322,975
143,219
27,000
0
0
0
0
0
Market
Under Construction Inventory Average Bldg Size
Total RBA
0.6 0.50.9
0.5
1.31.6
1.9
1.41.1 1.1
2.3
1.1
5.3
2.4
3.94.3
2.7
2.2
4.2
1.71.3 1.2 1.0
2.2
3.4 3.3
3.9
0.2 0.1 0.1
0.60.4
1.3
4.1
6.1
1.7 1.8
0.0
1.0
2.0
3.0
4.0
5.0
6.0
7.0
1982 1986 1990 1994 1998 2002 2006 2010 2014 2018
Millions
of
SF
Deliveries Average Delivered SF
0.0
1.0
2.0
3.0
4.0
5.0
6.0
7.0
2014 2016 2018
Millions
of
SF
Leased Un-Leased
0
500
1,000
1,500
2,000
2,500
3,000
3,500
4,000
2018 2q 2018 4q
Tho
usa
nds
of
SF
Preleased Un-Leased
Inventory & development
4 CoStar Industrial Statistics ©2018 CoStar Group, Inc.
Reno/Sparks � First Quarter 2018
Reno/Sparks Industrial MarketFirst Quarter 2018 – Reno/Sparks
Reno/Sparks Industrial Market
©2018 CoStar Group, Inc. CoStar Industrial Statistics 5
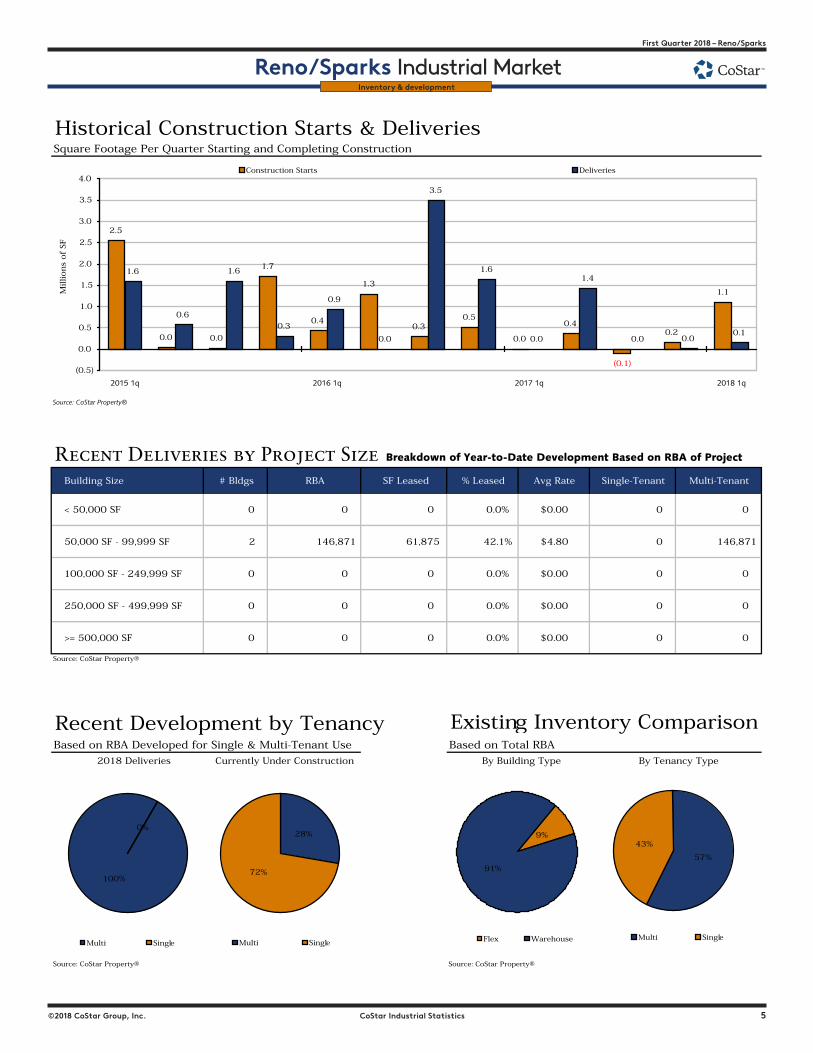
Historical Construction Starts & DeliveriesSquare Footage Per Quarter Starting and Completing Construction
Source: CoStar Property®
Recent Deliveries by Project Size Breakdown of Year-to-Date Development Based on RBA of Project
Building Size # Bldgs RBA SF Leased % Leased Avg Rate Single-Tenant Multi-Tenant
< 50,000 SF 0 0 0 0.0% $0.00 0 0
50,000 SF - 99,999 SF 2 146,871 61,875 42.1% $4.80 0 146,871
100,000 SF - 249,999 SF 0 0 0 0.0% $0.00 0 0
250,000 SF - 499,999 SF 0 0 0 0.0% $0.00 0 0
>= 500,000 SF 0 0 0 0.0% $0.00 0 0
Source: CoStar Property®
Recent Development by Tenancy Existing Inventory ComparisonBased on RBA Developed for Single & Multi-Tenant Use Based on Total RBA
2018 Deliveries
Source: CoStar Property® Source: CoStar Property®
Currently Under Construction By Building Type By Tenancy Type
2.5
0.0 0.0
1.7
0.4
1.3
0.30.5
0.0
0.4
(0.1)
0.2
1.1
1.6
0.6
1.6
0.3
0.9
0.0
3.5
1.6
0.0
1.4
0.0 0.00.1
(0.5)
0.0
0.5
1.0
1.5
2.0
2.5
3.0
3.5
4.0
2015 1q 2016 1q 2017 1q 2018 1q
Millions
of
SF
Construction Starts Deliveries
28%
72%
Multi Single
100%
0%
Multi Single
9%
91%
Flex Warehouse
57%
43%
Multi Single
Inventory & development
6 CoStar Industrial Statistics ©2018 CoStar Group, Inc.
Reno/Sparks � First Quarter 2018
Reno/Sparks Industrial MarketFirst Quarter 2018 – Reno/Sparks
Reno/Sparks Industrial Market
©2018 CoStar Group, Inc. CoStar Industrial Statistics 7
������������������������������ �������������������������������
������������������������
���� ������������������������������� �������������������������
����������� ���������������� ��������������� �������������������� ������������������������������� ������������������������������ ������������������������������������� ����
���� ������������������������������� �������������������������
����������� ���������������� ����������������� ������������������ ������������������������������� ������������������������������ ������������������������������������� ����
Inventory & development
���������������������������������������� �������������������������������
������������������������
���� ����������������������������������������� �������������������������
����������� �������������������� ����������������� ������������������ ������������������������������� ������������������������������� ����������������������������� ����
���� ����������������������������� �������������������������
����������� ������������������ ��������������� �������������������� ������������������������������ ������������������������������ ������������������������� ����
���� ����������������������������� �������������������������
����������� ������������������ ����������������� �������������������� ���������������� ������������������������������ ������������������������� ��������������������
��������
���� �������������������������� ����������������������
����������� ������������������ ���������������� ������������������������� ������������������������������ ������������������������������� ������������������������� ����
���� ����������������������� ����������������������������� ������������������ ����������������� ������������������ ������������������������������ ������������������������������� ���������������������������������������� ����
���� �������������������������� ����������������������
����������� ����������������� ���������������� �������������������� ������������������������������� ������������������������������ ���������������������
������������������� ����
���� ������������������������ ������������������������
����������� ����������������� ����������������� ������������������ ������������������������������ ������������������������������ ��������������������� ����
���� ��������������������������� ����������������������������� ���������������� ��������������� ��������������������� ������������������������������� ������������������������������� ����������������������� ����
6 CoStar Industrial Statistics ©2018 CoStar Group, Inc.
Reno/Sparks � First Quarter 2018
Reno/Sparks Industrial MarketFirst Quarter 2018 – Reno/Sparks
Reno/Sparks Industrial Market
©2018 CoStar Group, Inc. CoStar Industrial Statistics 7
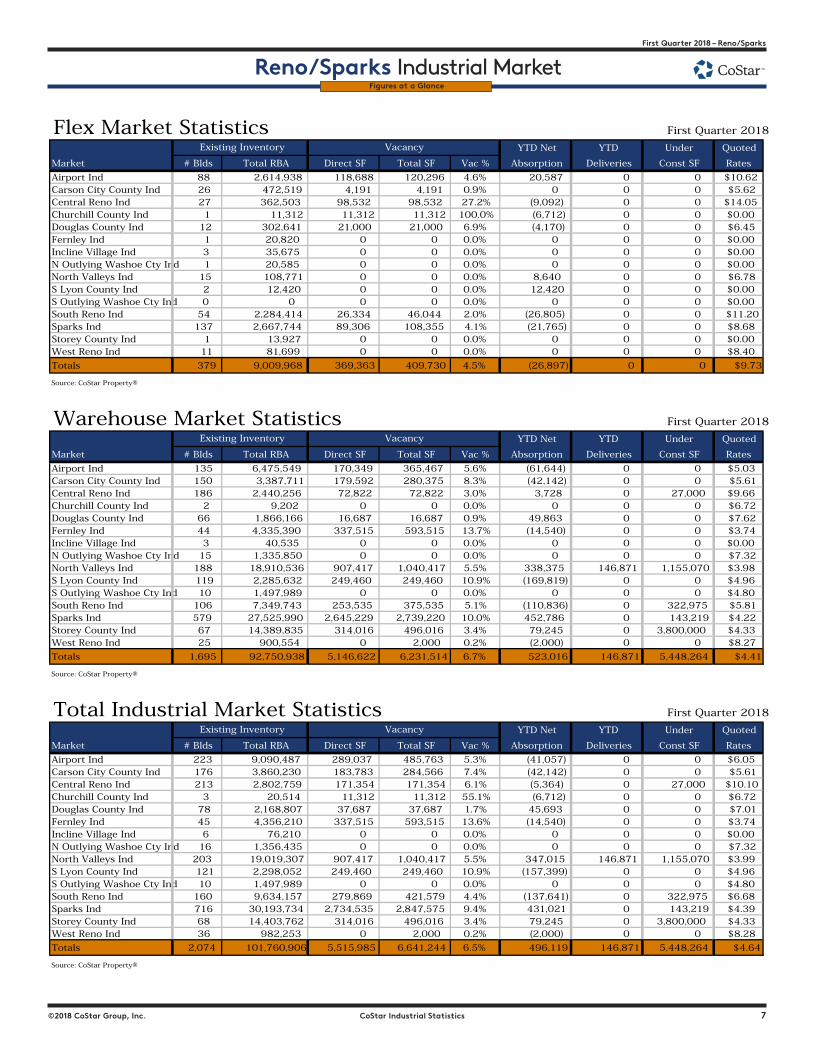
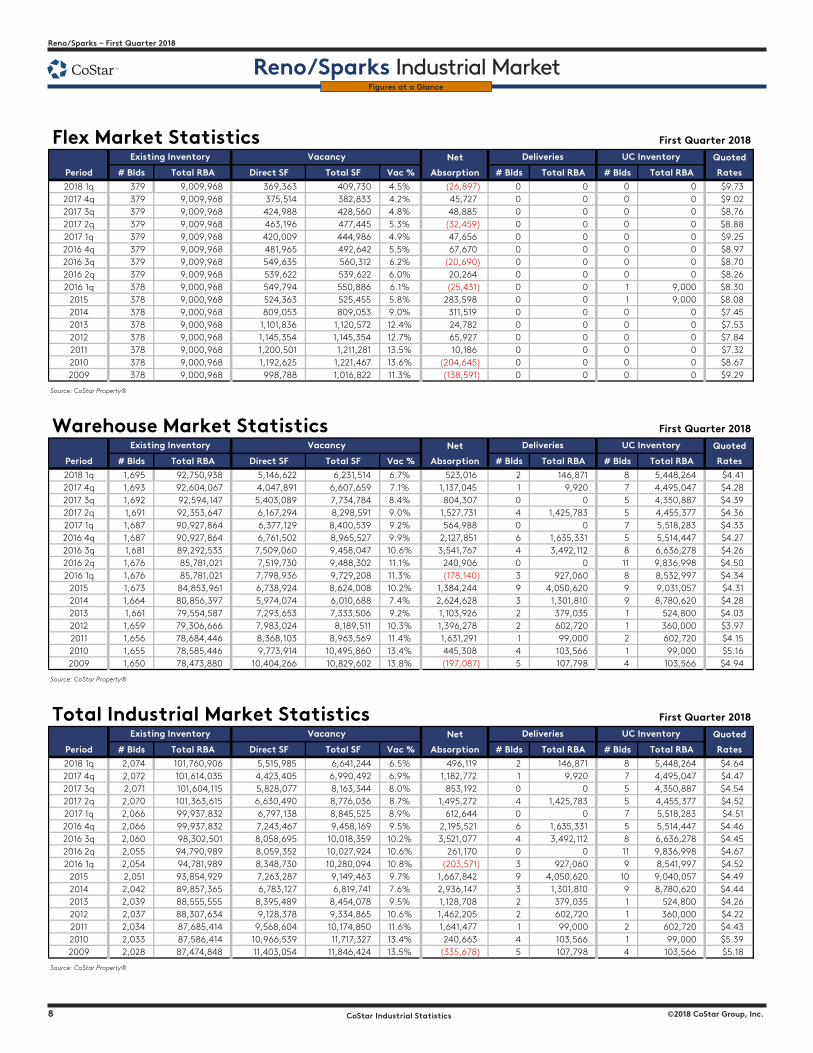
Flex Market Statistics First Quarter 2018
YTD Net YTD Under Quoted
Market # Blds Total RBA Direct SF Total SF Vac % Absorption Deliveries Const SF Rates
Airport Ind 88 2,614,938 118,688 120,296 4.6% 20,587 0 0 $10.62 Carson City County Ind 26 472,519 4,191 4,191 0.9% 0 0 0 $5.62 Central Reno Ind 27 362,503 98,532 98,532 27.2% (9,092) 0 0 $14.05 Churchill County Ind 1 11,312 11,312 11,312 100.0% (6,712) 0 0 $0.00 Douglas County Ind 12 302,641 21,000 21,000 6.9% (4,170) 0 0 $6.45 Fernley Ind 1 20,820 0 0 0.0% 0 0 0 $0.00 Incline Village Ind 3 35,675 0 0 0.0% 0 0 0 $0.00 N Outlying Washoe Cty Ind 1 20,585 0 0 0.0% 0 0 0 $0.00 North Valleys Ind 15 108,771 0 0 0.0% 8,640 0 0 $6.78 S Lyon County Ind 2 12,420 0 0 0.0% 12,420 0 0 $0.00 S Outlying Washoe Cty Ind 0 0 0 0 0.0% 0 0 0 $0.00 South Reno Ind 54 2,284,414 26,334 46,044 2.0% (26,805) 0 0 $11.20 Sparks Ind 137 2,667,744 89,306 108,355 4.1% (21,765) 0 0 $8.68 Storey County Ind 1 13,927 0 0 0.0% 0 0 0 $0.00 West Reno Ind 11 81,699 0 0 0.0% 0 0 0 $8.40
Totals 379 9,009,968 369,363 409,730 4.5% (26,897) 0 0 $9.73
Source: CoStar Property®
Warehouse Market Statistics First Quarter 2018
YTD Net YTD Under Quoted
Market # Blds Total RBA Direct SF Total SF Vac % Absorption Deliveries Const SF Rates
Airport Ind 135 6,475,549 170,349 365,467 5.6% (61,644) 0 0 $5.03 Carson City County Ind 150 3,387,711 179,592 280,375 8.3% (42,142) 0 0 $5.61 Central Reno Ind 186 2,440,256 72,822 72,822 3.0% 3,728 0 27,000 $9.66 Churchill County Ind 2 9,202 0 0 0.0% 0 0 0 $6.72 Douglas County Ind 66 1,866,166 16,687 16,687 0.9% 49,863 0 0 $7.62 Fernley Ind 44 4,335,390 337,515 593,515 13.7% (14,540) 0 0 $3.74 Incline Village Ind 3 40,535 0 0 0.0% 0 0 0 $0.00 N Outlying Washoe Cty Ind 15 1,335,850 0 0 0.0% 0 0 0 $7.32 North Valleys Ind 188 18,910,536 907,417 1,040,417 5.5% 338,375 146,871 1,155,070 $3.98 S Lyon County Ind 119 2,285,632 249,460 249,460 10.9% (169,819) 0 0 $4.96 S Outlying Washoe Cty Ind 10 1,497,989 0 0 0.0% 0 0 0 $4.80 South Reno Ind 106 7,349,743 253,535 375,535 5.1% (110,836) 0 322,975 $5.81 Sparks Ind 579 27,525,990 2,645,229 2,739,220 10.0% 452,786 0 143,219 $4.22 Storey County Ind 67 14,389,835 314,016 496,016 3.4% 79,245 0 3,800,000 $4.33 West Reno Ind 25 900,554 0 2,000 0.2% (2,000) 0 0 $8.27
Totals 1,695 92,750,938 5,146,622 6,231,514 6.7% 523,016 146,871 5,448,264 $4.41
Source: CoStar Property®
Total Industrial Market Statistics First Quarter 2018
YTD Net YTD Under Quoted
Market # Blds Total RBA Direct SF Total SF Vac % Absorption Deliveries Const SF Rates
Airport Ind 223 9,090,487 289,037 485,763 5.3% (41,057) 0 0 $6.05 Carson City County Ind 176 3,860,230 183,783 284,566 7.4% (42,142) 0 0 $5.61 Central Reno Ind 213 2,802,759 171,354 171,354 6.1% (5,364) 0 27,000 $10.10 Churchill County Ind 3 20,514 11,312 11,312 55.1% (6,712) 0 0 $6.72 Douglas County Ind 78 2,168,807 37,687 37,687 1.7% 45,693 0 0 $7.01 Fernley Ind 45 4,356,210 337,515 593,515 13.6% (14,540) 0 0 $3.74 Incline Village Ind 6 76,210 0 0 0.0% 0 0 0 $0.00 N Outlying Washoe Cty Ind 16 1,356,435 0 0 0.0% 0 0 0 $7.32 North Valleys Ind 203 19,019,307 907,417 1,040,417 5.5% 347,015 146,871 1,155,070 $3.99 S Lyon County Ind 121 2,298,052 249,460 249,460 10.9% (157,399) 0 0 $4.96 S Outlying Washoe Cty Ind 10 1,497,989 0 0 0.0% 0 0 0 $4.80 South Reno Ind 160 9,634,157 279,869 421,579 4.4% (137,641) 0 322,975 $6.68 Sparks Ind 716 30,193,734 2,734,535 2,847,575 9.4% 431,021 0 143,219 $4.39 Storey County Ind 68 14,403,762 314,016 496,016 3.4% 79,245 0 3,800,000 $4.33 West Reno Ind 36 982,253 0 2,000 0.2% (2,000) 0 0 $8.28
Totals 2,074 101,760,906 5,515,985 6,641,244 6.5% 496,119 146,871 5,448,264 $4.64
Source: CoStar Property®
Existing Inventory Vacancy
Existing Inventory Vacancy
Existing Inventory Vacancy
Figures at a Glance
8 CoStar Industrial Statistics ©2018 CoStar Group, Inc.
Reno/Sparks � First Quarter 2018
Reno/Sparks Industrial MarketFirst Quarter 2018 – Reno/Sparks
Reno/Sparks Industrial Market
©2018 CoStar Group, Inc. CoStar Industrial Statistics 9
Figures at a Glance
���������������������� ��������������������� ������
������ ������ ��������� ��������� �������� ����� ���������� ������ ��������� ������ ��������� ������������ ���� ���������� �������� �������� ����� ���������� �� �� �� �� ��������������� ���� ���������� �������� �������� ����� �������� �� �� �� �� ��������������� ���� ���������� �������� �������� ����� �������� �� �� �� �� ��������������� ���� ���������� �������� �������� ����� ���������� �� �� �� �� ��������������� ���� ���������� �������� �������� ����� �������� �� �� �� �� ��������������� ���� ���������� �������� �������� ����� �������� �� �� �� �� ��������������� ���� ���������� �������� �������� ����� ���������� �� �� �� �� ��������������� ���� ���������� �������� �������� ����� �������� �� �� �� �� ��������������� ���� ���������� �������� �������� ����� ���������� �� �� �� ������ ������������ ���� ���������� �������� �������� ����� ��������� �� �� �� ������ ������������ ���� ���������� �������� �������� ����� ��������� �� �� �� �� ������������ ���� ���������� ���������� ���������� ������ �������� �� �� �� �� ������������ ���� ���������� ���������� ���������� ������ �������� �� �� �� �� ������������ ���� ���������� ���������� ���������� ������ �������� �� �� �� �� ������������ ���� ���������� ���������� ���������� ������ ����������� �� �� �� �� ������������ ���� ���������� �������� ���������� ������ ����������� �� �� �� �� ��������
������������������������
��������������������������� ��������������������� ������
������ ������ ��������� ��������� �������� ����� ���������� ������ ��������� ������ ��������� ������������ ������ ����������� ���������� ���������� ����� ��������� �� �������� �� ���������� ��������������� ������ ����������� ���������� ���������� ����� ����������� �� ������ �� ���������� ��������������� ������ ����������� ���������� ���������� ����� ��������� �� �� �� ���������� ��������������� ������ ����������� ���������� ���������� ����� ����������� �� ���������� �� ���������� ��������������� ������ ����������� ���������� ���������� ����� ��������� �� �� �� ���������� ��������������� ������ ����������� ���������� ���������� ����� ����������� �� ���������� �� ���������� ��������������� ������ ����������� ���������� ���������� ������ ����������� �� ���������� �� ���������� ��������������� ������ ����������� ���������� ���������� ������ ��������� �� �� ��� ���������� ��������������� ������ ����������� ���������� ���������� ������ ����������� �� �������� �� ���������� ������������ ������ ����������� ���������� ���������� ������ ����������� �� ���������� �� ���������� ������������ ������ ����������� ���������� ���������� ����� ����������� �� ���������� �� ���������� ������������ ������ ����������� ���������� ���������� ����� ����������� �� �������� �� �������� ������������ ������ ����������� ���������� ���������� ������ ����������� �� �������� �� �������� ������������ ������ ����������� ���������� ���������� ������ ����������� �� ������� �� �������� ������������ ������ ����������� ���������� ����������� ������ ��������� �� �������� �� ������� ������������ ������ ����������� ����������� ����������� ������ ����������� �� �������� �� �������� ��������
������������������������
���������������������������������� ��������������������� ������
������ ������ ��������� ��������� �������� ����� ���������� ������ ��������� ������ ��������� ������������ ������ ������������ ���������� ���������� ����� ��������� �� �������� �� ���������� ��������������� ������ ������������ ���������� ���������� ����� ����������� �� ������ �� ���������� ��������������� ������ ������������ ���������� ���������� ����� ��������� �� �� �� ���������� ��������������� ������ ������������ ���������� ���������� ����� ����������� �� ���������� �� ���������� ��������������� ������ ����������� ���������� ���������� ����� ��������� �� �� �� ���������� ��������������� ������ ����������� ���������� ���������� ����� ����������� �� ���������� �� ���������� ��������������� ������ ����������� ���������� ����������� ������ ����������� �� ���������� �� ���������� ��������������� ������ ����������� ���������� ����������� ������ ��������� �� �� ��� ���������� ��������������� ������ ����������� ���������� ����������� ������ ����������� �� �������� �� ���������� ������������ ������ ����������� ���������� ���������� ����� ����������� �� ���������� ��� ���������� ������������ ������ ����������� ���������� ���������� ����� ����������� �� ���������� �� ���������� ������������ ������ ����������� ���������� ���������� ����� ����������� �� �������� �� �������� ������������ ������ ����������� ���������� ���������� ������ ����������� �� �������� �� �������� ������������ ������ ����������� ���������� ����������� ������ ����������� �� ������� �� �������� ������������ ������ ����������� ����������� ����������� ������ ��������� �� �������� �� ������� ������������ ������ ����������� ����������� ����������� ������ ����������� �� �������� �� �������� ��������
������������������������
������������������ ������� ���������� ������������
������������
������������������ ������� ���������� ������������
������������������ ������� ����������
8 CoStar Industrial Statistics ©2018 CoStar Group, Inc.
Reno/Sparks � First Quarter 2018
Reno/Sparks Industrial MarketFirst Quarter 2018 – Reno/Sparks
Reno/Sparks Industrial Market
©2018 CoStar Group, Inc. CoStar Industrial Statistics 9
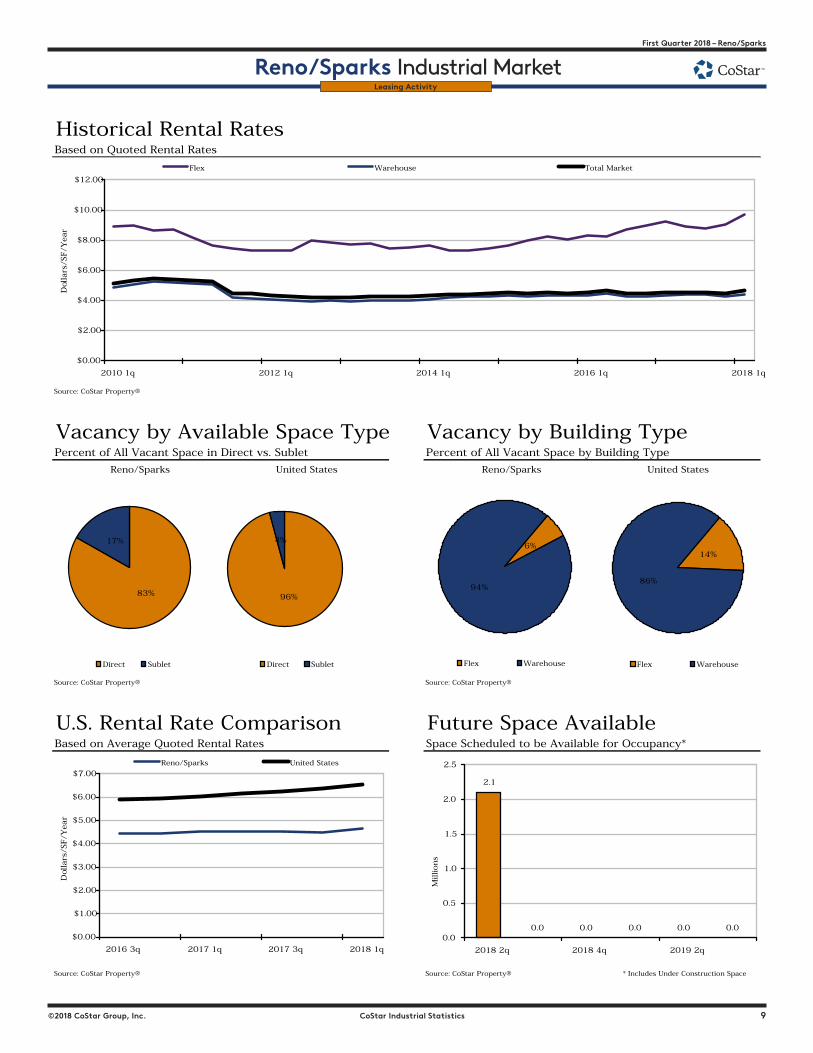
Historical Rental RatesBased on Quoted Rental Rates
Source: CoStar Property®
Vacancy by Available Space Type Vacancy by Building TypePercent of All Vacant Space in Direct vs. Sublet Percent of All Vacant Space by Building Type
Source: CoStar Property® Source: CoStar Property®
U.S. Rental Rate Comparison Future Space AvailableBased on Average Quoted Rental Rates Space Scheduled to be Available for Occupancy*
Source: CoStar Property® Source: CoStar Property® * Includes Under Construction Space
Reno/Sparks United States Reno/Sparks United States
$0.00
$2.00
$4.00
$6.00
$8.00
$10.00
$12.00
2010 1q 2012 1q 2014 1q 2016 1q 2018 1q
Dol
lars
/SF/Y
ear
Flex Warehouse Total Market
$0.00
$1.00
$2.00
$3.00
$4.00
$5.00
$6.00
$7.00
2016 3q 2017 1q 2017 3q 2018 1q
Dol
lars
/SF/Y
ear
Reno/Sparks United States
83%
17%
Direct Sublet
96%
4%
Direct Sublet
6%
94%
Flex Warehouse
2.1
0.0 0.0 0.0 0.0 0.00.0
0.5
1.0
1.5
2.0
2.5
2018 2q 2018 4q 2019 2q
Millions
14%
86%
Flex Warehouse
Leasing Activity
10 CoStar Industrial Statistics ©2018 CoStar Group, Inc.
Reno/Sparks � First Quarter 2018
Reno/Sparks Industrial Market
©2018 CoStar Group, Inc. CoStar Industrial Statistics 11
First Quarter 2018 – Reno/Sparks
Reno/Sparks Industrial MarketMARKET HIGHLIGHTS - Flex & Warehouse
Leasing Activity
Source: CoStar Property®
* Renewal
Building Submarket SF Qtr Tenant Name Tenant Rep Company Landlord Rep Company
1 9460 N Virginia St North Valleys Ind 190,871 1st The Boys Nevada LLC N/A Kidder Mathews
2 855 Sandhill Rd South Reno Ind 38,576 1st Dal-Tile Distributions, Inc. N/A Kidder Mathews
3 9250 Red Rock Rd North Valleys Ind 33,250 1st Crystal Creek Logistics Dickson Commercial Group Kidder Mathews
4 1750 Purina Way Sparks Ind 28,000 1st Ernest Packaging N/A Kidder Mathews
5 960-990 E Greg St Sparks Ind 27,807 1st Whole Hog Hospitality Logistics LLC N/A Kidder Mathews
6 3895 Corsair St* Airport Ind 23,026 1st N/A N/A Kidder Mathews
7 945 Spice Islands Dr Sparks Ind 20,400 1st N/A N/A Kidder Mathews
8 1312 Capital Blvd Airport Ind 17,333 1st N/A N/A Kidder Mathews
9 748 Spice Islands Dr* Sparks Ind 11,200 1st Sierra Air Freight Express Dickson Commercial Group N/A
10 3579 Us-50 Carson City County Ind 9,750 1st N/A N/A NAI Alliance Carson City
11 5350 Capital Ct Airport Ind 9,600 1st Peterson-Dean, Inc. N/A Kidder Mathews
12 990-996 Packer Way Sparks Ind 9,450 1st N/A N/A Kidder Mathews
13 601 E 4th St Central Reno Ind 9,448 1st Acro Enso N/A Dickson Commercial Group
14 5601 Echo Ave North Valleys Ind 8,800 1st GD International Miller Industrial Properties Miller Industrial Properties
15 1480-1498 Kleppe Ln Sparks Ind 8,000 1st NU-Clean LLC N/A Kidder Mathews
16 1205-1225 Icehouse Sparks Ind 7,920 1st N/A N/A McKenzie Properties
17 5350 Capital Ct Airport Ind 6,720 1st Larry Methvin Installations, Inc. N/A Kidder Mathews
18 96 Glen Carran Cir Sparks Ind 6,600 1st N/A N/A Avison Young
19 8850 Terabyte Ct South Reno Ind 6,200 1st N/A N/A McIntyre Real Estate Services
20 8850 Terabyte Ct South Reno Ind 6,200 1st N/A N/A McIntyre Real Estate Services
21 8850 Terabyte Ct South Reno Ind 6,200 1st N/A N/A McIntyre Real Estate Services
22 961 Matley Ln* Airport Ind 5,912 1st Hanger Clinic: Prosthetics & Orthotics N/A Colliers International
23 1259-1275 Spice Islands Dr Sparks Ind 5,750 1st N/A N/A Kidder Mathews
24 8985-8995 Double Diamond Pky South Reno Ind 5,500 1st N/A N/A Gaston & Wilkerson
25 8995 Terabyte Dr South Reno Ind 5,160 1st N/A N/A McIntyre Real Estate Services
26 8995 Terabyte Dr South Reno Ind 5,040 1st N/A N/A The Baker Company
27 8995 Terabyte Dr South Reno Ind 5,040 1st Stanley Steamer Carpet Cleaner N/A McIntyre Real Estate Services
28 8995 Terabyte Dr South Reno Ind 4,920 1st N/A N/A McIntyre Real Estate Services
29 3603-3607 Challenger Way Carson City County Ind 4,500 1st N/A N/A John Uhart Commercial RE
30 801 E Glendale Ave Sparks Ind 4,200 1st N/A N/A Commercial Project Management
31 5595 Equity Ave Airport Ind 4,200 1st N/A N/A SVN/Gold Dust Commercial
32 700-742 Spice Islands Dr Sparks Ind 4,054 1st N/A N/A Kidder Mathews
33 324 Vine St Central Reno Ind 3,728 1st N/A N/A ArchCrest Commercial Partners
34 5301 Longley Ln South Reno Ind 3,543 1st N/A N/A SVN/Gold Dust Commercial
35 860-870 Steneri Way Sparks Ind 3,510 1st The Justin Hope Foundation Chase International,Inc. Metzker Johnson Group
36 5301 Longley Ln South Reno Ind 3,424 1st N/A N/A SVN/Gold Dust Commercial
37 4900 Mill St Airport Ind 3,256 1st N/A N/A Colliers International
38 595 Spice Islands Dr Sparks Ind 3,230 1st N/A N/A Fleming Properties, Inc
39 5250 US Highway 50 E Carson City County Ind 3,000 1st N/A N/A NAI Alliance Carson City
40 155 Glendale Ave Sparks Ind 2,958 1st N/A N/A SVN/Gold Dust Commercial
Select Top Industrial Leases Based on Leased Square Footage For Deals Signed in 2018
10 CoStar Industrial Statistics ©2018 CoStar Group, Inc.
Reno/Sparks � First Quarter 2018
Reno/Sparks Industrial Market
©2018 CoStar Group, Inc. CoStar Industrial Statistics 11
First Quarter 2018 – Reno/Sparks
Reno/Sparks Industrial MarketMARKET HIGHLIGHTS - Flex & Warehouse
A i r p o r t M a r k e t
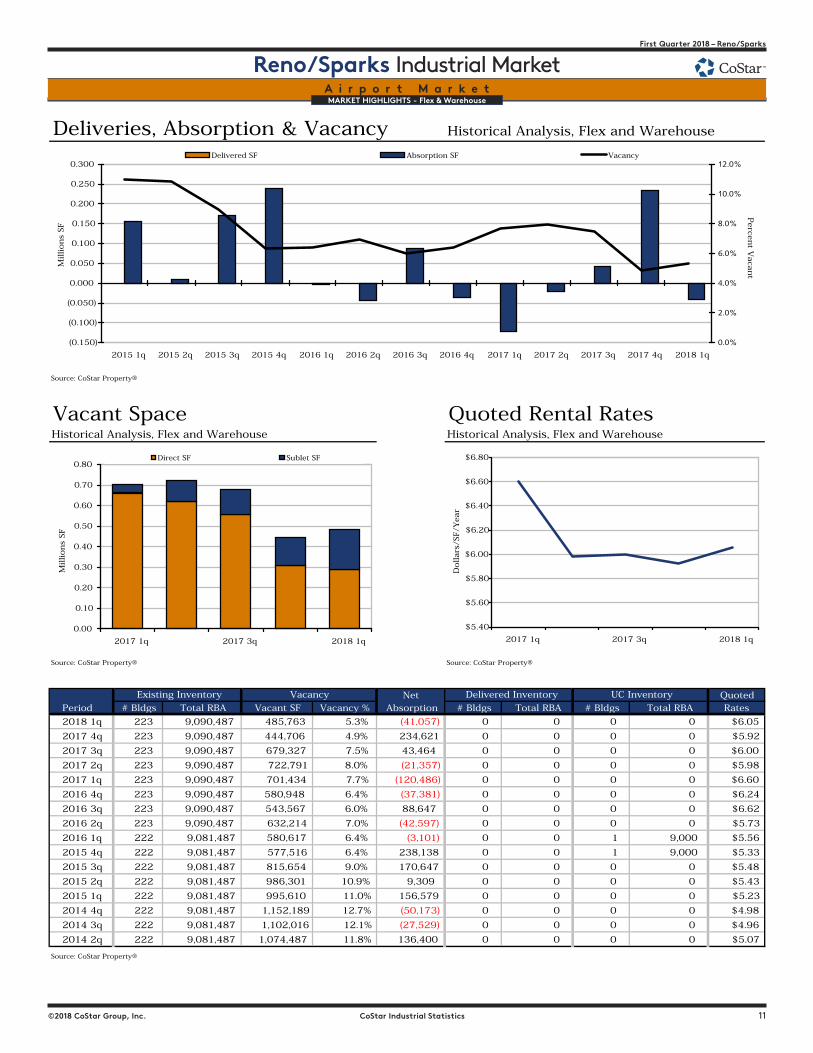
Deliveries, Absorption & Vacancy Historical Analysis, Flex and Warehouse
Source: CoStar Property®
Vacant Space Quoted Rental RatesHistorical Analysis, Flex and Warehouse Historical Analysis, Flex and Warehouse
Source: CoStar Property® Source: CoStar Property®
Net QuotedPeriod # Bldgs Total RBA Vacant SF Vacancy % Absorption # Bldgs Total RBA # Bldgs Total RBA Rates
2018 1q 223 9,090,487 485,763 5.3% (41,057) 0 0 0 0 $6.05
2017 4q 223 9,090,487 444,706 4.9% 234,621 0 0 0 0 $5.92
2017 3q 223 9,090,487 679,327 7.5% 43,464 0 0 0 0 $6.00
2017 2q 223 9,090,487 722,791 8.0% (21,357) 0 0 0 0 $5.98
2017 1q 223 9,090,487 701,434 7.7% (120,486) 0 0 0 0 $6.60
2016 4q 223 9,090,487 580,948 6.4% (37,381) 0 0 0 0 $6.24
2016 3q 223 9,090,487 543,567 6.0% 88,647 0 0 0 0 $6.62
2016 2q 223 9,090,487 632,214 7.0% (42,597) 0 0 0 0 $5.73
2016 1q 222 9,081,487 580,617 6.4% (3,101) 0 0 1 9,000 $5.56
2015 4q 222 9,081,487 577,516 6.4% 238,138 0 0 1 9,000 $5.33
2015 3q 222 9,081,487 815,654 9.0% 170,647 0 0 0 0 $5.48
2015 2q 222 9,081,487 986,301 10.9% 9,309 0 0 0 0 $5.43
2015 1q 222 9,081,487 995,610 11.0% 156,579 0 0 0 0 $5.23
2014 4q 222 9,081,487 1,152,189 12.7% (50,173) 0 0 0 0 $4.98
2014 3q 222 9,081,487 1,102,016 12.1% (27,529) 0 0 0 0 $4.96
2014 2q 222 9,081,487 1,074,487 11.8% 136,400 0 0 0 0 $5.07
Source: CoStar Property®
UC InventoryDelivered InventoryExisting Inventory Vacancy
(0.150)
(0.100)
(0.050)
0.000
0.050
0.100
0.150
0.200
0.250
0.300
2015 1q 2015 2q 2015 3q 2015 4q 2016 1q 2016 2q 2016 3q 2016 4q 2017 1q 2017 2q 2017 3q 2017 4q 2018 1q
Millions
SF
0.0%
2.0%
4.0%
6.0%
8.0%
10.0%
12.0%
Perce
nt V
aca
nt
Delivered SF Absorption SF Vacancy
$5.40
$5.60
$5.80
$6.00
$6.20
$6.40
$6.60
$6.80
2017 1q 2017 3q 2018 1q
Dollars
/SF/Y
ear
0.00
0.10
0.20
0.30
0.40
0.50
0.60
0.70
0.80
2017 1q 2017 3q 2018 1q
Millions
SF
Direct SF Sublet SF
12 CoStar Industrial Statistics ©2018 CoStar Group, Inc.
Reno/Sparks – First Quarter 2018
Reno/Sparks Industrial MarketMARKET HIGHLIGHTS - Flex & Warehouse
©2018 CoStar Group, Inc. CoStar Industrial Statistics 13
First Quarter 2018 – Reno/Sparks
Reno/Sparks Industrial MarketMARKET HIGHLIGHTS - Flex & Warehouse
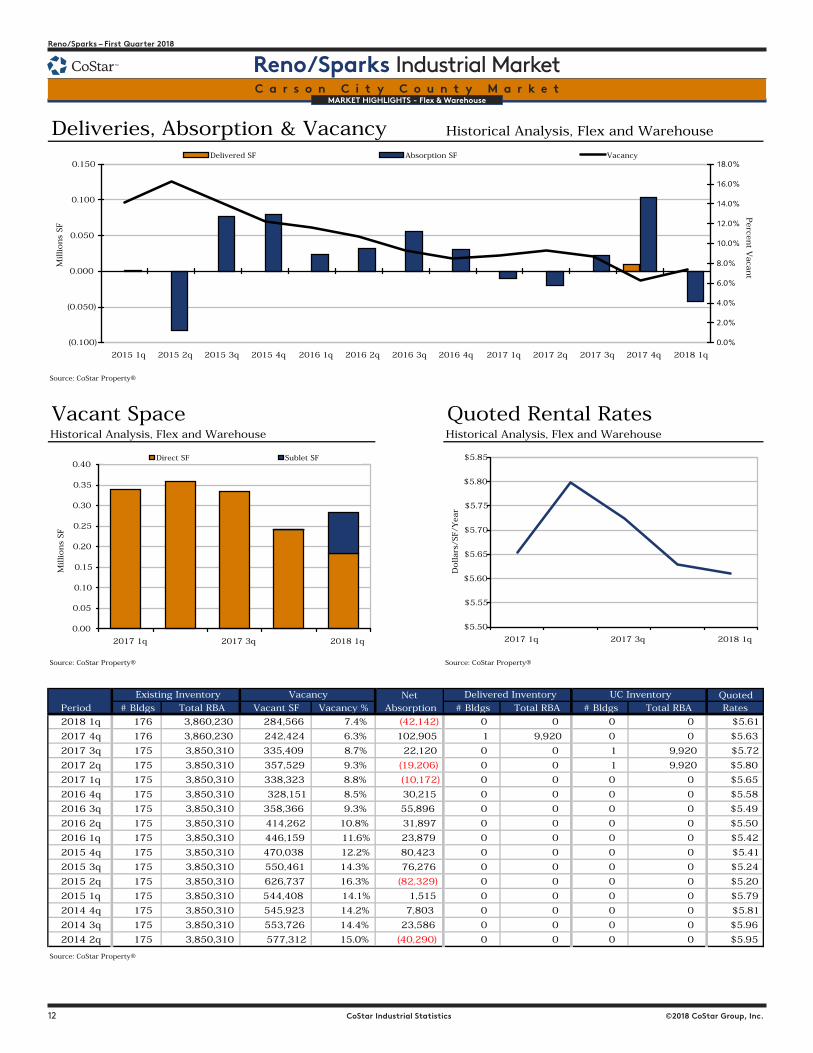
C a r s o n C i t y C o u n t y M a r k e t
Deliveries, Absorption & Vacancy Historical Analysis, Flex and Warehouse
Source: CoStar Property®
Vacant Space Quoted Rental RatesHistorical Analysis, Flex and Warehouse Historical Analysis, Flex and Warehouse
Source: CoStar Property® Source: CoStar Property®
Net QuotedPeriod # Bldgs Total RBA Vacant SF Vacancy % Absorption # Bldgs Total RBA # Bldgs Total RBA Rates
2018 1q 176 3,860,230 284,566 7.4% (42,142) 0 0 0 0 $5.61
2017 4q 176 3,860,230 242,424 6.3% 102,905 1 9,920 0 0 $5.63
2017 3q 175 3,850,310 335,409 8.7% 22,120 0 0 1 9,920 $5.72
2017 2q 175 3,850,310 357,529 9.3% (19,206) 0 0 1 9,920 $5.80
2017 1q 175 3,850,310 338,323 8.8% (10,172) 0 0 0 0 $5.65
2016 4q 175 3,850,310 328,151 8.5% 30,215 0 0 0 0 $5.58
2016 3q 175 3,850,310 358,366 9.3% 55,896 0 0 0 0 $5.49
2016 2q 175 3,850,310 414,262 10.8% 31,897 0 0 0 0 $5.50
2016 1q 175 3,850,310 446,159 11.6% 23,879 0 0 0 0 $5.42
2015 4q 175 3,850,310 470,038 12.2% 80,423 0 0 0 0 $5.41
2015 3q 175 3,850,310 550,461 14.3% 76,276 0 0 0 0 $5.24
2015 2q 175 3,850,310 626,737 16.3% (82,329) 0 0 0 0 $5.20
2015 1q 175 3,850,310 544,408 14.1% 1,515 0 0 0 0 $5.79
2014 4q 175 3,850,310 545,923 14.2% 7,803 0 0 0 0 $5.81
2014 3q 175 3,850,310 553,726 14.4% 23,586 0 0 0 0 $5.96
2014 2q 175 3,850,310 577,312 15.0% (40,290) 0 0 0 0 $5.95
Source: CoStar Property®
UC InventoryDelivered InventoryExisting Inventory Vacancy
(0.100)
(0.050)
0.000
0.050
0.100
0.150
2015 1q 2015 2q 2015 3q 2015 4q 2016 1q 2016 2q 2016 3q 2016 4q 2017 1q 2017 2q 2017 3q 2017 4q 2018 1q
Millions
SF
0.0%
2.0%
4.0%
6.0%
8.0%
10.0%
12.0%
14.0%
16.0%
18.0%
Perce
nt V
aca
nt
Delivered SF Absorption SF Vacancy
$5.50
$5.55
$5.60
$5.65
$5.70
$5.75
$5.80
$5.85
2017 1q 2017 3q 2018 1q
Dollars
/SF/Y
ear
0.00
0.05
0.10
0.15
0.20
0.25
0.30
0.35
0.40
2017 1q 2017 3q 2018 1q
Millions
SF
Direct SF Sublet SF
12 CoStar Industrial Statistics ©2018 CoStar Group, Inc.
Reno/Sparks – First Quarter 2018
Reno/Sparks Industrial MarketMARKET HIGHLIGHTS - Flex & Warehouse
©2018 CoStar Group, Inc. CoStar Industrial Statistics 13
First Quarter 2018 – Reno/Sparks
Reno/Sparks Industrial MarketMARKET HIGHLIGHTS - Flex & Warehouse
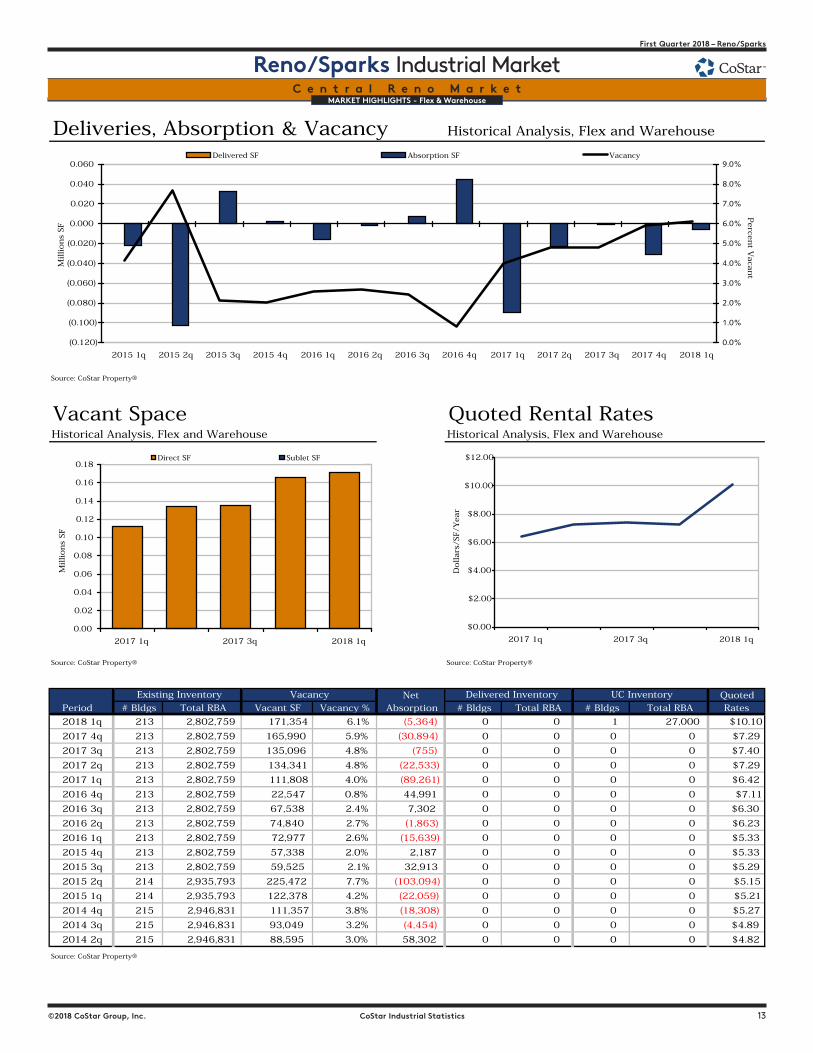
C e n t r a l R e n o M a r k e t
Deliveries, Absorption & Vacancy Historical Analysis, Flex and Warehouse
Source: CoStar Property®
Vacant Space Quoted Rental RatesHistorical Analysis, Flex and Warehouse Historical Analysis, Flex and Warehouse
Source: CoStar Property® Source: CoStar Property®
Net QuotedPeriod # Bldgs Total RBA Vacant SF Vacancy % Absorption # Bldgs Total RBA # Bldgs Total RBA Rates
2018 1q 213 2,802,759 171,354 6.1% (5,364) 0 0 1 27,000 $10.10
2017 4q 213 2,802,759 165,990 5.9% (30,894) 0 0 0 0 $7.29
2017 3q 213 2,802,759 135,096 4.8% (755) 0 0 0 0 $7.40
2017 2q 213 2,802,759 134,341 4.8% (22,533) 0 0 0 0 $7.29
2017 1q 213 2,802,759 111,808 4.0% (89,261) 0 0 0 0 $6.42
2016 4q 213 2,802,759 22,547 0.8% 44,991 0 0 0 0 $7.11
2016 3q 213 2,802,759 67,538 2.4% 7,302 0 0 0 0 $6.30
2016 2q 213 2,802,759 74,840 2.7% (1,863) 0 0 0 0 $6.23
2016 1q 213 2,802,759 72,977 2.6% (15,639) 0 0 0 0 $5.33
2015 4q 213 2,802,759 57,338 2.0% 2,187 0 0 0 0 $5.33
2015 3q 213 2,802,759 59,525 2.1% 32,913 0 0 0 0 $5.29
2015 2q 214 2,935,793 225,472 7.7% (103,094) 0 0 0 0 $5.15
2015 1q 214 2,935,793 122,378 4.2% (22,059) 0 0 0 0 $5.21
2014 4q 215 2,946,831 111,357 3.8% (18,308) 0 0 0 0 $5.27
2014 3q 215 2,946,831 93,049 3.2% (4,454) 0 0 0 0 $4.89
2014 2q 215 2,946,831 88,595 3.0% 58,302 0 0 0 0 $4.82
Source: CoStar Property®
UC InventoryDelivered InventoryExisting Inventory Vacancy
(0.120)
(0.100)
(0.080)
(0.060)
(0.040)
(0.020)
0.000
0.020
0.040
0.060
2015 1q 2015 2q 2015 3q 2015 4q 2016 1q 2016 2q 2016 3q 2016 4q 2017 1q 2017 2q 2017 3q 2017 4q 2018 1q
Millions
SF
0.0%
1.0%
2.0%
3.0%
4.0%
5.0%
6.0%
7.0%
8.0%
9.0%
Perce
nt V
aca
nt
Delivered SF Absorption SF Vacancy
$0.00
$2.00
$4.00
$6.00
$8.00
$10.00
$12.00
2017 1q 2017 3q 2018 1q
Dollars
/SF/Y
ear
0.00
0.02
0.04
0.06
0.08
0.10
0.12
0.14
0.16
0.18
2017 1q 2017 3q 2018 1q
Millions
SF
Direct SF Sublet SF
14 CoStar Industrial Statistics ©2018 CoStar Group, Inc.
Reno/Sparks – First Quarter 2018
Reno/Sparks Industrial MarketMARKET HIGHLIGHTS - Flex & Warehouse
©2018 CoStar Group, Inc. CoStar Industrial Statistics 15
First Quarter 2018 – Reno/Sparks
Reno/Sparks Industrial MarketMARKET HIGHLIGHTS - Flex & Warehouse
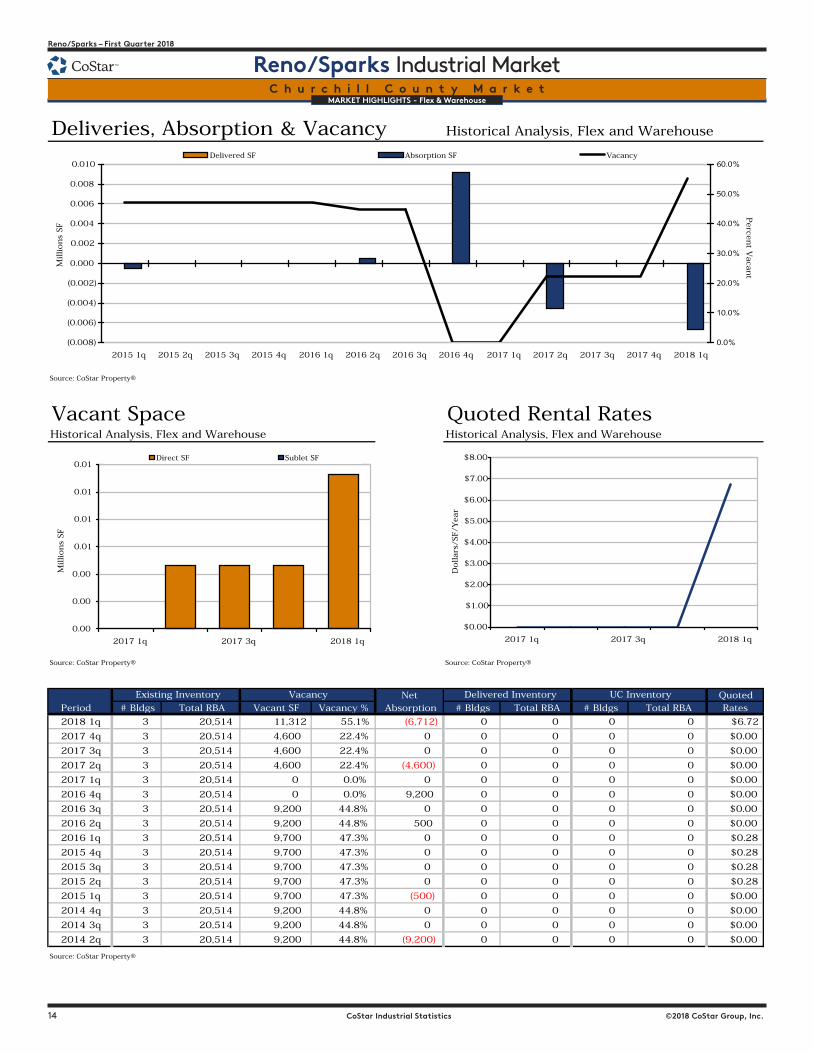
C h u r c h i l l C o u n t y M a r k e t
Deliveries, Absorption & Vacancy Historical Analysis, Flex and Warehouse
Source: CoStar Property®
Vacant Space Quoted Rental RatesHistorical Analysis, Flex and Warehouse Historical Analysis, Flex and Warehouse
Source: CoStar Property® Source: CoStar Property®
Net QuotedPeriod # Bldgs Total RBA Vacant SF Vacancy % Absorption # Bldgs Total RBA # Bldgs Total RBA Rates
2018 1q 3 20,514 11,312 55.1% (6,712) 0 0 0 0 $6.72
2017 4q 3 20,514 4,600 22.4% 0 0 0 0 0 $0.00
2017 3q 3 20,514 4,600 22.4% 0 0 0 0 0 $0.00
2017 2q 3 20,514 4,600 22.4% (4,600) 0 0 0 0 $0.00
2017 1q 3 20,514 0 0.0% 0 0 0 0 0 $0.00
2016 4q 3 20,514 0 0.0% 9,200 0 0 0 0 $0.00
2016 3q 3 20,514 9,200 44.8% 0 0 0 0 0 $0.00
2016 2q 3 20,514 9,200 44.8% 500 0 0 0 0 $0.00
2016 1q 3 20,514 9,700 47.3% 0 0 0 0 0 $0.28
2015 4q 3 20,514 9,700 47.3% 0 0 0 0 0 $0.28
2015 3q 3 20,514 9,700 47.3% 0 0 0 0 0 $0.28
2015 2q 3 20,514 9,700 47.3% 0 0 0 0 0 $0.28
2015 1q 3 20,514 9,700 47.3% (500) 0 0 0 0 $0.00
2014 4q 3 20,514 9,200 44.8% 0 0 0 0 0 $0.00
2014 3q 3 20,514 9,200 44.8% 0 0 0 0 0 $0.00
2014 2q 3 20,514 9,200 44.8% (9,200) 0 0 0 0 $0.00
Source: CoStar Property®
UC InventoryDelivered InventoryExisting Inventory Vacancy
(0.008)
(0.006)
(0.004)
(0.002)
0.000
0.002
0.004
0.006
0.008
0.010
2015 1q 2015 2q 2015 3q 2015 4q 2016 1q 2016 2q 2016 3q 2016 4q 2017 1q 2017 2q 2017 3q 2017 4q 2018 1q
Millions
SF
0.0%
10.0%
20.0%
30.0%
40.0%
50.0%
60.0%
Perce
nt V
aca
nt
Delivered SF Absorption SF Vacancy
$0.00
$1.00
$2.00
$3.00
$4.00
$5.00
$6.00
$7.00
$8.00
2017 1q 2017 3q 2018 1q
Dollars
/SF/Y
ear
0.00
0.00
0.00
0.01
0.01
0.01
0.01
2017 1q 2017 3q 2018 1q
Millions
SF
Direct SF Sublet SF
14 CoStar Industrial Statistics ©2018 CoStar Group, Inc.
Reno/Sparks – First Quarter 2018
Reno/Sparks Industrial MarketMARKET HIGHLIGHTS - Flex & Warehouse
©2018 CoStar Group, Inc. CoStar Industrial Statistics 15
First Quarter 2018 – Reno/Sparks
Reno/Sparks Industrial MarketMARKET HIGHLIGHTS - Flex & Warehouse
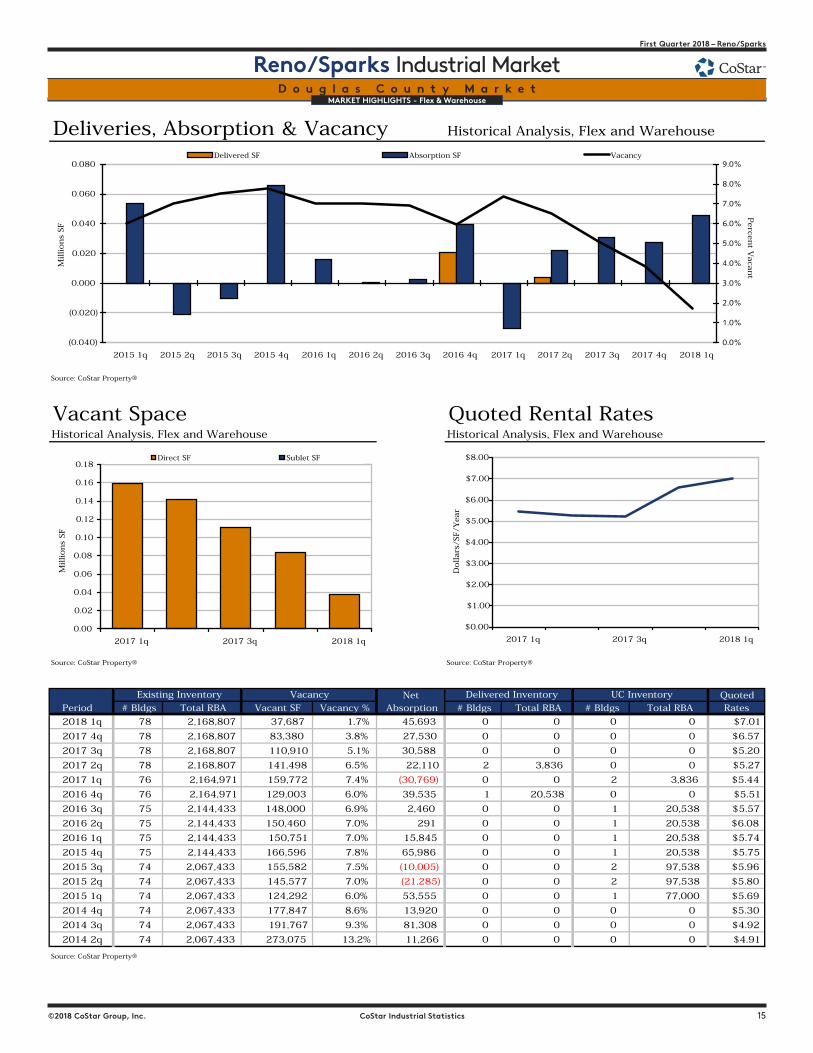
D o u g l a s C o u n t y M a r k e t
Deliveries, Absorption & Vacancy Historical Analysis, Flex and Warehouse
Source: CoStar Property®
Vacant Space Quoted Rental RatesHistorical Analysis, Flex and Warehouse Historical Analysis, Flex and Warehouse
Source: CoStar Property® Source: CoStar Property®
Net QuotedPeriod # Bldgs Total RBA Vacant SF Vacancy % Absorption # Bldgs Total RBA # Bldgs Total RBA Rates
2018 1q 78 2,168,807 37,687 1.7% 45,693 0 0 0 0 $7.01
2017 4q 78 2,168,807 83,380 3.8% 27,530 0 0 0 0 $6.57
2017 3q 78 2,168,807 110,910 5.1% 30,588 0 0 0 0 $5.20
2017 2q 78 2,168,807 141,498 6.5% 22,110 2 3,836 0 0 $5.27
2017 1q 76 2,164,971 159,772 7.4% (30,769) 0 0 2 3,836 $5.44
2016 4q 76 2,164,971 129,003 6.0% 39,535 1 20,538 0 0 $5.51
2016 3q 75 2,144,433 148,000 6.9% 2,460 0 0 1 20,538 $5.57
2016 2q 75 2,144,433 150,460 7.0% 291 0 0 1 20,538 $6.08
2016 1q 75 2,144,433 150,751 7.0% 15,845 0 0 1 20,538 $5.74
2015 4q 75 2,144,433 166,596 7.8% 65,986 0 0 1 20,538 $5.75
2015 3q 74 2,067,433 155,582 7.5% (10,005) 0 0 2 97,538 $5.96
2015 2q 74 2,067,433 145,577 7.0% (21,285) 0 0 2 97,538 $5.80
2015 1q 74 2,067,433 124,292 6.0% 53,555 0 0 1 77,000 $5.69
2014 4q 74 2,067,433 177,847 8.6% 13,920 0 0 0 0 $5.30
2014 3q 74 2,067,433 191,767 9.3% 81,308 0 0 0 0 $4.92
2014 2q 74 2,067,433 273,075 13.2% 11,266 0 0 0 0 $4.91
Source: CoStar Property®
UC InventoryDelivered InventoryExisting Inventory Vacancy
(0.040)
(0.020)
0.000
0.020
0.040
0.060
0.080
2015 1q 2015 2q 2015 3q 2015 4q 2016 1q 2016 2q 2016 3q 2016 4q 2017 1q 2017 2q 2017 3q 2017 4q 2018 1q
Millions
SF
0.0%
1.0%
2.0%
3.0%
4.0%
5.0%
6.0%
7.0%
8.0%
9.0%
Perce
nt V
aca
nt
Delivered SF Absorption SF Vacancy
$0.00
$1.00
$2.00
$3.00
$4.00
$5.00
$6.00
$7.00
$8.00
2017 1q 2017 3q 2018 1q
Dollars
/SF/Y
ear
0.00
0.02
0.04
0.06
0.08
0.10
0.12
0.14
0.16
0.18
2017 1q 2017 3q 2018 1q
Millions
SF
Direct SF Sublet SF
16 CoStar Industrial Statistics ©2018 CoStar Group, Inc.
Reno/Sparks – First Quarter 2018
Reno/Sparks Industrial MarketMARKET HIGHLIGHTS - Flex & Warehouse
©2018 CoStar Group, Inc. CoStar Industrial Statistics 17
First Quarter 2018 – Reno/Sparks
Reno/Sparks Industrial MarketMARKET HIGHLIGHTS - Flex & Warehouse
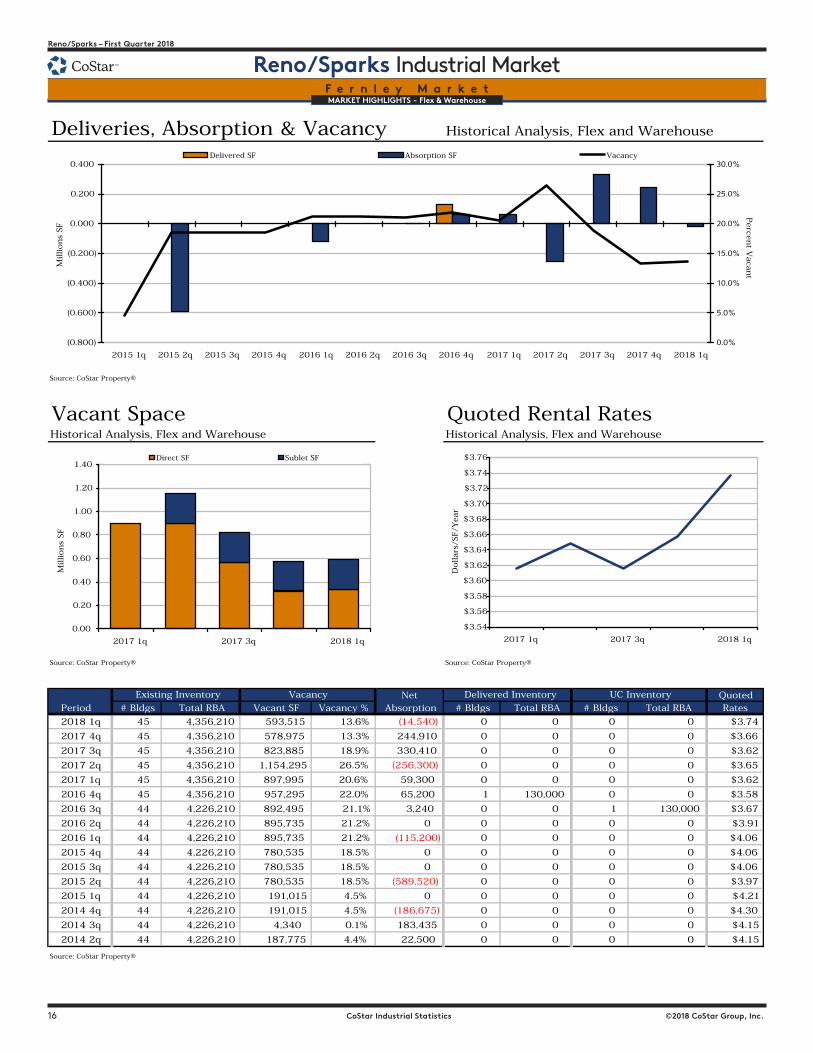
F e r n l e y M a r k e t
Deliveries, Absorption & Vacancy Historical Analysis, Flex and Warehouse
Source: CoStar Property®
Vacant Space Quoted Rental RatesHistorical Analysis, Flex and Warehouse Historical Analysis, Flex and Warehouse
Source: CoStar Property® Source: CoStar Property®
Net QuotedPeriod # Bldgs Total RBA Vacant SF Vacancy % Absorption # Bldgs Total RBA # Bldgs Total RBA Rates
2018 1q 45 4,356,210 593,515 13.6% (14,540) 0 0 0 0 $3.74
2017 4q 45 4,356,210 578,975 13.3% 244,910 0 0 0 0 $3.66
2017 3q 45 4,356,210 823,885 18.9% 330,410 0 0 0 0 $3.62
2017 2q 45 4,356,210 1,154,295 26.5% (256,300) 0 0 0 0 $3.65
2017 1q 45 4,356,210 897,995 20.6% 59,300 0 0 0 0 $3.62
2016 4q 45 4,356,210 957,295 22.0% 65,200 1 130,000 0 0 $3.58
2016 3q 44 4,226,210 892,495 21.1% 3,240 0 0 1 130,000 $3.67
2016 2q 44 4,226,210 895,735 21.2% 0 0 0 0 0 $3.91
2016 1q 44 4,226,210 895,735 21.2% (115,200) 0 0 0 0 $4.06
2015 4q 44 4,226,210 780,535 18.5% 0 0 0 0 0 $4.06
2015 3q 44 4,226,210 780,535 18.5% 0 0 0 0 0 $4.06
2015 2q 44 4,226,210 780,535 18.5% (589,520) 0 0 0 0 $3.97
2015 1q 44 4,226,210 191,015 4.5% 0 0 0 0 0 $4.21
2014 4q 44 4,226,210 191,015 4.5% (186,675) 0 0 0 0 $4.30
2014 3q 44 4,226,210 4,340 0.1% 183,435 0 0 0 0 $4.15
2014 2q 44 4,226,210 187,775 4.4% 22,500 0 0 0 0 $4.15
Source: CoStar Property®
UC InventoryDelivered InventoryExisting Inventory Vacancy
(0.800)
(0.600)
(0.400)
(0.200)
0.000
0.200
0.400
2015 1q 2015 2q 2015 3q 2015 4q 2016 1q 2016 2q 2016 3q 2016 4q 2017 1q 2017 2q 2017 3q 2017 4q 2018 1q
Millions
SF
0.0%
5.0%
10.0%
15.0%
20.0%
25.0%
30.0%
Perce
nt V
aca
nt
Delivered SF Absorption SF Vacancy
$3.54
$3.56
$3.58
$3.60
$3.62
$3.64
$3.66
$3.68
$3.70
$3.72
$3.74
$3.76
2017 1q 2017 3q 2018 1q
Dollars
/SF/Y
ear
0.00
0.20
0.40
0.60
0.80
1.00
1.20
1.40
2017 1q 2017 3q 2018 1q
Millions
SF
Direct SF Sublet SF
16 CoStar Industrial Statistics ©2018 CoStar Group, Inc.
Reno/Sparks – First Quarter 2018
Reno/Sparks Industrial MarketMARKET HIGHLIGHTS - Flex & Warehouse
©2018 CoStar Group, Inc. CoStar Industrial Statistics 17
First Quarter 2018 – Reno/Sparks
Reno/Sparks Industrial MarketMARKET HIGHLIGHTS - Flex & Warehouse
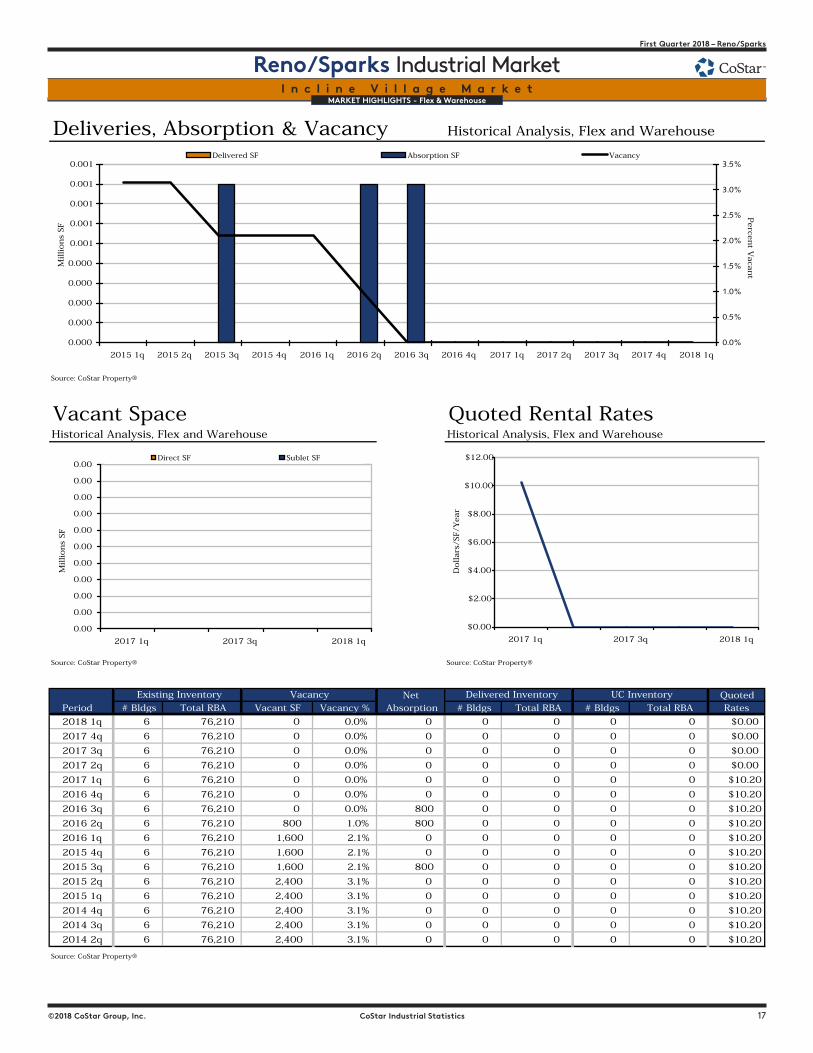
I n c l i n e V i l l a g e M a r k e t
Deliveries, Absorption & Vacancy Historical Analysis, Flex and Warehouse
Source: CoStar Property®
Vacant Space Quoted Rental RatesHistorical Analysis, Flex and Warehouse Historical Analysis, Flex and Warehouse
Source: CoStar Property® Source: CoStar Property®
Net QuotedPeriod # Bldgs Total RBA Vacant SF Vacancy % Absorption # Bldgs Total RBA # Bldgs Total RBA Rates
2018 1q 6 76,210 0 0.0% 0 0 0 0 0 $0.00
2017 4q 6 76,210 0 0.0% 0 0 0 0 0 $0.00
2017 3q 6 76,210 0 0.0% 0 0 0 0 0 $0.00
2017 2q 6 76,210 0 0.0% 0 0 0 0 0 $0.00
2017 1q 6 76,210 0 0.0% 0 0 0 0 0 $10.20
2016 4q 6 76,210 0 0.0% 0 0 0 0 0 $10.20
2016 3q 6 76,210 0 0.0% 800 0 0 0 0 $10.20
2016 2q 6 76,210 800 1.0% 800 0 0 0 0 $10.20
2016 1q 6 76,210 1,600 2.1% 0 0 0 0 0 $10.20
2015 4q 6 76,210 1,600 2.1% 0 0 0 0 0 $10.20
2015 3q 6 76,210 1,600 2.1% 800 0 0 0 0 $10.20
2015 2q 6 76,210 2,400 3.1% 0 0 0 0 0 $10.20
2015 1q 6 76,210 2,400 3.1% 0 0 0 0 0 $10.20
2014 4q 6 76,210 2,400 3.1% 0 0 0 0 0 $10.20
2014 3q 6 76,210 2,400 3.1% 0 0 0 0 0 $10.20
2014 2q 6 76,210 2,400 3.1% 0 0 0 0 0 $10.20
Source: CoStar Property®
UC InventoryDelivered InventoryExisting Inventory Vacancy
0.000
0.000
0.000
0.000
0.000
0.001
0.001
0.001
0.001
0.001
2015 1q 2015 2q 2015 3q 2015 4q 2016 1q 2016 2q 2016 3q 2016 4q 2017 1q 2017 2q 2017 3q 2017 4q 2018 1q
Millions
SF
0.0%
0.5%
1.0%
1.5%
2.0%
2.5%
3.0%
3.5%
Perce
nt V
aca
nt
Delivered SF Absorption SF Vacancy
$0.00
$2.00
$4.00
$6.00
$8.00
$10.00
$12.00
2017 1q 2017 3q 2018 1q
Dollars
/SF/Y
ear
0.00
0.00
0.00
0.00
0.00
0.00
0.00
0.00
0.00
0.00
0.00
2017 1q 2017 3q 2018 1q
Millions
SF
Direct SF Sublet SF
18 CoStar Industrial Statistics ©2018 CoStar Group, Inc.
Reno/Sparks – First Quarter 2018
Reno/Sparks Industrial MarketMARKET HIGHLIGHTS - Flex & Warehouse
©2018 CoStar Group, Inc. CoStar Industrial Statistics 19
First Quarter 2018 – Reno/Sparks
Reno/Sparks Industrial MarketMARKET HIGHLIGHTS - Flex & Warehouse
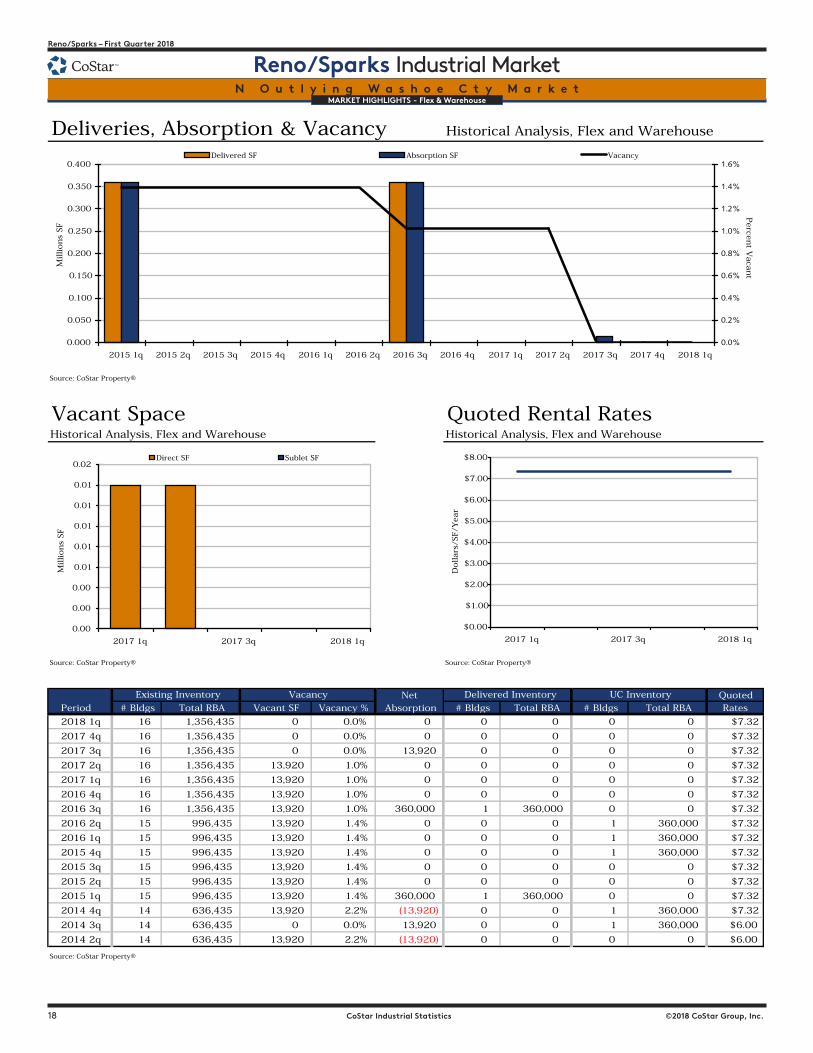
N O u t l y i n g W a s h o e C t y M a r k e t
Deliveries, Absorption & Vacancy Historical Analysis, Flex and Warehouse
Source: CoStar Property®
Vacant Space Quoted Rental RatesHistorical Analysis, Flex and Warehouse Historical Analysis, Flex and Warehouse
Source: CoStar Property® Source: CoStar Property®
Net QuotedPeriod # Bldgs Total RBA Vacant SF Vacancy % Absorption # Bldgs Total RBA # Bldgs Total RBA Rates
2018 1q 16 1,356,435 0 0.0% 0 0 0 0 0 $7.32
2017 4q 16 1,356,435 0 0.0% 0 0 0 0 0 $7.32
2017 3q 16 1,356,435 0 0.0% 13,920 0 0 0 0 $7.32
2017 2q 16 1,356,435 13,920 1.0% 0 0 0 0 0 $7.32
2017 1q 16 1,356,435 13,920 1.0% 0 0 0 0 0 $7.32
2016 4q 16 1,356,435 13,920 1.0% 0 0 0 0 0 $7.32
2016 3q 16 1,356,435 13,920 1.0% 360,000 1 360,000 0 0 $7.32
2016 2q 15 996,435 13,920 1.4% 0 0 0 1 360,000 $7.32
2016 1q 15 996,435 13,920 1.4% 0 0 0 1 360,000 $7.32
2015 4q 15 996,435 13,920 1.4% 0 0 0 1 360,000 $7.32
2015 3q 15 996,435 13,920 1.4% 0 0 0 0 0 $7.32
2015 2q 15 996,435 13,920 1.4% 0 0 0 0 0 $7.32
2015 1q 15 996,435 13,920 1.4% 360,000 1 360,000 0 0 $7.32
2014 4q 14 636,435 13,920 2.2% (13,920) 0 0 1 360,000 $7.32
2014 3q 14 636,435 0 0.0% 13,920 0 0 1 360,000 $6.00
2014 2q 14 636,435 13,920 2.2% (13,920) 0 0 0 0 $6.00
Source: CoStar Property®
UC InventoryDelivered InventoryExisting Inventory Vacancy
0.000
0.050
0.100
0.150
0.200
0.250
0.300
0.350
0.400
2015 1q 2015 2q 2015 3q 2015 4q 2016 1q 2016 2q 2016 3q 2016 4q 2017 1q 2017 2q 2017 3q 2017 4q 2018 1q
Millions
SF
0.0%
0.2%
0.4%
0.6%
0.8%
1.0%
1.2%
1.4%
1.6%
Perce
nt V
aca
nt
Delivered SF Absorption SF Vacancy
$0.00
$1.00
$2.00
$3.00
$4.00
$5.00
$6.00
$7.00
$8.00
2017 1q 2017 3q 2018 1q
Dollars
/SF/Y
ear
0.00
0.00
0.00
0.01
0.01
0.01
0.01
0.01
0.02
2017 1q 2017 3q 2018 1q
Millions
SF
Direct SF Sublet SF
18 CoStar Industrial Statistics ©2018 CoStar Group, Inc.
Reno/Sparks – First Quarter 2018
Reno/Sparks Industrial MarketMARKET HIGHLIGHTS - Flex & Warehouse
©2018 CoStar Group, Inc. CoStar Industrial Statistics 19
First Quarter 2018 – Reno/Sparks
Reno/Sparks Industrial MarketMARKET HIGHLIGHTS - Flex & Warehouse
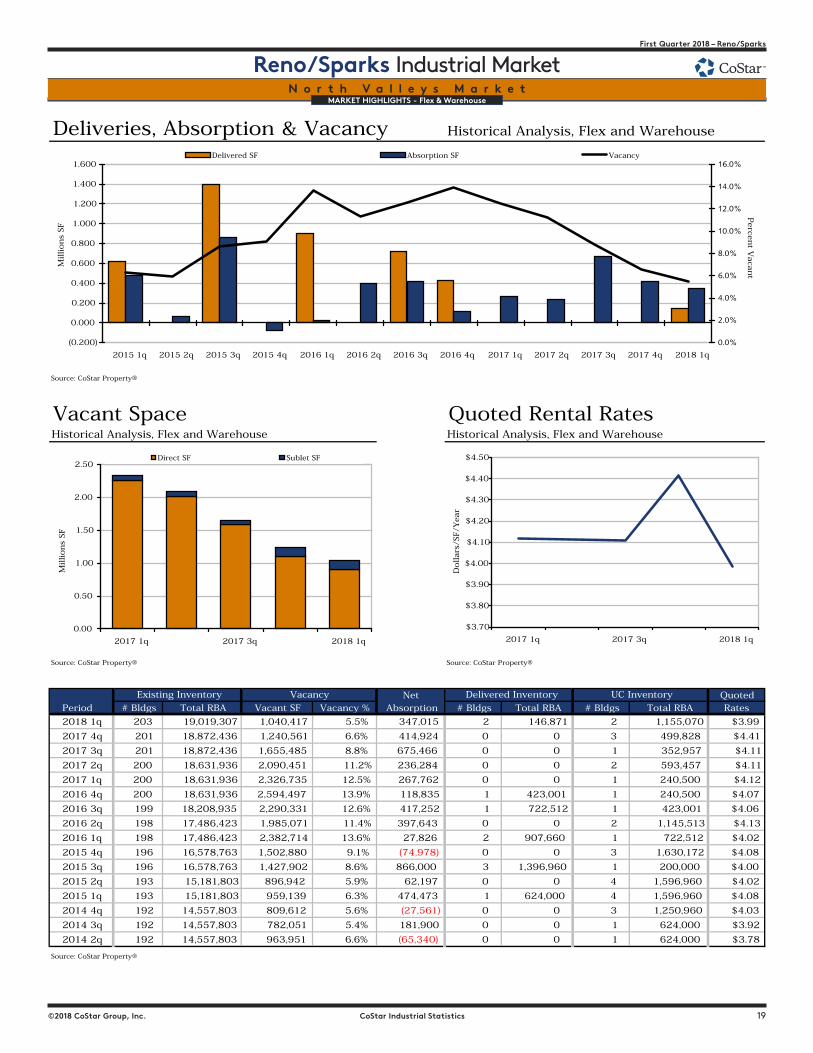
N o r t h V a l l e y s M a r k e t
Deliveries, Absorption & Vacancy Historical Analysis, Flex and Warehouse
Source: CoStar Property®
Vacant Space Quoted Rental RatesHistorical Analysis, Flex and Warehouse Historical Analysis, Flex and Warehouse
Source: CoStar Property® Source: CoStar Property®
Net QuotedPeriod # Bldgs Total RBA Vacant SF Vacancy % Absorption # Bldgs Total RBA # Bldgs Total RBA Rates
2018 1q 203 19,019,307 1,040,417 5.5% 347,015 2 146,871 2 1,155,070 $3.99
2017 4q 201 18,872,436 1,240,561 6.6% 414,924 0 0 3 499,828 $4.41
2017 3q 201 18,872,436 1,655,485 8.8% 675,466 0 0 1 352,957 $4.11
2017 2q 200 18,631,936 2,090,451 11.2% 236,284 0 0 2 593,457 $4.11
2017 1q 200 18,631,936 2,326,735 12.5% 267,762 0 0 1 240,500 $4.12
2016 4q 200 18,631,936 2,594,497 13.9% 118,835 1 423,001 1 240,500 $4.07
2016 3q 199 18,208,935 2,290,331 12.6% 417,252 1 722,512 1 423,001 $4.06
2016 2q 198 17,486,423 1,985,071 11.4% 397,643 0 0 2 1,145,513 $4.13
2016 1q 198 17,486,423 2,382,714 13.6% 27,826 2 907,660 1 722,512 $4.02
2015 4q 196 16,578,763 1,502,880 9.1% (74,978) 0 0 3 1,630,172 $4.08
2015 3q 196 16,578,763 1,427,902 8.6% 866,000 3 1,396,960 1 200,000 $4.00
2015 2q 193 15,181,803 896,942 5.9% 62,197 0 0 4 1,596,960 $4.02
2015 1q 193 15,181,803 959,139 6.3% 474,473 1 624,000 4 1,596,960 $4.08
2014 4q 192 14,557,803 809,612 5.6% (27,561) 0 0 3 1,250,960 $4.03
2014 3q 192 14,557,803 782,051 5.4% 181,900 0 0 1 624,000 $3.92
2014 2q 192 14,557,803 963,951 6.6% (65,340) 0 0 1 624,000 $3.78
Source: CoStar Property®
UC InventoryDelivered InventoryExisting Inventory Vacancy
(0.200)
0.000
0.200
0.400
0.600
0.800
1.000
1.200
1.400
1.600
2015 1q 2015 2q 2015 3q 2015 4q 2016 1q 2016 2q 2016 3q 2016 4q 2017 1q 2017 2q 2017 3q 2017 4q 2018 1q
Millions
SF
0.0%
2.0%
4.0%
6.0%
8.0%
10.0%
12.0%
14.0%
16.0%
Perce
nt V
aca
nt
Delivered SF Absorption SF Vacancy
$3.70
$3.80
$3.90
$4.00
$4.10
$4.20
$4.30
$4.40
$4.50
2017 1q 2017 3q 2018 1q
Dollars
/SF/Y
ear
0.00
0.50
1.00
1.50
2.00
2.50
2017 1q 2017 3q 2018 1q
Millions
SF
Direct SF Sublet SF
20 CoStar Industrial Statistics ©2018 CoStar Group, Inc.
Reno/Sparks – First Quarter 2018
Reno/Sparks Industrial MarketMARKET HIGHLIGHTS - Flex & Warehouse
©2018 CoStar Group, Inc. CoStar Industrial Statistics 21
First Quarter 2018 – Reno/Sparks
Reno/Sparks Industrial MarketMARKET HIGHLIGHTS - Flex & Warehouse
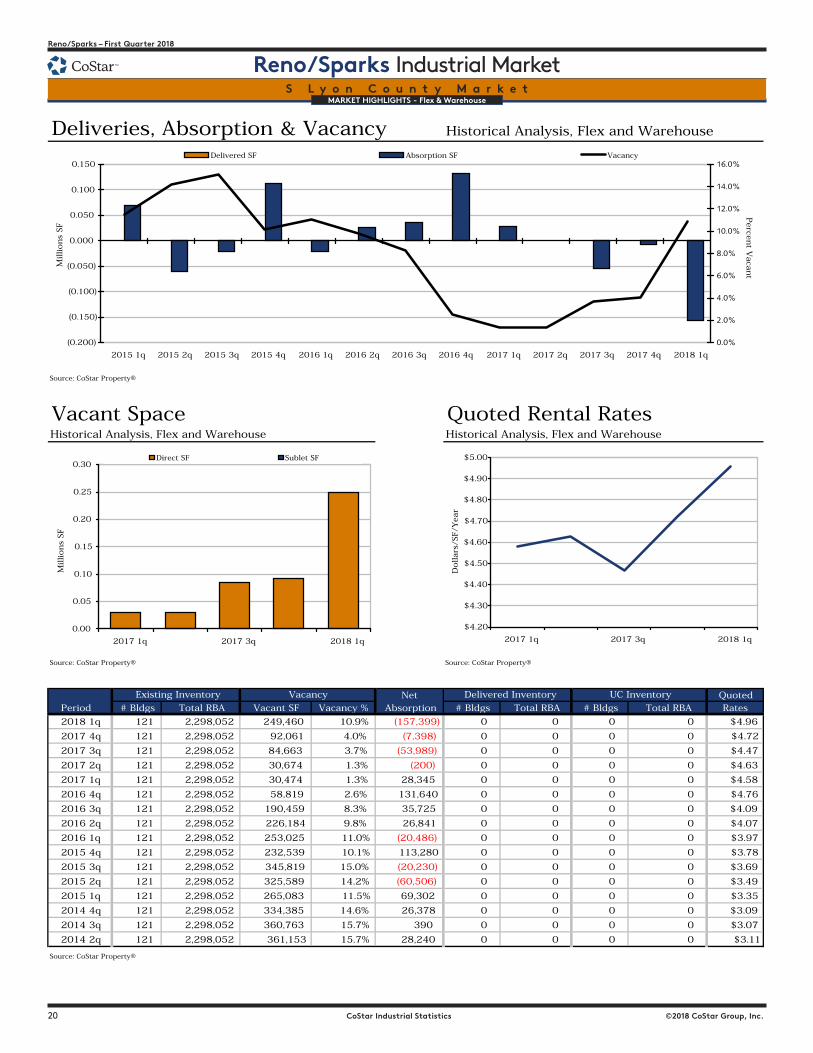
S L y o n C o u n t y M a r k e t
Deliveries, Absorption & Vacancy Historical Analysis, Flex and Warehouse
Source: CoStar Property®
Vacant Space Quoted Rental RatesHistorical Analysis, Flex and Warehouse Historical Analysis, Flex and Warehouse
Source: CoStar Property® Source: CoStar Property®
Net QuotedPeriod # Bldgs Total RBA Vacant SF Vacancy % Absorption # Bldgs Total RBA # Bldgs Total RBA Rates
2018 1q 121 2,298,052 249,460 10.9% (157,399) 0 0 0 0 $4.96
2017 4q 121 2,298,052 92,061 4.0% (7,398) 0 0 0 0 $4.72
2017 3q 121 2,298,052 84,663 3.7% (53,989) 0 0 0 0 $4.47
2017 2q 121 2,298,052 30,674 1.3% (200) 0 0 0 0 $4.63
2017 1q 121 2,298,052 30,474 1.3% 28,345 0 0 0 0 $4.58
2016 4q 121 2,298,052 58,819 2.6% 131,640 0 0 0 0 $4.76
2016 3q 121 2,298,052 190,459 8.3% 35,725 0 0 0 0 $4.09
2016 2q 121 2,298,052 226,184 9.8% 26,841 0 0 0 0 $4.07
2016 1q 121 2,298,052 253,025 11.0% (20,486) 0 0 0 0 $3.97
2015 4q 121 2,298,052 232,539 10.1% 113,280 0 0 0 0 $3.78
2015 3q 121 2,298,052 345,819 15.0% (20,230) 0 0 0 0 $3.69
2015 2q 121 2,298,052 325,589 14.2% (60,506) 0 0 0 0 $3.49
2015 1q 121 2,298,052 265,083 11.5% 69,302 0 0 0 0 $3.35
2014 4q 121 2,298,052 334,385 14.6% 26,378 0 0 0 0 $3.09
2014 3q 121 2,298,052 360,763 15.7% 390 0 0 0 0 $3.07
2014 2q 121 2,298,052 361,153 15.7% 28,240 0 0 0 0 $3.11
Source: CoStar Property®
UC InventoryDelivered InventoryExisting Inventory Vacancy
(0.200)
(0.150)
(0.100)
(0.050)
0.000
0.050
0.100
0.150
2015 1q 2015 2q 2015 3q 2015 4q 2016 1q 2016 2q 2016 3q 2016 4q 2017 1q 2017 2q 2017 3q 2017 4q 2018 1q
Millions
SF
0.0%
2.0%
4.0%
6.0%
8.0%
10.0%
12.0%
14.0%
16.0%
Perce
nt V
aca
nt
Delivered SF Absorption SF Vacancy
$4.20
$4.30
$4.40
$4.50
$4.60
$4.70
$4.80
$4.90
$5.00
2017 1q 2017 3q 2018 1q
Dollars
/SF/Y
ear
0.00
0.05
0.10
0.15
0.20
0.25
0.30
2017 1q 2017 3q 2018 1q
Millions
SF
Direct SF Sublet SF
20 CoStar Industrial Statistics ©2018 CoStar Group, Inc.
Reno/Sparks – First Quarter 2018
Reno/Sparks Industrial MarketMARKET HIGHLIGHTS - Flex & Warehouse
©2018 CoStar Group, Inc. CoStar Industrial Statistics 21
First Quarter 2018 – Reno/Sparks
Reno/Sparks Industrial MarketMARKET HIGHLIGHTS - Flex & Warehouse
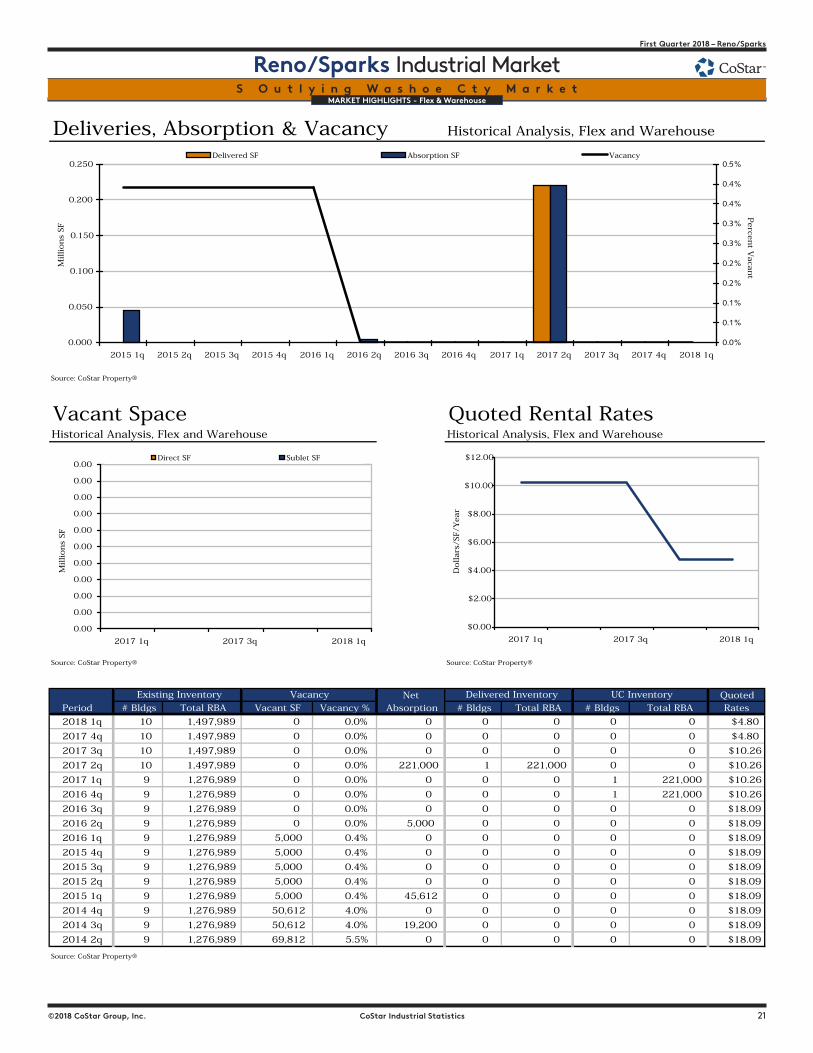
S O u t l y i n g W a s h o e C t y M a r k e t
Deliveries, Absorption & Vacancy Historical Analysis, Flex and Warehouse
Source: CoStar Property®
Vacant Space Quoted Rental RatesHistorical Analysis, Flex and Warehouse Historical Analysis, Flex and Warehouse
Source: CoStar Property® Source: CoStar Property®
Net QuotedPeriod # Bldgs Total RBA Vacant SF Vacancy % Absorption # Bldgs Total RBA # Bldgs Total RBA Rates
2018 1q 10 1,497,989 0 0.0% 0 0 0 0 0 $4.80
2017 4q 10 1,497,989 0 0.0% 0 0 0 0 0 $4.80
2017 3q 10 1,497,989 0 0.0% 0 0 0 0 0 $10.26
2017 2q 10 1,497,989 0 0.0% 221,000 1 221,000 0 0 $10.26
2017 1q 9 1,276,989 0 0.0% 0 0 0 1 221,000 $10.26
2016 4q 9 1,276,989 0 0.0% 0 0 0 1 221,000 $10.26
2016 3q 9 1,276,989 0 0.0% 0 0 0 0 0 $18.09
2016 2q 9 1,276,989 0 0.0% 5,000 0 0 0 0 $18.09
2016 1q 9 1,276,989 5,000 0.4% 0 0 0 0 0 $18.09
2015 4q 9 1,276,989 5,000 0.4% 0 0 0 0 0 $18.09
2015 3q 9 1,276,989 5,000 0.4% 0 0 0 0 0 $18.09
2015 2q 9 1,276,989 5,000 0.4% 0 0 0 0 0 $18.09
2015 1q 9 1,276,989 5,000 0.4% 45,612 0 0 0 0 $18.09
2014 4q 9 1,276,989 50,612 4.0% 0 0 0 0 0 $18.09
2014 3q 9 1,276,989 50,612 4.0% 19,200 0 0 0 0 $18.09
2014 2q 9 1,276,989 69,812 5.5% 0 0 0 0 0 $18.09
Source: CoStar Property®
UC InventoryDelivered InventoryExisting Inventory Vacancy
0.000
0.050
0.100
0.150
0.200
0.250
2015 1q 2015 2q 2015 3q 2015 4q 2016 1q 2016 2q 2016 3q 2016 4q 2017 1q 2017 2q 2017 3q 2017 4q 2018 1q
Millions
SF
0.0%
0.1%
0.1%
0.2%
0.2%
0.3%
0.3%
0.4%
0.4%
0.5%
Perce
nt V
aca
nt
Delivered SF Absorption SF Vacancy
$0.00
$2.00
$4.00
$6.00
$8.00
$10.00
$12.00
2017 1q 2017 3q 2018 1q
Dollars
/SF/Y
ear
0.00
0.00
0.00
0.00
0.00
0.00
0.00
0.00
0.00
0.00
0.00
2017 1q 2017 3q 2018 1q
Millions
SF
Direct SF Sublet SF
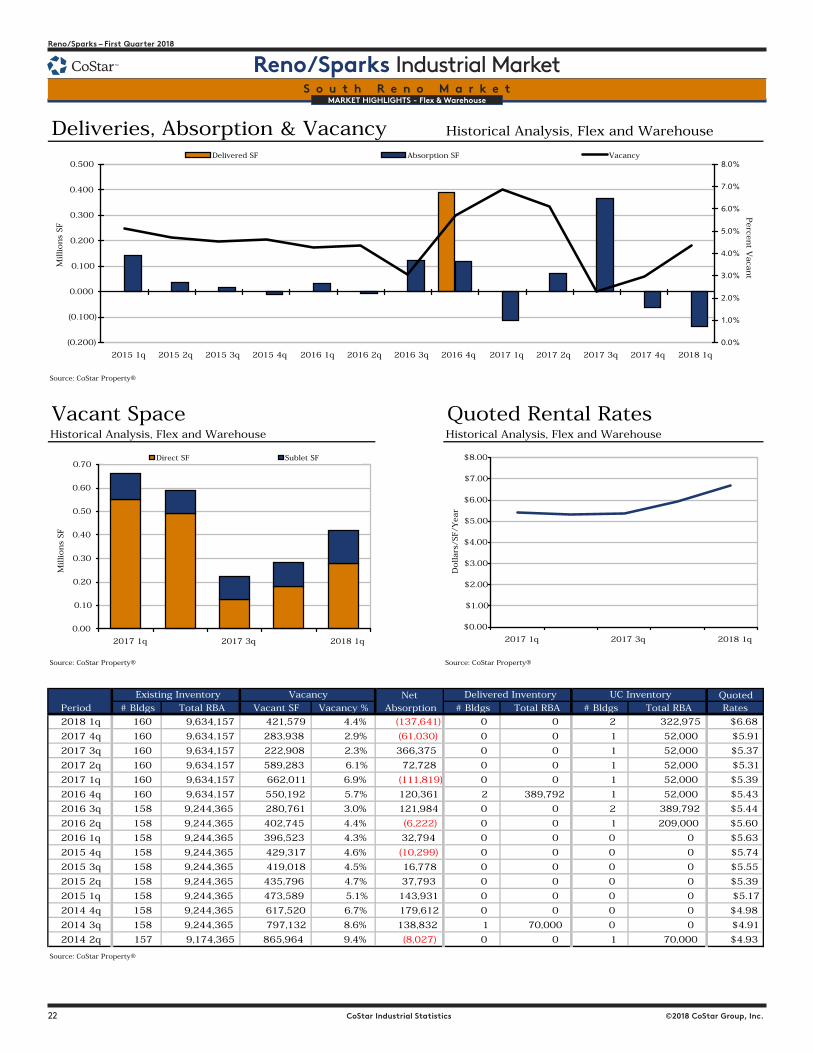
22 CoStar Industrial Statistics ©2018 CoStar Group, Inc.
Reno/Sparks – First Quarter 2018
Reno/Sparks Industrial MarketMARKET HIGHLIGHTS - Flex & Warehouse
©2018 CoStar Group, Inc. CoStar Industrial Statistics 23
First Quarter 2018 – Reno/Sparks
Reno/Sparks Industrial MarketMARKET HIGHLIGHTS - Flex & Warehouse
S o u t h R e n o M a r k e t
Deliveries, Absorption & Vacancy Historical Analysis, Flex and Warehouse
Source: CoStar Property®
Vacant Space Quoted Rental RatesHistorical Analysis, Flex and Warehouse Historical Analysis, Flex and Warehouse
Source: CoStar Property® Source: CoStar Property®
Net QuotedPeriod # Bldgs Total RBA Vacant SF Vacancy % Absorption # Bldgs Total RBA # Bldgs Total RBA Rates
2018 1q 160 9,634,157 421,579 4.4% (137,641) 0 0 2 322,975 $6.68
2017 4q 160 9,634,157 283,938 2.9% (61,030) 0 0 1 52,000 $5.91
2017 3q 160 9,634,157 222,908 2.3% 366,375 0 0 1 52,000 $5.37
2017 2q 160 9,634,157 589,283 6.1% 72,728 0 0 1 52,000 $5.31
2017 1q 160 9,634,157 662,011 6.9% (111,819) 0 0 1 52,000 $5.39
2016 4q 160 9,634,157 550,192 5.7% 120,361 2 389,792 1 52,000 $5.43
2016 3q 158 9,244,365 280,761 3.0% 121,984 0 0 2 389,792 $5.44
2016 2q 158 9,244,365 402,745 4.4% (6,222) 0 0 1 209,000 $5.60
2016 1q 158 9,244,365 396,523 4.3% 32,794 0 0 0 0 $5.63
2015 4q 158 9,244,365 429,317 4.6% (10,299) 0 0 0 0 $5.74
2015 3q 158 9,244,365 419,018 4.5% 16,778 0 0 0 0 $5.55
2015 2q 158 9,244,365 435,796 4.7% 37,793 0 0 0 0 $5.39
2015 1q 158 9,244,365 473,589 5.1% 143,931 0 0 0 0 $5.17
2014 4q 158 9,244,365 617,520 6.7% 179,612 0 0 0 0 $4.98
2014 3q 158 9,244,365 797,132 8.6% 138,832 1 70,000 0 0 $4.91
2014 2q 157 9,174,365 865,964 9.4% (8,027) 0 0 1 70,000 $4.93
Source: CoStar Property®
UC InventoryDelivered InventoryExisting Inventory Vacancy
(0.200)
(0.100)
0.000
0.100
0.200
0.300
0.400
0.500
2015 1q 2015 2q 2015 3q 2015 4q 2016 1q 2016 2q 2016 3q 2016 4q 2017 1q 2017 2q 2017 3q 2017 4q 2018 1q
Millions
SF
0.0%
1.0%
2.0%
3.0%
4.0%
5.0%
6.0%
7.0%
8.0%
Perce
nt V
aca
nt
Delivered SF Absorption SF Vacancy
$0.00
$1.00
$2.00
$3.00
$4.00
$5.00
$6.00
$7.00
$8.00
2017 1q 2017 3q 2018 1q
Dollars
/SF/Y
ear
0.00
0.10
0.20
0.30
0.40
0.50
0.60
0.70
2017 1q 2017 3q 2018 1q
Millions
SF
Direct SF Sublet SF
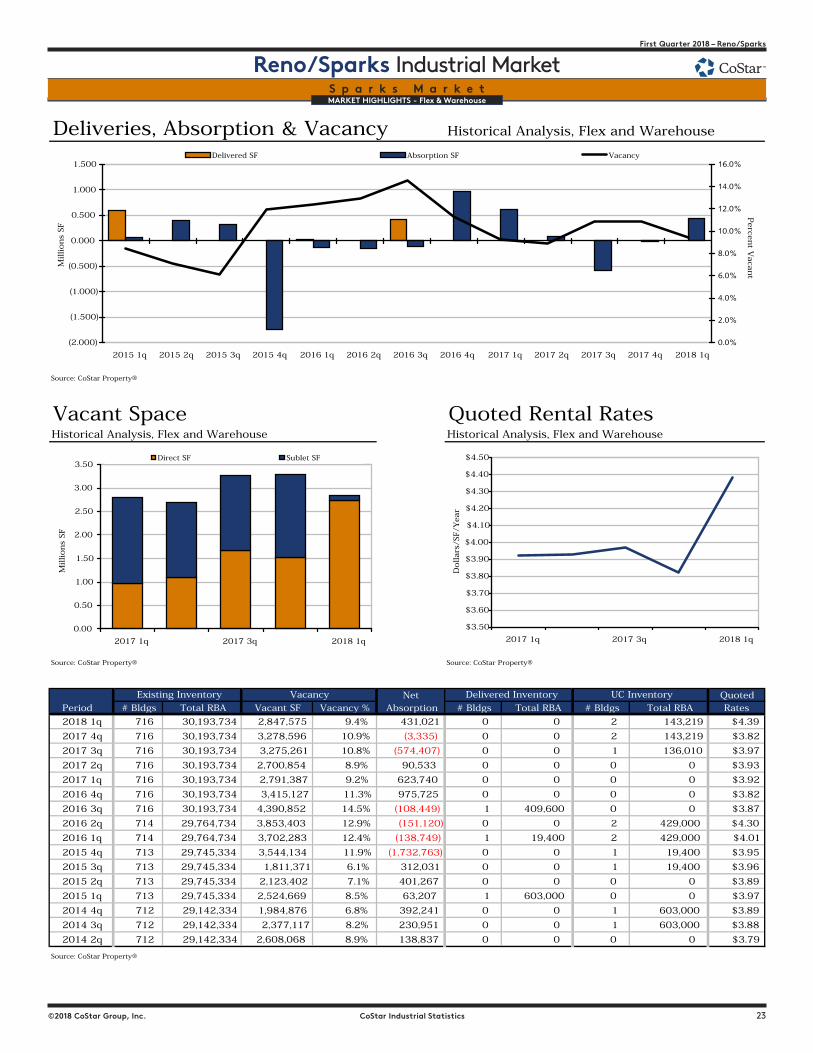
22 CoStar Industrial Statistics ©2018 CoStar Group, Inc.
Reno/Sparks – First Quarter 2018
Reno/Sparks Industrial MarketMARKET HIGHLIGHTS - Flex & Warehouse
©2018 CoStar Group, Inc. CoStar Industrial Statistics 23
First Quarter 2018 – Reno/Sparks
Reno/Sparks Industrial MarketMARKET HIGHLIGHTS - Flex & WarehouseS p a r k s M a r k e t
Deliveries, Absorption & Vacancy Historical Analysis, Flex and Warehouse
Source: CoStar Property®
Vacant Space Quoted Rental RatesHistorical Analysis, Flex and Warehouse Historical Analysis, Flex and Warehouse
Source: CoStar Property® Source: CoStar Property®
Net QuotedPeriod # Bldgs Total RBA Vacant SF Vacancy % Absorption # Bldgs Total RBA # Bldgs Total RBA Rates
2018 1q 716 30,193,734 2,847,575 9.4% 431,021 0 0 2 143,219 $4.39
2017 4q 716 30,193,734 3,278,596 10.9% (3,335) 0 0 2 143,219 $3.82
2017 3q 716 30,193,734 3,275,261 10.8% (574,407) 0 0 1 136,010 $3.97
2017 2q 716 30,193,734 2,700,854 8.9% 90,533 0 0 0 0 $3.93
2017 1q 716 30,193,734 2,791,387 9.2% 623,740 0 0 0 0 $3.92
2016 4q 716 30,193,734 3,415,127 11.3% 975,725 0 0 0 0 $3.82
2016 3q 716 30,193,734 4,390,852 14.5% (108,449) 1 409,600 0 0 $3.87
2016 2q 714 29,764,734 3,853,403 12.9% (151,120) 0 0 2 429,000 $4.30
2016 1q 714 29,764,734 3,702,283 12.4% (138,749) 1 19,400 2 429,000 $4.01
2015 4q 713 29,745,334 3,544,134 11.9% (1,732,763) 0 0 1 19,400 $3.95
2015 3q 713 29,745,334 1,811,371 6.1% 312,031 0 0 1 19,400 $3.96
2015 2q 713 29,745,334 2,123,402 7.1% 401,267 0 0 0 0 $3.89
2015 1q 713 29,745,334 2,524,669 8.5% 63,207 1 603,000 0 0 $3.97
2014 4q 712 29,142,334 1,984,876 6.8% 392,241 0 0 1 603,000 $3.89
2014 3q 712 29,142,334 2,377,117 8.2% 230,951 0 0 1 603,000 $3.88
2014 2q 712 29,142,334 2,608,068 8.9% 138,837 0 0 0 0 $3.79
Source: CoStar Property®
UC InventoryDelivered InventoryExisting Inventory Vacancy
(2.000)
(1.500)
(1.000)
(0.500)
0.000
0.500
1.000
1.500
2015 1q 2015 2q 2015 3q 2015 4q 2016 1q 2016 2q 2016 3q 2016 4q 2017 1q 2017 2q 2017 3q 2017 4q 2018 1q
Millions
SF
0.0%
2.0%
4.0%
6.0%
8.0%
10.0%
12.0%
14.0%
16.0%
Perce
nt V
aca
nt
Delivered SF Absorption SF Vacancy
$3.50
$3.60
$3.70
$3.80
$3.90
$4.00
$4.10
$4.20
$4.30
$4.40
$4.50
2017 1q 2017 3q 2018 1q
Dollars
/SF/Y
ear
0.00
0.50
1.00
1.50
2.00
2.50
3.00
3.50
2017 1q 2017 3q 2018 1q
Millions
SF
Direct SF Sublet SF
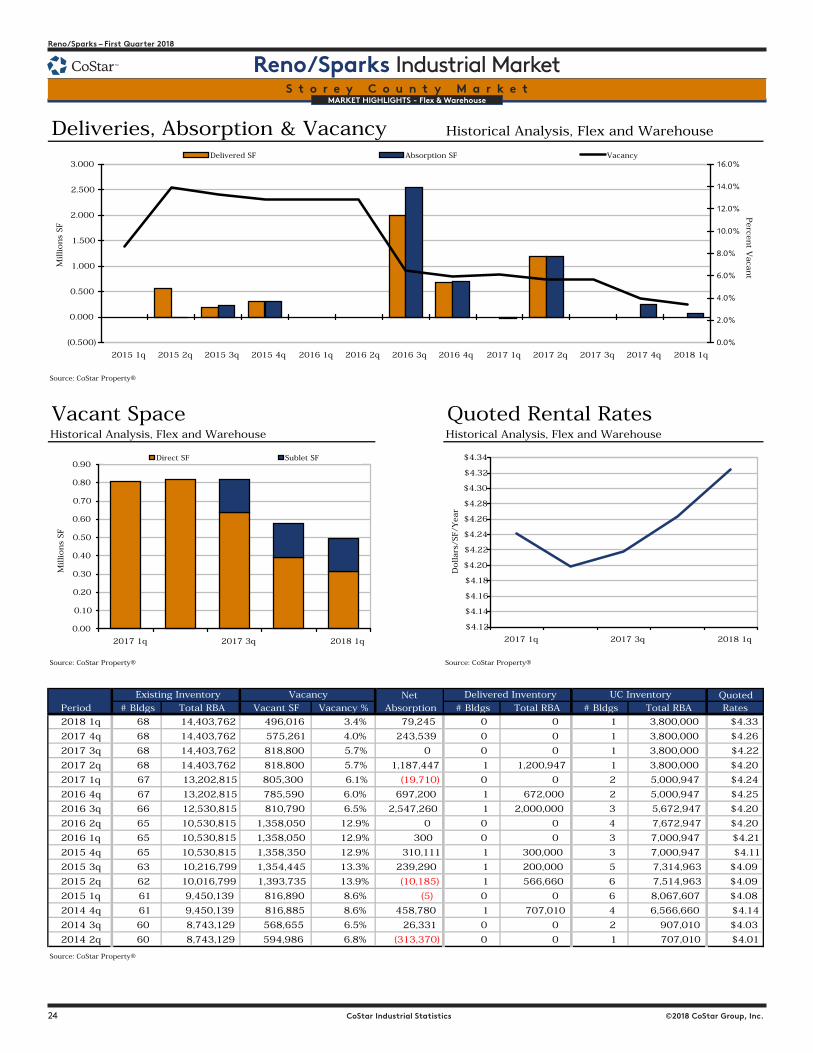
24 CoStar Industrial Statistics ©2018 CoStar Group, Inc.
Reno/Sparks – First Quarter 2018
Reno/Sparks Industrial MarketMARKET HIGHLIGHTS - Flex & Warehouse
©2018 CoStar Group, Inc. CoStar Industrial Statistics 25
First Quarter 2018 – Reno/Sparks
Reno/Sparks Industrial MarketMARKET HIGHLIGHTS - Flex & Warehouse
S t o r e y C o u n t y M a r k e t
Deliveries, Absorption & Vacancy Historical Analysis, Flex and Warehouse
Source: CoStar Property®
Vacant Space Quoted Rental RatesHistorical Analysis, Flex and Warehouse Historical Analysis, Flex and Warehouse
Source: CoStar Property® Source: CoStar Property®
Net QuotedPeriod # Bldgs Total RBA Vacant SF Vacancy % Absorption # Bldgs Total RBA # Bldgs Total RBA Rates
2018 1q 68 14,403,762 496,016 3.4% 79,245 0 0 1 3,800,000 $4.33
2017 4q 68 14,403,762 575,261 4.0% 243,539 0 0 1 3,800,000 $4.26
2017 3q 68 14,403,762 818,800 5.7% 0 0 0 1 3,800,000 $4.22
2017 2q 68 14,403,762 818,800 5.7% 1,187,447 1 1,200,947 1 3,800,000 $4.20
2017 1q 67 13,202,815 805,300 6.1% (19,710) 0 0 2 5,000,947 $4.24
2016 4q 67 13,202,815 785,590 6.0% 697,200 1 672,000 2 5,000,947 $4.25
2016 3q 66 12,530,815 810,790 6.5% 2,547,260 1 2,000,000 3 5,672,947 $4.20
2016 2q 65 10,530,815 1,358,050 12.9% 0 0 0 4 7,672,947 $4.20
2016 1q 65 10,530,815 1,358,050 12.9% 300 0 0 3 7,000,947 $4.21
2015 4q 65 10,530,815 1,358,350 12.9% 310,111 1 300,000 3 7,000,947 $4.11
2015 3q 63 10,216,799 1,354,445 13.3% 239,290 1 200,000 5 7,314,963 $4.09
2015 2q 62 10,016,799 1,393,735 13.9% (10,185) 1 566,660 6 7,514,963 $4.09
2015 1q 61 9,450,139 816,890 8.6% (5) 0 0 6 8,067,607 $4.08
2014 4q 61 9,450,139 816,885 8.6% 458,780 1 707,010 4 6,566,660 $4.14
2014 3q 60 8,743,129 568,655 6.5% 26,331 0 0 2 907,010 $4.03
2014 2q 60 8,743,129 594,986 6.8% (313,370) 0 0 1 707,010 $4.01
Source: CoStar Property®
UC InventoryDelivered InventoryExisting Inventory Vacancy
(0.500)
0.000
0.500
1.000
1.500
2.000
2.500
3.000
2015 1q 2015 2q 2015 3q 2015 4q 2016 1q 2016 2q 2016 3q 2016 4q 2017 1q 2017 2q 2017 3q 2017 4q 2018 1q
Millions
SF
0.0%
2.0%
4.0%
6.0%
8.0%
10.0%
12.0%
14.0%
16.0%
Perce
nt V
aca
nt
Delivered SF Absorption SF Vacancy
$4.12
$4.14
$4.16
$4.18
$4.20
$4.22
$4.24
$4.26
$4.28
$4.30
$4.32
$4.34
2017 1q 2017 3q 2018 1q
Dollars
/SF/Y
ear
0.00
0.10
0.20
0.30
0.40
0.50
0.60
0.70
0.80
0.90
2017 1q 2017 3q 2018 1q
Millions
SF
Direct SF Sublet SF
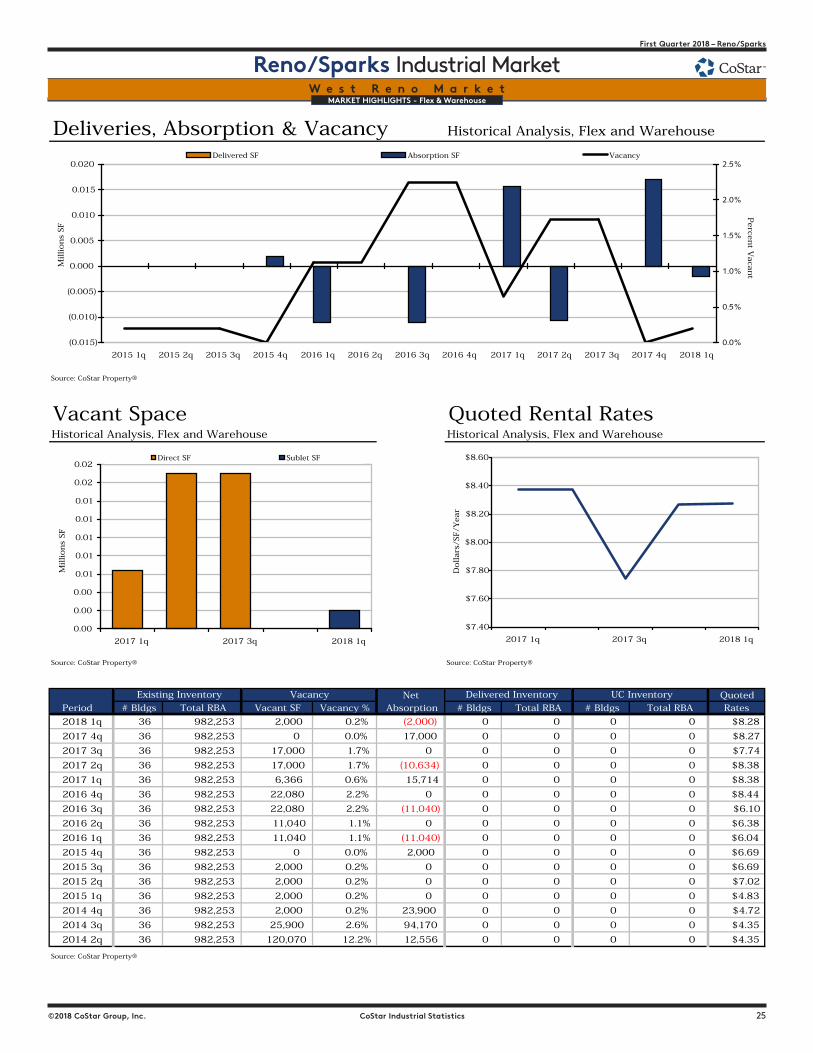
24 CoStar Industrial Statistics ©2018 CoStar Group, Inc.
Reno/Sparks – First Quarter 2018
Reno/Sparks Industrial MarketMARKET HIGHLIGHTS - Flex & Warehouse
©2018 CoStar Group, Inc. CoStar Industrial Statistics 25
First Quarter 2018 – Reno/Sparks
Reno/Sparks Industrial MarketMARKET HIGHLIGHTS - Flex & Warehouse
W e s t R e n o M a r k e t
Deliveries, Absorption & Vacancy Historical Analysis, Flex and Warehouse
Source: CoStar Property®
Vacant Space Quoted Rental RatesHistorical Analysis, Flex and Warehouse Historical Analysis, Flex and Warehouse
Source: CoStar Property® Source: CoStar Property®
Net QuotedPeriod # Bldgs Total RBA Vacant SF Vacancy % Absorption # Bldgs Total RBA # Bldgs Total RBA Rates
2018 1q 36 982,253 2,000 0.2% (2,000) 0 0 0 0 $8.28
2017 4q 36 982,253 0 0.0% 17,000 0 0 0 0 $8.27
2017 3q 36 982,253 17,000 1.7% 0 0 0 0 0 $7.74
2017 2q 36 982,253 17,000 1.7% (10,634) 0 0 0 0 $8.38
2017 1q 36 982,253 6,366 0.6% 15,714 0 0 0 0 $8.38
2016 4q 36 982,253 22,080 2.2% 0 0 0 0 0 $8.44
2016 3q 36 982,253 22,080 2.2% (11,040) 0 0 0 0 $6.10
2016 2q 36 982,253 11,040 1.1% 0 0 0 0 0 $6.38
2016 1q 36 982,253 11,040 1.1% (11,040) 0 0 0 0 $6.04
2015 4q 36 982,253 0 0.0% 2,000 0 0 0 0 $6.69
2015 3q 36 982,253 2,000 0.2% 0 0 0 0 0 $6.69
2015 2q 36 982,253 2,000 0.2% 0 0 0 0 0 $7.02
2015 1q 36 982,253 2,000 0.2% 0 0 0 0 0 $4.83
2014 4q 36 982,253 2,000 0.2% 23,900 0 0 0 0 $4.72
2014 3q 36 982,253 25,900 2.6% 94,170 0 0 0 0 $4.35
2014 2q 36 982,253 120,070 12.2% 12,556 0 0 0 0 $4.35
Source: CoStar Property®
UC InventoryDelivered InventoryExisting Inventory Vacancy
(0.015)
(0.010)
(0.005)
0.000
0.005
0.010
0.015
0.020
2015 1q 2015 2q 2015 3q 2015 4q 2016 1q 2016 2q 2016 3q 2016 4q 2017 1q 2017 2q 2017 3q 2017 4q 2018 1q
Millions
SF
0.0%
0.5%
1.0%
1.5%
2.0%
2.5%
Perce
nt V
aca
nt
Delivered SF Absorption SF Vacancy
$7.40
$7.60
$7.80
$8.00
$8.20
$8.40
$8.60
2017 1q 2017 3q 2018 1q
Dollars
/SF/Y
ear
0.00
0.00
0.00
0.01
0.01
0.01
0.01
0.01
0.02
0.02
2017 1q 2017 3q 2018 1q
Millions
SF
Direct SF Sublet SF